


Please enter the answer below before you can view the full text.


2025
Volume: 45 Issue 7
8 Article(s)

Linshan Chen, Yining Zhao, Meng Wang, Shuaiming Chen, Lingxin Kong, Chong Wang, Cheng Ren, and Dezhong Cao
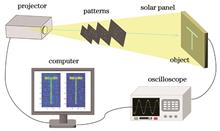
ObjectiveBucket detectors, commonly used in ghost imaging systems, include charge coupled devices (CCDs), complementary metal oxide semiconductor (CMOS) sensors, silicon photocells, single-photon detectors, and perovskite detectors. However, these detectors often come with high costs, limiting the widespread application of ghost imaging. Therefore, it is important to explore low-cost detectors to make ghost imaging more accessible. In this paper, we propose using silicon solar panels as bucket detectors in ghost imaging systems and investigate the performance of image reconstruction in this low-cost configuration. Silicon solar panels offer advantages such as broad-spectrum sensitivity and high efficiency. Additionally, with the rapid development of silicon-based photonic integrated circuits, silicon solar panels now feature high integration, which allows for the collection, processing, and analysis of experimental data on a single compact device. This integration can substantially lower the manufacturing costs of bucket detectors. Our goal is to explore the potential of silicon solar panels as a cost-effective alternative to traditional detectors in ghost imaging systems and to evaluate their performance under various sampling conditions and reconstruction algorithms.MethodsWe propose a pseudo-inverse ghost imaging system using commercial silicon solar panels as bucket detectors. In this system, the object light is captured by the silicon solar panel and converted into a voltage signal, which serves as the measurement signal, also called the bucket signal. In the experiment, a series of binary random patterns, generated by a projector, are sequentially projected onto the object, which is placed close to the silicon solar panel. The output voltage signals are digitized by an oscilloscope and then transmitted to a computer for image reconstruction. To verify the feasibility of the proposal, we first confirm the linear relationship between the output voltages of the silicon solar panel and the number of illuminated pixels. The deviation between the experimental data and theoretical predictions is minimal. For comparison, we also perform ghost imaging experiments using a CCD as the bucket detector under similar conditions. Image quality is evaluated using standard metrics. To further enhance image quality and optimize the experimental setup, various reconstruction algorithms are applied, including the correlation algorithm, pseudo-inverse algorithm, Schmidt orthogonalization, compressed sensing, and filtering techniques. The performance of ghost imaging with these methods is compared under different sampling rates.Results and DiscussionsThe verification of the linear relationship between the voltage signals from the silicon solar panel and the illuminated area demonstrates the feasibility of the proposed experimental setup (Fig. 2). Following this, 4096 speckle patterns are generated, and the object “T” is imaged. To evaluate the performance of silicon solar panels as bucket detectors, we conduct several experiments at different sampling rates and reconstruction algorithms. Similar experiments with a CCD as the bucket detector are also conducted for comparison. The experimental results are shown in Figs. 3 and 4. When the sampling rate exceeds 40%, the object’s outline becomes more distinguishable, and the results from the silicon solar panel closely match those obtained from CCD detectors. However, the silicon solar panel offers a significant cost advantage, being much more affordable than CCDs. Fig. 5 presents the peak signal-to-noise ratio (PSNR) values of the reconstructed images under various sampling rates and reconstruction algorithms. The results indicate that, in comparison to CCDs, the PSNR values for images reconstructed using silicon solar panels remain stable across different conditions. This stability highlights the robustness of the system, with the silicon solar panels demonstrating superior fault tolerance and ease in selecting an optimal sampling rate. As a result, the system can maintain high-quality image reconstruction even under variable conditions or environments. Furthermore, Fig. 6 shows the structural similarity index (SSIM) values for the reconstructed images under different sampling rates and algorithms. The SSIM results corroborate the findings from the PSNR analysis, demonstrating that the use of silicon solar panels as detectors leads to stable image recovery, even under low sampling conditions. This suggests that silicon solar panels can provide reliable and high-quality imaging performance in resource-constrained environments, making them an attractive option for practical ghost imaging applications.ConclusionsWe propose a pseudo-inverse ghost imaging system based on silicon solar panels as bucket detectors. The low-cost silicon solar panels deliver good performance in reconstructing images, demonstrating their potential as viable alternatives to traditional, more expensive detectors like CCDs. Various reconstruction algorithms such as the pseudo-inverse, Schmidt orthogonalization, and quadratic filtering techniques are applied, and the results show that high-quality, stable images can be obtained even with low sampling rates. The silicon solar panels’ excellent photovoltaic properties, broad spectral response, and low cost have made them widely used in fields such as environmental monitoring, intelligent transportation, building surveillance, security, disaster monitoring, and aerospace. Our imaging system not only broadens the application scope of ghost imaging but also integrates silicon solar panels into cost-effective, high-efficiency detection and monitoring technologies, paving the way for more practical applications in real-world scenarios.
Mar. 21, 2025Vol. 45 Issue 7 0711001 (2025)
Chunmiao Xu, and Wenlin Gong
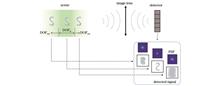
ObjectiveTraditional optical imaging systems project images of a scene at different distances onto a two-dimensional image, which results in the loss of distance information of targets in the scene. This limitation makes it difficult to meet the requirements of many fields, such as autonomous driving, biological imaging, and deep space exploration. Compared to active ranging methods, passive ranging methods have become a research hotspot in recent years due to their simplicity, low power consumption, and rich texture structure. Furthermore, they do not require additional active light sources for illumination. Currently, passive ranging methods mainly include multi-view stereo vision, monocular defocus, and monocular computational reconstruction via wavefront coding. Due to their simplicity, lower cost, and better application prospects, passive ranging systems based on monocular defocus have recently gained widespread attention. However, this method has limitations in measurement accuracy and non-unique distance decoupling. In this paper, we propose a high-precision passive ranging and refocusing method based on traditional optical imaging systems and two-frame detection signals. The proposed method can not only restore the target’s focused image when it is defocused but also solve the problem of non-unique decoupling of distance information, which is present in traditional monocular defocus ranging methods and achieve higher ranging accuracy. This work is useful for the accurate recognition of airborne targets and three-dimensional (3D) microscopic imaging.MethodsBy combining the compressive sensing image reconstruction algorithm with the gradient difference image quality evaluation function, we propose a high-precision passive ranging and refocusing method based on a traditional optical imaging system and two-frame detection signals (Fig. 2). Firstly, the point spread function (PSF) measurement matrix library is pre-calibrated/pre-computed in combination with the optical imaging system. Secondly, two frames of images of the scene target are recorded by the CCD. Thirdly, two sets of image sequences are reconstructed based on the theory and reconstruction algorithm of compressive sensing, and the image quality evaluation function (IQEF) is used to evaluate the image reconstruction results. Using the value of IQEF, the optimized image of the target can be achieved, and preliminary distance information of the target is obtained through the distance decoupling method (Fig. 3). Finally, highly accurate target distance information can be obtained by using the compressive sensing image reconstruction algorithm with an orthogonal constraint and an evaluation function based on the slice image information ratio.Results and DiscussionsTo demonstrate the validity of the proposed passive ranging and refocusing method, we build an optical imaging experimental system based on Fig. 2(a) for verification. In this case, the system’s depth of field is set as ΔL=1.43 mm. According to Eq. (4), the reconstruction results and normalized IQEF curves are shown in Figs. 4?6 based on two-frame detection signals and different PSF measurement matrices. Similar to the monocular defocus ranging method, the IQEF curve for each detection signal shows a structure of two peaks due to the symmetrical decoupling problem (Fig. 6). By combining the peak position of the IQEF curve, the coarse ranging architecture in Fig. 3, and Eq. (8), the problem of symmetrical decoupling is effectively solved in monocular defocus ranging, and it can be determined that the distance of the target is approximately 254.5 mm. Furthermore, by analyzing the influence of the searching step and the axial distance deviation (Δz) of two-frame detection signals on the accuracy of coarse ranging, the experimental results show that when the axial distance deviation Δz is greater than ΔL/2, the accuracy of coarse ranging method can reach ΔL/2 (Figs. 7 and 8). On the basis of the coarse ranging method, when the proposed TVAL3+OC reconstruction algorithm and the evaluation function of slice image information ratio are adopted, the target’s distance is confirmed near 252.8 mm and its ranging accuracy can reach ΔL/16 (Fig. 10), which is one order of magnitude higher than the existing monocular defocus ranging method.ConclusionsFaced with the low ranging accuracy and non-unique decoupling of distance information in the monocular defocus ranging method using a traditional optical imaging system, we propose a passive ranging and refocusing method based on two-frame detection signals. By combining the compressed sensing image reconstruction theory and two-frame detection signals, a clear target image can still be obtained even if the target is defocused and the accuracy of coarse ranging can reach half of the system depth of field (ΔL/2) when the axial distance deviation of two-frame detection signals is not smaller than ΔL/2. Based on the results of coarse ranging, the ranging accuracy of the target can reach ΔL/16 when the proposed precision ranging algorithm with orthogonal constraint is used. This work not only solves the problem of non-uniqueness in distance information acquisition that exists in the traditional monocular defocus ranging method, but also achieves higher-precision ranging. The proposed method has important application prospects in scenarios such as passive detection and ranging of aerial targets at medium and long distances, and three-dimensional microscopic imaging. When deep learning technology is introduced into the reconstruction process of coarse and precision ranging, the speed of target image reconstruction and distance information extraction is expected to improve dramatically. Moreover, high-precision ranging of small targets under conditions of low detection signal-to-noise ratio is an issue that needs further investigation in future work.
Mar. 20, 2025Vol. 45 Issue 7 0712002 (2025)
Xiangyi Jin, Yangyi Shen, Xinxin Kong, and Wenxi Zhang
ObjectiveLaser heterodyne interferometry is widely used in applications such as vibration measurement, velocity measurement, and displacement measurement. Traditional methods for eliminating the effect of laser frequency noise on measurements have mainly focused on reducing the laser noise itself. To suppress the effect of laser frequency noise on heterodyne interferometric signal, we study the model of laser frequency noise’s effect on the heterodyne interferometric signal, simulate the resulting tendencies and suppression extent with compensation fibers, and finally validate the suppression method through experimentation.MethodsA typical laser heterodyne interferometric structure is introduced, and the transitive relation from laser frequency noise to displacement noise is derived mathematically. A simulation system is set up, with input parameters including laser wavelength, laser emission power, laser frequency noise, coupler ratio, modulator frequency, photodetector gain, sampling rate, sampling time, and the passband and stopband frequencies of the low-pass filter. The variable is the measuring optical lengths, which are successively set to 0, 10, 20, and 30 m. The outputs are the power spectral densities of displacement. Three conditions are set: shot noise only, laser frequency noise only, and both shot noise and laser frequency noise considered. Root mean squares (RMSs) of power spectral densities in certain frequency ranges are calculated for the three conditions. The results are presented in a graph to show the trend. Similar work is conducted to show the graph of RMS-laser frequency noise at 0, 10, 20, and 30 m optical lengths. Compensation for the 30 m optical length fiber is simulated. The experiment is conducted using fibers of different optical lengths. The delay fibers with optical lengths of 30 and 154.1 m are used to simulate the real measuring optical length in air. Compensation results are recorded for comparison.Results and DiscussionsThe model analysis shows that in the non-compensation situation, the measuring optical length causes a significant time lag in light propagation. Mathematical derivation indicates that the power spectral density of displacement is directly proportional to the power spectral density of laser frequency and the square of the time lag. The results imply that differences in optical length, causing propagation time lag, may be a significant error source in the laser heterodyne interferometer. Thus, by compensating for the optical length difference, the error could be suppressed. Simulation of the power spectral density of displacement at different measuring optical lengths shows that the total noise level increases as the optical length increases. The shape of the power spectral density changes distinctly, which indicates that the effect of optical length change differs across frequency ranges. In the case of long optical lengths, the power spectral density graph consists of a main lobe and several side lobes. The 0.9?1.1 MHz results of RMS show that shot noise does not change significantly as the optical length increases. Meanwhile, in the case of long optical lengths, the system is mainly affected by laser frequency noise, and shot noise becomes negligible. When laser frequency noise is considered, RMS increases by 0.01 pm?Hz-1/2 as the optical length increases by 1 m. The 9?11 MHz results of RMS show that noise increases first and then decreases as the optical length increases from 0 to 30 m. 15 m has the largest value of 0.08 pm?Hz-1/2. The 2?30 MHz results of RMS show that the RMS speed decreases as the optical length increases. The RMS-laser frequency noise graph indicates that laser frequency noise has little effect, and displacement noise does not increase as laser frequency noise increases at 0 m optical length. When the optical length is greater than 0 m, displacement noise increases linearly as the laser frequency noise increases. The slope of the line depends on the optical length and increases as the optical length increases. Simulation of compensation with a 30-m optical length fiber shows that displacement noise is efficiently suppressed, and the total noise is reduced to the shot noise level. The experimental results are in accordance with a deduction from derivation and simulation. In the 30-m experiment, the RMSs of 1?5 MHz are respectively 0.031, 0.096, and 0.028 pm?Hz-1/2 in the conditions of no delay fiber, with delay fiber, and with delay fiber and compensation fiber. In the 154.1-m experiment, they are 0.027, 0.106, 0.024 pm?Hz-1/2. The results validate the suppression method.ConclusionsWe demonstrate the analysis of the effect of laser frequency noise on the heterodyne interferometric signal and the method for its suppression. Theoretical derivation is conducted to obtain the relationship between the power spectral density of laser frequency noise and that of displacement. The power spectral density of displacement is used to represent the magnitude of the noise effect. A numerical simulation is conducted to present the trend of the effect. The results show that displacement noise increases as laser frequency noise increases, and similarly, displacement noise increases as the detecting optical length increases. In the simulation, detecting optical length is set to be 15 m and laser frequency noise is set to be 3 Hz?Hz-1/2. After adding the compensation fiber of 30-m optical length, the RMS of power spectral density of displacement between 2 and 30 MHz decrease from 0.08 to 0.02 pm?Hz-1/2 in the simulation. The experiment using 154.1 m compensation fiber is done for compensating the effect of delay fiber. The RMS of power spectral density of displacement decreases from 0.106 to 0.024 pm?Hz-1/2. The experiment validates the method for suppression. It is implied that inserting delay fiber can sufficiently suppress the impact of laser frequency noise in heterodyne interferometry.
Mar. 20, 2025Vol. 45 Issue 7 0712003 (2025)
Jiaqi Feng, Zhongguang Yang, Zhang Zhang, Wen Chen, Jinpei Yu, and Liang Chang
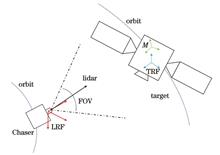
ObjectivePose estimation for non-cooperative spacecraft involves determining the spatial position and attitude of spacecraft that lack active cooperation devices, such as defunct satellites or space debris. This technology is critical for advanced space applications, including autonomous rendezvous and docking, on-orbit servicing, and orbital debris removal. For non-cooperative spacecraft with unknown geometric structures, a prominent research approach involves leveraging simultaneous localization and mapping (SLAM) to reconstruct the three-dimensional (3D) structure using model-based methods for pose estimation. Current methods often rely on feature-based techniques to establish the pose constraints, followed by pose graph optimization to minimize cumulative estimation errors. However, the time-consuming nature of feature extraction poses challenges for real-time applications, and existing information matrices may inadequately represent pose estimation uncertainties. Sensors for pose estimation can be categorized as passive or active. Passive sensors are low-cost and high-frame-rate but can be affected by lighting variations. In contrast, active sensors like lidar directly acquire 3D point clouds, offering high accuracy and being less susceptible to lighting and scale variations. Therefore, we utilize lidar as the sensor for pose estimation. To enhance real-time performance and model reconstruction accuracy, we propose a non-feature-based 3D reconstruction and pose estimation method (NFRPE-3D) using lidar point cloud data.MethodsFirst, we apply the iterative closest point (ICP) algorithm to execute a keyframe registration technique to obtain the relative pose, which is then recursively used to estimate the pose of the current frame. However, this process can introduce cumulative errors. To mitigate these errors, we update the pose graph based on attitude relationships between keyframes, establishing loop constraints. Pose graph optimization is performed using the g2o framework. Notably, the loop constraints in the pose graph are established solely through attitude relationships, which eliminate the need for complex feature extraction and reduce computational overhead. To address the limitation of existing methods where the information matrix does not accurately reflect pose estimation uncertainty, we propose constructing the information matrix for graph optimization by minimizing the sum of squared distances between corresponding keyframe points, thus enhancing pose graph optimization accuracy. The optimized pose graph results are then used to reconstruct the target’s point cloud model. After model reconstruction, subsequent pose estimations are performed using a model registration strategy.Results and DiscussionsTo validate our method, we conduct a semi-physical simulation experiment using a 1∶1 satellite model under simulated space lighting conditions. We first evaluate the attitude and position estimation accuracy of various methods (Figs. 9?12, Table 2). Our methods achieve mean absolute errors of 2.34°, 1.67°, and 1.71° for the three-axis attitude, and 0.033, 0.007, and 0.025 m for the three-axis position, significantly outperforming other methods. Compared to existing feature-based methods, our method improves three-axis attitude and position accuracy by over 40%. A comparison of point cloud models before and after pose graph optimization (Fig. 13) shows that the proposed method effectively reduces cumulative errors and enhances model reconstruction accuracy. The reconstructed point cloud model (Fig. 14) delineates the overall structure, demonstrating the effectiveness of our model reconstruction step. Finally, the computational times of the methods are presented (Fig. 15). Overall, the maximum real-time computation time of our method does not exceed 0.2 s, and except for the model reconstruction step, the computation time remains below 0.1 s. The average computation time per frame is 0.040 s, demonstrating excellent real-time performance. Compared to existing feature-based methods, our approach increases the average computing speed by 95.8%.ConclusionsIn this paper, we propose a method named NFRPE-3D for point cloud model reconstruction and pose estimation of non-cooperative spacecraft using lidar point cloud data. The method establishes pose graph constraints based solely on attitude relationships between keyframes, eliminating the need for feature extraction and matching, which significantly reduces computational complexity. Furthermore, by minimizing the sum of squared distances between corresponding points in keyframes, we construct the information matrix for pose graph optimization, thus improving pose estimation accuracy. Experimental results demonstrate that NFRPE-3D effectively enables spacecraft model reconstruction and pose estimation. In the absence of target model information, pose estimation is dependent on keyframe registration, which can result in significant fluctuations due to cumulative errors. However, pose graph optimization effectively mitigates these errors, improving accuracy and stabilizing pose estimation. After model reconstruction, the model registration strategy further stabilizes pose estimation. Compared to existing feature-based methods, our approach improves three-axis attitude and position accuracy by over 40%, while also increasing the average computation speed by 95.8%.
Mar. 20, 2025Vol. 45 Issue 7 0712004 (2025)
Lin Zhang, Longqin Xie, Zihan Xiang, Zhongmao Cai, Yatai Gao, and Weifeng Jiang
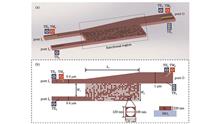
ObjectiveWith the rapid advancement of 5G (fifth generation of mobile communications technology), artificial intelligence, and big data, the demand for data transmission in optical communications is growing at an unprecedented rate. Conventional wavelength-division multiplexing (WDM) technology is constrained by the Shannon limit and fiber nonlinear effects, which makes mode-division multiplexing (MDM) technology essential to overcome communication capacity bottlenecks. Known for its high transmission capacity, integration, and scalability, silicon mode-division multiplexing systems are regarded as one of the most promising platforms for signal multiplexing. Among their components, the mode multiplexer/demultiplexer plays a crucial role. However, existing designs face several challenges, as conventional mode multiplexer/demultiplexer structures often suffer from large size and design complexity. While inverse design algorithms enable more compact layouts, they frequently require lengthy design cycles. To enhance device design efficiency, machine learning has been widely emphasized and studied in the field of photonics. In this study, we develop a silicon photonic device inverse design platform utilizing deep neural networks (DNN) and use it to inverse-design a silicon hybrid multiplexer/demultiplexer. The DNN-based inverse design platform for silicon photonic devices can significantly improve design efficiency and greatly expand design flexibility.MethodsThe inverse design platform is constructed using a DNN architecture, which includes one input layer, several hidden layers, and one output layer (Fig. 2). The input layer incorporates the operating wavelength, the desired transmittance, and three modes corresponding to a specific wavelength. The output layer consists of nodes that represent the distribution of subunits in the functional region. We combine the direct binary search (DBS) algorithm with the three-dimensional full-vector time-domain finite-difference (3D-FV-FDTD) method to compile the dataset, which ensures an appropriate division between the training and validation sets. The rectified linear unit (ReLU) is selected as the activation function, while the Adam optimizer is employed to approximate the nonlinear function and optimize the weights and biases during the training process. The binary cross-entropy (BCE) loss function is used to train the network model and measure the error between the predicted and actual outputs. By adjusting the number of hidden layers and neurons per layer, we identify the optimal configuration of hidden layers, neurons, and iterations. Ultimately, using the trained deep neural network model, we implement a silicon hybrid multiplexer/demultiplexer that achieves the desired performance through inverse design (Fig. 1). A silicon hybrid multiplexer/demultiplexer chip is fabricated using the complementary metal-oxide-semiconductor (CMOS) process (Fig. 8). Utilizing a self-constructed test system, we conduct performance tests on the silicon hybrid multiplexer/demultiplexer chip to evaluate the consistency between theoretical predictions and experimental results (Fig. 9).Results and DiscussionsUtilizing the established inverse design platform, the silicon hybrid multiplexer/demultiplexer can be designed within 10 ms, with a compact size of only 4.8 μm×2.56 μm (Fig. 1). Theoretical results indicate that the insertion losses for the TE0, TM0, and TE1 modes at the central wavelength are 0.48 dB, 0.19 dB, and 0.41 dB, respectively, while the 3 dB operating bandwidth exceeds 100 nm (Fig. 6). Experimental test results reveal that the insertion losses for the TM0, TE0, and TE1 modes at the central wavelength are 0.56 dB, 0.31 dB, and 0.93 dB, respectively. Within the 100 nm bandwidth range, the insertion loss remains below 3.75 dB, and the inter-modal crosstalk is less than -16.26 dB (Fig. 9). Compared to traditional ADC and AC structures, the silicon hybrid multiplexer/demultiplexer proposed in this paper effectively reduces the overall size of the device by introducing a functional area. In contrast to structures designed using conventional reverse design methods, the proposed structure enhances multiplexing/demultiplexing efficiency and minimizes the area of the required functional components by incorporating tapered waveguide units.ConclusionsIn this study, we present a photonic device inverse design platform built on DNN and conduct both theoretical and experimental studies of a silicon hybrid multiplexer/demultiplexer. Utilizing a combined approach of DBS and 3D-FV-FDTD methods, we collect 4077 data points as a dataset to train the neural networks. The architecture is optimized to include four hidden layers, each containing 120 neurons. With the developed inverse design platform, the efficient design of a silicon hybrid multiplexer/demultiplexer with arbitrary desired performance can be achieved by collecting the dataset just once. Using this platform, we successfully design a silicon hybrid multiplexer/demultiplexer with a size of only 4.8 μm×2.56 μm, which enables TM0, TE0, and TE1 mode multiplexing/demultiplexing. Theoretical results indicate that the insertion losses for the TE0, TM0, and TE1 modes at the center wavelength are 0.48 dB, 0.19 dB, and 0.41 dB, respectively, with a 3 dB operating bandwidth exceeding 100 nm. Experimental results reveal that the insertion losses for the TM0, TE0, and TE1 modes at the center wavelength are 0.56 dB, 0.31 dB, and 0.93 dB, respectively. Additionally, the insertion loss for the TE1 mode within the 100 nm bandwidth is less than 3.75 dB, and the inter-mode crosstalk is below -16.26 dB. We demonstrate the design of high-performance silicon mode-control devices using the DNN inverse design method, which serves as a crucial component for MDM networks. Furthermore, the DNN-based inverse design platform developed in this study can be extended to the design of various types of photonic devices, thus providing an effective tool for advancing photonic integration technology.
Mar. 20, 2025Vol. 45 Issue 7 0713002 (2025)
Yuanyuan Peng, Haoyang Li, Wen Li, and Yuejin Zhang
ObjectiveRetinal vessel segmentation is a crucial task in ophthalmology, as it aids in the early detection and monitoring of various eye diseases, such as glaucoma, diabetic retinopathy, and hypertension-related retinopathy. Accurate segmentation can provide valuable insights into the microvasculature of the eye, which is essential for diagnosing and managing these conditions. However, retinal vessel segmentation remains challenging due to the complexity and variability of retinal images, including factors like low contrast, illumination variations, and vessel thickness discrepancies. Therefore, the objective of this study is to develop a robust and accurate segmentation algorithm that can effectively address these challenges.MethodsTo achieve this objective, we propose a novel CNN-Mamba network that integrates local intensity order transformation (LIOT) and dual cross-attention mechanisms. The proposed network architecture consists of three main components: a convolutional neural network (CNN) encoder for feature extraction, a series of Mamba blocks that incorporate dual cross-attention mechanisms to capture complex dependencies between distant regions in the image, and a segmentation head for producing the final vessel segmentation mask. In the preprocessing stage, LIOT is applied to the input retinal image to enhance its contrast and detail. LIOT works by rearranging pixel intensities within a local window so that the intensity order reflects the underlying structure of the vessels. This preprocessing step facilitates better feature extraction by the CNN encoder, as it highlights the edges and contours of the vessels. The CNN encoder is responsible for extracting local features from the preprocessed image and consists of a series of convolutional layers, batch normalization layers, and ReLU activation functions. The output of the CNN encoder is a set of feature maps that capture various aspects of the retinal image, such as texture, edges, and shapes. The Mamba blocks are the core of the proposed network. Each Mamba block contains two parallel branches: a pixel-level selective structured state space model (PiM) and a patch-level selective structured state space model (PaM). The PiM branch focuses on processing local features and capturing neighboring pixel information, while the PaM branch handles remote dependency modeling and global patch interactions. The dual cross-attention mechanisms within the Mamba blocks enable the network to capture complex dependencies between distant regions in the image, improving its ability to segment fine vascular structures. Finally, the segmentation head consists of a series of convolutional layers and a sigmoid activation function, which produce the final vessel segmentation mask.Results and DiscussionsExperimental results on benchmark retinal vessel segmentation datasets demonstrate the effectiveness of the proposed CNN-Mamba network. The network achieves superior performance in terms of accuracy, sensitivity, and specificity compared to state-of-the-art methods. In particular, the integration of LIOT and dual cross-attention mechanisms significantly improves the network’s ability to segment fine vascular structures, even in challenging cases with low contrast or high variability in vessel thickness. We also conduct ablation studies to analyze the contributions of LIOT and the dual cross-attention mechanisms to the overall performance of the network. The results show that both components are essential for achieving optimal segmentation performance. Specifically, LIOT enhances the contrast and detail of the input image, facilitating better feature extraction by the CNN encoder. The dual cross-attention mechanisms within the Mamba blocks enable the network to capture complex dependencies between distant regions in the image, which is crucial for segmenting fine vascular structures. LTDA-Mamba demonstrates excellent vessel segmentation and blood vessel pixel identification capabilities, which leads to a reduction in the subjectivity associated with manual labeling. In general, LTDA-Mamba outperforms other cutting-edge methods with high sensitivity. Specifically, for the DRIVE, CHASE~~DB1, and STARE datasets, the accuracy rates are 0.9689, 0.9741, and 0.9792, respectively. The sensitivities are 0.7868, 0.7697, and 0.7488, while the F1 scores are 0.8151, 0.8043, and 0.8219, respectively.ConclusionsIn conclusion, the proposed CNN-Mamba network, incorporating LIOT and dual cross-attention mechanisms, represents a significant advancement in retinal vessel segmentation. The network demonstrates the ability to accurately and consistently segment fine vascular structures, even in challenging cases. This capability suggests its potential for early disease detection, patient monitoring, and treatment planning in ophthalmology. The integration of LIOT and dual cross-attention mechanisms further enhances the network’s robustness and accuracy, which makes it a powerful tool for ophthalmic image analysis. Future work will focus on optimizing the network architecture and exploring additional preprocessing steps to further strengthen segmentation performance.
Mar. 19, 2025Vol. 45 Issue 7 0717001 (2025)
Zijuan Liu, Yongqian Li, Lixin Zhang, and Guozhen Yao
ObjectiveIn recent years, fiber shape measurement technology has advanced rapidly. However, shape measurement technology based on fiber Bragg grating (FBG) cannot achieve completely distributed shape measurement due to limitation in the number and spacing of FBGs. The traditional single-mode fiber Brillouin optical time-domain analysis system, which suffers from low spatial resolution, limited communication capacity, and high bending loss, can no longer meet the current research requirements. Multi-core fibers (MCFs) have shown promising potential in bending strain measurement, especially due to the off-core fibers that are not located on the neutral axis of the fiber. In this paper, we employ a differential pulse Brillouin optical time-domain analysis system, with a spatial resolution of several centimeters, to measure the bending of seven-core fibers. In addition, recognizing that the temperature characteristics of each core in seven-core fibers may vary due to differences in production and processing, we calibrate the temperature coefficients of each core. A novel temperature compensation method is proposed to address the cross-sensitivity issue between temperature and strain in multi-core fibers during bending measurements. We hope that the proposed temperature method can more accurately determine the bending curvature of the fiber.MethodsIn this study, a differential pulse Brillouin optical time-domain analysis system with a spatial resolution of 20 cm is used. Seven intermediate cores and three asymmetric cores are selected for experimental measurement. First, we conduct temperature calibration experiments on four selected fiber cores over a temperature range of 20?70 ℃ (with 10 ℃ increments), and the temperature coefficients for each of these four cores are determined. Then, we apply both temperature and bending strain at the 17.5?18.5 m position on the fiber to measure temperature-compensated curvature. The proposed temperature compensation method involves extracting the Brillouin frequency shift from the intermediate core, calculating the fiber temperature using the previously measured temperature coefficients, and subtracting the Brillouin frequency shift caused by temperature from the actual measured shift. This allows the bending strain information of the core to isolated. From the resulting Brillouin frequency shift, the curvature of the bending section of the fiber can be reconstructed.Results and DiscussionsCores 1, 3, 5, and 7 of the seven-core fiber are selected for experiments, yielding temperature coefficients of 1.103, 0.962, 1.277, and 0.937 MHz/℃ respectively, which are comparable to those of single-mode fiber. Using these temperature coefficients, the fiber is wrapped around a disc with a bending radius of 4.9 cm and heated in a water bath to simultaneously induce temperature and strain effects. The curvature of the bending section is calculated using a parallel transmission frame algorithm. The results show that the maximum curvature obtained is 20.593 m-1, while the average curvature is 19.910 m-1. To reduce experimental error, we repeat the experiment for three times, and the final measurement used is the average of these three trials. The actual curvature of the bending section is 20.408 m-1. The error between the maximum measured curvature and the actual curvature is 0.91%, while the error between the average curvature and the actual curvature is 0.24%.ConclusionsAnalysis of the experimental results demonstrate that the proposed temperature compensation method for bending measurement can more accurately separate temperature and bending strain effects, and more precisely reconstruct the curvature information of the fiber. The main sources of error in curvature reconstruction are the limited spatial resolution and sampling rate of the system, which leads to a sparse dataset, and the artificial control of bending and strain application in the experiment, which introduces minor deviations. These issues will be the focus of future work to improve the accuracy of curvature measurement.
Mar. 20, 2025Vol. 45 Issue 7 0728002 (2025)
Jun Deng, Jiancong Shen, Yuting He, Jiawei Wang, Wencong He, Buyong Wan, and Xiaohong Yang
ObjectiveHydrogen, as an efficient, non-polluting, sustainable, and abundant energy source, plays an important role in addressing the pressing global energy crisis. However, the risk of hydrogen leakage and its flammable and explosive characteristics pose a threat to the safety of life and property. Consequently, developing and utilizing reliable hydrogen sensing technology is of utmost necessity. Fiber optic hydrogen sensors based on metal-oxide semiconductors (MOS) have become a research hotspot in this field due to their inherent safety, compact size, resistance to electromagnetic interference, and suitability for explosive environments. The preparation method, material selection, and micro-nanostructure of the sensing layer of fiber optic gas sensors are key factors affecting the performance of the sensors. Traditional methods, such as dip coating, drop casting, and sputtering, are difficult to use to form a sensing layer on the surface of optical fibers that has strong bonding and good stability. In addition, the sensing layer, whether it is a coating or a film, typically has a dense structure with a low specific surface area, limited gas adsorption active sites, and insufficient internal gas transmission channels, which leads to poor gas-sensitive performance. Furthermore, gas sensors based on pure MOS, such as zinc oxide (ZnO), face challenges such as high operating temperatures, low sensitivity, and poor selectivity. Incorporating noble metal-modified MOS can significantly enhance their sensing performance, but this improvement comes at a substantial cost increase. Research indicates that transition metal nickel (Ni)-doped ZnO (Ni∶ZnO), characterized by high activity and low cost, can significantly enhance gas sensing performance. In this study, we design and fabricate a fiber optic hydrogen sensor based on Ni∶ZnO nanorod arrays, which demonstrates significant advantages in terms of the fabrication process, cost, and response.MethodsWe design a fiber optic hydrogen sensor based on ZnO nanorod arrays. Firstly, we theoretically analyze the advantages of the nanorod array structure in fiber optic sensors. These advantages not only provide a high specific surface area and gas transmission channels but also change the light transmission mode and the effective transmission path. As a result, the output light intensity increases monotonically with the increase in conductivity, thus enabling effective gas detection (Fig. 2). Then, we prepare Ni∶ZnO nanorod arrays on cladding-etched surfaces using a two-step method: impregnating the ZnO seed layer followed by growing the Ni∶ZnO nanorod arrays in a water bath. The as-prepared samples, with Ni/Zn molar ratios of 1%, 1.5%, 2%, 2.5%, and 3%, are numbered Ni∶ZnO-1, Ni∶ZnO-2, Ni∶ZnO-3, Ni∶ZnO-4, and Ni∶ZnO-5, respectively. Next, the morphology and chemical composition of the nanorod arrays are characterized by scanning electron microscopy and X-ray diffractometry, respectively. ZnO nanorod array-based fiber optic hydrogen sensors with different Ni doping concentrations are then prepared to experimentally investigate the optimal Ni doping concentration. Finally, we test the ZnO nanorod array sensors with the optimal Ni doping concentration to evaluate their hydrogen-sensitive performance.Results and DiscussionsThe ZnO nanorod arrays grown on the fiber surface are hexagonal prismatic, uniformly aligned, and well-dispersed, with nanorod diameters ranging from 50 to 100 nm and an array thickness of approximately 5.5 μm (Fig. 4). The Ni element is successfully incorporated into the ZnO lattice in the form of interstitial doping, which increases the surface defects of ZnO (Figs. 4 and 5). The responsivity of the Ni∶ZnO-based fiber optic sensor firstly increases and then decreases with increasing Ni doping concentration. The response of pure ZnO is only 1.13%, while the Ni∶ZnO-4 sensor exhibits the best response at 8.44%, an enhancement of about 7.5 times, and has the fastest response time (75 s). In contrast, the response of the Ni∶ZnO-5 sensor decreases to 3.33%. Moreover, the Ni∶ZnO-4 sensor shows good linearity between the response and hydrogen volume fraction (1×10?5?1×10?3), with a sensitivity of 76.8% and its response to 1×10⁻⁵ hydrogen still being 0.42% (Fig. 6). The sensors exhibit excellent stability and repeatability. In two sets of 12 consecutive cyclic tests, the average response decrease is only 0.3% and 0.33%, and during four weeks of regular monitoring, the response of the sensors decreases by less than 0.25%. Additionally, the sensor exhibits good gas selectivity (Fig. 7). Compared to other fiber optic hydrogen sensors, the designed Ni-doped ZnO nanorod array sensors exhibit significant advantages in terms of hydrogen sensing performance and cost-effectiveness (Table 1), which makes them a very promising option for hydrogen detection.ConclusionsIn this paper, we propose a fiber optic hydrogen sensor based on ZnO nanorod arrays. The special micro-nanostructure of ZnO nanorod arrays, serving as the sensing layer material for fiber optic sensors, not only alters the light transmission mode and path within optical fibers but also provides a large specific surface area, abundant active sites, and gas transmission channels for gas-sensitive detection, which enhances the sensor’s performance. The sensor is fabricated by growing Ni-doped ZnO nanorod arrays on the fiber surface, using a ZnO seed layer followed by hydrothermal synthesis within a water bath. The Ni∶ZnO-4-based sensor, which exhibited the best gas response, achieves a response of 8.44% to a hydrogen volume fraction of 1×10⁻³, with a sensitivity of 76.8 /%, a fast response time (75 s), and a lower detection limit of 1×10⁻⁵. Additionally, the sensor maintains good repeatability, stability, and selectivity for hydrogen. Compared with similar fiber optic hydrogen sensors, this sensor offers significant advantages in terms of the fabrication process, cost, and response. In conclusion, the fiber optic hydrogen sensor based on Ni-doped ZnO has potential applications in the field of hydrogen safety monitoring.
Mar. 20, 2025Vol. 45 Issue 7 0728003 (2025)
© Copyright 2018-2021 | Chinese Laser Press.
All Rights Reserved 沪ICP备15018463号-20