


Please enter the answer below before you can view the full text.
9-8=

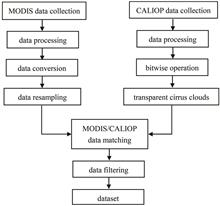
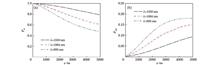
ObjectiveCirrus clouds are located in the upper troposphere and lower stratosphere and are mostly composed of ice crystal particles with a cloud top pressure of less than 440 hPa. Meanwhile, they are widely distributed, covering an area of approximately 20%-35% of the earth. In tropical regions, the coverage area of cirrus clouds reaches 70%. Cirrus clouds play a very important role in the earth atmosphere system by reflecting solar shortwave radiation and absorbing surface thermal radiation. Passive remote sensing features wide spatial coverage and high temporal resolution, but its detection for thin cirrus clouds is relatively limited. A large number of thin cirrus clouds with optical depth of less than 0.4 are missed by passive remote sensing. This phenomenon is particularly serious in tropical areas, which greatly underestimates the coverage of cirrus clouds and causes large errors in radiation calculation. Fortunately, the dual-wavelength cloud aerosol lidar infrared with orthogonal polarization (CALIOP) onboard the CALIPSO has unparalleled advantages in detecting thin cirrus clouds, which can detect thin cirrus clouds with optical depth less than 2. However, CALIOP cannot penetrate thick cirrus clouds, with limited spatial coverage. Therefore, we combine active and passive remote sensing to identify and retrieve optical depths and top heights of single-layer transparent cirrus clouds over the South China Sea. We hope that our research can provide quantitative support for the distribution of thin cirrus clouds over the South China Sea, and help improve the radiation calculation accuracy.MethodsArtificial neural networks have powerful nonlinear function fitting ability and can employ multi-channel information, which makes them widely applicable in cloud parameter retrieval. Based on a matched dataset from MODIS/CALIOP, we utilize back propagation (BP) neural networks for the identification and parameter retrieval of single-layer transparent cirrus clouds over the South China Sea. First, to obtain a perfect dataset, we conduct several steps, including MODIS/CALIOP data collection, data processing, data conversion, data resampling, data matching, and data filtering. Additionally, we collect MODIS/MYD02_1 km and CALIOP/Level2_CloudLayer_5 km data for a total of six years from 2009 to 2015 over the South China Sea. MODIS raw data are converted to brightness temperature as inputs of neural networks. Due to the spatial resolution of 1 km for MYD02 data, it is necessary to resample it to 5 km for data matching with CALIOP. Meanwhile, data filtering based on three conditions is conducted, including CAD_Score and Number_Layers_Found from CALIOP, and MODIS/CALIOP pixel distance. We set the threshold of CAD_Score as 50. Since we only focus on single-layer transparent cirrus clouds, Number_Layer_Found is set as 1 and the distance between MODIS/CALIOP is ensured to be no more than one pixel (5 km). After filtering, a total of 274786 data samples were obtained from 2009 to 2015, including 120980 single-layer transparent cirrus samples and 153806 clear sky samples. To increase the proportion of positive samples (transparent cirrus clouds) to improve the model accuracy, we randomly downsample the clear sky samples by 0.6 times to obtain 92284 clear sky samples. Therefore, a dataset containing 213264 samples is finally acquired. We divide the dataset into training, testing, and validation sets in a 6∶3∶1 ratio, and three neural networks are proposed, including one for detecting transparent cirrus clouds, one for retrieving optical depths, and one for retrieving top heights.Results and DiscussionsIn the identification of transparent cirrus clouds, the probability threshold of the network output is set to 0.56, which can achieve the optimal detection rate and false alarm rate, with a detection rate of 79%, a false alarm rate of 9.8%, and an AUC of 0.92 [Fig. 3(a)]. A large number of transparent cirrus clouds with optical depth less than 0.1 result in a low detection rate and a high false alarm rate, which is because it is difficult to distinguish these cirrus clouds from clear skies. The detection rate rapidly increases with the rising optical depth [Fig. 3(b)]. When the optical depth is less than 0.03 or greater than 0.4, the detection rate is only 36% or over 95% respectively. Among them, when the optical depth is greater than 1, the detection rate can reach 100%, indicating that the neural network can detect transparent cirrus clouds in the region, but the detection performance on the subvisual cirrus clouds with optical depth less than 0.03 is poor. For the optical depth retrieval of transparent cirrus clouds, the error exceeds 500% under the optical depth of less than 0.03. As the optical depth gradually increases, the error rapidly decreases to within 100%. When the optical depth is greater than 0.2, the error is within 50% [Fig. 5(a)]. The reason for the large overall error is that the neural network has a significant error in retrieving cirrus clouds with optical depth less than 0.03. The error for the top height of cirrus clouds is mainly distributed around 5%. In the parts with cloud top heights less than 10 km and greater than 17.5 km, greater errors can be observed [Fig. 5(b)], and the main reason for speculation is that the sample sizes in these two intervals are relatively small. The scatter plots reveal good linear relations between the predicted and true values (Fig. 6), with correlation coefficients reaching 0.79 (for optical depth) and 0.87 (for top height). The mean absolute error and root mean square error for the optical depth are 0.2 and 0.25 respectively. The mean absolute error and root mean square error of the top height retrieval are 0.61 km and 0.74 km respectively. In a case study, the comparison with CALIOP data shows that the research results have a certain reliability degree (Figs. 9 and 10).ConclusionsBased on the MODIS/CALIOP matched dataset, neural networks are adopted to first detect transparent cirrus clouds, then retrieve the optical depth and cloud top height of the detected transparent cirrus clouds, and compare the results with the CALIOP data. The results show that the classification neural network can detect transparent cirrus clouds with a detection rate of 79%. The retrieval results show that it has a high agreement with CALIOP data. The correlation of the optical depth is 0.79 and that of the cloud top height is 0.87. The classification neural network has poor detection ability for subvisual cirrus clouds with optical depth less than 0.03, with a detection rate of only 36% and a larger retrieval error. As the optical depth increases, the detection rate rises rapidly. For the parts with optical thickness greater than 0.4, the detection rate reaches more than 95% and the retrieval error decreases rapidly. Finally, we perform a case study. The results show that the detection results of the neural network are more consistent with the observations of CALIOP than the official MODIS product. The retrieval results are in good agreement with CALIOP data. The results can provide references for the distribution of transparent cirrus clouds missed by MODIS, and help improve the radiation calculation accuracy.
ObjectiveVortex beam is a beam that carries orbital angular momentum (OAM). The perfect vortex beam (PVB) is a new type of beam that has emerged in recent years. Compared with other traditional vortex beams, the PVB has the property that the radius of the optical ring does not increase with the increase in OAM mode, which has attracted much attention in the field of free-space optical communication. Moreover, the different OAM modes of the vortex beam are orthogonal to each other and can be used to expand the channel capacity of optical communication systems. The OAM dimension of the vortex beam can also be used for signal coding, and since the number of modes of OAM modes is not limited (it can be any integer), it is theoretically possible to carry an infinite amount of bits of information in a single code element. However, vortex beam transmission in the atmosphere will be affected by atmospheric turbulence and produce distortion, and atmospheric turbulence makes its light intensity distribution uneven. Spiral phase distortion can result in the expansion of the spiral spectrum, cause crosstalk between different modes of the vortex beam, and reduce the signal-to-noise ratio of the communication system, thus leading to the degradation of the communication quality in practical applications. In this study, based on the Rytov approximation, the analytical expression of the spiral phase spectrum of the PVB at the receiving aperture is derived, and the probability of detection and crosstalk probabilistic models of the OAM mode of the PVB is established. The effects of different parameters on the PVB in a turbulent atmosphere are analyzed in the context of the light intensity distribution characteristics of the PVB in free space transmission. These results are expected to provide a reference for the application of PVB in free-space optical communication.MethodsIn this paper, an analytical expression for the spiral phase spectrum of the PVB is derived theoretically. First, the complex amplitudes of PVBs transmitted in atmospheric turbulence in the weakly turbulent region are obtained using the Rytov approximation based on the optical field distribution of PVBs in the source plane and in free space. Then, in order to describe the OAM mode of the PVB more clearly, the expression of the vortex beam is decomposed into the form of a spiral harmonic function. After that, the non-Kolmogorov probability spectrum is used to describe the effect of atmospheric turbulence on the OAM of the PVB. Then, by using the quadratic approximation of the wave structure function, the analytical expression of the OAM mode probability density of the PVB is obtained. In the next step, the spiral phase spectrum is defined, and the detection probability and the crosstalk probability of the OAM mode of the PVB are modeled. In addition, the effect of each beam element on the beam transmission in atmospheric turbulence and the light intensity characteristics of PVB transmission are analyzed using MATLAB software.Results and DiscussionsThe PVB has the property that the radius of the beam does not increase with the increase in the OAM mode. As the OAM mode at the transmitter changes, the detection probability and crosstalk probability curves corresponding to different initial OAM modes at the transmitter almost coincide when transmitting to the near field, and the difference between the detection probability and crosstalk probability curves corresponding to different initial OAM modes at the transmitter increases significantly when transmitting to the far field (Fig. 3). In addition, when the beam is transmitted to the far field, and the quantum number difference is 1, larger OAM mode at the emission indicates higher crosstalk probability. The crosstalk probability occurs mainly between two neighboring OAM states (Fig. 3). Furthermore, the variation of PVB light intensity with distance in atmospheric turbulence can reveal the evolution of the PVB light field (Fig. 4). In addition, the crosstalk probability curve of PVB has a significant feature in the state with a large refractive index structure constant near the ground: it first increases to a maximum with the transmission distance and then slowly decreases (Fig. 5).ConclusionsIn this paper, an analytical expression for the spiral phase spectrum of a PVB under non-Kolmogorov turbulence is derived theoretically. Theoretical models of OAM modal detection probability and crosstalk probability are developed. The results show that the atmospheric turbulence significantly causes the spiral phase spectrum expansion of the PVB. The detection probability curve of the PVB in the near field hardly varies with the OAM mode at the transmitter, while it varies significantly with the OAM mode at the transmitter when the beam is transmitted to the far field. This is because the PVB transmitted to the far field becomes a Bessel-like beam, and its beam radius varies significantly with the OAM mode at the transmitter. Moreover, a long transmission distance of the PVB beam indicates a more severe negative impact of atmospheric turbulence. The detection probability of the beam after atmospheric turbulent transport decreases as the number of OAM modes at the transmitter, beam radius, refractive index structure constant near the ground, and turbulence coefficient increase. As the beam wavelength increases, the detection probability of the PVB after atmospheric turbulent transport increases. These results provide a certain reference value for the implementation of PVBs in atmospheric turbulence for optical communication links in free space.
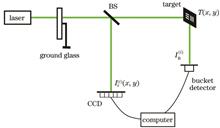
ObjectiveFor the problem of poor reconstruction quality and resolution degradation of underwater ghost imaging, an underwater ghost imaging method based on speckle degradation compensation was proposed to recover the target image degraded by the water body. Compared with ghost imaging in air medium, underwater ghost imaging has been studied by scholars in many aspects, such as the absorption effect of the water body, signal-to-noise ratio detection of the system, backward scattering noise, underwater illumination spot, and underwater turbulence. Image degradation and recovery methods based on underwater optical transmission models have been used in array detector optical imaging. However, there is no relevant study to analyze and solve the problem of degradation of underwater ghost imaging starting from the inherent optical properties of the water body. The scattering effect of the water body on the beam reduces the contrast of the speckles shining on the surface of the target and degrades the resolution, which deteriorates the intensity fluctuation characteristics of the target obtained by bucket detection, thus affecting the reconstruction quality of ghost imaging. Therefore, we hope to recover the underwater ghost imaging results affected by the water body through a method similar to deconvolution by introducing a point spread function (PSF) related to the intrinsic optical parameters of the water body.MethodsIn this research, the water body scattering degradation model was introduced into the ghost imaging image reconstruction to improve the image quality. First, the S-S (Sahu-Shanmugam) scattering phase function was linearly approximated in logarithmic coordinates in a small angular range (0.1°-5°). Then, the Hankel transform of the scattering phase function was substituted into the Wells modulation transfer function (MTF) model to obtain the modulation transfer function for image propagation in water. The MTF is a frequency domain expression of the PSF, which can better describe the degradation effect of real seawater on the scattering spot. The intrinsic optical parameters of the water body (such as scattering coefficient, absorption coefficient, and scattering phase function) and the imaging distance were used to construct this MTF. Finally, the obtained MTF was used for correcting the reference arm speckles, so as to compensate for the object arm speckle degradation of the target surface. Meanwhile, we represented the process of convolution PSF of speckle patterns as matrix multiplication. In addition, the role of the speckle degradation compensation method in the image reconstruction process was studied theoretically by the second-order correlation algorithm and the pseudo-inverse algorithm, respectively. Finally, the usefulness of the speckle degradation compensation method and the correctness of the theoretical model were verified by simulation and experiment.Results and DiscussionsIn this study, the matrix form of the speckle degradation compensation method is derived theoretically. The mathematical nature of the correction compensation of the reference arm speckle before reconstruction by the second-order correlation algorithm or the pseudo-inverse algorithm is analyzed. Equation (16) shows that in the second-order correlation calculation, the reference arm speckle is convolved with the PSF of the water body equivalent to the image convolved with the PSF of the water body obtained by second-order correlation for the original non-degradation compensation. Therefore, this method, for second-order correlation reconstruction, will make the reconstruction effect doubly degrade. As shown in Eq. (17), the pseudo-inverse ghost imaging with speckle degradation compensation is essentially a method of deconvolution by obtaining the convolution kernel of the PSF of the water body from the optical parameters of the water body. If the correction compensation of reference arm speckles is consistent with the actual degradation of the object arm, the degradation of the water body can be better removed. The simulation results and experimental validation results are shown in Fig. (4) and Fig. (6), respectively. The reconstruction results of the second-order correlation algorithm with speckle degradation compensation deteriorate the image quality compared with the original second-order correlation algorithm. The image quality and resolution of the reconstruction results of the pseudo-inverse algorithm with speckle degradation compensation are significantly improved compared with the original pseudo-inverse algorithm.ConclusionsIn this study, an MTF of the water body that can describe the underwater speckle transmission is derived, and the reference arm speckle is corrected with the same degree of degradation as the object arm speckle, so as to compensate for the degradation of the object arm speckle. The method restores the congruence between the object arm speckle and the reference arm speckle and then performs the reconstruction calculation of the target image. Through theoretical analysis, simulation, and experiments, it is proved that the spot degradation compensation will aggravate the image degradation for the second-order correlated image reconstruction, while it can improve the image resolution and imaging quality for the pseudo-inverse reconstruction. The method has some degradation removal effect for pseudo-inverse algorithm and greedy algorithm based on least squares in underwater target image reconstruction. Unlike blind deconvolution, the accuracy of the method depends on the accuracy of the MTF or PSF of the water body, and the improvement of the image reconstruction quality characterizes the correctness of the derived MTF. The method is essentially a deconvolution method based on the scattering model of the water body, which generates ringing artifacts and noise amplification in the case of the low signal-to-noise ratio of bucket detection, making the reconstruction quality worse, which is also an important direction for subsequent research.
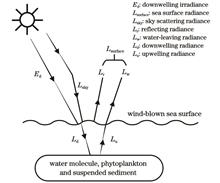
ObjectiveWith the development of hyperspectral and high-resolution ocean color satellite remote sensors, such as hyperspectral imager for the coastal ocean (HICO), advanced hyper-spectral imager (AHSI), and ocean color instrument (OCI), the existing above-water automatic observation systems cannot meet the application needs for on-orbit calibration and in-situ verification of these sensors. For example, CE318-SeaPRISM and radiation measurement sensors with enhanced spectral resolution (RAMSES) sensors can only verify multispectral remote sensors, as they have a lower spectral resolution of about 10 nm. However, the hyperspectral remote sensors have a spectral resolution of about 5 nm, which can capture more subtle spectral characteristics of water bodies. Therefore, an above-water hyperspectral radiometer with higher spectral resolution is needed. In addition, the separate radiometric calibration of radiance and irradiance radiometers may also introduce uncertainty of Rrs (remote sensing reflectance). To address these challenges and obtain high-precision hyperspectral apparent optical properties data of water bodies, we put forward a design scheme of an acquisition system with three-channel synchronous observation, same dispersion optical path design, and same system calibration. We propose a water apparent optical property acquisition system (WAOPAS), which can provide technical support for high precision on-orbit calibration and product authenticity verification of ocean color remote sensors.MethodsWe develop a novel three-channel hyperspectral acquisition system for ocean color remote sensing based on the principle of above-water measurement. To achieve high spectral matching consistency among the three radiometers, we use the same dispersion acquisition unit and different front optical system designs. We also implement shutter synchronization and wireless remote transmission technologies to enable the synchronous and rapid multiple acquisition of sea surface radiance (Lsurface), sky radiance (Lsky), and sea surface incident irradiance (Es), which can cope with the complexity and variability of the marine environment. Furthermore, we utilize GPS positioning and tracking technology to automatically adjust the observation geometry and avoid sun glint. We apply an automatic integration time design to automatically adjust parameters according to the environmental light intensity and water transparency, adapting to the diversity of the marine environment. To enhance the stability and reliability of the instrument, we leverage an integrated instrument housing and multiple protection design. To improve the accuracy of radiometric measurement, we adopt a near-synchronous radiometric calibration scheme of radiance and irradiance, which can be traced back to the National Institute of Metrology of China (NIM). Finally, we conduct a comparison experiment with HR-1024i and RAMSES outdoor to verify the accuracy of the measurement system.Results and DiscussionsThe WAOPAS is calibrated and tested in the laboratory. It has a spectral range of 350-900 nm, a spectral resolution better than 3 nm, and functions of automatic observation geometry adjustment, automatic gain integration time, data remote transmission, and automatic preprocessing. It can realize unattended observation in all weather conditions. The radiance and irradiance meters have the same spectral range and sampling interval, and the maximum difference in resolution is 0.26 nm, ensuring the spectral matching of the measurements. The radiance and irradiance are calibrated by the same calibration system and a near-synchronous calibration method, decreasing the remote sensing reflectance measurement uncertainty of 0.34%-0.83% (ratio coefficient K=1). The outdoor comparison experiment with international mainstream measurement instruments preliminarily verifies the accuracy and feasibility of the measurement.ConclusionsWe present WAOPAS that synchronously and rapidly measures sea surface radiance, sky radiance, and sea surface incident irradiance. The main features of WAOPAS include: 1) the same dispersion optical path design that ensures consistent spectral range and resolution; 2) a near-synchronous radiometric calibration of radiance and irradiance that can be traced back to the NIM, which significantly reduces Rrs measurement uncertainty; 3) the shutter synchronization and wireless remote transmission technology that enables simultaneous data acquisition by three radiometers;4) the GPS positioning and tracking technology that automatically adjusts observation geometry and avoids sun glint; 5) an automatic gain integration time design that adapts to different light intensity and water transparency; 6) an integrated instrument housing and multiple protection design that enhances stability and reliability. We evaluate WAOPAS by comparing it with HR-1024i and RAMSES in outdoor experiments and find high measurement accuracy. For the measurement and application of water objects, we conduct a continuous observation experiment at the Dongpu Reservoir in the western suburbs of Hefei. Due to space limitations, the process and results of residual item correction, data quality control, and high-resolution satellite authenticity inspection will be reported in another article.
ObjectiveThe atmospheric boundary layer (ABL) is the lowest layer in the troposphere, which is relatively more uniformly mixed under the influence of the ground-air interaction. This layer is directly affected by surface forcing during the interaction between the surface and the atmosphere, and its response time is less than one hour, usually in the range of 100-3000 m. Meteorological elements in ABLs have obvious diurnal changes, and there are multiple scales of motion, with turbulence as the main form. ABL greatly affects peoples production, life, and other activities. ABL height (ABLH) has high research significance in meteorology and other related fields. A high concentration of aerosol and water vapor in ABL contrasts significantly with a free atmosphere that is above the ABL. From the perspective of substance distribution, the atmospheric material boundary layer (AMBL) and atmospheric material boundary layer height (AMBLH) can be determined. AMBL is a part of ABL, and the characteristics of AMBLH are similar to that of ABLH but they have differences. AMBLH mainly reflects the spread of atmospheric substances and pollution in ABLs, but it is not capable of representing all turbulent motion in ABLs. ABL is closely related to air pollution, in which turbulence has a diffusion and mixing effect on air pollutants. ABLH is negatively correlated with the concentration of pollutants near the ground, and heavy pollution is often accompanied by a lower ABLH. Traditional observation techniques include radiosondes, meteorological towers, airplanes, etc., which can realize direct observation of the profile of meteorological elements and ensure the accuracy and credibility of the inversion. However, limited by cost and observation methods, such means fail to achieve long-term and continuous observation. With the development of remote sensing technology and its application in the field of meteorology, ground-based remote sensing equipment such as lidar, microwave radiometer, ceilometer, and sodar has shown their advantages in ABL observation. As an efficient ground-based remote sensing instrument, coherent Doppler lidar (CDL) can realize continuous and high-precision observation of ABLs and has been used widely in recent years.MethodsA large number of retrieval methods based on lidar data have been applied, and each of them focuses on different characteristics of ABLH and has various advantages. Thus, different results may be obtained. In order to increase the accuracy of AMBLH retrieval, we proposed a novel comprehensive AMBLH retrieval method based on several mature methods, including the gradient method, wavelet covariance transform method, and signal-to-noise weight-fraction method. The comprehensive AMBLH retrieval method contains three modules for increasing retrieval accuracy. Firstly, by summarizing various characteristics of different weather, a complex weather distinguishing method was developed. Next, based on the wavelet covariance method, a cloud-deleting module was applied. Thus, complex weather conditions and clouds would be eliminated. Finally, by inputting sunrise and sunset time information, different methods can be applied for the convective boundary layer and aerosol contamination layer between the stable boundary layer and the residual layer, respectively. With the means mentioned above, the comprehensive AMBLH retrieval method can obtain AMBLH with high accuracy and efficiency.Results and DiscussionsBy using the CDL observation experiment data in Qingdao from November 2020 to November 2021, the AMBLH in Qingdao within one year is retrieved and analyzed. All the months of the year except June and July show a clear diurnal trend of AMBLH, indicating that solar radiation heating has a great impact on the development of AMBL. The diurnal variation trend of AMBLH is not obvious for two months in summer, and it is considered that the temperate monsoon climate in Qingdao is characterized by the prevailing southeast wind from the ocean in summer. The development of AMBLH is affected by the ocean surface temperature front cold center, which increases the stability of the lower AMBL. At the same time, atmospheric mixing and sea surface wind speed are reduced, which limits the development of AMBL in both thermal and dynamic factors. Correspondingly, the median AMBLH in June and July is the lowest throughout the year.The statistical analysis of AMBLH in each season shows that the overall development degree of the seasonal diurnal variation of AMBLH is similar in spring and winter but more obvious in autumn, and the degree in autumn is higher than that in summer. A higher degree indicates a more obvious diurnal rise and fall of AMBLH. The daily mean AMBLH fluctuates less in each season, and the median of AMBLH in each season in descending order is spring, winter, autumn, and summer. In addition, the median of AMBLH in spring and winter is similar. It is found that the diurnal development and variation characteristics of AMBLH in spring, autumn, and winter are similar. Since the development of AMBL is significantly affected by solar radiation heating, it is believed that this phenomenon is caused by the small diurnal variation of temperature in Qingdao throughout the year. The timing of the uplifting trend of AMBL development in the diurnal variation of each season is different, which may be caused by the combined effect of sunrise time and seasonal temperature differences. The order from early to late is summer, spring, autumn, and winter.ConclusionsBased on a variety of well-developed AMBLH retrieval methods, we propose a comprehensive AMBLH retrieval method, which performs targeted retrieval for the difference between the mixed layer and aerosol contamination layer during the day and night and effectively removes the influence of clouds and complex weather such as rain and snow. Therefore, the accuracy of AMBLH retrieval is improved. Compared with the synchronous observation results of radiosondes, this method shows high consistency and good agreement (determination coefficient R2 =0.93). AMBLH in Qingdao in the time period of 13 months is retrieved by the comprehensive method, and the results are statistically analyzed.
ObjectiveUnlike panchromatic and multispectral images, hyperspectral images have a high spectral resolution that causes more difficult atmospheric correction. Additionally, the atmospheric correction methods and correction accuracy based on the 6S model have been catching attention. China has launched several hyperspectral imaging sensor payloads, such as Environment 1 satellite, Gaofen 5, and resource satellites. Meanwhile, these satellites play an increasingly important position in agricultural remote sensing, forestry remote sensing, environmental monitoring and other fields, and the atmospheric correction technology for these hyperspectral remote sensing satellites is constantly developing. Taking China's hyperspectral remote sensing satellite Environment 1 satellite as an example, we carry out an optimized 6S atmospheric correction method combined with NCEP reanalysis data to improve 6S atmospheric correction accuracy.MethodsFirst, considering the lack of standard reflectance products for hyperspectral images, the hyperspectral reflectance curve is constructed by the optimization estimation method and is regarded as the standard curve to verify the atmospheric correction results. Secondly, based on 6S atmospheric correction theory, we carry out sensitivity analysis and determine the most sensitive factors of aerosol optical thickness and the sensitivity of the aerosol model, atmospheric model, and atmospheric temperature and humidity to atmospheric correction coefficient. On this basis, an optimized 6S atmospheric correction method combined with NCEP reanalysis data is proposed. The aerosol optical thickness at 550 nm, atmospheric temperature and humidity profiles, and other data provided by NCEP are adopted to optimize the input parameters of the 6S model. Meanwhile, accurate atmospheric correction coefficients Xa, Xb, and Xc can be obtained, and the reflectance spectral curves of different ground objects are thus obtained after optimized atmospheric correction. Finally, by choosing Xi'an as the test area, the spectral curve of the water body is compared, and the accuracy of the correction results is evaluated via the standard curve.Results and DiscussionsThe reflectance results by the 6S model and NCEP are significantly better than those by the 6S model. Compared with the standard curve, they have the same trend in spectral reflectance, and the correlation coefficient between them can reach 0.8596 with a standard deviation lower than 0.0685 (Fig. 13). The average and standard deviations of pixel-by-pixel error of ground reflectance in each band are close to 0.02, which demonstrates that the optimized 6S model with NCEP data has obvious improvement on the atmospheric correction.ConclusionsThe absolute error of the reflectance curve and the standard curve obtained by the atmospheric correction of the 6S model optimized by the NCEP data is much lower than that of the 6S model, and the average absolute error of each band is also less than that of the 6S model. The correlation coefficients of the three characteristic bands are higher than 0.85, the standard deviation is less than 0.07, and the mean and standard deviations of the ground reflectance per pixel error in each band are close to 0.02. Additionally, the determination coefficient between the ground object reflectance curve and the standard curve obtained by 6S+NCEP data reaches 0.78, which is higher than that by the 6S model. Meanwhile, the spectral angle of the optimized 6S model is reduced by 2.3565 and less than that of the 6S model, which indicates that the corrected spectral curve of the optimized 6S model is closer to the standard data. In conclusion, the atmospheric correction method in the 6S model of NCEP-assisted data optimization for HSI hyperspectral images can effectively improve the atmospheric correction effect.
ObjectiveIndustrial chimneys, ship exhaust, and volcanic eruption processes can emit large amounts of harmful SO2 into the atmosphere, causing serious pollution to the environment. The development of effective SO2 monitoring tools can provide a strong guarantee for atmospheric environmental management. In recent years, SO2 ultraviolet (UV) cameras have been rapidly developed and widely applied by virtue of their high spatio-temporal resolution, high detection sensitivity, and two-dimensional detection imaging capability. Due to the limitation of physical principles, the initial amount measured by the SO2 UV camera is the optical thickness of SO2 gas, which needs to be retrieved into a concentration image with the help of calibration curves, and the accuracy of calibration curves directly affects the accuracy of SO2 concentration results. Cell calibration and differential optical absorption spectroscopy (DOAS) calibration are two main methods for obtaining calibration curves. In terms of equipment cost, easy operation, and system stability, the cell method is significantly better than the DOAS method, but its calibration accuracy is seriously affected by the light dilution effect, reflections on the windows of the calibration cell and filter, and aerosol scattering factors. Additionally, with the rising detection distance, the above factors, especially the influence of the light dilution effect, become increasingly more serious. To improve the calibration accuracy of the cell method, we research the calibration error correction method to address the practical problem of inaccurate cell method calibration in remote SO2 monitoring.MethodsIn practice, since the factors affecting the accuracy of the cell method are mainly from the light dilution effect, window reflection, and the scattering of aerosols, it is necessary to correct each of these factors. The specific method is as follows. Firstly, the image correction method (ICM) is proposed for correcting the light dilution effect, and the extinction coefficient is obtained by fitting the intensity information of the measurement points at different distances in the UV camera images. Additionally, the optical thickness image of the cell at the measured distance is calculated by the extinction coefficient, and then the calibration curve with the correction of the light dilution effect is obtained. Then, based on the analysis of window reflection and aerosol scattering effect, the influence of the reflection effect and scattering characteristics on the calibration results are quantified. Finally, the calibration curves with the correction of light dilution effect and scattering characteristics are calculated by combining the above influencing factors.Results and DiscussionsBased on the Etna volcanic plume image data captured by Professor Jonas Gli? from the Norwegian Air Research Institute using a SO2 ultraviolet camera, the Etna volcanic plume SO2 concentration image is retrieved by calibration curves before and after the correction of the light dilution effect. The results are compared with the retrieval results of the DOAS calibration curve, and the results show that the correction of the light dilution effect can reduce the differences between the cell method and the DOAS method from 59.0% to 31.3%, which verifies the effectiveness of ICM in correcting light dilution effect. After correction for reflection and scattering effects, the difference between the cell method and the DOAS method is reduced to 7%. The cell method and DOAS method show good agreement in the time domain after correction, and the fitting curve slope of the primary function of the calibration results is 0.924, with a goodness-of-fit of 0.998.ConclusionsThe results show that the proposed error correction method for cell calibration of the SO2 UV camera can improve the calibration curve accuracy. The fitting accuracy of the extinction coefficient and the measurement accuracy of the filter reflectance and the quartz window directly affect the accuracy of the calibration curve. The error analysis results show that a 10% shift in the extinction coefficients εA and εB obtained from channels A and B fitting will cause an error of 8.44% and 13.57% for SO2 column density retrieval respectively, while a 10% shift in background light intensity will result in an error of 4.98% for SO2 column density retrieval. Additionally, a 10% error in the filter reflectance and the quartz window will result in a 6.26% and 1.95% shift in the SO2 column density respectively. Increasing the interval distance of sampling points and the number of sampling points can improve the fitting accuracy of the extinction coefficient. The high-resolution UV spectrometer ensures that the filter reflectance and the quartz window are accurately measured to control errors caused by the reflectance uncertainty. The proposed error correction method for calibration curves solves the limitation that the cell method cannot be applied to monitor the plumes at long distances and high carbon black concentrations, which is important for better applications of SO2 UV cameras in volcanoes, ships, and industrial chimneys.
ObjectiveUnderwater wireless optical communication (UWOC) has caught much attention due to its wide frequency band, high information capacity, and fast data transmission rate. However, ocean turbulence causes light intensity scintillation during beam propagation, which increases the difficulty of optical signal resolution in UWOC systems. During establishing underwater optical communication links, Hermite-Gaussian (HG) beams can help to improve system performance by reducing scintillation. Most of the performance studies on current HG UWOC systems employ stable stratification turbulent power spectra, whose computational accuracy cannot match unstable stratification cases. Additionally, current research on UWOC is at the level where the system pointing error must be considered, but this aspect is not addressed in the study of the HG UWOC. According to the literature findings, the study of average bit error rate (BER), average channel capacity, and outage probability of UWOC systems based on unstable stratified ocean turbulence and HG beam pointing error is not reported. Therefore, we investigate the performance of the HG beam wireless optical communication system under unstable stratified ocean turbulence.MethodsWe derive the theoretical formulae for the HG optical scintillation index under unstable stratified ocean turbulence and the probability distribution function of the channel coefficients of UWOC systems considering the combined effects of ocean turbulence and pointing error. Meanwhile, theoretical formulae for the main performance parameters of the system are derived, including BER, channel capacity, and outage probability. Additionally, we derive the closed-form expressions for these three performance parameters using the Gaussian-Hermite orthogonal integral approximation method, thus conducting an in-depth analysis of the system performance. To more comprehensively evaluate the system performance in different conditions, we perform simulations to analyze the effects of beam modulus, transmission distance, ocean turbulence, and pointing error on the average BER, average channel capacity, and outage probability of the system under unstable stratification and stable stratification turbulence.Results and DiscussionsWe investigate the performance of HG beam wireless optical communication system under unstable stratified ocean turbulence. The results show that the system BER can be reduced by decreasing the beam width, the HG beam width is reduced from 0.05 m to 0.01 m at an SNR of 30 dB, and the average BER is reduced from 6.18×10⁻⁷ to 2.0×10⁻⁸. The increase in transmission distance results in the rising system BER. Additionally, we compare the differences in the effects of system performance on unstable stratification and stable stratification turbulence. It is found that the average BER for the stable stratification case in temperature-induced ocean turbulence is much lower than the average BER for the unstable stratification case. Since the eddy thermal diffusivity of seawater should be greater than the salt diffusivity in a temperature-induced ocean environment, the stable stratification assumption underestimates the ocean turbulence intensity. The system performance in the unstable stratification case is better when induced by salinity. Under the stable stratification assumption, the average channel capacity can be close to 0 in certain conditions to prevent reliable communication. In contrast, the average channel capacity in the unstable stratification case is greater than that in the stable stratification case. Meanwhile, the increase in the mean square temperature dissipation rate and the decrease in the turbulent kinetic energy dissipation rate per unit mass of fluid lead to decreased average channel capacity and increased outage probability. This indicates turbulence intensity increase, thus causing deteriorated system performance. Finally, as the variance of the pointing error increases, the light intensity at the receiver end becomes weaker and cannot meet the requirements of the resolved signals, with degraded system performance.ConclusionsWe investigate the performance of a wireless optical communication system using the HG beam under unstable stratified ocean turbulence. Meanwhile, The closed-form expressions for the scintillation index of the HG beams and the average BER, average channel capacity, and outage probability of the optical communication system which take into account the pointing error are derived from the power spectra of the unstable stratified ocean turbulence. The simulations analyze the effects of beam modulus, transmission distance, ocean turbulence, and pointing errors on the system performance. The results show that the unstable stratification theory can correct the bias of ocean turbulence intensity caused by the stable stratification assumption, and then reduce the calculation errors of BER, channel capacity, and outage probability of the UWOC system, and have better system performance in the salinity-induced cases. Additionally, the increasing mean square temperature dissipation rate leads to a decreasing turbulent kinetic energy dissipation rate per unit mass of fluid, rising pointing error, reducing system channel capacity, and increasing outage probability. The results have implications and significance for studying underwater optical communications.
ObjectiveWith the rapid development of nuclear energy and technology, more nuclear power plants are being built and operated worldwide. Due to the need for large amounts of cooling water, most nuclear power plants are located near coastal or inland rivers, which increases the risk of radioactive pollution in surrounding waters. Traditional detection methods of radionuclides in water often have some problems such as tedious detection processes and high detector costs. They also cannot reflect the toxic effect of radionuclides on organisms and do not meet the needs of in situ rapid detection of radionuclide pollution in water. Algae fluorescence induction kinetics technology has been widely used in toxicity detection of heavy metals, pesticides, and other pollutants in water in recent years due to its simplicity, rapidity, and non-destructive characteristics. However, it is still unknown whether the algae fluorescence induction kinetic technique can be applied to the field rapid detection of radionuclide toxicity in water. Therefore, we study the response rules and characteristics of algae rapid chlorophyll fluorescence induction kinetic line and commonly used photosynthetic fluorescence parameters to the short-term toxicity stress of three common radionuclides. In this way, we determine the feasibility of the application of algae fluorescence induction kinetic technique to the field detection of radionuclide toxicity in water.MethodsChlorella pyrenoidosa, a common freshwater green algae, is used as the test organism, and three typical radionuclide pollutants strontium (90Sr), cesium (137Cs) and cobalt (60Co) are studied. By using the fluorescence induction kinetics method, we study the toxicity response rules and characteristics of fast chlorophyll fluorescence induction kinetics (OJIP) curve, maximum photochemical quantum yield (Fv/Fm, where Fv is variable fluorescence, and Fm is maximal fluorescence) and photosystem II performance parameters (PIABS) under 180 min short-term stress of 90Sr, 137Cs and 60Co. The feasibility of the application of algae fluorescence induction kinetics technique to the rapid detection of radionuclide toxicity in water is determined. By establishing two photosynthetic fluorescence parameters and three radionuclides dose-response curves, we analyze the 20% effect concentration (EC20) and 50% effect concentration (EC50) of Fv/Fm and PIABS to further compare the toxicity response of Fv/Fm and PIABS to three radionuclides. Finally, we select the best toxicity response index which can be used for sensitive detection of radionuclide toxicity in water.Results and DiscussionsThe three radionuclides 90Sr, 137Cs, and 60Co can damage the photosynthetic system of chlorella pyrenoidosa and inhibit the activity of photosystem II and electron transfer, thereby inhibiting the photosynthesis of chlorella pyrenoidosa and finally leading to changes in the OJIP curve (Fig. 1). Therefore, microalgae fluorescence dynamics technology can be applied to the rapid detection of radionuclide toxicity in water. By studying the response characteristics of the photosynthetic fluorescence parameter Fv/Fm to the toxicity of three radionuclides 90Sr, 137Cs, and 60Co, we find that the inhibition degree of the three radionuclides to Fv/Fm is continuously enhanced within 180 min, and the toxic response of Fv/Fm to three radionuclides is activity concentration- and time-dependent (Fig. 2). The adjusted coefficient of determination (adj-R2) obtained by Logistic fitting curves between Fv/Fm inhibition rate and nuclides activity concentration are all greater than 0.9, indicating that the three radionuclides and Fv/Fm have good Logistic dose-response relationships (Fig. 3). Therefore, Fv/Fm can be well used in the detection and evaluation of radionuclide toxicity. Within 180 min of exposure, the photosynthetic fluorescence parameter PIABS has activity concentration- and time-dependent toxicity response to the three radionuclides (Fig. 4). The adj-R2 obtained by the Logistic fitting curves between PIABS inhibition rate and nuclides activity concentration are all greater than 0.9, indicating that the three radionuclides and PIABS also have good Logistic dose-response relationships (Fig. 5). Therefore, PIABS can be used in the detection and evaluation of radionuclide toxicity. In addition, by comparing the EC20 and EC50 values obtained based on the two photosynthetic fluorescence parameters, we find that the EC20 (Fig. 6) and EC50 values (Fig. 7) obtained based on Fv/Fm of the three radionuclides are greater than those obtained based on PIABS. It shows that the photosynthetic fluorescence parameter PIABS has more sensitive response characteristic to radionuclide toxicity than Fv/Fm.ConclusionsUnder short-term exposure for 180 min, three typical radionuclides 90Sr, 137Cs, and 60Co have significant toxic effects on the photosynthesis of chlorella pyrenoidosa, resulting in a significant change in the shape of OJIP curves and significant inhibition of photosynthetic fluorescence parameters Fv/Fm and PIABS of chlorella pyrenoidosa. Thus, the fluorescence induction kinetics of microalgae can be used for rapid detection of radionuclide toxicity in water. The two photosynthetic fluorescence parameters Fv/Fm and PIABS obtained based on fluorescence induction kinetics have good Logistic dose-response curves with 90Sr, 137Cs, and 60Co. They have a certain time-dependent response to the toxicity of 90Sr, 137Cs, and 60Co. Therefore, Fv/Fm and PIABS can be used as toxicity response indexes to detect radionuclide toxicity in water based on fluorescence kinetics. By comparison, the response sensitivity of PIABS to the toxicity of three radionuclides under short-term exposure for 180 min is significantly better than that of photosynthetic fluorescence parameter Fv/Fm. This indicates that PIABS is the best toxicity response index for sensitive detection of radionuclide toxicity in water based on microalgae fluorescence kinetic technique. Our study provides a method basis for the rapid detection of radionuclide toxicity in the water environment and a new idea for emergency monitoring and early warning of nuclear leakage accidents in inland nuclear power plants. It has practical significance for ensuring the safety of water ecological environment.
ObjectiveNitrogen dioxide (NO2) in the atmosphere has an important impact on air quality and climate change, and ground-level NO2 will directly affect human health. China is one of the regions with high concentrations of NO2 in the world. Long-term surface NO2 concentration data has been provided by China Environmental Monitoring Station since 2013. In addition, the satellite data can make up for the lack of coverage of ground stations. Compared with the previous ozone detector (OMI) sensor, tropospheric detector (TROPOMI) has higher data coverage and spatial resolution, but its potential for ground-level NO2 estimation needs to be proved, and the underestimation of the estimation model predicting high-value samples needs to be optimized. The purpose of this paper is to use machine learning algorithms to estimate ground-level NO2 concentration in China based on satellite observation data and obtain 0.05-degree NO2 concentration raster data from 2014 to 2021. On this basis, a systematic comparative study is carried out on the difference in the estimation results of TROPOMI and OMI sensor observations, and an optimization model is established to optimize the underestimation of the conventional machine learning model in the high-value area.MethodsThe dataset in this paper contains the observations of ground-level NO2 concentration from ground stations, the tropospheric NO2 column concentration provided by OMI and TROPOMI which come from European Space Agency and Google Earth Engine, and auxiliary data that contains meteorological data of ERA5, population data, surface elevation data, and land use data. Data preprocessing includes assigning station data to the nearest grid and resampling data with different spatial resolutions to 0.05 degrees. The dataset and the algorithm are used to build a model with the algorithm named XGBoost, which is optimized on the basis of GBDT, so as to have higher prediction accuracy. The features of the model are selected by variance inflation factor (VIF) and analyzed by shapley additive explanation (SHAP) value. By comparing the temporal and spatial coverage of TROPOMI and OMI sensor observation data and comparing satellite imagery and estimation results for a specific area, we study the difference between these two data in estimating ground-level NO2 concentration. In addition, the estimation model is optimized by establishing an ensemble model that contains a classification model and a high-value prediction model.Results and DiscussionsUneven spatial distribution of ground stations will cause the estimation results to present the same value in the area with fewer ground stations, so the accuracy of estimation will be poor (Fig. 2). The VIF of features that connect with geographic information is much higher than the threshold, which is supposed to be 10, and the VIF of surface pressure and DSM is out of the threshold (Fig. 3). After comparing the correlation coefficient between the two and the surface observations and the update frequency of the two, we decide to remove the surface elevation and retain the surface pressure. Feature importance of the OMI data computed by SHAP value is 6.09, which is much more than those of others (Fig. 3). According to the Beeswarm from SHAP value of each feature, it can be found that when the observed value of OMI is higher, it will have a positive effect on the predicted value, or in other words, when the observed value of OMI is higher, it will lead to an increase in the predicted result, and when it is lower, it will make prediction results decrease (Fig. 3). The temporal and spatial resolution of TROPOMI data is higher than that of OMI (Fig. 4), and the machine learning accuracy evaluation index of the estimation result is better than that of OMI (Fig. 5). By comparing satellite observations and estimating specific regions with ground-based observations, it is found that TROPOMI data with higher spatial resolution can identify changes from spatial gradient that fails to be identified in OMI data, resulting in more accurate estimates (Fig. 6). By classifying high-value samples first and then building an additional high-value sample model for estimation, the optimized estimation model successfully increases the slope of the scatter diagram of the estimation results from 0.79 to 0.89, and the R2 increases from 0.79 to 0.85 (Fig. 7). It can also be seen from the image that the estimation results of the optimized model are closer to the ground observations (Fig. 8).Conclusions1) There is serious multicollinearity in the latitude and longitude information in the prediction model variables, which will affect the quality of model estimation; 2) The data coverage of TROPOMI is higher than that of OMI, and the estimation result is better than that of OMI, ten-fold cross-validation (R2: 0.79 VS 0.75, slope: 0.79 VS 0.74); 3) The high spatial resolution of TROPOMI can identify high or low NO2 near-surface areas that cannot be identified by OMI; 4) By establishing an integrated model and selecting high-value samples for separate processing, the prediction accuracy can be significantly improved; R2 is increased from 0.79 to 0.85, and the slope of the fitting line is increased from 0.79 to 0.89.
ObjectiveIn recent years, many cities in China have gradually changed from single-type particulate matter pollution to compound air pollution, with increasingly prominent ozone pollution in summer especially. The Yangtze River Delta where Hefei City is located is the region with the most serious ozone pollution in summer. Thus, we analyze in depth the changes in summer ozone concentrations and solar radiation intensity in Hefei by combining two experimental methods of observational analysis and numerical simulations to understand the possible correlations between them. Numerical modeling is also adopted to reproduce the daily variations in solar radiation intensity and ground-level ozone concentrations in different weather conditions. The contribution of each physicochemical process to ozone production is quantified by the process analysis techniques embedded in the model, and the details of the influence of gas-phase chemistry, dry and wet depositions, and diffusive transport on ozone concentrations in different weather conditions are distinguished. Our study is expected to explore the effect of solar radiation on ground-level ozone concentrations with the help of sophisticated observations and effective simulations to deepen the understanding about the intrinsic mechanism of solar radiation directly and indirectly affecting ozone concentrations. Finally, we can analyze the causes of urban ozone pollution in summer in a more scientific manner and provide a necessary theoretical basis for the effective prevention and control of ozone pollution.MethodsMS-711 is a new generation of all-weather grating spectroradiometer, which measures in the spectral range of 300-1100 nm with a spectral resolution of less than 7 nm. The data for the air quality model are obtained from the final operational global analysis (FNL) project, and the emission inventory of the pollutant sources is provided by the multiresolution emission inventory model for climate and air pollution research (MEIC). The ozone concentration data are obtained from the Hefei Ambient Air Quality Monitoring Station. WRF v4.1 and CAMx v7.10 are utilized for the numerical modeling of meteorological fields and air quality. The model employs a three-layer nested grid with grid side lengths of 27, 9, and 3 km, ranging from Northeast Asia, Eastern China, and Hefei City and its surroundings respectively. The WRF microphysics is the Morrison double-moment scheme, and the cumulus parameterization is the Grell 3D ensemble scheme. The gas phase chemistry mechanism of CAMx is CB05, and the secondary organic aerosol scheme is CF. We also leverage time-lagged correlation analysis (TLCC) to assess the relationship between solar radiation intensity and ground-level ozone concentrations. Meanwhile, TLCC is adopted to calculate the correlation of one time series with another at different points in time. We shift the ozone concentration series backward by a certain amount of time and then calculate the correlation coefficient between it and solar radiation intensity. The integrated process rate analysis (IPR) method is a process analysis technique that combines chemical kinetic modeling and statistical analysis methods embedded in the CAMx model. Additionally, we employ it to analyze the effects of a variety of chemical reactions and physical processes on ozone generation and elimination rates to determine the rates and understand the ozone generation and elimination mechanisms.Results and DiscussionThe observations and numerical simulations confirm that the zone peak of summer daytime occurs approximately 2-3 h after the peak solar radiation intensity (Fig. 3). From layer 1 to layer 5, the ozone concentrations increase gradually with the rising height (Fig. 5). The contributions of ozone sources in the near-surface layer (layer 1) are as follows. The vertical diffusion process from high altitude to the ground contributes a generation rate of +8.87×10⁻⁹ h-1, which is a main reason for ozone concentration increase, while the contribution of dry depositions is -8.12×10⁻⁹ h-1 and it is the main ozone scavenging process (Fig. 6). Layer 6-layer 7 correspond to altitudes of 1931-3371 m, and the main reason for low ozone concentrations is due to the rapidly decreased contribution of photochemical processes (Fig. 5). The ozone accumulation on sunny days comes from photochemical processes first, and when the solar radiation intensity decreases, the large input of ozone generated in the upper part of the boundary layer is the key factor in maintaining the ozone concentrations. However, the ozone concentrations maintain a slowly decreasing trend in the following hours due to the convection development in the late afternoon, which blocks subsidence [Fig. 7(a)]. On rainy days, Vc (contribution of chemical processes) values are small, slowly coming, and short-lived, while the significantly enhanced Vtp (contribution of diffusive transport at the upper interface) throughout the afternoon hours is the primary reason for the growth and maintenance of ozone concentrations [Fig. 7(b)]. On cloudy days, solar radiation dominates the ozone growth stage, and dry and wet depositions and horizontal fluxes dominate the ozone decline stage [Fig. 7(c)].ConclusionsThe vertical motion of the atmosphere exerts a significant effect on near-surface ozone concentrations. The ozone concentrations gradually increase from the ground up to approximately 1 km, with a positive contribution from the downward movement of the air that transports the high ozone concentration in the upper layers to the near-surface during sunny days and a negative contribution from the upward movement of the air that dilutes the ozone concentration in the air below the boundary layer during rainy days. The daily variations in ozone concentrations in different weather conditions are closely related to the contribution of several mechanisms. Solar radiation-driven photochemical reactions, diffusive transport, and wet and dry depositions affect ozone production at different moments and altitudes, and the process analysis results show that the quantitative contributions can explain the daily variability of ozone concentrations characterized by different weather conditions.
ObjectiveSince the middle of the 20th century, due to the greenhouse effect, the global average surface temperature has increased by 0.85 ℃ between 1880 and 2012, and larger scale temperature increases have been investigated in some regions. Atmospheric carbon dioxide, as one of the important gases causing the greenhouse effect, plays an important role in global climate change. Due to the characteristics of large emissions and easy accumulation, carbon dioxide is often used as the main indicator of energy conservation and emission reduction. Understanding the spatiotemporal distribution pattern of atmospheric CO2 concentration in different regions can help to grasp the footprint of the“source”and“sink”of CO2 gas, which is conducive to achieving emission reduction control in China and accelerating the high-quality development of green and low carbon. The traditional methods of observing CO2 concentration use various meteorological satellites equipped with passive remote sensing observation instruments to observe the global large-scale CO2 concentration. However, passive remote sensing is limited by its observation characteristics, and there are problems such as difficult measurement at night, poor detection performance in high latitude regions, vulnerability to clouds and aerosols, and insufficient near-surface CO2 observation accuracy. As one of the active remote sensing technologies, coherent differential absorption lidar technology can work all day and detect with high accuracy. Compared to ground-based or airborne CO2 column concentration observation methods, it can provide CO2 concentration profile observation results with higher resolution. This observation method combines two technical systems, i.e., optical heterodyne and differential absorption, and can achieve high sensitivity, high integration, and diversified detection of atmospheric parameters. Coherent differential absorption lidar can obtain information about the vertical profile of carbon dioxide concentration and has the ability to detect point sources, cities, and key areas with high accuracy. However, its system structure is complex, and its development is difficult in the case of limited detection energy, with relatively little research. To assist in the parameter design of the lidar hardware system and explore the detection performance of the system, we explore the impact of atmospheric and optical parameter changes on the differential optical thickness calculation and theoretically analyze the error of the system in retrieving CO2 concentration.MethodsDifferential absorption optical thickness refers to the difference in the ratio of backscatter signals at two wavelengths in the carbon dioxide differential absorption lidar detection system. It represents the difference in the two laser backscatter signals caused by the absorption of carbon dioxide molecules and the absorption effect of carbon dioxide molecules on a specific emitted laser on the detection path. Using typical optical parameters of the lidar system and the atmospheric parameters, we simulate the backscatter signals at different detection altitudes within the range of 0-3 km and calculate the differential optical thickness for different distances. By setting a certain amount of deviation for the parameter model used, we explore the impact of these parameter changes on the accuracy of differential optical thickness calculation. In the pre-research stage of a micro pulse coherent differential absorption lidar system, the results of the error estimation are of great significance for the design of hardware system parameters and the evaluation of system performance. For the inversion of carbon dioxide concentration from monopulse backscatter signals, based on the differential absorption principle, it can be approximated that the aerosol backscattering and atmospheric extinction in the atmospheric environment remain constant. As a result, the instability of differential optical thickness caused by the hardware system acquisition can be ignored. We evaluate the detection performance of the system by exploring the relative system error caused by the uncertainty of relevant parameters in the carbon dioxide concentration inversion method.Results and DiscussionsThrough the simulation, we find that at different altitudes, the variation trend of differential optical thickness with the increase in wavelength offset is consistent, showing a trend of increasing first and then decreasing. This indicates that the absorption of probe laser energy at different altitudes increases first and then decreases with the increase in wavelength offset. In the altitude range of nearly 3.5 km, when the wavelength offset is less than 0.5 pm, the relative system error is less than 0.015%. As the wavelength offset increases, the relative system error of differential optical thickness at different heights also increases. At different altitudes, with the increase in temperature offset, the differential optical thickness also shows a downward trend. When the temperature deviation is less than 1 K, the relative system error of differential optical thickness for each altitude layer is less than 0.34%. The pressure measurement deviation does not have a specific impact on calculation results of differential optical thickness. Within the entire simulation range, the pressure offset has a small impact on the calculation of differential optical thickness, with an overall relative error of less than 0.008%. Aiming at the key parameters in the CO2 concentration inversion method for the coherent differential absorption lidar system, we investigate the error in CO2 concentration inversion caused by their uncertainty. The results show that the total error caused by each parameter for the system is 0.45%. If the average CO2 concentration in a certain distance is 4×10⁻⁴, the overall absolute error of the system is 1.8×10⁻⁶.ConclusionsWe introduce the simulation calculation and error analysis of micropulse coherent differential absorption lidar. For the typical system optical parameters and the atmospheric parameters, we conduct a simulation to obtain the backscatter signal detected by the lidar system and calculate differential optical thickness at different heights. By setting different offsets for the parameter model, we explore their impact on the accuracy of optical thickness calculation. In addition, we theoretically analyze the uncertainty errors of atmospheric parameters (atmospheric temperature, atmospheric pressure, and water vapor concentration) and the errors introduced by the wavelength drift of the lidar system for a certain altitude and distance database. In addition, the absolute errors of CO2 concentration inversion caused by these error sources are evaluated. These works are important in the pre-research stage of lidar systems, and the results of simulation calculations and error analysis are of great significance for hardware system parameter design and system performance evaluation.
ObjectiveAtmospheric aerosols play a crucial role in climate change and atmospheric pollution. Multi-wavelength Raman lidars and lidars with high spectral resolution can accurately measure aerosol extinction and backscatter coefficients for retrieving aerosol particle size distribution, volume concentration, effective radius, and other microphysical properties, which is significant for studying regional and global ecological environments. However, retrieval errors exist in the extinction and backscattering coefficients detected by lidars. When the aerosol microphysical properties are retrieved, the number of unknown parameters required to be solved is often greater than that of optical measurement channels, which is a typical ill-posed inverse problem. As the retrieved results show significant uncertainty in some cases, additional constraints should be introduced to improve the retrieval stability. We propose an advanced regularization retrieval algorithm that introduces a priori mode radius range as a constraint to improve the retrieval accuracy of particle size distribution parameters of different aerosol types.MethodsIn our study, an advanced retrieval algorithm for aerosol microphysical properties based on the regularization method is developed. The entire algorithm process is shown in Fig. 1. Based on the Tikhonov regularization retrieval, the reliable retrieval of microphysical particle properties can be realized with a combined data set of particle backscattering coefficients at 355, 532, and 1064 nm and extinction coefficients at 355 nm and 532 nm. Generally, only those solutions for which the optical discrepancy term takes its minimum are selected in retrieval, but here all individual solutions that are within a certain range around this minimum solution are averaged. As a result, the retrieval stability can be improved. Additionally, referring to the aerosol models from the AERONET database, we obtain the volume mode radius ranges of coarse and fine mode aerosols. By employing this as a priori constraint, further selection is performed on the reconstructed particle size distribution to obtain the final retrieved results after averaging.Results and DiscussionsTo test the effectiveness of a priori mode radius constraints on improving the retrieval accuracy of particle size distribution, we conduct the simulations of four typical tropospheric aerosol types: (i) urban aerosols, (ii) smoke aerosols, (iii) desert dust aerosols, and (iv) marine aerosols, with parameters derived from observation data from several AERONET stations. Fig. 2 compares the distribution changes of reconstructed particle sizes after introducing a priori constraints. Meanwhile, Table 2 quantitatively compares the results in Fig. 2 by adopting mean relative errors as the evaluation index. The comparison results indicate that introducing mode radius constraints significantly improves the retrieval results of coarse mode aerosols. Referring to the range of aerosol microphysical parameters (Table 3) given in historical data, we generate 1500 sets of bimodal log-normal distribution data to test the algorithm. Considering the effect of 20% random Gaussian noise, the relative errors of the retrieved effective radius, volume concentration, and surface area concentration are controlled within the range of ±33%,±45%,and ±50% respectively in the cases over 90%. This indicates that the algorithm has sound stability and can tolerate input error effects within a certain range.ConclusionsWe propose an advanced retrieval algorithm for aerosol microphysical properties based on the regularization method, which significantly improves the stability and accuracy of retrieval and solves the problem of large retrieved errors in some cases. The proposed algorithm improves the remote detection technology of aerosols by multi-wavelength lidars. These measurements can provide accurate information about aerosol microphysical properties. The vertical profile of aerosol parameters obtained from lidar detection can be a great improvement of aerosol modeling, which will help study the influence of aerosols on climate and environment.
ObjectivePure rotational Raman scattering lidar is an important remote sensing tool for atmospheric temperature measurement. However, traditional backward pure rotational Raman scattering lidar has limitations in achieving effective atmospheric temperature detection in the lower atmosphere due to the overlap function effect of lidar systems. We present a novel technique of lateral scanning pure rotational Raman scattering lidar for accurate measurement of atmospheric temperature without the influence of blind zones and transition zones, which employs the bistatic structure of lidar systems. The atmospheric temperature profiling is realized by the detection of high- and low-quantum-number transitions of lateral pure rotational Raman scattering spectra at different heights, which is performed by elevation angle scanning of the lateral receiver system. The biggest advantage of this technique is the utilization of continuous-wave lasers as the excitation source, which not only significantly reduces equipment costs but also facilitates convenient mobility for outdoor observations.MethodsThe lateral pure rotational Raman scattering lidar technique is studied in the accurate measurement applications of atmospheric temperature from the ground to the height of interest. First, a novel lateral scanning pure rotational Raman scattering lidar technique is proposed and systematically designed. Each telescope combined with a narrow-band interferometric filter is adopted to detect the lateral scattering signals of the low- and high-quantum-number transitions of pure rotational Raman scattering spectra. Then, the atmospheric temperature inversion algorithm for lateral scanning pure rotational Raman scattering lidar is established and the calibration function is optimized to improve the inversion accuracy of atmospheric temperature. Finally, the experimental system is constructed, and the preliminary experiments are conducted using the lateral scanning pure rotational Raman scattering lidar. Two different rotation schemes including the continuous equidistant resolution and segmented equidistant resolution are employed during the experimental observations.Results and DiscussionsThe detection principle of the proposed Raman scattering lidar is innovatively presented. It breaks through the traditional backward pure rotational Raman scattering lidar using a monostatic transceiver system structure, which produces blind and transition zones that cannot realize effective detection of near-surface atmospheric temperature. Meanwhile, this technology can leverage a continuous-wave laser, which features light weight, portability, mobility, and low cost (Fig. 1). By analyzing the eight newly expanded calibration functions, the calibration function that introduces the smallest error is selected as the expression for atmospheric temperature detection by a lateral pure rotational Raman scattering lidar (Fig. 2). Based on completing the lateral pure rotational Raman scattering lidar system design, the lateral Raman scattering lidar system is constructed (Fig. 3). Preliminary experimental observational studies of a lateral scanning pure rotational Raman scattering lidar are performed by two different rotation schemes of the continuous equidistant resolution and segmented equidistant resolution, which are employed during the experimental observations. The experimental results show that the lateral scanning pure rotational Raman scattering lidar has precise detection capability of atmospheric temperature up to a height of 1400 m. Furthermore, the segmented equidistant resolution rotation scheme provides a finer spatial distribution of temperature within the height interval of 0-312 m (Figs. 4-7),compared with the continuous equidistant resolution rotation scheme.ConclusionsWe propose a novel lateral pure rotational Raman scattering lidar technique to realize non-blind detection of the temperature profile distribution in the lower atmosphere. The profiling of lidar returns in the lateral pure rotational Raman scattering lidar is performed by elevation angle scanning of the lateral receiving system. Meanwhile, the intensities of the lateral Raman scattering signals at each setting of elevation angles are sampled and analyzed, and the biggest advantage of this technique is that a low-cost continuous laser can be employed as the excitation light source to simplify the system and reduce costs. Additionally, the pulsed laser in the backward pure rotational Raman scattering lidar can be adopted as the transmitter to construct a lateral + backward pure rotational Raman scattering lidar for finely detecting the atmospheric temperature from the ground to the height of interest. The preliminary experimental results show that the atmospheric temperature below the height of 1400 m can be detected finely with the 60 m distance between the transmitter and receiver. The segmented equidistant resolution rotational scheme can realize a more refined temperature profile than the whole continuous equidistant resolution rotation scheme.
ObjectiveAccurate monitoring of nitrogen dioxide (NO2), a significant atmospheric pollutant, is essential for effective environmental management. Differential absorption lidar (DIAL) technology has emerged as a robust approach to address this challenge. However, the wavelength dependency of aerosol optical properties has a substantial impact on NO2-DIAL measurements. Previous studies mostly focus on the narrow-band NO2-DIAL technique without considering the spectral width of the emitted laser pulse. Therefore, the influence of aerosol optical properties on the retrieved NO2 mass concentration of the broad-band DIAL technique remains unclear. We aim to investigate aerosol-induced NO2 mass concentration errors under various atmospheric conditions through simulation studies and an approximation method for the broadband NO2-DIAL technique. We hope that this research can offer valuable insights into comprehending the influence of aerosol optical properties on broadband NO2-DIAL techniques.MethodsWe carry out research based on the broadband NO2-DIAL technique (Fig. 1) employing the Scheimpflug principle. The broadband NO2-DIAL system utilizes image sensors as detectors and high-power laser diodes as light sources (wavelength is 450 nm, power is 1.6 W), with an emission spectral typically ranging from 1-2 nm (full width at half maximum). Two different methods (the simulation method and the approximation method) have been adopted to elucidate the influence of atmospheric aerosols on the broadband NO2-DIAL technique. The broadband DIAL equation has been established, based on which simulated atmospheric lidar signals can be obtained with measured laser spectra and different atmospheric parameters, e.g., aerosol extinction coefficient, backscattering coefficient and ?ngstr?m exponent (Fig. 5). Therefore, the NO2 mass concentration containing the aerosol-induced retrieval errors can be acquired through segmented fitting for the simulated atmospheric lidar signals (Fig. 6). As a result, the NO2 mass concentration errors introduced by the aerosol extinction effect and the aerosol backscattering effect under various atmospheric conditions can be obtained through numerical calculation. Besides, the aerosol-induced NO2 mass concentration errors can also be mathematically derived based on spectral approximation—the approximation method. Meanwhile, cross-validations between the aerosol-induced NO2 mass concentration errors obtained from these two methods have also been carried out.Results and DiscussionsSeveral conclusions can be drawn according to simulation studies. When the atmospheric condition is homogeneous, for an extinction coefficient of 0.3 km-1 and an ?ngstr?m exponent of 3, the aerosol-induced retrieval error of the NO2 mass concentration is 14.7 μg/m3, while the error introduced by the aerosol backscattering effect is only about 0.6 μg/m3 (Fig.7). Therefore, when atmospheric aerosols are homogeneously distributed, the inversion error of NO2 mass concentration mainly depends on the aerosol extinction coefficient. The proportion of the NO2 mass concentration inversion error generated by the backscattering effect is generally less than 5%, which can be ignored. Besides, if the ?ngstr?m exponent approaches 1, the NO2 mass concentration error introduced by the aerosol extinction effect will decrease to 5 μg/m3 (Fig. 9). If aerosol plumes appear in a homogeneous atmosphere (0.3 km-1), for the extinction coefficient of 0.66 km?1 within the inhomogeneous range and an ?ngstr?m exponent of 3, the NO2 mass concentration error resulted from the aerosol extinction coefficient in the inhomogeneous region is 18.9 μg/m3. However, the error introduced by the aerosol backscattering effect increases to 3.3 μg/m3 with a fitting distance of 500 m (Fig. 11). Under typical weather conditions with a relatively small ?ngstr?m exponent of 1, the NO2 mass concentration error introduced by the aerosol backscattering effect will increase to 6.8 μg/m3 (Fig. 12). The simulation results indicate that the inversion error of aerosol backscattering effect on NO2 mass concentration largely depends on the non-uniformity of atmospheric aerosol distribution, the fitting range, etc. Meanwhile, increasing the fitting range can greatly reduce the NO2 mass concentration error introduced by the aerosol, especially for the backscattering effects. Comparison studies between the approximation method and the simulation method reveal that the NO2 mass concentration retrieval error introduced by the extinction effect is almost the same, while the backscattering coefficient-induced errors may be quite different (Figs. 13 and 14).ConclusionsWe evaluate the measurement errors of NO2 mass concentration caused by aerosol extinction and backscattering effects under various atmospheric conditions by two different methods (the simulation method and the approximation method) for the broadband NO2-DIAL technique. In the case of a homogeneous atmosphere, the NO2 mass concentration error is primarily determined by the aerosol extinction coefficient, while the contribution from aerosol backscattering effects can be neglected. However, if the atmosphere is inhomogeneous, the NO2 mass concentration error caused by the aerosol backscattering effect is significantly influenced by the inhomogeneous distribution of aerosol. It should be mentioned that the backscattering coefficient-induced NO2 mass concentration error is inversely proportional to the ?ngstr?m exponent in this case. In addition, we also derive an approximation model for NO2 mass concentration inversion errors caused by the extinction and backscattering coefficients based on spectral approximation. The comparison between the approximation method and the simulation method shows that the NO2 mass concentration inversion error generated by the extinction coefficients obtained by the two methods are generally in good agreement with small discrepancies. The inversion error caused by the aerosol backscattering coefficient may be affected by factors such as the computation method, the fitting range, and the spectral approximation. The approximation model provides an important tool for evaluating NO2 mass concentration errors in practical DIAL measurements.
ObjectiveAs an important component of the cloud droplet spectrum, ice crystals exert important effects on global radiation budget balance, global climate change, hydrological cycle, and weather modification. Due to the limitation of observation means, the understanding about the microphysical characteristics of ice crystal particles is not perfect till now. At present, it is difficult to identify the mixed phase of 2-100 μm ice crystals from droplets, and there is a bottleneck to provide microphysical parameters of ice crystals. The lack of sufficient ice crystal detection data can cause large differences in the mean value of ice water paths in different models, especially in mixed-phase clouds. Therefore, we study the microphysical parameters of ice crystals.MethodsFor these two problems, based on the digital holography theory, we propose to employ the global digital image fusion method, the local Tenengrad variance method, and the rotating caliper method for identifying mixed phase states of droplets and ice crystals in the cloud by combining the roundness concept of solid and liquid particles. Combined with optical image recognition technology, we obtain the area, perimeter, convex hull, and minimum enclosing rectangle data of ice crystals. Finally, the microphysical parameters of ice crystals are acquired by adopting the above data. The microphysical parameters of plate, dendritic and hexagonal ice crystals are obtained by observation experiments in low-temperature cloud chambers.Results and DiscussionsSome obvious conclusions can be obtained by adopting the proposed method. 1) By leveraging the rotating caliper method and the specific geometric parameter roundness F, the mixed phase identification of droplets and ice crystals in clouds is realized. Under the specific roundness threshold, the recognition rate of droplets and ice crystals is greater than 93% (Fig. 8). 2) Combined with optical image recognition technology, morphological data (the area, perimeter, convex hull, and minimum enclosing rectangle data) of ice crystal particles are obtained (Table 1). 3) The microphysical parameters of ice crystals are acquired by morphological data of ice crystals (Table 2). 4) When the digital hologram of ice crystal particles is obtained with the frequency of 30 frame/s, the three-dimensional kinetic velocity of ice crystal particles can also be acquired by this method (Fig. 11).ConclusionsAn ice crystal detection method based on a pulse-modulated laser, high-resolution optical system, and coaxial digital holography (DH) is presented. The local Tenengrad variance method, the rotating caliper method, and the specific geometric parameter roundness F are adopted for phase state identification of particles. To verify the validity of the detection method and identification algorithm, we observe the mixed particles of droplets and ice crystals in the cloud chamber. Additionally, the three-dimensional motion velocity and trajectory of ice crystals can be obtained from the sampling interval time and the three-dimensional coordinates and equivalent diameters of the center of mass at different time. This method solves the bottleneck problem that the existing observation technology cannot identify the phase states and obtain the microphysical parameters of ice crystals. Meanwhile, the method is of significance to improve the accuracy of numerical weather prediction and weather modification operation.
ObjectiveLow signature aircraft adopt active or passive methods to reduce the characteristic difference between themselves and surrounding backgrounds, such as high-temperature component cooling, aerodynamic structure layout optimization, and absorbing coating, which brings great challenges to detection systems. The aerodynamic heating of aircraft is difficult to eliminate, which thus provides a radiant source for the infrared detection system. The development of high sensitivity infrared detectors further promotes the detection of low characteristic aircraft by infrared detection systems. Maximum detection range (MDR) is an important performance indicator of infrared detection systems, which is not only related to the target's infrared radiation characteristics but also closely related to the system's visual range prediction model. At present, most research focuses on analyzing the detectability of targets based on a single visual range prediction model. Especially, with low characteristic aircraft as the research object, there is a lack of research on using multiple visual range prediction models for detectability analysis. Therefore, we take low characteristic aircraft as the research object and conduct research based on multiple visual range prediction models, which can provide theoretical support for the detection and recognition of low characteristic aircraft and detector design.MethodsA fly-wing configuration aircraft was taken as the research object. The surface temperature of the aircraft was predicted using the computational fluid dynamics (CFD) method, based on the assumption of a radiative balance wall. The radiative transfer equation (RTE) was solved through the line of sight (LOS) method, taking into account the situation of light being obstructed by the aircraft's skins. The atmospheric transmittance was borrowed from the MODTRAN software. Three ground-based visual range prediction models were established, including noise equivalent flux density (NEFD), minimum detectable temperature difference (MDTD), and minimum resolvable temperature difference (MRTD) algorithms. Finally, an end-to-end numerical simulation model to predict the MDR and maximum detection zenith angle of fly-wing configuration aircraft was established.Results and DiscussionsFor the fly-wing aircraft, the radiance in the long wave infrared (LWIR, 8-12 μm) band is two orders of magnitude higher than that in the medium infrared wave (MWIR, 3-5 μm) band. The radiation intensity of the back and abdomen of the aircraft is the highest, and the radiance in the side-view observation is basically the same (Fig. 7 and Fig. 8). The MDR of the NEFD visual range prediction model is nearly one order of magnitude higher in the LWIR band than that in the MWIR band. However, the MDR of the MDTD and MRTD models is approximately equal in both bands. In the LWIR band, the MDR and the maximum detection zenith angle calculated by the three visual range prediction models in descending order are as follows: NEFD>MDTD>MRTD. In the MWIR band, the MDR of the MDTD model is the largest compared with the other two models. The MDR of the NEFD model within the detection plane containing pitch angle variation is about 170 km, which is suitable for detecting the back and abdomen of the aircraft. However, the MDTD and MRTD models have the MDRs in the bottom-view observation, with an MDR of 57 km and 38 km, respectively (Fig. 9 and Fig. 10). Within the side-view observation plane, the MDR calculated by the NEFD model is approximately 62 km (Fig. 11 and Fig. 12). Under different observation levels including discovery, classification, and recognition, the low characteristic aircraft can be detected by the MRTD model, but the MRTD model fails to detect such fly-wing aircraft under the identify level (Fig. 14).Conclusions1) The radiance in the LWIR band is two orders of magnitude higher than that in the MWIR band. The radiation intensity in the top-view observation is nearly one order of magnitude higher than that in the side-view observation. It is indicated that infrared radiation intensity has strong selectivity in terms of spectral bands and detection angles. 2) The MDR of the NEFD model in the LWIR band is nearly one order of magnitude higher than that in the MWIR band, and the MDRs of the MDTD and MRTD models in the MWIR band and LWIR band are basically the same. In the LWIR band, the MDRs of the three models are sorted in descending order: NEFD>MDTD>MRTD. 3) In the detection plane of the pitch angle, the MDR of the NEFD model in the top-view and bottom-view is about 170 km, and the MDRs of the MDTD and MRTD models are 57 km and 38 km, respectively. 4) The MRTD model can detect aircraft at discovery, classification, and recognition observation levels, but it is invalid at identify level.
ObjectiveThe problems of spectrum limitations and co-channel interference (CCI) in radio frequency (RF) communication systems have limited the development of high-speed rate services. At the same time, free-space optical (FSO) communication is complementary to RF communication because it does not require a spectrum license and is highly resistant to interference. However, FSO communication is susceptible to atmospheric turbulence and pointing errors, which can deteriorate the communication link and even cause disruptions. In order to improve the performance of FSO systems, traditional solutions use spatial diversity, aperture averaging, and FSO-RF hybrid systems. Based on the FSO-RF hybrid system, we introduce reconfigurable intelligent surface technology in the FSO link to solve the problem of FSO being unable to carry out line-of-sight communication. Considering the CCI problem in the RF link, we propose a reconfigurable intelligent surface (RIS)-assisted FSO-RF hybrid system scheme under CCI, which further improves the performance of the system compared with the traditional FSO/RF scheme.MethodsWe present a scheme for a hybrid FSO-RF system under CCI. Firstly, reconfigurable smart surface techniques are introduced in the FSO link for the case where line-of-sight transmission is not possible for FSO communication, and CCI signals in the RF link are considered. The FSO link obeys the Gamma-Gamma distribution, and the RF link obeys the Rayleigh distribution. In addition, a decode-and-forward protocol is used at the optoelectronic switching relay node. Then, based on the probability density function of the system end-to-end instantaneous signal-to-noise ratio (SNR), closed-form expressions for the system outage probability and average bit error rate (BER) are derived, and Monte Carlo simulation is used to verify the accuracy of the results. Finally, the corresponding conclusions are drawn based on the diversity order of the system.Results and DiscussionsWith a fixed average SNR of the FSO link, the outage probability performance of the system deteriorates as the H and CCI SNR increase, i.e. when the number of interfering signals at the destination node and the corresponding SNR increase. Moreover, under the same parameter conditions, the RIS-assisted system can achieve an outage probability of 10-4, while the conventional hybrid system can only achieve an outage probability of 10-2, indicating that the performance of the RIS-assisted two-hop hybrid FSO-RF system under CCI is much better than that of the traditional FSO/RF system (Fig. 2). The performance of the proposed FSO-RF hybrid system is better than that of the traditional FSO/RF hybrid system under the same parameters with fixed average SNR of the RF link and for different pointing error coefficients on the outage probability of the system. For the RIS-assisted hybrid system, when the pointing error coefficient is reduced from 1.23 to 0.73, the outage probability of the system increases significantly, indicating that the pointing error coefficient is the dominant factor affecting the outage probability of the system (Fig. 3). The effect of five modulation methods on the average BER of the system is analyzed for a fixed FSO link average SNR. The two modulation methods, differential binary phase shift keying (DBPSK) and noncoherent binary frequency shift keying (NBFSK), are close in effect, but DBPSK performs better. The RIS-assisted hybrid system can significantly reduce the average BER compared with the traditional FSO/RF system with the same modulation, i.e. both using BPSK. The results are consistent with the simulation results, indicating the accuracy of the obtained formulae (Fig. 5). The effect of the five modulation methods on the average BER of the system is analyzed for a fixed RF link average SNR, with low BER. DBPSK>NBFSK>OOK>BFSK>BPSK when γˉSR is less than 30 dB. NBFSK>DBPSK>OOK>BFSK>BPSK when γˉSR is higher than 30 dB. In comparison with the traditional FSO/RF system, the two BERs can largely coincide under high SNR conditions considering the effect of strong pointing errors, but for low SNR conditions, the performance of the RIS-assisted hybrid system is significantly improved (Fig. 6).ConclusionsIn this paper, the performance of RIS-assisted FSO-RF hybrid systems under CCI is investigated. The FSO link under RIS assistance obeys the Gamma-Gamma distribution, and the RF link in the presence of CCI obeys the Rayleigh distribution. The decode-and-forward protocol is used at the relay node, and closed-form expressions for the system outage probability and the average BER are derived. In addition, to obtain more significant conclusions, an asymptotic analysis of the outage probability is also provided in this paper, and Monte Carlo simulations are performed to analyze them numerically. The simulation results show that HD detection outperforms IM/DD detection among the different light detection methods and that this detection method is effective in combating the effects of atmospheric turbulence on the system. Compared with the traditional FSO/RF system, the performance of the proposed system solution in this paper is greatly improved with the assistance of RIS, even in the presence of CCI.
ObjectiveUnderwater wireless optical communication (UWOC) featuring high speed, low delay, and high confidentiality can form a medium and short distance local area network (LAN) with high speed and strong real-time properties or can complement the advantages of underwater acoustic communication hybrid networking. It has become a research hotspot in recent years. The deployment and application of UWOC require high-performance, low-cost, and miniaturized practical optical transceivers. By employing a laser diode as a light source, the transmission distance is long with high speed, but the alignment of the light receiver and light sender is demanding, which is difficult for communication of non-fixed positions and orientations in the dynamic seawater environment. If the light-emitting diode (LED) is the light source, the alignment requirements can be greatly reduced, while the LED array can be adopted to enhance the light signals to extend the transmission distance. Meanwhile, the high-order modulation can be utilized to improve the problem of insufficient bandwidths. The existing UWOC systems based on LED design have a large room for improvement in transmission distance and transmission rate. Additionally, the system design can realize real-time high-order modulation, coding and signal processing, and miniaturized system integration by leveraging field programmable gate array (FPGA) at both receiving and transmitting ends, and further improve the system performance and practicality. Aiming at the application requirements of underwater UWOC with high speed, long distance, low cost, and miniaturization, we design a highly robust integrated miniaturized UWOC system based on high-power LED array and FPGA. The system can realize on-off keying (OOK) modulation, and flexibly realize high-order modulation and channel coding. Meanwhile, it can achieve a longer transmission distance and a higher transmission rate than the LED UWOC systems reported in previous references, with miniaturized integration of optical receivers and transmitters.MethodsThe optical transmitter employs 45×1 W high-power LED array as the light source and takes total internal reflection (TIR) lens and parabolic reflector tube structure as the optical antenna to realize high-order modulation and coding by FPGA. In terms of optical receivers, an avalanche photodiode-automatic gain amplifier circuit (APD-AGC) optical receiver based on FPGA is designed. After being converted into the current signal by APD, the optical signal is converted into a voltage signal by transresistance amplifier module, then amplified into a voltage signal with fixed peak amplitude by automatic gain amplifier module, and finally input to the analog-to-digital conversion (ADC) module. The receiving FPGA can synchronously demodulate and decode the received signal in real time. In real-time synchronous signal transmission, the receiving and sending ends of the system adopt FPGA to process signals, which can support the real-time synchronous underwater transmission of commonly applied OOK signals and high-order modulation signals by taking 16QAM encoded by Reed Solomon (RS) channel as an example, which can meet the application requirements under different underwater scenarios. Finally, the optical communication receiver and transmitter are miniaturized and integrated with strict waterproof packaging and practical significance.Results and DiscussionsUnder a 12 m underwater channel, the UWOC system employs OOK and 16QAM modulation for data transmission. Within the error threshold, the transmission rate of the optical terminal can reach 30 Mbps. The 16QAM bit error rate is always higher than that of the OOK system. This is because QAM modulation requires high real-time synchronization of the signal, and the wide beam of the LED array makes underwater channel synchronization difficult due to the multi-path effect. However, at the same transmission rate, 16QAM has a higher bandwidth utilization than OOK modulation, which is because the system is limited by ADC sampling rate and synchronization algorithm, the bandwidth advantage of 16QAM high-order modulation signal is not fully utilized, and there is still great potential in rate improvement. In terms of robustness, the receiver can achieve effective reception of the deviation degree from the main optical axis within 40° at a distance of 12 m, reducing the difficulty of alignment and possessing strong robustness. To test the limit transmission distance of the system, we successfully build a cross-media link communication system with a distance of 12 m water+30 m air (a total of 42 m) and transmit 22 Mbps nonreturn to zero (NRZ)-OOK shaper signal within the error decision threshold. In practical applications, the system can be applied to underwater scenarios. For example, it can be carried on the submarine to achieve underwater link deployment, and underwater node information collection or signal transmission. Additionally, its high-power LED array also supports the deployment of air-water link wireless optical communication links, such as the deployment of end machines on ships and underwater frogman or underwater robot community information interaction.ConclusionsWe design and develop a high-robustness miniaturized UWOC system based on FPGA and high-power LED array light source, which supports traditional OOK modulation and m-QAM modulation. The system is tested experimentally by taking 16QAM modulation as an example, and the results show that under the real-time transmission of a 12 m water channel, the bit error rates for OOK modulation and 16QAM modulation are 2.467×10⁻⁴ and 3.467×10⁻³ respectively at 30 Mbps. The 22 Mbps NRZ-OOK shaping signal 12 m water +30 m air is transmitted across media links with a bit error rate of 3.619×10⁻⁴. Additionally, the light source transmitter of a high-power LED array with optical collimation antenna and the optical receiver based on 3 mm large aperture APD automatic gain control can receive signals within 40° of the main optical axis in the 12 m underwater channel. Finally, the stringent requirements for UWOC system alignment and focusing are greatly reduced, and the system robustness for applications in the underwater environment is improved.
ObjectiveDuring communication between the high-altitude aircraft and the underwater platform, the high-altitude aircraft moves faster and passes through the area where the underwater platform is located in a shorter time. Additionally, limitations of the receiving field of view and laser emission window of the underwater platform restrict the effective communication time, impeding the establishment of a constant optical link. The utilization of a beacon light-based communication method extends the capture time and adds complexity to the link establishment in the underwater communication platform system. To overcome these challenges, a tracking and pointing system based on the orbit forecasting of the underwater platform is devised to establish an uplink between the underwater platform and high-altitude aircraft.MethodIn contrast to the acquisition, tracking, and pointing (ATP) systems employed in space laser communications, the system we developed eliminates the need for an acquisition module. Instead, the underwater platform is required to obtain the real-time position of the aircraft during communication to achieve precise pointing of the aircraft. Several theoretical algorithms for orbit forecasting are assessed, and the Runge-Kutta method is selected for its computational efficiency. The laser pointing system structure is designed for an underwater platform, and the correlation between the motor rotation angles in two directions and the aircraft coordinates is derived. Subsequently, we develop computer software to simulate and analyze the orbit forecasting algorithm and pointing angles, which leads to the evaluation of the error results and running time. The findings support the feasibility of the tracking pointing method based on orbit forecasting. The system consists of several modules, including the laser receiver, transmitter, servo motor controller, attitude sensor, and field programmable gate array (FPGA) master control modules. To improve the reception sensitivity, the system utilizes a photomultiplier tube (PMT) with heightened sensitivity for reception. The laser receiver module is equipped with eight PMT, each with a maximum field of view (FOV) of 15°. These tubes are integrated to form a receiver array with a maximum FOV of 30°. The expansion of the receiving FOV enhances the communication coverage duration when the aircraft is in high-speed motion, thereby increasing the likelihood of receiving navigation parameter information. Additionally, the utilization of the diversity receiving technique enhances communication stability under low signal-to-noise ratios.Results and DiscussionsThe simulation results show that the orbit forecasting error does not exceed 200 m on the X-axis, 160 m on the Y-axis, and 150 m on the Z-axis within 60 s [Fig. 5(a)]. The maximum error between the forecast position and the actual position is no more than 250 m [Fig. 5(b)]. In experiments, the errors between the forecasted and actual orbits, as well as the errors in the X, Y, and Z axes coordinates, are all less than 250 m within 60 s [Fig. 6(a)]. The optical pointing angle error due to the orbit forecasting error within 60 s does not exceed 0.51 mrad at most [Fig. 6(d)]. The actual pointing results are obtained by comparing the angle feedback from the servo motors to the theoretically calculated setup angle, resulting in a mean angular error of 0.20 mrad in the pitch direction [Fig. 7(a)] and a mean angular error of 0.16 mrad in the roll direction [Fig. 7(b)]. The system pointing error is a combination of the pointing angle error caused by the error between the track forecast and the actual track position, and the error between the theoretical pointing angle calculated by the track and the pointing angle feedback by the actual motor movement. The maximum pointing error is calculated to be 0.77 mrad.ConclusionsWe design a tracking and pointing system to forecast and track the orbit of a high-altitude aircraft from an underwater platform. By receiving coordinates and navigation parameters from the aircraft, the system can rapidly calculate and forecast orbit data within 60 s, with a calculation time of 0.6 s. Based on the predicted orbit data, real-time pointing action from the platform to the aircraft can be performed. The error between the simulated motion trajectory within 60 s and the aircraft's orbit trajectory calculated by the orbit forecasting algorithm does not exceed 250 m. In the experiment, the maximum error between the aircraft orbit obtained from the orbit forecasting and the actual running orbit is within 350 m, resulting in a pointing error not exceeding 0.54 mrad. The error between the calculated pointing result from the forecasted aircraft position and the actual feedback pointing result is 0.20 mrad in the pitch direction and 0.16 mrad in the roll direction. The maximum pointing error of the system is 0.77 mrad. Our study presents a system that aims to minimize the duration required for establishing links while ensuring precise communication through pointing. The tracking and pointing system, based on a short-time prediction of the high-altitude aircraft platform is usable.
ObjectiveUnderwater wireless optical communication (UWOC) has advantages such as high bandwidth, high data rate, low latency, and small form factor. It can support the transmission of high-speed, high-capacity, real-time, and multimedia services like underwater images and videos. Light-emitting diodes (LEDs) are cost-effective light sources with high energy efficiency, and their wide-angle beam profile relaxes the alignment requirements between the transmitter and receiver. However, high-power LED sources have narrow bandwidth and exhibit strong non-linear effects. Additionally, the underwater optical channel is affected by absorption, scattering, turbulence, and bubbles, while the photodetectors may also exhibit non-linear effects. These factors lead to non-linear distortion of the optical signal, severely affecting communication bandwidth and limiting transmission distance. The Volterra algorithm is commonly used for non-linear compensation in communication systems, but it has high complexity and computational overhead. Most existing research on the Volterra algorithm involves offline processing, which is not conducive to miniaturization and low power consumption in underwater environments. Therefore, we propose a low-complexity, low-power, and hardware-friendly 3l-sVolterra (link and linear list-based sparse Volterra) algorithm for UWOC systems. By combining new data structures based on linked lists and linear lists to store all the parameters of the Volterra algorithm, the on-chip resources required for updating the Volterra algorithm's parameters are effectively reduced. It also facilitates sparse processing of the participating non-linear terms, making it suitable for small-scale hardware systems. Compared with the 3l-Volterra algorithm without sparsity operations, this algorithm reduces resource consumption by 30% while preserving similar non-linear compensation capabilities. We hope that the proposed 3l-sVolterra algorithm can promote miniaturization and real-time underwater applications of UWOC systems.MethodsThe 3l-sVolterra algorithm utilizes a combined data format of linked lists and linear lists to store the parameters for Volterra operations. The algorithm achieves parameter updates through N multiplications, one node insertion, and traversal of the remaining N-1 nodes in the linked list, significantly improving the efficiency of each update and operation. The algorithm's sparse operations on the non-linear terms further reduce on-chip resource consumption. We implement and validate the 3l-sVolterra algorithm on a low-power and miniaturize digital signal processing (DSP) chip, the C6748. We also design a DSP subsystem based on the C6748 as the core. In the receiving end, the optical signal is converted into an electrical signal by an avalanche photo diode (APD). The electrical signal is then amplified and input to an analog-to-digital conversion (ADC) module. Finally, the converted digital signal is synchronized, demodulated, and subjected to non-linear equalization by the DSP subsystem.Results and DiscussionsIn a 5 m-long underwater channel, the UWOC system employs the CAP-4 modulation scheme for data transmission. The experiment tests the compensation capability of the 3l-sVolterra algorithm in the entire UWOC system with four different memory lengths (10, 14, 18, and 20) and varying numbers of retained terms (4, 8, 12, and 16). As the memory length increases, the 3l-Volterra algorithm (the 3l-sVolterra algorithm without sparse operations) enhances the compensation capability of the entire UWOC system, achieving a channel bandwidth expansion of up to 20 Mbit/s. While maintaining similar non-linear compensation capabilities to the algorithm without sparsity operations, the 3l-sVolterra algorithm reduces on-chip resource consumption by 30%. When a non-linear compensation algorithm with a memory length of N is processed, the number of retained non-linear terms should be greater than N/2, so as to ensure the majority of non-linear compensation capability. The influence of non-linear terms beyond the N/2 range gradually diminishes. This algorithm is suitable for DSP hardware systems and can be ported to hardware systems of other architectures.ConclusionsWe propose a low-complexity, low-power, and hardware-friendly 3l-sVolterra algorithm. The algorithm adopts a new data structure that combines linked lists and linear lists to store all the parameters of the Volterra algorithm, effectively reducing the on-chip resources required for parameter updates. It also allows sparse operations on the non-linear terms of the Volterra algorithm and facilitates portability to different small-scale hardware systems. Furthermore, a DSP subsystem based on the 3l-sVol algorithm is implemented on the C6748 chip, and a UWOC system is constructed using a 5 m-long water tank to test the designed DSP subsystem. Compared with the 3l-Vol algorithm, the proposed algorithm reduces on-chip resource consumption by 30% while maintaining similar non-linear compensation capability. By changing the memory length and the number of retained terms in the Volterra algorithm, the variation of the algorithm's non-linear compensation capability in the constructed UWOC system is tested. Reducing the number of retained terms can effectively reduce the on-chip resource consumption of the Volterra algorithm. This is the first time that a non-linear equalization algorithm has been ported to a DSP chip, achieving synchronous data transmission and real-time non-linear compensation in the DSP-based UWOC system. The DSP subsystem has good compensation capability for both linear and non-linear distortions, as well as system bandwidth extension ability, which is of great significance for miniaturizing the UWOC system and promoting its real-time underwater applications.
ObjectiveCross-medium atmospheric seawater communication is influenced by the absorption, scattering, and random wave refraction of the sea surface, which results in intensity attenuation, beam drift, and depolarization effects on the received light. Currently, the research on atmospheric seawater cross-medium channels mainly focuses on sea surface reflection and non-polarization. We aim to study the transmission of polarized light, derive the refractive model, and analyze the Stokes vector variation of photons at the atmospheric seawater interface. Furthermore, a complete polarization transmission model for laser cross-medium downlink channels is built to provide valuable references for the implementation of polarized light in atmospheric seawater communication systems.MethodsTo investigate the influence of rough dynamic sea levels on refracted polarized light, we first utilize the Elfouhaily wave spectrum and its corresponding bilateral directional transfer function to generate a dynamic three-dimensional sea surface via fast Fourier transform simulation. We then build a polarized light transmission model of laser crossing a rough air-seawater interface using the Monte Carlo method, which incorporates the photon scattering in atmospheric channels, refraction at the atmospheric seawater interface, and scattering in underwater channels. Finally, the received intensity and polarization are obtained. By adopting this model, the polarization characteristics and scintillation indices of laser propagation through atmospheric seawater channels are analyzed under different wind speeds, distances, and light divergence angles.Results and DiscussionsThe establishment of a dynamic three-dimensional sea surface and its related statistical data indicates that the increasing wind speed leads to gradually roughening sea surface and rising fluctuation range of sea surface tilt angle. When photons pass through the sea surface, the sea surface tilt angle during refraction is also more random. In exploring the effect of different sea surface wind speeds on underwater polarization, the polarization of received light decreases with the rising wind speed, which is positively correlated with the sea surface roughness at different wind speeds. As the wind speed increases, photons refract and diverge outward, resulting in an increase in scattering times and a decrease in polarization (Fig. 5). Additionally, the received light scintillation indices under different wind speeds and beam divergence angles are analyzed. As the wind speed increases, the scintillation index also rises, and the influence of the sea on the light intensity fluctuation becomes greater (Fig. 8). By changing the divergence angle of the beam, if the divergence angle gets smaller, the received photons will be refracted by a smaller area of the sea surface, thus bringing beam drifting and an increase in the scintillation index. Conversely, if the divergence angle increases, the scintillation index decreases (Fig. 9).ConclusionsWe build a dynamic three-dimensional sea surface model influenced by wind speed and a polarization transmission model for laser light across the air-seawater interface. By varying the wind speed, link distance, and laser beam divergence angle, we statistically analyze the polarization degree and scintillation index of the received beam. The results show that wind speed influences the statistical distribution of three-dimensional sea surface tilt angles and roughness. As wind speed increases, sea surface roughness rises, resulting in a decrease in the polarization degree of underwater photons. Meanwhile, the longer link distance leads to a lower polarization degree. The scintillation index measures the degree of light intensity fluctuations caused by random refraction at the sea surface. The simulation results indicate that as the wind speed increases, the scintillation index grows and the light intensity fluctuation is more strongly influenced by the three-dimensional sea surface. When the divergence angle decreases, the received light intensity is more strongly affected by the dynamic sea surface, increasing the scintillation index of the received light. Our research findings can provide theoretical references for the laser communication channel model across the rough air-seawater interface.
ObjectiveSolar transition region is a highly dynamic plasma region with a temperature of 0.02-1 MK in the solar upper atmosphere, which is the key field of solar physics research. Extreme ultraviolet (EUV) multi-order slitless imaging spectrometer can observe the sun in a large field of view (FOV) simultaneously with high spectral, spatial, and temporal resolution. We propose and design a novel solar EUV slitless imaging spectrometer operating at Ne VII 46.52 nm. This instrument can simultaneously correct the off-axis grating aberrations of three diffraction orders in a large FOV (24′×24′) while meeting the requirements of light weight, compact volume, and large aperture. We hope that our three-order slitless spectral imaging strategy and system design can provide a technical scheme that can achieve continuous snapshot high-resolution spectral imaging observations of the upper transition region.MethodsThis instrument utilizes two toroidal uniform line-space (TULS) gratings and a toroidal mirror as the diffraction element and the reflective element respectively to realize a new three-order spectral dispersion structure. The ±1 order dispersion planes overlap with each other and are orthogonal to the 0-order imaging plane without dispersion. We build the paraxial optical model and calculate the initial solution of the optical system. By adopting the multi-configuration of ZEMAX software and the self-defined optimization function, the initial structural parameters of the three-order subsystems are globally optimized by considering the aberration correction conditions of the TULS grating, system resolution requirements, and geometric constraints. Finally, the tolerance analysis is carried out to obtain an optical system with reasonable tolerance allocation.Results and DiscussionsFigs. 6 (a)-(c) show the optical layout of the entire instrument, ±1 order subsystems, and 0-order subsystems respectively. This instrument consists of three hyperboloidal mirrors with off-axis aperture, three Si filters, two TULS gratings, a toroidal mirror, a field aperture, and three independent planar detectors. This entire instrument has a compact optical envelope volume of 950 mm×280 mm×240 mm, the focal length is 3200 mm, and the FOV is 24′×24′. Meanwhile, we employ a Si filter with a thickness of 0.1 μm to suppress the strong solar radiation in the visible band. The transmittance curve is shown in Fig. 7. The same periodic Sc/Si multilayers are coated at all optical surfaces to provide the reflectivity at 46.52 nm. The reflectivity curve is shown in Fig. 8. To reduce the conversion costs of the system, we add constraint conditions in the optimization process to make the final optimized TULS grating and mirror have identical surface height distribution and grating groove density. The surface height distribution is shown in Fig. 9.Figs. 10 (a)-(c) are the RMS radius field map of the spot diagram of the three-order subsystems. Except for the marginal FOV of +1 order, the RMS radius of the spot diagram in the full FOV of each order is less than half of the pixel size. Figs. 11 (a)-(c) are the three-order modulation transfer function (MTF) curves respectively. Except for a few marginal FOV, all orders are greater than 0.6 at the Nyquist frequency (41.67 lp/mm), which is close to the diffraction limit. The image quality evaluation shows that the system has excellent imaging performance.Figs. 12 (a)-(c) are the geometric ensquared energy curves of the instrument. Except for a few marginal FOV, the square full width with 80% ensquared energy at all orders is less than the pixel size. Considering the sampling frequency of the detector, the spatial resolution of the system is 1.547″. By adopting the theoretical calculation method, we obtain the pixel spectral resolution (Δλ) at -1 order and +1 order is 0.00622 nm and 0.00509 nm,respectively. The spot diagram distribution in the full FOV at ±1 order is shown in Figs. 13 (a)-(b). The spot diagram of three wavelengths with a wavelength difference Δλ is obviously separated on the image plane, which indicates that the spectral resolution of the system is 0.0078 nm.Table 5 shows the tolerance limits of key components of the system. Under this tolerance, the RMS radius of the spot diagram on the image plane has a 90% probability of changing within 7.44 μm, and an 80% probability of changing within 6.4 μm. Tolerance analysis is carried out for the system with single grating working simultaneously at three orders. The results are shown in Table 5. The comparison shows that the designed instrument has a looser tolerance.ConclusionsWe propose and design a novel three-order slitless imaging spectrometer. A concave grating array is adopted as the diffractive optical element, and a single grating only works at a single diffraction order to correct the off-axis grating aberration in a large FOV. This system selects Ne VII 46.52 nm spectral line as the central wavelength, and it can realize high-resolution observation under a large FOV (24′×24′). The spatial resolution of the system is 1.547″, and the spectral resolution obtained by spectral data inversion is 0.0078 nm. The performance evaluation and tolerance analysis of the system show that the new imaging spectrometer has excellent imaging performance, compact system volume, and loose tolerance. Thus, it is suitable for deployment on remote-sensing satellite platforms to achieve high-resolution observation of solar upper-layer transition regions.
ObjectiveComplex parts in the aerospace field need to deal with high temperature, high pressure, high speed and complex electromagnetic environment, and other new service environments, parts usually need to design some precision microstructures such as micropores to bear the function of heat dissipation and pressure resistance, which puts forward extremely high requirements for the manufacturing accuracy of the parts themselves, and also requires the measurement equipment to take into account the dimensional accuracy and positioning accuracy of the parts. At present, the measurement technology of multiple sensor combinations is mainly adopted, and the macro and micro feature data is obtained by using the measurement characteristics of each sensor, and finally the data is registered and fused or three-dimensional stitching, the main registration fusion method is to downsample the microscale measurement data of high-precision large data and upsample the large-scale measurement data with relatively low accuracy and small data volume, and finally make the data of these two scales achieve similar accuracy to register them, but this method does not form a more correct and mature method in the upsampling process, which makes the accuracy of upsampling unsatisfactory, resulting in doubts about the correctness of the final result. In addition, the current multi-sensor integration method is mostly limited to sensors of similar scale, so this paper proposes an integrated calibration method between sensors with large scale differences, which can overcome the problem of coordinate integration difficulties caused by the difference in accuracy and resolution between sensors, and use typical aerospace parts for measurement verification, which proves that this method can be effectively applied to such parts with cross-scale structural features.MethodsBy preliminarily establishing a model of multi-sensor combination measurement to derive the coordinate system conversion closed loop, due to the relative position of the probe and the microscope camera is constant, which is the invariants in the closed loop and the key link to complete the accuracy conversion in the conversion closed loop. This paper innovatively uses a special calibration block as a transit target to calibrate this conversion relationship, this calibration block is designed and processed from the perspective of controlling the accuracy of coordinate conversion, it contains sixteen macro feature points and eight micro feature points, because the field of view of zoom scanning microscopy equipment is extremely small, and calibration requires at least six feature points to be set in such a field of view, so this paper designs such a microstructure into a square groove structure, using its corner points as marker points, This also facilitates the search for more accurate feature point coordinates in microscopic reconstruction results. In addition, silicon is used for the processing of this calibration block, so that the tiny square groove structure can be precisely machined. Finally, the above coordinate transformation relationship is solved by a relatively simple quaternion method, that is, the calibration of the geo-coordinate system of two sensors of different scales is completed.Results and DiscussionsUsing the above model and the fixed conversion relationship solved by the calibration method proposed in this paper, the data of each local measurement can be converted to the same coordinate system. The experiment in this paper chose an injector, a space cross-scale part with a conical surface. There are 12 holes with a diameter of about 0.5 mm evenly distributed above, measure them one by one while using a binocular camera to record the global control points distributed on the microprobe during each measurement, use these global control points to calculate their conversion relationship to the binocular system, and then the pose matrix represented by the left multiplication calibration result can obtain the conversion relationship from a specific point to the global coordinate system, respectively apply the conversion relationship to the measurement results of specific points (represented as point cloud datasets), you can obtain each local area data with the same coordinate system, and make them a simple collection to obtain a complete high-precision large-scale topography dataset. The central coordinates of each hole on its surface and the direction vector of each hole axis are obtained by solving some processing algorithms, because these quantities can accurately represent the positioning accuracy of holes, compare them with the theoretical model to obtain error values, and then compare the error values with the processing accuracy of parts, which can verify the final accuracy of the measurement method and the degree of improvement of accuracy. The final result is that the central coordinate error is 0.029 mm, the axial error of the hole is 0.1140°, which is greatly improved compared with the central coordinate error of 0.05 mm and the axial error of the hole of 0.167° in the machining accuracy requirements, in addition, the results of this paper are more accurate than the scanning results of the single-scan measuring instrument Gocator sensor.ConclusionsIn this paper, a cross-scale measurement method based on macro-micro composite calibration is proposed for precision three-dimensional optical measurement of parts with cross-scale micro-nano structure, which takes into account the accuracy difference of macro-micro measurement equipment and the integrity and correctness of microscopic raw data, and completes the conversion relationship and accuracy transition of the global model of the binocular-microscopic combined measurement system by designing and precision processing the macro-micro composite calibration block, so as to realize the global calibration of cross-scale measurement equipment. By comparing with the roundness and flatness of the center point set of each hole in the theoretical model to analyze the splicing accuracy, it is concluded that the roundness error of the coordinate distribution of the hole surface of the microhole is 0.0438 mm and the flatness error is 0.0252 mm, and the positioning accuracy of the parts measured by this method is analyzed by comparing with the position of each hole center pose in the theoretical model, and the point error value is less than 0.029 mm and the axial error is less than 0.1140°. The experimental results show that compared with direct measurement methods such as surface structured light, this measurement method has the advantages of higher accuracy and more accurate morphology reconstruction, and is suitable for the measurement of microstructure, topography, dimensional accuracy, and positioning accuracy of a type of cross-scale parts.
ObjectiveUnderwater laser plasma detonation wave propulsion technology has important application value in submarine stealth propulsion, detonation engine, supercavitation weapon systems, green ship manufacturing, and other fields. Different from the space focused laser induced propulsion method, the traditional laser propulsion system focuses on inherent defects such as insufficient energy gathering effect, difficult control of propulsion direction, and large laser loss. A new mode of underwater fiber laser induced plasma detonation wave propulsion is proposed, which achieves control of the laser focal point through the design of microcavity structure morphology coupled with fiber optics and research on the performance of fiber laser propulsion structure. Furthermore, the control of the movement direction of small particles entering and exiting can be achieved, which solves the problem of low energy coupling efficiency of laser plasma in underwater environments and difficulty in effectively applying propulsion force to the surface of the pushed object. By utilizing underwater plasma fiber laser induction to achieve directional propagation of detonation waves, we aim to improve the thrust and impulse coupling coefficient structural performance of laser propulsion. We focus on the morphology and energy conversion characteristics of fiber micro-cavity structures and the study provides theoretical support and guidance for future research on underwater laser induced plasma detonation wave dynamics while achieving particle targeting, fixed-point, and fixed-depth propulsion.MethodsWe utilize the theory and method of directional propagation of detonation waves through underwater fiber laser induced plasma, aiming to improve the thrust and impulse coupling coefficient structural performance of laser propulsion. Meanwhile, for the microcavity structural performance of underwater fiber laser propulsion, we combine the analysis of laser plasmon detonation theory to build a microstructure underwater laser plasma propulsion model and numerical simulation scheme. Simulation research is conducted by structural morphology and numerical characteristics. Firstly, to address the issues of low impulse coupling coefficient and divergent effects in underwater laser propulsion without microcavities, we numerically simulate the flow field when the microsphere is propagated by an underwater fiber laser under the same laser energy but different microsphere positions. This illustrates the necessity of adding structural constraints for underwater fiber laser propulsion and objecting the rust and pulse coupling coefficient without microcavities as a reference. Then, based on rectangular microcavities, we simulate the flow field of underwater fiber laser pulse for microcavities with different lengths and diameters while maintaining a constant distance between the microsphere and the laser focus. Finally, we conduct numerical simulations of the performance of open, U-shaped microcavities, double tube microcavities, and structures with blocking forces, aiming to establish a mapping relationship between the morphology of microcavities and the changes in the force and weight coupling coefficients of microspheres through comparative analysis of numerical results.Results and DiscussionsNumerical simulations yield the force curve and impulse coupling coefficient of the microsphere when the laser focus-to-microsphere distance changes without microcavities. The maximum impulse coupling coefficient is 0.117 dyne/W (Fig. 3), and the flow field situation of underwater fiber laser propulsion at 0.2 μs without micro cavities shows higher pressure in the symmetrical range of 30 to 90 degrees, indicating poor directional laser propulsion effects, which demonstrates the necessity of adding structural constraints (Fig. 4). By adding a rectangular microcavity, the impulse coupling coefficient can be improved to the order of 103 (Tables 1-2) compared to that without microcavities. However, as the microcavity length increases, the peak thrust decreases, reaching a maximum of about 140 dyne/W (Fig. 7). As the diameter increases, the impulse coupling coefficient increases, but the growth rate slows down (Fig. 9). The changes in force on the microsphere and the impulse coupling coefficient are obtained for U-shaped microcavities, double-tube microcavities, and microcavities with blocking structures. The U-shaped micro cavity increases the total applied force on the microsphere by approximately 0.002 N and improves the impulse coupling coefficient by 20 dyne/W (Fig. 12). When propelled by double-tube microcavities, the microsphere experiences a thrust of approximately 0.103 N and an impulse coupling coefficient of 340 dyne/W (Fig. 14). In the case of microcavities with blocking structures, the peak thrust is approximately 0.067 N, which represents a 44% increase (Fig. 17), while the impulse coupling coefficient is approximately 260 dyne/W, indicating an 86% increase (Table 3).ConclusionsWe propose several microcavity structures to solve the low impulse coupling coefficient and divergent effects of underwater fiber laser propulsion without microcavities. By conducting numerical simulations on the flow fields of different microcavity structures, we obtain the thrust curves and impulse coupling coefficients after adding the respective microcavities. The addition of rectangular microcavities can significantly improve the impulse coupling coefficient of underwater fiber laser propulsion to the order of 103 and concentrate the effects of laser propulsion. Meanwhile, when the distance between the laser focus and the microsphere remains constant, increasing the length of the microcavity decreases the peak thrust, while increasing the diameter increases the impulse coupling coefficient, albeit at a decreasing rate. Compared to rectangular microcavities, U-shaped microcavities, double-tube microcavities, and microcavities with blocking structures provide greater enhancements in force on the microsphere and impulse coupling coefficients. Among the four types of microcavities, double-tube microcavities show the greatest enhancement effect. The results demonstrate that the addition of microcavities can improve the efficiency of underwater fiber laser propulsion and provide corresponding enhancement effects for the four microcavity structures.
ObjectiveThe solar upper atmosphere including the corona, transition region, and chromosphere is composed of hot and highly dynamic magnetized plasma, from which highly ionized ions emit abundant extreme ultraviolet (EUV) spectral lines. Existing EUV imaging spectrometers can only conduct imaging on one or two target regions of the solar upper atmosphere but cannot diagnose the whole region in a wide spectral and spatial scale using a single instrument. This severely restricts our understanding of the energy and material transport processes in solar eruptive activities. Therefore, we propose and design a solar EUV three-waveband imaging spectrometer with an elliptical varied line-space (EVLS) grating that operates at non-Rowland circle mounting. This innovative solar EUV imaging spectrometer boasts exceptional spectral imaging performance in an extremely large off-axis slit field of view (FOV) while maintaining a compact instrument package. Furthermore, it provides excellent grating aberration correction even at very high spectrograph magnifications and beam speeds. We hope that our spectral imaging strategy and instrument system design will be instrumental in the simultaneous observation of the solar corona, transition region, and chromosphere in the near future.MethodsThe instrument utilizes an EVLS grating as the diffraction spectroscopic element. To achieve simultaneous correction of aberrations and free-astigmatism in all three spectral bands, we analyze the grating for aberrations by employing the optical path function and Fermat's principle. The correction condition of off-axis aberrations for the grating is obtained by optimizing the elliptical base shape parameters, line-space parameters, and structure parameters of the EVLS grating, with the grating's spectral focusing formula and spatial focusing curve formula considered. The global optimal solution for the instrument is then obtained via the simulated annealing algorithm and computer-aided design method to build the optimal model of the solar EUV three-waveband imaging spectrometer. Finally, the Monte Carlo method is adopted to non-sequentially trace different spectral line pairs in the target spectral band to verify the spectral imaging performance of the designed system.Results and DiscussionsFigure 3 shows the final optimized optical system layout of the designed solar EUV three-waveband imaging spectrometer. The working wavelengths of 17-21 nm, 70-80 nm, and 95-105 nm are respectively utilized for observing the solar corona, transition region, and chromosphere. The detector for the 17-21 nm band adopts the charge-coupled device (CCD) structure of e2v technology with a pixel size of 13.5 μm, while the detectors for the 70-80 nm and 95-105 nm bands leverage an active pixel sensor (APS) structure with micro-channel plate (MCP) technology, and the pixel size is 20 μm. The entire instrument has an optical envelope volume of 1700 mm×370 mm×100 mm, and the slit has five different widths to adapt to different spatial and temporal scales of solar eruption activities. High-resolution spectral imaging of the two-dimensional solar disk with an FOV of 9.6′×5.0′ can be achieved by stepwise rotation of the off-axis primary mirror.The instrument exhibits excellent imaging performance. The root mean square (RMS) radii at 17-21 nm are all less than 6 μm, while the RMS radii at 70-80 nm and 95-105 nm are mostly less than 10 μm. As the FOV increases, the radius of the diffractive spot RMS changes smoothly [Figs. 5(d)-5(f)], which indicates good correction of off-axis aberrations. At 19 nm, the modulation transfer function values at the Nyquist spatial frequency (37 lp/mm) are all greater than 0.6 [Fig. 6(a)], and the geometric encircled energy within a single pixel size (13.5 μm) is better than 82.5% [Fig. 7 (a)]. At 75 nm and 100 nm, the modulation transfer function values at the Nyquist spatial frequency (25 lp/mm) are both greater than 0.4 [Figs. 6(b)-6(c)], and the geometric encircled energy within a single pixel size is 80.5% and 85.9% [Figs. 7(b)-7(c)] for each. Generally, the spatial resolution of the system is better than 0.6″. The simulation results of non-sequential ray tracing show that the slit image length is 19.67 mm, which is consistent with the theoretically calculated value of 19.60 mm [Fig. 8 (b)]. The slit images of the spectral lines with their respective calculated ideal spectral resolution intervals at the three center wavelengths of 19, 75, and 100 nm are separated [Fig. 8 (a)]. Therefore, the spectral resolution of the imaging spectrometer system is better than 0.006 nm in the 17-21 nm band and better than 0.008 nm in the 70-80 nm and 95-105 nm bands.ConclusionsWe propose an innovative slit-scanning spectral imaging architecture that operates at 17-21 nm, 70-80 nm, and 95-105 nm. It can simultaneously diagnose and observe important plasma spectral lines in the solar corona, transition region, and chromosphere. Meanwhile, the theory of correcting the image aberrations caused by EVLS grating operating at non-Rowland circle mounting is studied. This structure can correct off-axis grating aberrations in a relatively compact design to achieve high-resolution spectroscopic imaging with broadband and large off-axis FOV. The ray tracing simulation experimental results reveal that the system's spatial resolution is better than 0.6″, and its spectral resolution is better than 0.006 nm at 17-21 nm, and better than 0.008 nm at 70-80 nm and 95-105 nm respectively. The advanced design research of this instrument has theoretical significance for the development and research of China's solar EUV imaging spectrometers in the near future and provides references for the model selection of China's future solar space exploration missions.
ObjectiveSolar tower thermal power generation technology has the advantages of high light-electricity conversion efficiency and flexible energy storage, and it has become one of the most important ways to achieve the goal of “carbon peak and carbon neutrality”. The heliostat is the core device to realize solar energy pooling in the whole tower photovoltaic power plant. It can focus the solar energy within a certain range around the heat-absorbing tower, so as to complete the light-heat conversion in the heat-absorbing device with high quality. However, the heliostat is susceptible to structural deformation due to self-weight and wind load during service, and the distance between the heliostat and the heat-absorbing tower is relatively large. The small deformation of the reflecting mirror surface of the heliostat will lead to the reflected solar beam falling on the heat-absorbing device, which will directly lead to a decrease in the light-concentrating efficiency of the heliostat and a deterioration in the quality of the light-energy distribution of the heat-absorbing device. Therefore, it is important to investigate the service optical accuracy of the heliostat under self-weight and wind load, which can provide a basis for its lightweight and high-precision design and service performance guarantee.MethodsIn this study, we study a typical lightweight small-scale heliostat of 20 m2. First, we establishe the three-dimensional (3D) model and the finite element simulation model. Second, we adopte a universal optical-machine integration modeling method previously proposed by the team to consider the service deformation of solar concentrators and establishe an optical-mechanical integration analytical model of the heliostat. We also investigate the influence of the key structural parameters under the effect of self-weight and wind load on the optical accuracy of the heliostat in service. The structural parameters include the spacing d and the number N of the three rows of supporting bolts at the bottom of each plane mirror, the structural parameters of the frame supporting the mirrors, and the parameters of the beam cross-section. The conclusions of the study can provide an important basis for the design of lightweight high-precision heliostat and the maintenance of heliostat's performance in service.Results and DiscussionsWhen the wind pressure load on the mirror surface is equal, the self-load at a height angle of 90° has the most unfavorable influence on its optical accuracy. At N=7, the maximum deformation with height angle only increases from 2.07 mm to 2.63 mm, but Dx will significantly increase from 4.21 mrad to 5.35 mrad, and Dy will only increase from 1.36 mrad to 1.73 mrad (Fig. 3). Increasing the number of supporting bolts can reduce the concave deformation of the mirror surface between adjacent bolts in a single row, thereby reducing the slope error component Dy (Fig. 4). By comparing the distribution of mirror deformation and slope error, it can be clearly observed that the maximum slope error region does not occur in the maximum deformation region, which means that there is no non-linear positive correlation between mirror total slope error and mirror deformation (Fig. 5). The decrease in stiffness of the mirror itself is the main reason for the decrease in its optical accuracy, and a support rib plate structure should be added to the back of the mirror according to actual needs, so as to enhance its load-bearing stiffness (Fig. 6). Simply increasing the size of the cantilever secondary beam angle steel may not necessarily improve the optical accuracy of the mirror but rather result in material waste. To further improve optical accuracy, efforts should be made on the structural load-bearing stiffness of the mirror itself, such as adding a support plate on the back of the mirror (Figs. 7-8). The slope of the mirror total slope error variation curve at different height angles is basically the same, with only translation differences (Fig. 9).ConclusionsIf the frame structure is not deformed, the deformation and slope error of the mirror surface under the same wind pressure increase with the increase in the height angle of the heliostat mirror, and the slope error component Dx along the mirror surface in the transverse direction is significantly larger than Dy along its vertical direction; the increase in the number N of mirror back bolts does not have a significant effect on Dx, but it can significantly reduce Dy,and the improvement is no longer obvious when N≥11. There exists a reasonable value for the column spacing d to optimize the optical accuracy. In the example, the best parameters are d=950 mm and N=11, and the maximum deformation of the mirror surface is only 2.38 mm under 360 Pa wind pressure and self-weight. The errors of mirror slope Dx and Dy are only 5.31 mrad and 0.59 mrad. The structural deformations of the frame are only 0.72 mrad and 0.17 mrad to the Dx and Dy of the reflecting mirror surface. The structural stiffness of the frame is relatively affluent, and the stiffness of the reflecting mirror surface itself is the main reason for the degradation of its optical accuracy in service. The edge length a of the angle profiles in the rack between 30 mm and 50 mm has less effect on the service optical accuracy, while the effect of the thickness t is more significant. At t=4.0 mm, the service optical performance of a=30 mm and a=50 mm are comparable, and the former can reduce 1302 tons of steel in the case of the 50 MW solar tower power plant in Delingha, Qinghai. The preferred structural parameters are d=950 mm, N=11, H=380 mm, L=1225 mm, a=30 mm, and t=3.0 mm. Under different combinations of wind pressures (0-360 Pa) and height angles (0°, 45°, and 90°), the deformation of the structure and the error of the slope of the mirror surface increase linearly with the increase in the wind pressures, and the maximum deformation is in the range of 3.63-11.76 mm. While the slopes of the mirror total slope error change curves are basically the same for different height angles β, with only translational differences. When β=90°, the slope of the curve obtained by fitting the total mirror slope error with wind pressure is 0.0126, and the intercept is 1.439. Under the action of self-weight load only, the total slope error is in the range of 1.27-1.45 mrad for the height angles of 0°-90°. The distribution pattern of mirror deformation and its slope error is completely different. The relationship between mirror slope error and mirror deformation is not linear and proportional. In engineering practice, if the optimization design or evaluation of a heliostat structure is constrained by mirror deformation, satisfactory optical accuracy may not be obtained under a service load. Therefore, optical accuracy should be used to evaluate and guide the optimization design of the heliostat structure.
ObjectiveObject detection of optical remote sensing images is the process of providing a given optical remote sensing image dataset with object positioning frame, object category, and confidence by model processing, and it is an important task in remote sensing image processing and has practical significance in both civil and military fields. In the civil field, it can be employed to analyze the situations of airport flights and ships in ports and thus facilitate timely adjustment and avoid congestion. In the military field, enemies' military deployment is analyzed by the photographed images, and feasible plans are made to ensure successful military operations. Therefore, object detection of remote sensing images has research significance and application prospect. Compared with the traditional detection algorithms, the detection method based on the convolutional neural network has become the mainstream object detection of remote sensing images. The method based on deep learning can yield better accuracy than the traditional object detection methods of visible light remote sensing images, and it is unnecessary to manually design rules, which has a relatively unified standard and enhances the model robustness. However, there are still many defects in introducing the object detection model dealing with natural images directly into remote sensing tasks. Starting from the oriented object detection difficulties of remote sensing, we design an oriented object detection algorithm for optical remote sensing images to improve the feature extraction and feature recognition ability of multi-scale and multi-directional remote sensing small targets in complex backgrounds.MethodsAiming at the poor performance of general algorithms for remote sensing oriented object detection, we propose an oriented object detection model based on SWA training strategy and feature recombination. The model is optimized based on the Rotated RPN algorithm. On the one hand, the feature recombination mechanism is introduced to make the model focus on effective features, which can reduce unnecessary computing resources and improve the model accuracy. On the other hand, based on RPN, the rotating RPN is introduced, and the position and angle parameters are regressed by the midpoint offset method to generate high-quality directed candidate frames. For the required feature inconsistency between classification and regression tasks, a polarized attention detector is employed, and the training strategy is improved. Meanwhile, the model is trained by cyclic mode to alleviate the problem that the traditional training strategy will converge to the boundary region of the optimal solution.Specifically, we conduct the following improvements based on Rotated RPN. 1) Given the problems in the object detection tasks of remote sensing images, such as a large number of small targets, a large proportion of background, and a large change in target size, the feature pyramid can not extract effective information during extracting and fusing features, which degrades detection performance. Therefore, we consider making changes in the feature pyramid to strengthen the feature extraction ability of the feature pyramid and the ability to fully fuse information of various sizes. Additionally, the reshape module is designed and integrated into the Carafe model as a deep horizontal connection of FPN. 2) To solve the problems of angle discontinuity and edge order exchange in the critical angle of the common directed box representation, we introduce the midpoint offset method to define the directed box. An adaptive attention module is designed in front of the suggested area generation module to enhance the ability of effective feature representation and further strengthen the ability of feature extraction and characterization. 3) The features required for the classification task should have the same response to different angles, which is because the focus of the classification task should be on the target itself. Thus, it should be highly responsive to the effective information inside the prediction frame, while the features required for the regression task should be sensitive to the angle change. Meanwhile, more attention should be paid to the boundary area of the target and less attention is to the information inside the prediction frame for realizing accurate angle and position prediction and reducing interference. Therefore, to avoid feature interference between different tasks and extract key features, we introduce a polarization attention module to the shared convolution layer at the front end of the dual-branch detector and adopt different response functions to distinguish the representation ability of different features. The classification head and regression head employ an activation function and an inhibition function respectively. 4) In view of the limitation that the traditional training strategy may converge to the boundary region of the optimal solution, we introduce the SWA cyclic training strategy, obtain the corresponding weights by adopting the SGD method to train more epochs, and average these results to acquire results closest to the optimal solution.Results and DiscussionsTo verify the algorithm performance, we select two remote sensing oriented annotation datasets Dior-R and HRSC2016 to compare the algorithm performance. Several typical one-stage and two-stage oriented object detection models are selected and compared with this model. On the Dior-R dataset, our algorithm yields the best accuracy of 64.49%, 4.95% higher than that of the benchmark model (Table 5). On the HRSC2016 dataset, the proposed algorithm achieves the best accuracy of 90.83%, which is 11.75% higher than that of the benchmark model (Table 7). Additionally, we analyze the performance improvement after introducing the feature recombination module, focus shift method, adaptive attention module, polarized attention detector, and SWA training strategy respectively. The experimental results show that the algorithm has sound detection performance for remote sensing oriented objects in complex backgrounds.ConclusionsTo improve the detection performance of oriented objects in remote sensing images, we propose an oriented object detection model based on feature recombination and polarized attention. The experimental results show that the algorithm can effectively detect oriented objects in remote sensing images, and has good performance in all kinds of scenes.
ObjectiveLight-absorbing aerosols have a huge impact on visibility. The atmospheric pollution they cause can pose serious risks to human health. Quantitatively assessing the optical properties and spatiotemporal distribution of light-absorbing aerosols is of vital importance for decision-making in the management and control of complex air pollution. The dynamic changes in the physicochemical properties of light-absorbing aerosols, along with their temporal and spatial heterogeneity, introduce significant uncertainties in simulating their radiative forcing. The challenges arise from difficulties in accurately estimating particle size distribution, chemical composition, and mixed state, impeding precise retrievals through satellite remote sensing, with common model simulations and radiative transfer equations assuming the presence of external mixing for light-absorbing aerosols. However, research indicates that, especially in regions prone to pollution events like East Asia, South Asia, and Southeast Asia, a "core-shell" mixed state, with black carbon as the core and scattering aerosols like sulfates and nitrates as the shell, best represents the prevailing state of light-absorbing aerosols. Rough assumptions about aerosol states not only introduce significant errors in simulating aerosol number and mass concentrations in the atmosphere but also lead to substantial uncertainties in estimating overall radiative forcing.MethodsData from both satellite and in situ measurements are employed in the present study. First, we employ the AERONET aerosol optical depth (AOD) dataset to identify polluted days at three selected sites, and we match it in space and time with the single scattering albedo (SSA) dataset combined with the TROPOMI ultraviolet (UV) SSA dataset. Second, we utilize the Mie optical model across various combinations of core and shell sizes to establish a preliminary SSA map. Subsequently, we use SSA data from six different wavebands to constrain the SSA output from the Mie model. All calculations are conducted at a daily and grid-level resolution. Upon obtaining probability distributions for core size, shell size, and their corresponding SSA and absorption coefficient (ABS) values, we then apply spatial relationships between the column total absorbing aerosol optical depth (AAOD) from TROPOMI, single-particle absorption, and size distribution. This allows us to assess the column value of black carbon mass concentration and particle number concentration.Results and DiscussionsSpatial distribution of the mean absorption coefficient obtained from the Mie model simulations during periods of severe pollution shows that the absorption coefficient of the Beijing station is generally higher, with values mainly concentrated between 0.05 and 0.07. This indicates a higher presence of light-absorbing aerosols during this period. For the Hong Kong station, most of the absorption coefficients are below 0.1, with the majority falling below 0.2 and a low standard deviation of less than 0.02. Factors related to topography and wind patterns are the primary reasons for the lower values observed in the Hong Kong station (Fig. 3). After applying spatial relationships between the column total AAOD from TROPOMI, the results show that the particle concentrations in the column at the Beijing station generally fall within the range of 3×10¹⁹-5×10¹⁹ grid-1. The number concentrations in Hong Kong are relatively lower than those in Beijing. Except for a few grid points where concentrations reach 2.5×10¹⁹ grid-1, the overall value range in Hong Kong between 1×10¹⁹ and 2×10¹⁹ grid-1. For the Seoul station, particle concentration range is from 1.5×10¹⁹ to 3.0×10¹⁹ grid-1 (Fig. 4). By considering the particle size distribution of black carbon aerosols under the "core-shell" mixed state simulated by the Mie model, the results of the spatial distribution of black carbon aerosol column mass concentration at each grid point (Fig. 6) shows that over 60% of the area of Beijing have concentrations exceeding 500 kg/grid. In the Hong Kong area, apart from certain regions within the Pearl River Delta urban cluster where black carbon column mass exceeds 500 kg/grid, the values in other areas are below 300 kg/grid. In addition, Seoul has an overall column mass concentration of less than 300 kg/grid.ConclusionsPresent study utilizes constrained particle size information and absorption coefficients to calculate the spatial distribution of atmospheric column mass concentration of light-absorbing aerosols and black carbon at various stations. It presents a novel method for simulating the optical parameters of light-absorbing aerosols and the spatial distribution of black carbon aerosol column mass concentration. The simulated black carbon mass concentration results have a good correlation with the Karman Filter emission inventory, with the estimated black carbon lifetime ranging from one to four days, which accords with the existence state of black carbon in the real atmosphere. The calculation results of black carbon mass concentration based on the Mie model proposed in this study are great and have certain application potential in the future. By comparing the model-constrained particle size distribution and absorption coefficient results before and after incorporating TROPOMI UV satellite observational data, it is demonstrated that by incorporating UV wavelength observational data as constraints, compared with results without UV constraints, the outcomes not only encompass the scattering effect of smaller-sized particles on the atmosphere but also calculate the total column mass concentration of aerosols across a broader particle size spectrum. Additionally, this approach covers a wider range of information on the spatial distribution of black carbon mass concentration.
ObjectiveWith the rapid development of optical remote sensing satellites in China, the types of satellites, imaging methods, and the number of satellites in orbit are constantly increasing. Intelligent remote sensing satellite (IRSS) and related surveying and mapping application services have become an important development direction in the field of remote sensing surveying and mapping. As a key technology, on-orbit geometric positioning is rapidly developed and has become one of the essential works for IRSS and its subsequent applications. To improve the positioning accuracy, at the same time, ground control information has to be injected into the spaceborne processing system. However, the data volume of ground control information is usually globally covered and is too huge to be directly loaded. How to lighten the ground control information, therefore, has become one of the urgent problems to be solved. The construction of an on-orbit control information library is one of the solutions. At present, most related methods are focused on the lightweight processing of control information descriptors, the performance of which is generally limited by environmental noise-affected feature diversity. To address the problem, scholars have proposed and attempted to introduce vector line features into the methods to improve its robustness. Based on this, we propose an optical remote sensing satellite positioning technology based on the lightweight vector control library, which uses the vector topology relationship to get rid of the dependence of the control point on local image grayscale information. We believe that our spaceborne lightweight vector control library can help IRSS improve on-orbit positioning accuracy and advance the development of on-orbit automatic processing technology.MethodsFirst, we extract and perfect the road information on the ground platform. Through a series of operations including road network refinement, node interruption, and road network topological relationship construction, the spaceborne lightweight vector control library is formed. Then, the road mask is extracted from the spaceborne intelligent processing module. After that, in the matching and positioning module, we propose the local vector construction method based on random walking for the unavoidable breakage phenomenon of road extraction in the spaceborne environment. Finally, we propose a hierarchical matching strategy based on the hidden Markov model (HMM) to accomplish the matching and use the offset of the matching transformation model to correct its rational polynomial coefficients (RPC) to improve the image positioning accuracy.Results and DiscussionsTo verify the effectiveness of the proposed method, we select three sets of data for testing: 1) high score No. 2 image and high score No. 7 image in Kaifeng City, Henan Province, China; 2) Jilin-1 video data and Google images in Juarez, USA; 3) Jilin-1 video data and Google images in Oklahoma City, USA. Random walk vector extraction is performed multiple times in the three sets of data, and the average number of vector nodes extracted is 13, 7, and 5 respectively (Table 1). In addition, we compare the storage capacity of this method with traditional image control points, lightweight image control points, and deep lightweight image control points method. After comparison, the storage capacity of this method is reduced by 83334.0 times, 252.6 times, and 2.3 times compared to that of the other three methods (Table 2). In the vector matching stage, the proposed methods successfully match the lightweight vector library and the random walk vector. The number of vector nodes successfully matched in the three groups of regions is 17, 21, and 5, and the encryption points are 4372, 4245, and 5591 respectively. The test results all meet the minimum requirements for the number of points for the control point to correct the image positioning accuracy. Therefore, our method is feasible and effective for correcting the image positioning accuracy. Then, we use the successfully matched vector nodes and encryption points to correct the image RPC and compare the positioning accuracy of the original image. The results show that by correcting the RPC through the proposed method, the image localization accuracy of each region is significantly improved. Specifically, the positioning accuracy of Jilin No. 2 has been increased from 79 pixel to about 4 pixel, that of Jilin-1 video data in region 2 has been increased from 675 pixel to about 16 pixel, and that of Jilin-1 video data in region 3 has been increased from 539 pixel to about 17 pixel (Table 2). Through above tests, it is verified that the proposed method can effectively improve the positioning accuracy of non-measurable optical remote sensing satellite images.ConclusionsGiven the urgent demand for spaceborne lightweight control data required of intelligent remote sensing satellite systems, we design a spaceborne lightweight vector control library. Compared with traditional control point methods, the proposed vector control library uses only the geographic coordinates and topological relationship of the control points to complete the image positioning without descriptors of local images or image points. Experiments such as vector construction, vector matching, and positioning accuracy comparison are conducted on the proposed method through multiple sets of image data to verify the matching effectiveness of the lightweight vector control library and its ability to improve positioning performance. This leads to the conclusion that the lightweight vector control library can provide high-precision global positioning information for intelligent remote sensing satellite systems and provide data support for applications such as on-orbit earth positioning and geometric correction.
ObjectiveThe automation of calibration and the accuracy of pixel extraction are the key factors in improving the efficiency and accuracy of geometric calibration of optical remote sensing satellites in orbit. With the increasing number of optical remote sensing satellites in orbit and the continuous improvement of satellite image resolution, current level of calibration automation cannot meet future development needs. The coordinates of control points and their corresponding image points are input parameters for the geometric calibration of the camera. The accuracy of their measurement and extraction directly affects the accuracy and precision of the internal and external orientation element calibration of the satellite camera. The measurement accuracy of ground control points and on-orbit attitude has reached centimeter or even millimeter-level precision. However, the pixel extraction of control point images mainly relies on manual selection or pixel measurement algorithms, which cannot match the accuracy of control point measurements. Lightweight and automated quasi-stellar source-reflected point sources are proposed to be used as ground control points, along with an algorithm for matching pixel extraction from these sources. This will be combined with on-orbit calibration experiments based on reflected point sources to verify the accuracy of pixel extraction for optical remote sensing satellites. The objective of this paper is to improve the accuracy of pixel extraction, which in turn will enhance the geometric calibration and remote sensing image positioning accuracy of these satellites in orbit.MethodsFirst, we propose a Gaussian model-based method for pixel extraction from reflected point sources and a rational function model-based method for verifying the accuracy of pixel extraction. Based on these principles, we design an experiment to verify the accuracy of pixel extraction from reflected point sources. Second, we analyse the experimental image and extract the pixels by the reflected point source method. The accuracy of the extracted pixels is then verified by template matching and nonlinear optimization methods. Finally, we verify the accuracy of pixel extraction by the reflected point source method with a rational function model and calculate the accuracy of pixel positioning by the template matching method and nonlinear optimization method. A comparative verification of the reflected point source method is conducted.Results and DiscussionsThe pixel coordinates extracted by the reflected point source method, template matching method, and nonlinear optimization method are shown in Tables 1 and 4. The results of the three methods are relatively consistent. The differences between the extracted pixel coordinates and the mean values are shown in Table 5. The maximum error is 0.0472 pixel, which is better than 0.05 pixel, which verify the accuracy of the reflected point source method for the optical remote sensing satellite. The pixel extraction accuracy is better than that of square-shaped top-hat markers and manual extraction of natural features. The validation results of the rational function model are shown in Table 7. After the maximum value is removed, the positioning accuracy of the extracted pixel coordinates using the reflected point source method, template matching method, and nonlinear optimization method in the flight direction and sensor line array direction is better than 0.04 pixel, and the planar accuracy is better than 0.05 pixel, further verify the accuracy of pixel extraction using the reflected point source method. The experimental results preliminarily indicate that the reflected point source method can achieve high-precision remote sensing image pixel extraction and meet the application requirements of high-precision targets for the geometric calibration of optical remote sensing satellites.ConclusionsThe preliminary results of on-orbit tests based on reflected point sources for optical remote sensing satellites indicate that compared to conventional methods such as template matching, the reflected point source method has an extraction accuracy of better than 0.05 pixel, which is higher than that for natural objects and artificial targets. The rational function model parameters accompanying the remote sensing images are applied to verify the positioning accuracy of reflected point source method, which is better than 0.05 pixel. Automated reflected point source method not only enable high-precision pixel extraction but also combine the array configuration of point sources with the automatic measurement of atmospheric optical characteristics in the test area. Image quality evaluation and radiation calibration are achieved for optical remote sensing satellites. This can improve the efficiency and accuracy of on-orbit calibration for optical remote sensing satellites. Automated reflected point sources are expected to be networked and deployed within the field of view of optical remote sensing satellites, forming ground control points for on-orbit geometric calibration and enabling high-precision, high-frequency, and normalized geometric radiation calibration for optical remote sensing satellites. Our study provides a reference for automated calibration and accuracy improvement of domestic remote sensing satellites and is of great significance for improving the quantitative level and application of optical remote sensing satellite images.
ObjectiveThe first Terrestrial Ecosystem Carbon Monitoring (TECM-1) satellite—Gou Mang was successfully launched on August 4, 2022 in China. TECM-1 satellite is equipped with a multi-beam LiDAR which is mainly used to obtain the elevation of land and forest. The mission of measuring the elevation of a forest requires both high-ranging accuracy and horizontal positioning accuracy. The multi-beams LiDAR on the TECM-1 satellite is concurrently equipped with an optical axis monitoring camera to obtain the footprint images, including the ground images and spot images. The centroid of the laser spot in the spot image can indicate the laser pointing angle, helping reduce the horizontal positioning errors. However, the laser spot is inevitably influenced by the background features in the spot image, and traditional centroid extraction methods are difficult to achieve ideal accuracy. Many scholars have made improvements based on traditional methods, and most of them apply noise reduction processing to the spot image, such as grayscale threshold constraint and image filtering. However, due to the influence of photography conditions and complex terrain, it is challenging for these relatively simple noise reduction methods to separate the laser spot from background noise. The centroid extraction accuracy still faces challenges in complex background scenarios. We report a laser spot centroid extraction method against complex background noise, which can effectively remove background noise from the spot image. It achieves better adaptability and higher accuracy than previous methods. We hope that our research can provide a certain reference value for the future processing and application of laser data collected by the TECM-1 satellite.MethodsA set of footprint images collected by the TECM-1 satellite consists of the ground image and spot image and the spot image can be considered to be formed by the laser spot and surrounding background features. The ground image and spot image are geometrically aligned and exhibit noticeable brightness differences due to varying exposure time (Fig. 2). Based on the characteristics of footprint images, the present study firstly crops spot area image pairs and non-spot area image pairs from footprint images. Then, the grayscale transformation coefficients are calculated by non-spot area image pairs, and the background grayscale values can be removed from the spot image. Subsequently, a distance constraint is adopted to limit the range of laser spots and a Gaussian filter is applied to smooth the spot image. Then an adaptive threshold is estimated by Otsu's method for binary segmentation. It generates a binary mask of the laser spot and with the mask processing, the noise of the spot image can be almost eliminated. Finally, the centroid coordinates of the laser spot are calculated by the grayscale centroid method. The proposed method is tested with simulated and actual spot images, and the accuracy of centroid extraction is analyzed along with the stability of the laser spot centroids.Results and DiscussionsFor the generated 10215 simulated laser spots, our method exhibits significantly improved centroid extraction accuracy compared to the Gaussian fitting method, grayscale centroid method, and ellipse fitting method. It results in an average error of approximately 0.059 pixel, and a root mean square error of about 0.074 pixel, slightly higher than those of Ren's method. The maximum error is 0.482 pixel, better than Ren's 1.828 pixel (Table 2). Furthermore, the CE90 of the proposed method is approximately 0.11 pixel (Fig. 6). In addition, our method is approximately 60% faster than Ren's method and comparable to the ellipse fitting method in processing time (Table 3). When applied to 1000 sets of consecutive footprint images obtained within 25 s, our method suggests that the standard deviation of centroid coordinates is less than 0.05 pixel. The range is within 0.2 pixel in a single direction (Table 5), demonstrating strong stability (Fig. 7 and Fig. 8). We select over 40 scenes of footprint images at intervals of 5 d to analyze the stability of centroids, and the results show that the standard deviations of centroid coordinates distribute between 0.12 and 0.34 pixel. It corresponds to horizontal distances of about 1 to 2.7 m on the ground, signifying that the relative geometric relationship between the laser and optical axis monitoring camera is relatively stable (Table 6). Additionally, the stability of centroid coordinates varies from different laser beams in the monitoring range (Figs. 9-13). It can be found that regular monitoring for the stability of centroids is necessary to comprehend centroid variations.ConclusionsWe report a laser spot centroid extraction method against complex background noise based on the footprint images collected by the TECM-1 satellite. Our method uses grayscale matching to remove most of the background noise from the spot image, followed by distance constraint, Gaussian filtering, and Otsu's image segmentation to remove the residual noise. The method ultimately calculates the centroid coordinates of the laser spot by the grayscale centroid method. Assessed by simulated and actual spot images of various terrain types, the results demonstrate that our method exhibits robust adaptability to laser spots in complex background scenarios and displays strong stability. However, for ground images with a significant number of saturated grayscale values, the present grayscale matching method cannot remove the background noise completely and it will affect the final centroid extraction accuracy. Future research should explore optimizing the grayscale transformation model or introducing other constraints to address this issue. The results of the stability analysis reveal a relatively tight jitter scope of centroids during the monitoring range, indicating a relatively stable geometric relationship between the laser and optical axis monitoring camera. Our study will be employed to support laser positioning, with the goal of enhancing the horizontal positioning precision of laser data.
ObjectiveRemote sensing technology is a method to observe and obtain information about objects and phenomena on the Earth's surface by satellites and aircraft. It allows us to obtain large-scale, multi-spectral, and high-resolution data from remote locations on Earth. The global and real-time technology features multi-spectral observation, high resolution, and multi-source data fusion without contact. Remote sensing target detection is a process of target recognition and extraction using remote sensing data. It aims to automatically detect, locate, and identify specific target types from remote sensing images, which is of significance for disaster warning and response, environmental monitoring, and ecological protection.MethodsThe traditional remote sensing image target detection algorithms include valley threshold and Sobel operator and convolutional neural network (CNN) algorithm, of which the most widely employed is the CNN. The algorithm has sound feature extraction and pattern recognition capabilities, but it is sensitive to locations and scale and may still perform poorly when small targets or large-scale changes are involved. Therefore, for the detection of remote sensing targets, it is necessary to consider many factors such as complex background, unbalanced target distribution, dense target, false detection, and missed detection. Therefore, we propose a multi-scale neural network for enhancing small target features (ESF-MNet) to deal with the low detection accuracy and poor generalization of current remote sensing targets. The core idea is to combine multiple CBH modules and CA attention mechanism to form a multi-residual cascade layer and perform efficient aggregation to enhance target feature expression. The RFE module is introduced to help the network better respond to remote sensing targets of different scales. GSConv and CARAFE modules are utilized to form the main structure of the Neck end. While reducing the amount of parameters and maintaining accuracy, the CARAFE module is adopted to improve the semantic extraction ability of the network. Meanwhile, a detection head that is more suitable for small targets is constructed to reduce the lost small target information as the network depth increases.Results and DiscussionsQualitative and quantitative experiments are carried out on mainstream remote sensing detection models such as ESF-MNet, with ablation experiments analyzed. To verify the effectiveness of each improvement point, we conduct seven experiments on DOTA and NWPU NHR-10 datasets under the same environment and parameters based on the YOLOv7 network model. The detected image targets have complex backgrounds, as shown in Table 1. If the attention effect is not employed alone, the mentioned EACM module can significantly improve the effect. The proposed receptive field enhancement module effectively captures context information at different scales. The constructed Neck layer simplifies the network structure and improves the semantic extraction ability, and the proposed detection layer is suitable for small targets and enhances the fusion of shallow features. The mAP0.5 is improved by 3.7% and 4.5% on the two datasets respectively, which proves the effectiveness of each module. The proposed algorithm is compared with other algorithms to further compare the model performance. The experimental environment is the same, with the same training set and test set adopted. Faster R-CNN, FMSSD, YOLOv5s, YOLOv7, YOLOv8s, algorithms in Refs. [21-23], and the proposed algorithm are shown in Tables 2 and 3. In terms of average accuracy value, the ESF-MNet model performs best. Especially in the aspect of custom small targets, the performance is more prominent. The mAP reaches 83.6% and 97.6% respectively. However, the algorithm accuracy does not reach the best level when detecting some large target objects (such as track and field, basketball court). The main reason is that the network depth after model lightweight is shallow and the downsampling multiple is small. If the network depth and the downsampling multiple increase, although the detection effect of large targets can be improved, poor detection of small targets will be caused. Therefore, our research focus is to improve the detection accuracy of small and medium-sized targets on the premise of ensuring higher detection accuracy for large targets. Generally, compared with other algorithms, the proposed algorithm still has obvious advantages in mAP, greatly reduces the false detection rate, and also meets the basic needs of real-time detection.ConclusionsThe detection and recognition of targets in optical remote sensing images is of significance for civilian applications. However, in the case of complex background, dense small targets, and lack of feature information, the identification of small targets is very difficult. Meanwhile, we construct an efficient layer attention aggregation module in the backbone network to extract the target features of various categories and employ the receptive field enhancement module to fuse the feature maps of different depths and thus improve the information expression ability of the network. Additionally, by utilizing GSConv and CARAFE modules to form the Neck layer, and adopting the compression method of halving the number of channels, the neck is finely processed, and the cross-stage partial network (GSCSP) module VoV-GSCSP module is designed by one-time aggregation method, which can reduce the network computation and improve the detection speed. With the addition of the CARAFE module, the detection accuracy is improved. In addition, a multi-scale network is constructed by leveraging a feature output layer with a lower sampling rate of 4, 8, and 16 times in the detection head structure, which effectively improves the detection of small targets. Experimental results show that the model has sound real-time performance and strong robustness for small target detection in complex background. Although the model has been improved, it may still has missed detection and error detection. Although the remote sensing image target detection method is mature, it is still difficult to calculate the large and complex, accurate, and efficient method. However, we will continue to study and solve these problems in the future.
ObjectiveThe quality of satellite image matching directly affects the accuracy and reliability of the subsequent block adjustment accuracy, which in turn affects the generation of products such as digital orthophoto maps (DOMs) and digital elevation models (DEMs). The traditional scale-invariant feature transform (SIFT) algorithm based on image gradient features performs poorly in handling nonlinear radiation differences, and existing phase congruency matching methods have difficulty in simultaneously handling nonlinear radiation differences and geometric differences. For example, the radiation-variation insensitive feature transform (RIFT) algorithm has difficulty in handling large scale differences; the histogram of absolute phase consistency gradient (HAPCG) algorithm has a general matching effect for large rotation problems, and the histogram of orientated phase congruency (HOPC) algorithm requires more accurate geographic reference information. There are three challenges for satellite image matching with multiple phases, multiple views, and radiation differences. Traditional Gaussian linear scale space construction methods lead to image edge blur and loss of detail in the process of building image pyramids; traditional phase congruency methods have difficulty in extracting repeatable and robust feature points, and traditional random sample consensus (RANSAC) algorithm often fails to address the high rate of gross errors in the image matching process. We proposed a phase congruency satellite image matching method based on anisotropic filtering, which could further improve the accuracy and number of correctly matched points in satellite images with significant nonlinear radiation differences and geometric differences.MethodsIn light of the challenges posed by satellite matching images with varying phases, views, and radiation differences, we proposed a satellite image matching method based on anisotropic filtering and phase congruency. Firstly, anisotropic filtering was used to establish the nonlinear scale space of the image, and then the phase congruency model was used to calculate the maximum moment map at each scale. Secondly, feature points were extracted using the block-based Shi-Tomasi algorithm on the maximum moment map at each scale, and then the Log-Gabor filter was used to establish the amplitude response at multiple scales and orientations and calculate the maximum amplitude response and its corresponding orientation index. Then, in polar coordinates, feature descriptor construction was accelerated based on OpenMP parallel computing, followed by image matching and mismatch elimination. The proposed method further enhances the matching effect of satellite images with significant nonlinear radiation and geometric differences.Results and DiscussionsDue to significant nonlinear radiation and scale differences between satellite images taken at different time, the matching performance of the SIFT algorithm is poor, and the experimental data in group F does not yield correctly matched point (NCM) pairs. Similarly, the matching performance of the RIFT algorithm is mediocre, as the significant scale differences in the satellite images taken at different times result in fewer point pairs being matched. The matching performance of HAPCG algorithm is better than that of the RIFT algorithm, as it also utilizes a nonlinear scale space construction method, providing a certain level of robustness to scale differences. However, the method proposed in this paper achieves the best matching performance, being able to match a sufficient number of point pairs in agricultural, urban, and mountainous areas. Particularly, for satellite images taken at different time (groups D-F), as shown in Figs. 16-18, the proposed method outperforms the HAPCG algorithm, even when there are certain angular rotation differences between the images. Furthermore, the matching performance of these four matching methods on the six experimental datasets is quantitatively analyzed, including the statistical data for the NCMs and the root mean square error (RMSE), as shown in Table 1.ConclusionsIn response to the poor matching effects of satellite images with multiple phases, multiple views, and radiation differences, we propose a phase congruency image matching method based on anisotropic filtering. By utilizing anisotropic filtering to establish a nonlinear scale space for images, we propose an improved feature descriptor construction method for the phase congruency model and implement feature descriptor acceleration construction based on OpenMP parallel computing. The proposed method has demonstrated significant advantages in terms of NCMs compared with existing matching algorithms, particularly excelling in handling weak texture, repetitive texture, non-coincident time phases, and nonlinear radiation differences. In the future, we will explore how to integrate cutting-edge technologies such as deep learning to further enhance the robustness and applicability of the matching method.
SignificanceVisibility is a basic meteorological parameter and is regarded as a weather index to understand atmospheric stability and vertical structure. Unlike horizontal visibility, slant visibility is a crucial parameter that pilots are actually concerned about, and it directly determines the safety of aircraft take-off and landing in the aviation field. In addition, slant visibility is an important parameter for space target recognition and plays an important role in the field of weather analysis, sea, land, and air traffic, astronomical observation, sea fog warning, and so on. Therefore, slant visibility, as a highly concerned atmospheric optical and meteorological parameter in recent years, has shown important scientific research significance and application value in atmospheric research, civil aviation, space exploration aerospace, military, and other fields.With the development of lidar technology, few lidar visibility meters have appeared in recent years, with single-wavelength Mie-scattering lidar as the core, and two types of inversion algorithms have been developed. One is the slant visibility inversion method based on Koschmieder's visibility law, in which the measurement of slant visibility only depends on the inversion of atmospheric aerosol extinction coefficients; the other is the inversion method based on optical thickness, in which the atmospheric optical thickness obtained by multi-elevation angle lidar detection is used to estimate the slant visibility. However, the main limitation lies in the neglect of the influence of scattered radiance and the uniform path assumption. As a result, these inversion methods have certain inversion defects. In addition, previous research has begun to pay attention to the atmospheric scattered radiance. However, most of them focus on theoretical modeling and simulation analysis, and thus in-depth study and further exploration are greatly required.To solve the difficulty of atmospheric scattered radiance, the research team of Xi'an University of Technology recently developed a new slant visibility measurement method by lidar and the radiative transfer model (Fig. 6). By taking full advantage of laser remote sensing, aerosol lidar detection was carried out with the high spatial-temporal resolution and high-precision, and the real-time aerosol information including optical, micro-physical, and scattering parameters was provided. The radiative transfer model realized the path distribution of actual atmospheric scattered radiance (Fig. 9), which fundamentally solved the current technical bottleneck of slant visibility measurements. Moreover, a reflectance measurement system was supplemented to provide the intrinsic contrast of the object and the background, and the slant visibility measurement considering the correction of atmospheric scattered radiance was ultimately achieved (Fig. 10).ProgressAtmospheric visibility can be measured by visual methods or visibility instruments. Both the forward-scattering-type and the transmission-type visibility meters can measure horizontal visibility. However, they are unable to provide information on slant visibility.Conclusions and ProspectsWe comprehensively review the main techniques and research progress of laser remote sensing in slant visibility measurements, and several slant visibility inversion methods are sorted out. The shortcomings and limitations of the existing techniques are investigated as well. In view of the difficulty of actual atmospheric scattered radiance, a new remote sensing technique combining lidar and the radiative transfer model is mainly introduced, which has effectively broken through the bottleneck of slant visibility measurements. In the future, with the development of satellite remote sensing technology, it is envisioned to achieve the global map of slant visibility by laser remote sensing technology.
SignificanceThe observation of atmospheric far-infrared radiation is of significance for a deeper understanding of radiation exchange and balance in the earth-atmosphere system, especially in polar regions. More importantly, compared with other bands, far-infrared bands have inimitable advantages in remote sensing of ice clouds, upper layer water vapor in the troposphere, and atmosphere ingredients.On the one hand, far-infrared radiation plays a crucial role in regulating climate and energy balance. Far-infrared radiation accounts for about 40% to 65% of the Earth's energy emitted to space and thus makes great contributions to the Earth's OLR (outgoing longwave radiation) and atmospheric cooling. However, there is still significant uncertainty in addressing the key issues related to heat flux regulation factors in cold and dry polar conditions due to the limited observations of far-infrared radiation, which has a negative influence on the accuracy of climate models. On the other hand, in atmospheric remote sensing, far-infrared spectra are highly sensitive to low-concentration water vapor in low temperature conditions, making it important for remote sensing of water vapor in polar regions, and in the upper troposphere and lower stratosphere. Additionally, the complex refractive indices of water and ice exhibit different spectral characteristics in mid-infrared and far-infrared bands, further enhancing the ability for cloud detection and phase recognition. Meanwhile, far-infrared hyperspectral radiation is considered to have the potential to improve the retrieval accuracy of microphysical and optical properties of thin ice clouds.However, currently direct measurements of far-infrared radiation at hyperspectral resolution are still relatively limited due to technical issues related to precise spectroscopic and highly sensitive measurements. The most recent measurement of spaceborne far-infrared hyperspectral spectra can be traced back to the 1970s when the National Aeronautics and Space Administration of the United States (NASA) launched the Nimbus-III and Nimbus-IV using the IRIS (infrared interferometer sound) infrared interferometer, which measured far-infrared to mid-infrared radiation with a relatively rough spectral resolution (2.8 cm-1) and a spatial resolution ranging from 400 cm-1 to 1600 cm-1. However, this is still the only satellite borne far-infrared radiation spectral observation data that can be obtained on a global scale. The main technical difficulties for spaceborne far-infrared radiation measurements lie in high-sensitivity detectors and hyperspectral optical systems (such as beam splitters). Due to the low photon energy in the infrared band, traditional infrared hyperspectral interferometers often require cooling by liquid helium (or liquid nitrogen) to improve measurement accuracy and signal-to-noise ratio, and this cannot be extended to satellite applications. Additionally, the moving mirror system of the Fourier spectrometer must also consider tilt and other errors when carried in space. These factors have become the main constraints on the development of high-precision and hyperspectral measurements of atmospheric far-infrared radiation for spaceborne payloads.In recent years, with the development of high-sensitive uncooled detectors and beam splitters, a few comprehensive observation experiments of atmospheric far-infrared radiation at hyperspectral resolution have been conducted based on ground-based and airborne prototypes. Institutions such as the European Space Agency (ESA) and the NASA have also proposed a series of missions to observe far-infrared radiation by satellite instruments. Retrievals of ice cloud characteristics using hyperspectral far-infrared radiation have become an important frontier field and research hotspot. Thus, it is important and necessary to summarize the existing research to guide the future development of this field more rationally.ProgressThe main theoretical basis of far-infrared hyperspectral remote sensing is reviewed and summarized. We also introduce the advantages of far-infrared hyperspectral remote sensing of ice clouds from atmospheric absorption and ice crystal particle scattering sensitivities. Afterward, the development of far-infrared hyperspectral instruments for atmospheric remote sensing is sorted and summarized, with a focus on the technical parameters and key technical issues of the relevant instruments. From the perspective of technological breakthroughs in far-infrared radiation measurements, the key technologies associated with detectors, spectrometers, and beam splitters currently adopted have been classified and introduced (Tables 1-3). From the perspective of the platforms, the corresponding instruments and observation experiments of ground-based and airborne, and the main experimental results are introduced. Then, the main spaceborne missions to measure atmospheric far-infrared at hyperspectral resolution are summarized, including FORUM (ESA) and PREFIRE (NASA). Subsequently, the advantages and research progress of far-infrared hyperspectral technology for remote sensing of ice clouds are discussed. Since far-infrared spectra can provide complementary information on remote sensing of ice clouds, we compare studies about synergistic retrievals of ice cloud parameters and phase recognition by far-infrared and mid-infrared spectrum. In the end, the problems and the ongoing research trends in this field are discussed, including possible technological breakthroughs in the future and possible innovations in the future. The potential applications of far-infrared hyperspectral technology in ice cloud remote sensing in the future are also pointed out.Conclusions and ProspectsFar-infrared radiation measurements with hyperspectral resolution and highly sensitive measurements are gradually becoming a popular tool for atmospheric remote sensing. In summary, conducting global ice cloud remote sensing by hyperspectral far-infrared in the future still calls for in-depth and detailed explorations to promote the development of instrument technology, and also calls for a large number of observational experiments to develop accurate forward and retrieval algorithms.