


Please enter the answer below before you can view the full text.
5+2=

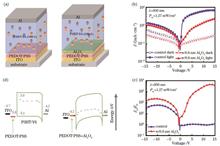
ObjectiveThe photomultiplication organic photodetector based on trap-assisted carrier tunneling mechanism not only has high sensitivity but also simplifies system design and effectively improves the weak light detection performance of the photodetector. At present, photomultiplication organic photodetectors mainly focus on the visible range and have relatively few responses in the near-infrared region. Detection in the near-infrared region has broad application prospects in many fields and the demand is becoming increasingly urgent. Intermolecular charge transfer is a low-cost method for achieving near-infrared absorption in organic photomultiplier detectors, which can effectively expand the response band of devices. However, the absorption is low and the response is very weak at long wavelengths. The photomultiplication type devices can amplify weak photocurrent signals and improve device performance. Therefore, by introducing a small amount of organic acceptor Y6 in the P3HT active layer, we fabricate a photomultiplication type organic photodetector. Due to the intermolecular charge transfer between P3HT and Y6, the response band of the device can be extended to 1310 nm, which is superior to the reported near-infrared multiplication type organic photodetectors. By introducing an atomic level thickness of Al2O3 between the hole transport layer and the active layer, the device can work under both positive and negative biases. The external quantum efficiency of the device at 860 nm reaches 800%, with a detectivity of 5.6×10¹¹ Jones. The external quantum efficiency of the device at 1310 nm reaches 80.4%, and the specific detectivity reaches 5.13×10¹⁰ Jones. This work can promote the development of near-infrared photomultiplication organic photodetector.MethodsFirstly, the cleaned ITO substrates are dried by nitrogen gas and transferred to a glove box. PEDOT∶PSS is diluted with anhydrous ethanol in a volume ratio of 1∶9 and is span-coated onto the ITO substrate to form a hole transport layer. Then, the Al2O3 interface modification layer is deposited by atomic layer deposition equipment. Subsequently, the active layer is formed by spin-coating P3HT∶Y6 mixture solution, with a P3HT and Y6 ratio of 100∶1 in weight. Finally, the Al electrode is deposited on the active layer by thermal evaporation. The bright and dark currents of the device are obtained by a digital source meter Keithley 2400 and different light sources in a sealed and room temperature state. The testing of external quantum efficiency and responsiveness is performed in a dark shielding box, with ITO as the anode connecting to the positive pole of the power supply and Al as the cathode connecting to the negative pole. The digital source meter Keithley 2400 is adopted to apply different voltages, and a femtosecond laser is utilized as the light source. The light intensity is attenuated to a specified size by an attenuation plate, and the dark current and bright state J-V curves under different light sources are collected. Finally, the external quantum efficiency and responsivity data are obtained through calculation (the data has been background deducted). The linear dynamic range, noise current, and specific detection rate of the device are tested, and the performance of the device is comprehensively analyzed. A spectrophotometer instrument is leveraged to characterize the ultraviolet visible near-infrared absorption spectrum. In addition, the transmission spectrum, reflection spectrum, and film thickness of the device are also tested.Results and DiscussionsAl2O3 modified device with a structure of ITO/PEDOT∶PSS/Al2O3/P3HT∶Y6 (100∶1)/Al and a control device without Al2O3 are both fabricated. We verify that the Al2O3 interface modification layer can greatly reduce the dark current of the device and enable the device to achieve bidirectional bias response (Fig. 1). Next, the Al2O3 modified device is characterized, and the device can respond to 1310 nm. The weak light detection limit of the device at 505 nm can reach 7.8 nW/cm2. When the optical power density is 3.8×10⁻⁴ mW/cm2, the external quantum efficiency of the device at 860 nm is 800%, with a specific detectivity of 5.6×10¹¹ Jones. When the optical power density is 3.67×10⁻² mW/cm2, the external quantum efficiency of the device at 1310 nm is 80.4%, with a specific detectivity of 5.13×10¹⁰ Jones. Under the irradiation of visible light at 505 nm and near-infrared light at 860 nm, the device has a dynamic range of over 125 dB and 90 dB, respectively (Fig. 2 and Fig. 3). The comprehensive performance of the device has certain advantages compared to the near-infrared organic photomultiplier detectors prepared in recent years. By introducing an organic receptor Y6 with light absorption ability in the near-infrared region, the device effectively promotes the injection of holes from external currents as an electron trap and interacts with P3HT, expanding the corresponding band and achieving high sensitivity detection in the near-infrared region (Fig. 4).ConclusionsA low-cost and highly sensitive near-infrared photomultiplication organic photodetector with a structure of ITO/PEDOT∶PSS/Al2O3/P3HT∶Y6/Al is reported. By adding Al2O3 as an interface modification layer, the dark current of the device is significantly reduced, resulting in a device that can respond in both forward and reverse bias directions. Adding a small amount of Y6 to the active layer can achieve a wide spectral response from UV visible to near-infrared, and the response wavelength can be extended to 1310 nm. The external quantum efficiency of the device at 860 nm reaches 800%, with a specific detectivity of 5.6×10¹¹ Jones. The external quantum efficiency of the device at 1310 nm reaches 80.4%, and the specific detectivity reaches 5.13×10¹⁰ Jones. These properties have certain advantages in reported near-infrared photomultiplication organic photodetector and can promote the development of near-infrared photomultiplication organic photodetectors.
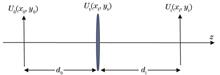
ObjectiveIn modern optical research, the electromagnetic theory of light propagation, interference, and diffraction was systematically described in M. Born and E. Wolf's Principles of Optics and Joseph W. Goodman's Introduction to Fourier Optics. The coherent optical imaging theories in the two classic works are widely cited by contemporary scientists and technological workers. However, both theories are obtained in approximate conditions. The calculation formulas given in Principles of Optics are derived based on assuming the existence of an "isoplanatic region" in the image plane. The derived formula introduces a pupil function that is only related to the optical system aberration and the exit pupil does not provide a specific expression for the pupil function, which cannot be employed for practical calculations. The calculation formula given in Introduction to Fourier Optics can only calculate the amplitude distribution of the image field when the object size is less than 1/4 of the diameter of the incident pupil.From a mathematical perspective, the formulas derived from the two optical masterpieces have the same form, and coherent optical imaging systems are both linear space-invariant systems. The physical meaning of the transfer function defined by the outgoing pupil is a filter for the ideal image spectrum.With the advancing technology, the above approximate theories are gradually unable to meet practical needs. For example, experimental observations indicate that the imaging quality varies in different regions of the image plane, and the imaging system illuminated by coherent light is not a linear space-invariant system. Additionally, in modern optical detection research, the amplitude and phase of the image field are equally important physical quantities, and the theory that can only calculate the amplitude distribution of the image field cannot meet the requirements. Therefore, it is necessary to study theories that can accurately calculate the amplitude and phase distribution of image light fields.MethodsBased on Fresnel diffraction integration, the spatial tracing of the optical wave field during the imaging of the lens imaging system is carried out, and the expression that can calculate the amplitude and phase distribution of the image light field is derived. Based on the derived formula, the shortcomings of the coherent optical imaging theory in the above-mentioned two optical masterpieces are first studied.Considering currently no reports of quantitative numerical calculations on "ringing oscillation" in coherent optical imaging, ringing oscillation is an interference that must be eliminated for the image field of digital holographic detection. To experimentally prove the formula derived by the authors and provide a theoretical basis for eliminating ringing interference, we design a microscopic digital holography system. By adopting a USAF1951 resolution plate as the object, the intensity distribution of the image field is calculated using the calculation formula given in Introduction to Fourier Optics and the formula derived by us and compared with experimental measurements. In comparative studies, special attention should be paid to whether the theoretical distribution calculation of ringing and oscillation fringes is consistent with experimental measurements.Results and DiscussionsBased on the derived formula [Eq. (6)], the coherent optical imaging system is no longer a linear space-invariant system. The research results on the coherent optical illumination imaging formula in Principles of Optics indicate that for actual optical systems, there is no "isoplanatic region" in the image field, and there is no pupil function that is independent of the object field but only related to the exit pupil and aberration of the imaging system. The calculation formula given in Introduction to Fourier Optics can only approximate the amplitude distribution of the image light field when the object size is smaller than the diameter of the incident pupil by 1/4.The comparison between theoretical calculations and experimental measurements shows that the derived Eq. (6) can more accurately calculate the distribution of ringing and oscillating fringes appearing in the image light field (Figs. 8-10).ConclusionsFormulas that can calculate the amplitude and phase of the image light field are derived by spatial tracking of the coherent optical imaging process, and the shortcomings of classical coherent optical imaging theory are discussed. An imaging experiment with a rectangular transparent hole as the object is designed to prove the correctness of the derived formula. Meanwhile, the classical imaging calculation formula and the derived formula are utilized to simulate and calculate the experimental measurement image. The research results indicate that the derived formula can not only accurately calculate the intensity image of the image light field, but also more accurately calculate the distribution of ringing oscillations.
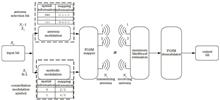
ObjectiveAs a new multiple-input multiple-output (MIMO) technique, spatial modulation (SM) is limited because it can only activate one antenna each time. Generalized spatial modulation (GSM) can activate multiple antennas, but the transmission rate is not ideal when the same information is sent at the same time. By activating multiple or even all antennas to transmit information, the fully generalized spatial modulation (FGSM) technology improves the utilization rate and transmission rate of the system's transmitting antennas, but different antenna selections lead to significant performance differences of error codes. To ensure reliability and further improve the application range of FGSM-MIMO systems, researchers have introduced different antenna selection algorithms.MethodsWe propose a Pearson coefficient selection algorithm based on the basic principle of antenna selection by the Pearson coefficient between the photodetectors and LED combinations at different locations, thus improving the performance of the FGSM system and enhancing its applicability.Results and DiscussionsFor GSM, the number of active antennas at the transmitting end is two and three antennas respectively, and there are four transmitting antennas in the FGSM system. The simulation results show that the bit error rate of the GSM-MIMO system is better than that of the FGSM-MIMO system under the premise of sending the same symbol. When the bit error rate is 10-3, FGSM-MIMO loses 4.3 dB and 9.3 dB respectively compared with the GSM-MIMO system, which is because the transmission rate of the FGSM-MIMO system is higher than that of the GSM-MIMO system in transmitting the same symbol (Fig. 4). When the modulation order of the pulse amplitude modulation (PAM) is the same, the transmission rate of the FGSM system increases with the rising number of antennas, but the error performance is sacrificed. According to Fig. 5, the actual simulation reliability of the FGSM system is higher than that of the theoretical simulation under low signal-to-noise ratio (SNR), and the two basically coincide under high SNR. When the number of transmitting antennas is set to 6 and 4 respectively, compared to the two FGSM systems, the FGSM system with 6 transmitting antennas loses 4.8 dB SNR when the bit error rate is on the order of magnitude, but the transmission rate is increased by 2 bpcu (Fig. 5). All four antennas at the transmitting end are activated with the 2-PAM modulation mode adopted, and the transmission rate is 4 bpcu. The simulation results show that the bit error rate of the FGSM-MIMO system based on the Pearson coefficient selection algorithm is better than that of the random selection algorithm and maximum norm selection algorithm. The antenna selection algorithm based on Pearson coefficient has a 5.1 dB improvement over the random selection error rate and a 0.8 dB improvement over the maximum norm error rate at the order of bit error rate. This is because the proposed algorithm selects the optimal antenna combination according to Pearson coefficient correlation without dependence on the system channel characteristics, and thus realizes the multiplexing of time domain and space domain. With the improved antenna selection algorithm, the opening degree and shape of the eye image are gradually expanded and improved, which is realized by the antenna algorithm optimization system to make the signal shape closer to the ideal square pulse (Fig. 7).ConclusionsThe communications technology that integrates visible light communications and SM is still a research hotspot nowadays, but the transmission rate of traditional SM is low. A scheme that integrates FGSM and visible light communications is proposed to transmit data by activating multiple or even all antennas, thus addressing the low transmission rate of traditional SM. The transmission rate is proportional to the number of transmitting antennas and is improved. Meanwhile, by adopting the antenna selection algorithm based on the Pearson coefficient, the error performance of the FGSM system has been significantly improved and is better than other schemes. Under the premise of improving the transmission rate, the space utilization rate has also been enhanced, which provides a guarantee for visible light communications. The results show that the transmission rate of the FGSM system is higher than that of the GSM system under the same number of antennas and modulation modes, but the error performance will be lost. Complete indexing of different numbers of antennas will increase the transmission rate and reduce the error performance.
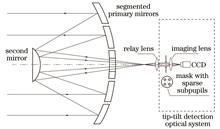
ObjectiveIn order to observe more distant and fainter objects with a better resolution and signal-to-noise ratio, larger primary mirror telescopes are required to improve the diffraction limit and increase the collected light energy. This leads to problems of manufacture, testing, transportation, and launch for monolithic primary mirrors. At present, it is hard to build a monolithic primary mirror with a diameter of 8 m or larger. The segmented primary mirror is thus adopted to address these issues. However, tip-tilt errors between segments must be eliminated to meet the requirements of the light-collecting capacity and resolution. The existing tip-tilt error detection approaches mainly include the centroid detection method, phase retrieval/phase diversity (PR/PD) method, Shack-Hartmann phase sensing method, and other methods based on interferometry. In tip-tilt error detection, the centroid detection method is usually used in the coarse stages, and the PR/PD is used to eliminate the uncertainty of the centroid detection method in the fine stages. The Shack-Hartmann phase sensing method is separately used in coarse and fine stages, which also involve special-purpose hardware, complex structure, and unstable factors.MethodsIn this paper, a novel method, for detecting tip-tilt errors in a large capture range with a better accuracy via phase transfer function (PTF), is proposed. A mask with a sparse subpupil configuration is set on the segments' conjugate plane and serves as the entrance pupil of the tip-tilt error detection system. Then, the optical transfer function (OTF) with separated sidelobes can be obtained by the Fourier transform of the point spread function (PSF) recorded in the charge-coupled device (CCD) of the detection system, which makes it possible to separate the information of tip-tilt errors overlapped in the PSF. By analyzing the OTF sidelobes, the relationship between the phase distribution gradient of the OTF sidelobes and tip-tilt can be derived and used to extract the tip-tilt error without the measurement uncertainty of the centroid detection method, which makes the tip-tilt error detection realized with better accuracy in a large dynamic range. Simulations and experiments are conducted to verify the correctness of the proposed method. We set up a two-segmented system as shown in Fig. 2, and the tip-tilt errors are introduced from different ranges. In the small range, we introduce the tip-tilt errors from 0 to 0.4λ by the step of 0.008λ. In the large range, the tip-tilt errors are introduced from 0.4λ to 2.4λ by the step of 0.04λ. In the experiment, we verify the method on the basis of the active cophasing and aligning testbed with segmented mirrors as shown in Fig. 6. The tip-tilt errors can be obtained by calculating the differences between every two centroid positions of the images formed by the segments on the focal plane. Through this experimental platform, the tip-tilt error detection method proposed in this paper is compared with the centroid detection method to achieve correctness verification. For this purpose, the mask of the tip-tilt error detection module (TEDM) is redesigned, and the original hole D is replaced with three discrete holes, as shown in Fig. 7. We have also performed preliminary simulations of the effects caused by CCD noise and figure error on the method described in this paper.Results and DiscussionsSimulation results show that the tip-tilt error can be detected with high accuracy over a large dynamic range as shown in Fig. 4 and Fig. 5, and the root-mean-square (RMS) has the order of magnitude of 10-15λ, which conforms to the detection requirements of the tip-tilt errors. Compared with the existing methods, this method does not need to divide the error detection into two stages and can effectively eliminate the measurement uncertainty of the center-of-mass detection. On the active cophasing and aligning testbed with segmented mirrors we set up before, experiments have been carried out to verify the feasibility of the method, and the RMS of detection accuracy of the method is 2.99×10⁻³λ, which meets the cophasing requirement of segmented telescopes. The experiment results are given in Table 1, Table 2, and Table 3. In addition, some factors affecting the detection accuracy of the proposed method, such as CCD noise and figure error of the tested segments, are analyzed by simulations, and the results in Table 4 and Table 5 show that in order to meet the cophasing requirement of λ/40 (RMS), the signal-to-noise of CCD and the figure error of segments should be better than 40 dB and 0.05λ (RMS), respectively.ConclusionsBecause of the setting of the sparse subpupil configuration and the intervention of the Fourier transform, the method in this paper effectively separates the tip-tilt errors of the segmented system in the spatial frequency domain. Then, the uncertainty of the centroid detection method during the measurement of the small errors is eliminated. The detection accuracy of the tip-tilt errors is ensured and improved. The tip-tilt error detection method simplifies the detection process and eases the demanding hardware required in existing sensing methods, and cophasing is no longer divided into coarse and fine stages that involve separate dedicated hardware solutions. This method can be adapted to any segmented primary mirror and sparse-aperture telescope system with any shape of the sub-mirror.
ObjectiveThe calibration method based on polynomial fitting can obtain the camera response function (CRF) curve and image exposure ratio under the lack of camera exposure time, and has wide applicability. However, the method has the problems of iterative dispersion and low calibration accuracy, thus affecting its practical applications. We analyze the flow of the traditional polynomial fitting calibration methods and find that the calibration data set contains a large amount of invalid data under the global error function, which not only reduces the quantity of effective calibration data but also causes inaccurate iterative image exposure ratio parameters. To this end, we propose an improved joint local error function calibration method, which can select the calibration data between two images with similar exposures to avoid the introduction of invalid terms and make the data for calculating the polynomial coefficients and exposure ratios consistent. The calibration results of the public data set and an industrial camera show that the improved method has better convergence, the color three-channel CRF curves are more compactly distributed than that of the traditional methods, and the average deviation of the exposure ratio between channels is reduced by 49.83% and 42.25% respectively. The code of the improved calibration method can be downloaded at https://github.com/GuanBanglei/CRF_Calibration.MethodsWe improve the traditional CRF polynomial fitting calibration method to make the calibration results more accurate. Firstly, by analyzing the flow of the traditional calibration method, the reason for the dispersion of the calibration process and the inaccuracy of the results is the large number of invalid terms in the calibration data set. This results in inconsistencies in the set employed to calculate the polynomial coefficients and exposure ratios. Secondly, we rewrite the global error function as a local error function and select the calibration data by dividing two images with adjacent exposure levels into a group to avoid invalid terms in the calibration set. In this case, the set of calculated polynomial coefficients is the same as that of data adopted to compute the exposure ratio. During the iterative computation, the equations for all multiple exposure combinations are united to ensure global optimization. Thirdly, the improved method is tested on the publicly available data set office and an industrial camera respectively. Compared with the traditional method, the improved method outputs more compact CRF curves for the three color channels with better consistency of exposure ratio data.Results and DiscussionsFirstly, our method has better calculation accuracy. From the exposure ratio values among images of different exposure levels in Table 3, we find that the maximum exposure ratio difference between different color channels is 0.1506 and the average difference is 0.0603, while the corresponding values are 0.0664 and 0.0333 respectively in our method. The maximum difference and the average difference have a 59.96% reduction and a 49.83% reduction respectively. For the industrial camera (Table 4), the maximum deviation is reduced by 63.35% and the average deviation by 42.25%. Secondly, a reasonable explanation is given for the distribution of CRF curves for the three color channels. In Fig. 2, the B-channel curve is at the top, the G-channel curve is in the middle, and the R-channel curve is at the bottom. This is because the three color channels have different quantum absorption efficiencies for the spectrum. As shown in Fig. 5, in the absorption spectrum of silicon from 400 to 950 nm, the envelope of the B channel is the smallest, the R channel is the largest, and the G channel is the middle. For the uniform ambient spectrum, the B channel has the smallest pixel value, the R channel has the largest, and the G channel has the middle. It means that for the same pixel value, the B channel represents the largest irradiance, the G channel is the second largest, and the R channel is the smallest. As for the industrial camera, the G channel is slightly smaller than the R channel due to the working wavelength of the ordinary lens, with the working wavelength of ordinary lenses being about 360-780 nm. However, the B channel still indicates the highest radiation, demonstrating the distribution reasonableness of the calibration curves in Fig. 4. Thirdly, polynomials with an odd maximum order are more suitable for convergence during iterations. For the adopted data set, the iterative process is dispersed when the maximum order is 4 and 6, and overfitting occurs in the B and R channels when the maximum order is 5. The optimal result of the Office data set is obtained when the maximum order is 3.ConclusionsThe proposed improved polynomial fitting CRF calibration method can address the inconsistency between the coefficients of the solved iterative polynomials and the set of exposure ratio data, which exists in the traditional calibration method, and enhance the accuracy of the CRF calibration and exposure ratio calculation of the images. The calibration results on the public data set and an industrial camera show that the maximum deviation of the exposure ratios between different color channels is reduced by 59.96% and 63.35% respectively, and the average deviation is reduced by 49.83% and 42.25% respectively. The distribution reasonableness of CRF curves is demonstrated by analyzing the spectral quantum absorption efficiency of the three channels of the color camera. Finally, the relationship between the highest order of the fitting polynomial and the convergence of the CRF calibration curves is discussed to provide guidance for the practical applications of the proposed method.
ObjectiveOptical sparse aperture (OSA) imaging system is composed of multiple discrete circular sub-apertures, which attempts to obtain a resolution approximately equivalent to a single filled large aperture system with reduced size, cost, and weight. However, compared with a single aperture system, the performance of these sparse arrays strongly relies on various design parameters, such as the number of sub-apertures, their relative positions, and diameters. Due to the discreteness and sparsity of the sparse aperture array, the pupil function is no longer a connected domain, which further reduces the intermediate frequency modulation transfer function (MTF), thus degrading images. To address this issue and enhance the intermediate frequency MTF while improving the imaging quality, a one-dimensional non-redundant three-aperture structure with a sub-aperture spacing ratio of 1∶2 is selected as a foundational array, and the position of the middle sub-aperture is fixed. Then a novel rotating synthetic aperture structure is designed by rotating the base array several times along the baseline direction at different angles within 360°. Both quantitative and qualitative evaluations of simulation and experimental results demonstrate the effectiveness of the proposed method.MethodsThe pupil autocorrelation distribution of one-dimensional multi-aperture arrays is first analyzed. Since the three-aperture structure with a center distance ratio of 1∶2 of two sub-apertures can obtain greater frequency domain coverage with fewer rotation times and a smaller filling factor, this structure is selected as the fundamental array. To create a new synthetic aperture structure, this three-aperture array is rotated by an angle α along the baseline direction around the intermediate sub-aperture. To ensure adherence to the design requirements of the sparse aperture array and prevent overlap between any two sub-apertures in space, various constraint conditions for structural parameters are computed. These constraints encompass parameters such as the center spacings (s1 and s2) of the two sub-apertures, the rotation angle α, and the center position coordinates of the rotated sub-apertures. In addition, the pupil function, point spread function (PSF), and MTF of the rotated arrays are derived. The imaging characteristics of the array structure synthesized by a single rotation are simulated. Notably, the MTF frequency domain coverage of the rotating synthetic aperture is not a simple sum of two directions but rather an expansion, and PSF changes from fringe distribution in one direction to speckle and linear distribution in different directions. In order to increase the coverage of the rotating synthetic aperture in the whole frequency domain, rotation is repeated multiple times to synthesize new apertures. Specifically, the rotation within 360° is performed six times per 2π/7, five times per π/3, four times per 2π/5, three times per π/2, and two times per 2π/3, respectively. The obtained arrays are denoted as OR6, OR5, OR4, OR3, and OR2, respectively.Results and DiscussionsAccording to the theoretical model, with the increase in the single rotation angle in Fig. 4, the energy of MTF and PSF is mainly concentrated in the central region. The sidelobe energy of MTF is continuous along two directions of the pupil structure and gradually presents a point-like discrete distribution in other directions, covering a wider range of frequency domains. Figure 6 shows the pupil structure, as well as the PSF and MTF distributions of Golay-9 and five rotating synthetic arrays. As the number of rotations decreases, the MTF frequency domain coverage of the rotating synthetic aperture becomes smaller and presents a discrete distribution. The PSF energy of the OR6 array is almost all concentrated in the center, which is close to the PSF distribution of the single aperture. The PSF sidelobe of the OR5 and OR4 arrays is converged toward the center. However, the PSF energy distribution of OR3 and OR2 arrays is more discrete, and the sidelobe energy is continuously enhanced. At the same equivalent diameter, the MTF distribution in the Golay-9 array is relatively uniform, but its intensity is low in the middle and high frequency bands, and the PSF presents a discrete circular spot distribution, which degrades the image. In the fx direction in Fig. 7, the MTFs of OR5 and OR3 arrays in the frequency range of 0.4-1.0 are close to that of equivalent single aperture and is higher than that of Golay-9 arrays in the whole spatial frequency range. Moreover, the MTF of OR6, OR4, and OR2 arrays in the frequency range of 0.18-0.6 is higher than that of Golay-9. In the fy direction, the MTFs of four rotating synthetic arrays are greater than that of the Golay-9 array in the frequency range of 0.2-0.6, and the MTF of the OR3 array in the frequency range of 0.15-1.0 is greater than that of the Golay-9 array. At the same equivalent diameter, Mmid-freq, peak signal-to-noise ratio, and structural similarity of rotating synthetic aperture arrays are higher than that of the Golay-9 array.ConclusionsIn this study, the rotating synthetic aperture arrays for improving intermediate frequency MTF and image performance are proposed, which are obtained by rotating a one-dimensional non-redundant three-aperture array several times at different rotation angles within 360°. The MTF of the OR3 array surpasses that of the Golay-9 array across the entire frequency range in both the fxand fy directions. However, three evaluation indexes of the five rotating synthetic arrays are higher than those of the Golay-9 array. According to the experimental results, the normalized gray difference values of the sixth group of horizontal and vertical bar pairs of USAF1951 resolution board images of Golay-9, OR4, and OR3 arrays are compared. The maximum difference values of Golay-9, OR3, and OR4 arrays are 0.2728, 0.3548, 0.5851 for horizontal lines, as well as 0.2291, 0.3499, and 0.4647 for vertical lines, respectively. A higher difference implies greater image contrast. Moreover, the MTF estimation of OR3 and OR4 arrays is higher than that of the Golay-9 array, which proves the validity of the proposed array structure design method.
ObjectiveAugmented reality technology can superimpose virtual information onto the real environment, which has a broad application prospect in the field of aircraft assembly. At present, aircraft piping and cables still mainly rely on manual assembly, usually using 2D drawings or 3D models for guidance. However, 2D drawings are usually difficult to accurately display complex assembly details, which can easily lead to misunderstandings or omissions. Furthermore, computers are usually placed in designated areas outside the cabin, so that workers need to interrupt the assembly work to view the 3D model, resulting in low assembly efficiency. With the help of augmented reality technology, the 3D model, process information, and other virtual content can be directly projected into the actual assembly scene, which provides workers with 3D visualization guidance and reduces the difficulty of their understanding. Subsequently, the augmented reality technology can be applied to the assembly quality inspection process, thus significantly improving production efficiency. Virtual-real registration is a key technology in augmented reality application, which determines the accuracy of virtual-real object alignment, and commonly used virtual-real registration methods such as sign-based, model recognition-based, and human-computer interactive. However, these methods make it difficult to realize the accurate registration of large-size and structurally complex aircraft parts, which results in the great limitation of augmented reality-based assembly guidance technology in the application of the industrial field. Therefore, we propose a multi-point augmented reality registration method for aircraft pipeline cable assembly, which combines target probe design and calibration, SVD-based positional transform solution and World Locking Tools (WLT) augmented reality space precision locking to effectively improve the accuracy of the augmented reality alignment of large-size parts.MethodsFirst, we design a handheld target probe and calibrate it to determine the coordinates of the tip point of the probe under the target coordinate system, achieving a more accurate measurement of the point on the surface of the part. Second, we conduct the multi-point virtual-real registration based on SVD. The target mark on the probe uses a QR code, and the size is designed to be 10 cm×10 cm. Different probe tips are designed according to the typical features of aircraft parts, including universal needle probes, through-hole probes, and chamfered probes. The probe calibration system uses an industrial camera and rotary calibration is conducted around the tip of the probe. The probe calibration process target needs to always be in the field of view of the camera. The probe calibration principle is the same for different probes, namely that in the probe rotating process, the probe tip coordinates in the camera coordinate system are always unchanged. Unity is adopted to develop the multi-point registration program, specifically relating to QR code recognition, registration point distribution, singular value decomposition for attitude transformation, WLT virtual-real space alignment method development, human-computer interaction, virtual scene content layout, and other content development. After deploying the developed program into HoloLens2 glasses and running the developed App, firstly, we select the suitable registration points on the virtual model. Then we use the target probe to select the corresponding points on the real parts and utilize the singular value matrix decomposition method to solve the positional transformation between these two groups of points in the virtual-real mapping space of the augmented reality device. Finally, the 3D model can be aligned to the real parts according to this transformation.Results and DiscussionsWe experimentally verify the effectiveness of the target probe calibration (Tables 1 and 2). Under the target coordinate system, the standard deviation of the tip coordinates in the three axes of x, y, and z are all less than 1 mm, and the calibration results have a high degree of stability. From HoloLens2 single-point repeatability experiments (Table 3), we can see that the standard deviation of the three axial directions is not more than 1.8 mm and the error in the process of large-size parts of the virtual-real registration process is tiny, verifying that the designed target probe meets the needs of the use of multi-point registration method. To quantify the virtual registration accuracy of large-size parts, we apply the target probe to test the virtual-real alignment accuracy of the wing within the range of 3 m×1.4 m×0.5 m. The experimental results show that the absolute accuracy of the virtual-real registration can be better than 3 mm, which meets the needs of actual aircraft pipelines and cables for augmented-reality assembly guidance applications. We also analyze the impact of the number of registration points and layout on the accuracy of virtual-real registration based on experiments. We carry out experiments in turn with 3, 4, 5, 6, 7, 8, and 9 pairs of registration points (Fig. 18, Fig. 19), and the experimental results show that the registration error and the RMSE are larger when 3 pairs of registration points are used. With the increase in the number of registration points, the registration error gradually decreases and tends to be stable, and the RMSE declines insignificantly and remains stable. Therefore, it is more appropriate to choose at least 4 pairs of registration points for the validation object of this paper. The distribution of registration points is also analyzed experimentally (Fig. 21), and the results show that when the coverage of registration points is less than 30%, the registration error and RMSE are larger, and there is unstable registration. With the increase in the coverage of registration points, the registration error and RMSE show a gradual trend of decreasing. Thus the distribution of the registration points tries to cover the whole model as much as possible. In conclusion, our method can realize the accurate virtual registration of large-size 3D models, and the number of registration points can be adjusted according to the size of the parts. At the same time, we need to consider the problem of low registration efficiency caused by too many pairs of registration points, and the distribution of registration points covers the whole model and is not in the same plane as much as possible.ConclusionsOur multi-point registration method can effectively improve the accuracy of virtual-real alignment of large-size parts, and the method also has the advantages of lower algorithmic computation and no special requirements for the structure of the object to be virtual-real aligned. It should be noted that this method partially relies on the more stable spatial localization technology of HoloLens2, and subsequent research will continue to improve the spatial localization accuracy and stability of augmented reality devices to further improve the stability of the virtual-real registration. In addition, the accuracy of the probe calibration is very critical to the subsequent registration and accuracy verification, and higher precision probes can be designed or their calibration algorithms can be improved to further improve the accuracy of the virtual-real registration.
ObjectiveThe properties of nanoparticles are related to their structures and sizes, and studying methods for measuring the length and diameter of rod-shaped nanoparticles is of practical significance. Transmission electron microscopy has high resolution and can provide detailed morphological features of rod-shaped nanoparticles. However, electron microscopy can only observe a small number of particles, and the measurement results lack statistical significance. The dynamic light scattering method can quickly characterize the particle size and size distribution of nanoparticles, but since this method assumes that the measured particles are spherical, it cannot accurately measure the size of rod-shaped particles. The depolarization dynamic light scattering method can obtain the length and diameter of rod-shaped nanoparticles by measuring the translational and rotational diffusion coefficients of particles in Brownian motion. It is necessary to fit the translational and rotational attenuation linewidths separately for obtaining the translational and rotational diffusion coefficients of the Brownian motion of rod-shaped nanoparticles. Exponential fitting algorithms are commonly adopted in fitting the attenuation linewidth, but they are greatly affected by the initial value. When the initial value is not suitable, the measurement results will deviate from the true value. To this end, a Tikhonov regularization algorithm is proposed to invert the vertical and horizontal polarization autocorrelation functions obtained from depolarized dynamic light scattering experiments, thereby putting forward a method for acquiring the translational and rotational attenuation linewidths.MethodsThe experimental device employs a 532 nm vertically polarized solid-state laser as the light source, and a Glen Thompson lens is placed at a 90° scattering angle position. The lens divides the scattered light into two optical paths of horizontal polarization and vertical polarization. On each path, a single-mode fiber is utilized to receive the scattered light signal, which is then fed into a photomultiplier tube. After receiving the scattered light signal, the normalized autocorrelation function of light intensity is obtained by real-time calculation of a large dynamic range high-speed digital correlator. Additionally, the temperature control system maintains the sample cell temperature at 25 ℃. During the experiment, the experimental device is covered with a shell to prevent interference from stray light and reduce measurement errors. Three different sizes of gold nanorod samples are purchased, and four different concentrations of gold nanorod samples are set for depolarization dynamic light scattering measurements. The autocorrelation functions of vertical and horizontal polarization directions of samples with different concentrations are obtained. The Tikhonov regularization algorithm is adopted to invert the autocorrelation function to obtain the translational and rotational attenuation linewidths. After converting the attenuation linewidth into diffusion coefficient, the Tirado-Garcia de la Torre (TG) model can be leveraged to fit the length and diameter of rod-shaped nanoparticles. Since rod-shaped gold nanoparticles are surrounded by an adsorption layer in the liquid, the adsorption layer increases the size of the rod-shaped gold nanoparticles, making their size slightly larger than the actual size in the liquid. Therefore, we have corrected the three sets of length and diameter data obtained from depolarized dynamic light scattering measurements. The measurement results are compared with those of a transmission electron microscope to verify the feasibility of this method.Results and DiscussionsAfter Tikhonov regularization inversion of the horizontal polarization autocorrelation function, a single-peak attenuation linewidth distribution can be obtained, and the mixed attenuation linewidth can be obtained from its peak [Fig. 7(a)]. After performing Tikhonov regularization inversion on the vertical polarization autocorrelation function, a bimodal attenuation linewidth distribution is obtained, and the translational attenuation linewidth can be acquired from its left peak [Fig. 7(b)]. The original concentrations of the three samples are all 0.1 mg/ml, and samples with different concentrations of 0.10, 0.07, 0.05, and 0.03 mg/ml respectively are obtained by diluting them. The experimental data show that the autocorrelation functions of light intensity of samples with different concentrations coincide, with consistent measurement results (Fig. 3).ConclusionsWe propose to employ the Tikhonov regularization algorithm to invert the autocorrelation functions in the horizontal and vertical polarization directions, respectively and thus to obtain the translational and rotational attenuation linewidths. After converting the attenuation linewidths into diffusion coefficients, the length and diameter of rod-shaped nanoparticles can be fitted using the TG model. The experimental results show that after removing the adsorption layer after correction, the length and diameter measurements of three sets of rod-shaped gold nanoparticles obtained using the depolarization dynamic light scattering method based on Tikhonov inversion are within 8% of the measurement results of transmission electron microscopy. This indicates that the corrected measurement results are consistent with the measurement results of transmission electron microscopy. The experimental data demonstrate that the autocorrelation functions of light intensity of samples with different concentrations basically coincide, and the measurement results remain consistent.
ObjectiveSpectral computed tomography (CT) utilizes the absorption characteristics of X-rays of different energies by photon-counting detectors to perform "differential measurements" and obtains the X-ray attenuation characteristics of the object in different energy intervals. It not only allows the identification of materials with similar attenuation coefficients but also the qualitative and quantitative analysis of material properties of the scanned object (e.g., atomic number and electron density). Existing estimation models only consider the main attenuation effect, which is not precise enough for compound materials with complex compositions and makes the calculated equivalent atomic numbers and densities often have an error of more than 10%, thus preventing accurate estimation of compounds with similar equivalent atomic numbers. Since bronzes and their corrosion contain a variety of monomers and structurally complex compounds, and the equivalent atomic numbers of most materials are clustered in the interval of 20-30, the existing methods of estimating atomic numbers and densities could not meet the demand for accurate estimation of bronze materials. To this end, we propose a high-order fitting model and verify it through simulation experiments and actual data experiments, and finally realize the accurate estimation of the equivalent atomic number and density of the materials inside the bronzes.MethodsThe existing first-order linear models simplify the relevant physical effects by taking only the photoelectric effect and Compton scattering into consideration, which may not reflect the real physical process precisely. As the actual physical process is very complex, including the photoelectric effect, Compton scattering, and Rayleigh scattering, the relationship between the obtained attenuation coefficient and atomic number may not be a simple linear one. Based on the first-order model, we propose a higher-order fitting model to characterize the complex physical processes. Meanwhile, to verify the feasibility of the model, we design simulation experiments and actual data experiments and analyze the experimental results.Results and DiscussionsIn the simulated experiments, we choose eight metal simulation materials with atomic numbers between 20 and 30 for model fitting (Table 1). Firstly, the body of materials is designed and SpekCalc software is adopted to simulate the energy spectrum from 0 to 3×10⁵Vp to obtain the projections at two energies of 3×10⁵Vp and 1.6×10⁵Vp. Then, the filtered back-projection algorithm is utilized to obtain the reconstructed images of the materials (Fig. 1), with the mean value of the 20×20 part in the center of each material taken as the attenuation coefficient μ. Four of them are leveraged as the base materials in the fitting, and the remaining four materials are for validation. The model estimates the equivalent atomic number of the four validated materials with a maximum error of 1.9% and an average error of 1.2% and estimates the density with a maximum error of 9% and an average error of 8% (Table 2). In the actual data experiments, we select seven major compounds in bronze patina and monomorphic copper totaling eight materials for model fitting (Table 3). By adopting photon counting detector-type spectral CT, one set of data is collected at every interval of 2×10⁴Vp, and a total of seven sets of data are obtained in the range of 1.6×10⁵Vp-2.8×10⁵Vp (Fig. 2). The mean value of the center cut layer of each material is taken as the attenuation coefficient μ. Four of the materials are employed as the base materials, which are validated with the remaining four materials, and the optimal model with the smallest estimation error is finally derived. The maximum error in the estimation of the equivalent atomic number for the four validated materials is 5% with an average error of 4%, and the maximum error in the estimation of the density is 10% with an average error of 4% (Table 4). The results of both simulation experiments and actual data experiments show that the third-order fitting model can estimate the equivalent atomic numbers and densities of the compounds contained in the bronzes relatively and accurately.ConclusionsWe analyze the existing atomic number and density estimation methods, which cannot meet the demand for accurate estimation of bronze materials. To address this problem, we first analyze the optimal method of calculating the equivalent atomic number and then construct a higher-order fitting model based on the data collected by spectral CT in multiple energy ranges to estimate the equivalent atomic number and density of the measured object for the bronze and its corrosion of the main components. Finally, this model is verified by simulation experiments and actual data experiments, and thus the accurate estimation of the equivalent atomic number and density of the materials inside the bronze is realized. In simulation experiments and fitting experiments on the actual data of the main components of bronze corrosion, the results show that the estimation average error of the proposed method is 3.67% for the atomic number and 3.75% for the density.
ObjectiveIn rail transportation, detail inspection of rails and trains is required to ensure safe operation. The surface is measured when the train is running or rail inspection is performed on a moving vehicle to improve the detection speed and efficiency. Three-dimensional (3D) shape measurement is also needed because of the rich information, and the point cloud density should be high enough to find minor defects. Dynamic line-scan point cloud measurement based on line-scan cameras shows great potential to meet the above requirements. The line-scan cameras can capture one-dimensional (1D) images at ultra-high frequencies and resolutions, and high-density point clouds can be easily obtained in motion. However, the complex perturbance in motion represented by multi-degree-of-freedom deviations and vibrations tends to introduce errors into dynamic line-scan point clouds and poses serious challenges to point cloud correction. We report a dynamic line-scan point cloud correction method based on two-dimensional (2D) image reference. A two-step correction based on global transformation and optical flow analysis of reprojection images is adopted to achieve an accurate and reliable correlation between point cloud profiles and 2D image reference under complex perturbance. The pose of each point cloud profile is optimized, and correction compensation based on the low-noise reference according to both images and point cloud information is designed to achieve comprehensive correction. We hope the proposed method can provide effective support for point cloud-based detail analysis and inspection of rail transportation.MethodsFirst, a point cloud correction based on global transformation is adopted. As a preliminary correction method, it can quickly eliminate the influence of obvious motion deviation and improve the reliability of subsequent fine correction. Meanwhile, we perform the global geometric transformation on the reprojection image of the point cloud, making it as consistent as possible with an undistorted 2D reference image captured by an area-scan camera. The image geometry transformation includes translation in two directions, scaling in two directions, image rotation, and shearing in two directions. The gradient descent method is adopted to obtain the global image transformation, and the pixel deviations between the reprojection image and the 2D reference image are calculated by the transformation matrix. According to the imaging model and the point cloud pose perturbation model, the point cloud correction vector is calculated for every point cloud profile. Second, correction based on optical flow analysis of reprojection images is adopted. The Demons algorithm based on the optical flow field features high operation speed and high registration accuracy and is not susceptible to the distorted features of the reprojection image. Therefore, the non-rigid image deformation can be modeled via optical flow analysis, and the pixel deviations between the reprojection image and the 2D reference image can be obtained. Similar to the first step, the pixel deviations are converted to point cloud correction parameters, and iterations are employed to improve fine correction quality. Third, correction compensation based on low-noise reference is implemented. The continuous surfaces are identified according to both images and point cloud information, and the low-noise reference is obtained by fitting. The point cloud accuracy is further improved under the constraint of the low-noise reference. This method is easy to implement, and the texture of rails and trains is enough for effective correction without the need for additional speckle spraying.Results and DiscussionsThe measurement results of the rail sample are utilized to verify the proposed method. An accurate two-ball model is adopted as a detailed feature to assist in accuracy evaluation. In the verification experiment of method effectiveness, both qualitative and quantitative accuracy evaluations demonstrate that the point cloud deformation is reduced with improved reconstruction accuracy (Figs. 10-13). The improvement can be seen in the texture of the point cloud and the 3D point cloud shape. In the precision comparison experiment, the proposed correction method has better control of local detail reconstruction accuracy than the previous methods based on pose estimation using attached sensors (Figs. 14-16). Meanwhile, the proposed method is easy to implement and is not costly. In the ablation experiment, each of the three correction processes has proven to be of great importance (Fig. 17).ConclusionsWe propose a dynamic line-scan point cloud correction method based on 2D image reference. With the help of 2D reference images, the initial correction based on the global transformation of reprojection images is adopted to eliminate the influence of obvious motion deviations, and fine correction based on optical flow analysis of reprojection images is utilized to correct small irregular deformations. A correction compensation method based on low-noise reference is designed to realize better 3D reconstruction. Through quantitative and qualitative evaluations, the proposed method can realize effective and reliable point cloud correction under complex perturbance scenes. The comparison experiment further verifies the performance of the method, and the ablation experiment validates the importance of each correction process. Therefore, the proposed method has potential applications in 3D reconstruction and detail inspection of rail transportation.
ObjectiveThe carrier frequency of the fringes corresponds to is the tilt and constant terms of the phase distribution. Meanwhile, in interferometry, the carrier frequency solution of fringes is significant. It can be adopted for the calibration of phase-shift devices in interferometers and for phase extraction. Second, the carrier frequency parameter is required to correct the retrace errors in interferometers. Additionally, even in the absolute measurement of the two flats, the carrier frequency parameters of the fringes are also employed. Thus, the carrier frequency parameters of the fringes can be utilized in all aspects of interferometry. At present, the carrier frequency parameter solution of fringes can be divided into two categories, with one being the absolute parameter solution method, such as the image processing and Fourier transform methods. This kind of method only employs a single-frame interferogram to compute the absolute value of the carrier frequency, but it has many limitations, including the low computational accuracy of the image processing method and proneness to the singular solution. Meanwhile, the Fourier transform method is only applicable in the case of the high carrier frequency, and cannot be applied to the low spatial frequency interferometric fringes. The Fourier transform method is only applicable to the case of high carrier frequency, and for low spatial frequency interference fringes, its spectrum is coupled with the zero frequency, which is difficult to separate with the large solving error. In response to the limitations of the single-frame method, we carry out the research on the phase-shift method, which is a class of relative parametric solution methods. Its essence is a random tilt phase-shift algorithm, which is mainly adopted for phase solution, but incidentally, the phase-shift between the interferograms or the relative value of the carrier frequency parameter can also be obtained.MethodsFirst, the carrier frequency parameters (fx, fy and fz) are estimated. Then, the interference model is approximated by omitting the higher-order terms of the phase. In such conditions, we can construct a linear fit to solve fz. After obtaining fz, we can obtain parameter fx by selecting a row of elements and constructing a new fit. Similarly, we can select a column of elements and obtain the parameter fy. Finally, considering that the estimated carrier frequency parameters have errors, the above process is iterated repeatedly to find the accurate parameter values.Results and DiscussionsSimulations show that the method is applicable to many cases, and despite the even background distribution of the interferogram, the carrier frequency can be accurately calculated. The maximum error can be better than 0.01λ, and the minimum can be up to 0.002λ, λ is 632.8 nm. The obtained carrier frequency is employed in phase-shift interferometry, and the root mean square error of the phase can be up to 0.0002λ. In the experiments, the proposed method has a carrier frequency error of less than 0.007λ, compared with the phase-shift interferometry. When the calculated carrier frequency is adopted for phase-shift interferometry, there is no significant ripple in the phase. Finally, this method has an error in principle because of the phase omission. In principle, the phase should be satisfied to be much smaller than the carrier frequency. With the ratio of the peak to valley (PV) of the phase to the carrier frequency parameter defined as c, the discussion shows that when c<0.5, the prerequisite that the phase is "much smaller than" the carrier frequency can be approximately satisfied, and the error of this method is better than 0.025λ. When c<0.25, the accuracy can be further improved to 0.01λ.ConclusionsA new carrier frequency calculation method of fringes is proposed, and the simulation and experiments show that the method is widely applicable, with the error of the calculated carrier frequency better than 0.01λ in almost any case. It is worth noting that in adopting the proposed method, it is necessary to satisfy the prerequisite that the higher-order phases in the interferometric fringes are much smaller than the carrier frequency. Additionally, the discussion shows that for the general case, only 2-3 fringes in the interferogram are needed to realize the accurate carrier frequency solution, and even for some high-precision planar phases, only one fringe is necessary. The proposed method also has a wide range of applications, and the carrier frequency accuracy of the method can fully satisfy the phase solution in the phase-shift interferometry without any obvious ripple in the phase. Compared with the existing methods, our method has the following advantages such as simple iteration, high running efficiency, and applicability to the case of uneven background of the interferogram. Meanwhile, it is a method of calculating the absolute parameters of the carrier frequency of a single-frame interferogram, and the carrier frequency can be accurately calculated for the interferometric fringes of almost any spatial frequency.
ObjectiveLaser inertial confinement nuclear fusion is significant for explosion simulation, astrophysics, and other research. Meanwhile, the target pellet as a fuel container in fusion requires extremely high precision in surface morphology, and since any small morphological defect on its surface may cause asymmetric compression and experimental failure, the measurement of target surface morphology is essential. However, during the actual measurement of the surface morphology of the target pellet, the measurement results are susceptible to vibration, such as ambient light changes and optical platform vibration, which will introduce random errors to cause inaccurate measurement results. Therefore, it is of practical significance to correct the random errors during the measurement and improve the vibration resistance of the target shot. The non-uniform fast Fourier transform (NUFFT) algorithm can correct non-uniform interference signals, which is characterized by high accuracy and low hardware cost. Thus, based on the NUFFT algorithm, we propose an anti-vibration white light interferometry method. Specifically, the white light interferometry optical path adopts dual imaging channels and the main channel collects the white light interferogram. The secondary channel collects the quasi-monochromatic optical interferogram, calculates the phase shift interval of the vibration according to the quasi-monochromatic light interferogram, and corrects the white light interference signals collected in the vibration environment according to the obtained phase-shifting interval combined with the NUFFT algorithm to obtain a more accurate white light interference signal. According to the corrected white light interference signal combined with the seven-step phase-shifting method, the three-dimensional topography information of the object to be measured is restored. Additionally, the algorithm can be adopted for correcting non-uniform interference signals with random phase shift interval in random vibration conditions.MethodsFirst, the Fourier transform algorithm is employed to extract the phase information of the quasi-monochromatic light interference signal, and the phase information is expanded into continuous phases by unwrapping to obtain the non-uniform phase-shifting interval of each pixel position in the interferogram. Meanwhile, the non-uniform phase-shifting interval is sorted from small to large, and then the interferogram corresponding to the non-uniform phase-shifting interval is also sorted accordingly. The sampling interval is normalized and oversampled into uniform grid coordinates, and the NUFFT algorithm is utilized to convolute the sorted white light interference signal according to the phase-shifting interval after sorting. The convoluted interference signal is transformed by the Fourier transform, the influence of the Gaussian kernel function in the spectrum is removed, and the uniform interference signal is obtained by the inverse Fourier transform. Finally, the topographic distribution of the step surface is acquired by calculating the phase of the uniform interference signal and the peak position of the modulation system.Results and DiscussionsFigure 7 shows that in the vibration environment, the step surface morphology directly restored by the white light interferogram before correction has a large distortion, and its morphology information cannot be restored correctly. The average height measured in Table 1 is 0.1419 μm, the relative error between the nominal value of 0.139 μm and the step plate is 2.13%, and the restored step surface shape is close to the reference surface shape measured by the Veeco interferometer. In Table 1, the corrected peak-to-veally (PV) and root-mean-square (RMS) values of the corrected step surface are 0.2011 μm, which are significantly higher than those of 0.3417 μm and 0.0735 μm before correction, and are close to the Veeco reference value. The results show that the surface shape of the step measured by this method is in good agreement with the actual measured surface shape, with high measurement accuracy.ConclusionsA white light interferometry anti-vibration measurement method based on a non-uniform fast Fourier transform algorithm is studied to solve the problem of white light interferometry in a vibrating environment. We employ a dual-channel optical path system to calculate the actual phase-shifting interval by adopting the quasi-monochromatic optical interferogram collected by the secondary channel camera and correcting the white light interferogram collected by the main channel camera according to the obtained phase-shifting interferogram. The simulation and experimental measurement results show that the NUFFT algorithm can accurately correct the non-uniform white light interference signal, and the morphological information of the object to be measured can be well recovered from the corrected uniform white light interference signal. The results show that our method can restore the surface morphology of the measured object in the vibration environment.
ObjectiveWith the increasing demand for inspecting part surfaces, automated and efficient visual inspection is becoming a trend in industrial production. Due to the complexity of inspection planning problems where both viewpoint planning and path planning belong to the non-determinism of polynomial complexity problem, most of the current research studies the above two problems separately and seeks the minimum viewpoints to satisfy the viewpoint coverage by viewpoint planning, then obtaining efficient inspection paths via path planning for the set of viewpoints. However, viewpoint planning and path planning are coupled problems, and the distribution of viewpoints and paths can easily make the inspection efficiency fall into the local optimum. Therefore, some researchers propose to combine the viewpoint and path planning problems and simplify them into a single objective problem for global optimization, which improves inspection efficiency to a certain extent. However, during the optimization, viewpoints should be continuously added to the viewpoint set to meet the viewpoint coverage, which causes low planning efficiency. To this end, we propose a multi-objective holistic planning method of viewpoints and paths to quickly seek the viewpoint set and its path that satisfy viewpoint coverage and optimal inspection time cost.MethodsIn response to the need for efficient inspection of batch parts, we study the inspection planning method of automated visual inspection to reduce the inspection time cost of single parts. Inspection planning includes two subproblems of viewpoint planning and path planning. To seek the optimal solution of inspection time cost in inspection planning, we propose a multi-objective holistic planning method for viewpoints and paths, which models the viewpoint planning problem and path planning problem as a combinatorial optimization problem for multi-objective optimization. The proposed method performs adaptive redundant sampling of viewpoints based on surface curvature to cope with difficult coverage of complex curved surfaces and constructs a set of sampled viewpoints with both quality and diversity for subsequent inspection planning considered. A constraint-based non-dominated sorting genetic algorithm Ⅱ (C-NSGA-Ⅱ) is put forward for simultaneous optimization of the two objectives of viewpoint coverage and inspection time cost. During the optimization, the viewpoint coverage is constrained to be around the minimum coverage, and the globally optimal solution for the inspection time cost is quickly sought to achieve the holistic planning of viewpoints and paths and minimize the inspection time cost.Results and DiscussionsWe propose a multi-objective holistic planning method for viewpoints and paths. Firstly, a redundant viewpoint sampling method based on surface curvature is proposed in the viewpoint sampling stage. Meanwhile, it is experimentally verified that compared with the commonly adopted random viewpoint sampling method, the viewpoint set sampled by the proposed method has better performance in subsequent inspection planning, which proves that the proposed viewpoint sampling method can construct a higher-quality and diversified sampled viewpoint set (Table 2). Then, C-NSGA-Ⅱ is put forward to carry out holistic planning for the problem of two successive coupling of viewpoint planning and path planning. Compared with the holistic planning method that is simplified into a single-objective optimization problem, the computational efficiency of C-NSGA-Ⅱ is improved by about 90% (Fig. 13). Compared with the traditional individual planning method of viewpoint first and then path, the inspection time cost planned by the proposed method is reduced by more than 10.52% (Table 3). Finally, the effectiveness and superiority of the proposed inspection planning method are verified in robot automated vision inspection applications (Table 4).ConclusionsTo reduce the inspection time cost of automated visual inspection, we propose a multi-objective holistic planning method for viewpoints and paths. The proposed method does not take reducing the number of planned viewpoints as the only goal, but directly takes the viewpoint coverage and inspection time cost as the optimization goals. The above two objectives are globally optimized by C-NSGA-Ⅱ, and the viewpoint set and its path with the optimal inspection time cost are finally planned. Compared with the holistic planning method that is simplified into a single-objective optimization problem, the proposed method does not need to be forced to meet the viewpoint coverage requirements during the optimization, which greatly improves computing efficiency. The experiments prove that the proposed method can quickly solve the global optimal solution compared with individual planning methods and other holistic planning methods, which helps improve the efficiency of automated visual inspection and provides a method for efficient inspection planning in real production. In the subsequent research, on the one hand, the accuracy evaluation index can be added to judge the viewpoints, and on the other hand, the influence of the field environment can be considered to provide feedback on the imaging quality of the viewpoints and make adjustments accordingly.
ObjectiveAlkali antimonide photocathodes are widely used in many fields such as radiation detection, photon counting, and accelerator electron source due to their advantages of high quantum efficiency, long lifespan, short response time, and low preparation cost. Since K2CsSb bi-alkali photocathode has high photosensitivity ranging from 300 nm to 650 nm, it is often used as the key component of large-area microchannel plate photomultiplier tube and dynode photomultiplier tube. K-Cs-Rb-Sb tri-alkali photocathodes may exhibit more outstanding performance in spectral response enhancement and thermionic emission suppression compared to conventional K2CsSb bi-alkali photocathode. So far, there have been little theoretical researches on K-Cs-Rb-Sb tri-alkali photocathodes. Due to the difficulty in controlling the stoichiometric ratio of alkali metal elements during the actual preparation processes of K-Cs-Rb-Sb photocathodes, and in fact K-Cs-Rb-Sb tri-alkali photocathodes with different stoichiometric ratios have different photoemission properties, it is necessary to analyze the mechanism of Rb doping leading to different photocathode properties from the atomic and electronic perspective, thereby providing theoretical guidance for designing excellent alkali antimonide photocathodes.MethodsThe K2Cs2-xRbxSb bulk models and the (111)-oriented surface models with different Cs/Rb ratios corresponding to K2CsSb,K2Cs0.75Rb0.25Sb,K2Cs0.5Rb0.5Sb,K2Cs0.25Rb0.75Sb,and K2RbSb were established. The K2CsSb unit cell belongs to the DO3 cubic structure with a lattice constant of 0.8615 nm, and the space group is Fm-3m. According to the number of Cs atoms in K2CsSb replaced by Rb atoms, the lattice constants of several K-Cs-Rb-Sb bulk models after atom replacements were obtained by Vegard law. On the basis of the K2CsSb (111) Cs-terminated surface, six, eight, twelve, and sixteen Cs atoms were replaced from top to bottom, to obtain the K-Cs-Rb-Sb(111) surface models with different Cs/Rb ratios. To eliminate inter-layer interactions caused by the periodic mirror interaction between the surface slabs, a vacuum layer of 2 nm was set along the z-axis, including an upper vacuum layer with a thickness of 1.5 nm and a lower vacuum layer with a thickness of 0.5 nm. During the structural optimization process, the upper surface atoms with a thickness of 0.8 nm were allowed to fully relax, while the remaining atoms were constrained. The VASP software package using the first-principles calculation method based on the density functional theory was adopted. The projected augmented wave method was used as the pseudo potential, the generalized gradient approximation function proposed by Perdew-Burke-Ernzerhof was used to express the exchange correlation interaction, the plane wave expansion with a cut-off energy of 500 eV was used, and the conjugate gradient method was used to optimize the lattice constants and atom positions of the diverse models. The K-point grid in the Monkhorst-Pack form was set as 6×6×6 for bulk models and 6×6×1 for surface models, respectively.Results and DiscussionsThe calculation results indicate that when Rb atoms replace Cs atoms in the K-Cs-Rb-Sb bulk models with different Cs/Rb ratios, the optical properties including reflectivity, refractive index, extinction coefficient, and absorption coefficient are hardly affected by Rb doping. This implies that the incorporation of Rb atoms has minimal impact on the optical properties of K2CsSb material. From the perspective of formation energy and formation enthalpy, all the K-Cs-Rb-Sb bulk models where Rb atoms replace K atoms have positive formation energies, and the corresponding formation enthalpies are larger than that of the K2CsSb model. This indicates that it is very difficult for K atoms to be replaced by Rb atoms in the preparation process of K-Cs-Rb-Sb tri-alkali photocathodes. At the same time, all K-Cs-Rb-Sb bulk models where Rb atoms replace Cs atoms have negative formation energies, and the corresponding formation enthalpies are less than that of the K2CsSb model, indicating that all the models where Rb atoms replace Cs atoms are easy to form with better thermodynamic stability. As the number of Rb atoms replacing Cs atoms increases, the formation energies and formation enthalpies gradually decrease. This means that in the presence of both Cs and Rb, the K2Cs0.25Rb0.75Sb model is the easiest to form and the most stable. All K-Cs-Rb-Sb bulk models exhibit the property of p-type semiconductor, and K2Cs0.25Rb0.75Sb has the smallest bandgap. For K-Cs-Rb-Sb surface models with different Cs/Rb ratios, the vacuum levels, surface energies, and electron effective masses gradually decrease. Among them, the K2Cs0.25Rb0.75Sb surface model has the smallest ionization energy, indicating that its electrons generated under external light excitation are more likely to transit from the valence band top to the conduction band bottom and move in the conduction band. This is beneficial for enhancing the spectral response of the photocathode and further improving the photoelectric conversion efficiency. Doping Rb element in K2CsSb can increase the work function of the surface model. On the whole, the K2CsRb0.250.75Sb (111) with a larger work function and surface can prevent the escape of some hot electrons while ensuring that a large number of photoelectrons can escape from the surface, in order to achieve the reduction of cathode dark current without reducing its quantum efficiency. In the surface model containing K, Cs, and Rb alkali metals, K2Cs0.25Rb0.75Sb has the highest conductivity, because the concentration of conduction band electrons gradually increases, and the effective mass of conduction band electrons in the surface model decreases as the number of Cs atoms replaced by Rb atoms increases.ConclusionsWhen Rb atoms replace Cs atoms, Rb doping has little effect on the optical properties of K-Cs-Rb-Sb cathode materials. For K-Cs-Rb-Sb bulk models with different Cs/Rb ratios, K2Cs0.25Rb0.75Sb has the lower formation energy and formation enthalpy, indicating that it is easy to form under natural conditions and it is thermodynamically stable. For the surface models, K2Cs0.25Rb0.75Sb has the smaller surface energy and higher conductivity, as well as the smallest bandgap and ionization energy. Besides, the work function of K2Cs0.25Rb0.75Sb is larger than that of K2CsSb. Therefore, the K-Cs-Rb-Sb cathode with a Cs/Rb ratio (atomic number fraction) of 1∶3 is considered to be a stable photoemission material with high quantum efficiency, low dark current, and good conductivity. The research results can provide guidance for the preparation of high-performance K-Cs-Rb-Sb photocathodes. In the traditional K2CsSb photocathode preparation process, doping Rb elements can reduce the dark noise of the photomultiplier tube while maintaining a high level of quantum efficiency, thereby improving the detection sensitivity and accuracy of the device in practical applications.
ObjectiveIn recent years, there have been many studies on the preparation of high-quality transition-metal dichalcogenides (TMDCs), which have a variety of applications including optoelectronics, spin-tronics, and valleytronics. The most attractive properties of TMDCs as candidates for such diverse applications are layer and phase dependence. Therefore, the controlled growth of various phases of TMDCs and the stacking of distinct layers have emerged as popular research realms. In previous research, people have summarized the theory of supersaturation-dependent crystal growth by continuously refining the classical BCF (Burton-Cabrera-Frank) theory. However, on the one hand, supersaturation-dependent growth theory is often employed to provide a theoretical interpretation for preparing a certain phase that lacks systematicity, and on the other hand, the parameter control involved in such theories is difficult to measure and regulate experimentally. Our study focuses on controlling the temperature distribution to affect the supersaturation degree and achieve the one-step controllable growth of three phases of WSe2 (single layer, 3R, and 2H) directly on the different regions at the substrate under a temperature gradient. By regulating the temperature distribution, we can change the supersaturation distribution and successfully prepare spiral plates of WSe2 by screw-dislocation-driven (SDD) growth mode, transitioning from layer-by-layer (LBL) growth mode, where we observe two orders of magnitude of second harmonic generation (SHG) signal enhancement in the spiral-stacked region. These different vertically stacked TMDCs materials will offer diverse candidates for probing the physical properties of layered materials and exploring new applications in functional electronic and optoelectronic devices.MethodsOur experiments adopt the reverse flow method to control the growth time and growth temperature in the growth process and shorten the cooling time by a rapid cooling method. With the help of the supersaturation-dependent crystal growth theory and our experimental methods, we establish a connection between the temperature distribution, supersaturation distribution, and growth result distribution (Figs. 1 and 3). By the morphological characterization (Figs. 1 and 3) such as optic microscope (OM), atomic force microscopy (AFM), and scanning electron micrographs (SEM), we analyze the stacking mode of samples. Meanwhile, we further analyze the optical properties of the samples and demonstrate the growth of spiral structures by the spectroscopic (Figs. 2 and 4) characterization such as the Raman spectrum, photo luminescence (PL) spectrum, SHG spectrum, and spectrum mapping.Results and DiscussionsWe successfully prepare monolayer, 2H-phase , and 3R-phase of WSe2 in our supersaturation-controlled growth experiments and demonstrate their distributions [Fig. 1 (c)]. Due to the different atomic structures of the two stacking phases [Figs. 1 (d) and (e)], they exhibit different morphologies under OM, and AFM [Figs. 1 (f)-(m), Figs. 2 (a)-(c)]. Different atomic structures in different stacks will produce different electronic structures to affect the optical properties of the material. To reveal different-induced interlayer coupling in the 3R-phase and 2H-phase WSe2, we perform PL and Raman spectroscopy on both stacking and single layer regions. The Raman spectrum of the two phases reveals different trends with increasing stacking layers, generated by different interlayer coupling [Figs. 2 (d) and (e)]. The indirect bandgap transition can be observed in the stacking area [Fig. 2 (f)], which originates from the interlayer electronic coupling. The indirect transition energy reflects the stability of the electronic structure and the strength of interlayer coupling: the lower transition energy means more stable electronic structure and stronger interlayer coupling, which is also reflected in our growth results. We show the above conclusions more vividly by spectrum mapping [Figs. 2 (g)-(i) and Figs. 2 (k)-(m)]. Symmetry also affects interlayer coupling, which will be displayed by SHG mapping. According to the supersaturation-dependent crystal growth theory, the growth mode transition from LBL to SDD is attributed to the changing supersaturation distribution. The different saturation distributions will also affect the complexity in SDD mode, which is demonstrated by OM and AFM (Fig. 3). After observing the emergence of the spiral structure, we investigate it by spectroscopy method. Similar to the Raman spectrum of 3R-phase WSe2 under the interlayer coupling, the Raman signal of the spiral WSe2 is also manifested as the weakened trends with the increasing number of stacking layers [Fig. 4 (a)]. In addition to interlayer coupling, the strain also has a significant influence on the optical properties of the spiral WSe2, which is evidenced by the continuum changes of the PL spectral and aberrations in the polarization SHG [Figs. 4 (b), (i), and (l)]. According to the spectroscopic law of stacked WSe2 discussed previously, we demonstrate the growth kinetics of the two-armd spiral structure by PL and SHG mapping [Figs. 4 (c)-(h) and Fig. 4 (k)]. Towards the armchair direction, we find two orders of magnitude SHG enhancement in the center position [Fig. 4 (j)].ConclusionsBy adopting the reverse flow chemical vapor deposition strategy, we accurately control the gradient distribution of the growth temperature, which determines the supersaturation distribution. The controllable growth of single layer, 2H-phase, 3R-phase, and spiral structure WSe2 is realized. Additionally, we demonstrate the growth process of the spiral structure and elucidate the effect of interlayer coupling and strain on the optical properties of stacking WSe2 via morphological and spectroscopic characterization. Thesupersaturation-dependent crystal growth theory is utilized to analyze the relationship between the number of screw-dislocation arms of spiral WSe2 and different supersaturation distributions. Meanwhile, we find two orders of magnitude in the center of spiral WSe2, and our study paves the way for two-dimensional semiconductor multi-phase controlling growth, structural design, stacking optical properties regulation, and optoelectronic devices.
ObjectiveThe physiological state of human tissues and the lesions of tissues are found to be closely related to the optical properties of tissues. The accurate measurement of optical parameters of tissue determines optical diagnosis correctness and phototherapy effectiveness, which is particularly essential in medical applications. At present, the common methods for measuring the optical parameters of biological tissues are integrating sphere technique, diffusion optical tomography, fluorescence imaging, and optical coherence tomography. In these methods, the measurement depth is not deep enough, or the measurement accuracy is not good enough to meet the practical applications. Acousto-optical tomography (AOT) combines the high spatial resolution of ultrasound with the high sensitivity of optical detection to provide excellent imaging depth (cm) at high imaging resolution (submm). AOT employs the localization and modulation of focused ultrasound, and the localization and quantitative measurement of the absorption coefficient of turbid media can be realized. Finally, the limitation that other measurement methods cannot consider both measurement depth and measurement accuracy can be compensated. We obtain the quantitative relationship between the absorption coefficient of the turbid medium and the acoustic-optical signal by theoretical analysis and COMSOL simulation. Furthermore, the absorption coefficient of turbid medium is measured by the AOT experiment, which preliminarily verifies the feasibility of AOT in the measurement of the tissue absorption coefficient.MethodsBased on the radiation transmission theory and the intensity modulation mechanism of acousto-optic interaction in a turbid medium, the analytical relationship between acousto-optic signals and medium optical parameters is obtained. The finite element simulation software COMSOL Multiphysics is adopted for simulation, the extrapolated boundary equation and diffusion approximation theory are utilized to define the light field, and the ultrasound theory is to define the sound field. Meanwhile, the multi-physics field coupling is performed based on an intensity modulation mechanism, and an experimental system of AOT is built to measure the absorption coefficient of a turbid medium.Results and DiscussionsIn the COMSOL simulation, the intensity of the acousto-optic signal increases linearly with the rising incident light intensity (Fig. 5), and the relative intensity of the acousto-optic signal (the ratio of the acousto-optic signal intensity to the incident light intensity) decreases exponentially with the growing absorption coefficient (Fig. 6). The absorption coefficient calculated by simulation is very close to the actual set value. The maximum absolute error is 0.049 cm-1, the minimum absolute error is 0.0074 cm-1, the mean absolute error is 0.026 cm-1, and the detection correlation coefficient is greater than 0.95 (Fig. 7). In the experiment, acousto-optic imaging is performed on samples with different absorption coefficients. When only the incident light intensity is changed, the acousto-optic signal and the incident light intensity show a linear growth relationship (Fig. 10). When the other conditions remain unchanged, the relative intensity of the acousto-optic signal decreases exponentially as the absorption coefficient increases (Fig. 11). The experimental results are consistent with the simulation results. The average absolute error is 0.047 cm-1 and the average relative error is 6.5% when the absorption coefficient is measured for a tissue simulation sample with a thickness of 10 mm (Fig. 12).ConclusionsThe relationship between tissue absorption coefficient and the acousto-optic signal is analyzed theoretically by combining the radiation transmission theory of light propagating in tissue and the intensity modulation mechanism of acousto-optic interaction in turbid media. The relative value of acousto-optic signals is determined by ultrasound parameters (sound pressure, sound frequency, sound speed) and tissue parameters (thickness, optical parameters), and is independent of the incident light intensity. The relative value of the acousto-optic signal decays exponentially with the absorption coefficient of the medium when other conditions remain unchanged. The theoretical results are in good agreement with COMSOL simulations. The maximum relative error of the absorption coefficient measured in the COMSOL simulation is less than 8%. The experimental measurements are carried out using the AOT system, and the experimental results are basically consistent with the simulation results. In the experiment, the maximum absolute measurement of the absorption coefficient of the tissue simulation sample with a thickness of 10 mm is 0.082 cm-1, and the maximum relative error is 9.3%, which initially verifies the quantitative measurement feasibility of the absorption coefficient of the turbid media by AOT. AOT combines the advantages of optical and acoustic technology to measure the absorption coefficient of deep tissue. For example, by combining with a multi-wavelength light source, the absorption coefficient of blood vessels at different wavelengths can be obtained to measure their blood oxygen saturation and thus provide more references for the early diagnosis of some tumors. At present, the main problem of AOT is that the acousto-optic signals are weak with a low signal-to-noise ratio. It is a great challenge for detection instruments and detection methods to extract weak acousto-optic signals from strong background light, and it is also the key and difficult problem that AOT must solve in the future.
ObjectivePulse lasers have a wide range of applications in the medical treatment, communication, material processing, and other fields. Saturable absorber (SA) is a key element in triggering pulse operation, which can switch between different absorption states and produce ultrafast lasers on ultrafast timelines. In the past few years, various two-dimensional materials have been applied to ultrafast laser research, such as graphene, transition metal oxides, topological insulators, black phosphorus, and MXenes. The transition metal dichalcogenides (TMDs) put transition metals (Mo, W, Ti, Re, Hf) sandwiched between two chalcogenides (S, Se, Te) planes. This structure has reliable optical, mechanical, and electronic properties. It has become a new two-dimensional material. As SA, TMDs are widely used in pulse lasers, such as MoS2, ReS2, and WS2. However, TMDs typically have a high saturation light intensity (tens of GW/cm2). Ternary metal sulfides (TMSs) nanomaterials have been explored by many researchers due to their ultra-wideband nonlinear optical response, high carrier mobility, and excellent air stability. The TMSs ZnIn2S4 (ZIS) has a layered structure composed of two-dimensional [S-Zn-S-In-S-In-S] layers with tunable electronic and optical properties. Compared with traditional binary metal sulfides such as CdS and Sb2S3, ZIS has the advantages of low toxicity, good chemical stability, simple preparation method, and abundant sources. In terms of optical properties, ZIS has a high optical absorption coefficient and strong optical stability. In addition, the charge transport characteristics of ZIS are changed due to the presence of abundant sulfur vacancies. It is necessary to study the layered ZIS with sulfur vacancies as efficient SA.MethodsIn this paper, we synthesize ZIS nanoflowers with sulfur vacancies by solution method. The morphology, phase structure, and ultraviolet-visible (UV-Vis) diffuse reflection spectra of ZIS nanoflowers are analyzed by scanning electron microscopy (SEM), X-ray diffraction (XRD), and ultraviolet-visible-near infrared (UV-Vis-NIR) spectra. The nonlinear SA characteristics of ZIS are studied by the Z-scan method, and the optical performance and nonlinear optical response of ZIS are verified by constructing a pulsed laser experimental setup. Finally, the passive Q-switched laser output based on ZIS is realized.Results and DiscussionsWe represent the characteristics of ZIS nanoflowers and show SEM images of ZIS-SA in Figs. 1(a) and (b), XRD spectrum of ZIS-SA in Fig. 1(c), absorptance of the ZIS-SA in Fig. 1(d), and EPR spectroscopy of the ZIS-SA in Fig. 1(e). As shown in Fig. 2, we verify the optical properties of the SA. The fitting results show that the saturation intensity of the ZIS-SA is 675 MW/cm2 and the modulation depth is 7.8%. Second, we verify the modulation performance of ZIS as SA in pulsed lasers. Fig. 3 shows the schematic of the 1 μm pulsed laser experimental setup. Fig. 4 shows the output performance of the passive Q-switched laser. As shown in Fig. 4(a), when the pump power is 5.31 W, the continuous output power reaches 2.67 W. Passive Q-switched laser is achieved by inserting SA and adjusting its position in the cavity so that the SA is in the best position. When the pump power is 4.10 W, a stable Q-switched pulse can be obtained. When the pump power is increased to 5.31 W, the maximum output power of the laser is 240 mW. As shown in Fig. 4(b), with an increase in pump power, the pulse repetition rate gradually increases and the pulse width decreases. When the pump power increases from 4.10 W to 5.31 W, and the pulse repetition rate frequency increases from 594.6 kHz to 629.08 kHz, and the pulse width decreases from 560 ns to 388 ns. As shown in Fig. 4(c), single pulse energy and peak power of the Q-switched laser. It can be seen that the peak power and single pulse energy increase with the growing pump power. When the pump power is 5.31 W, the single pulse energy is 0.38 μJ, and the corresponding peak power is 0.98 W. As shown in Fig. 5, we record the shortest pulse at different time scales. Fig. 5(a) shows the pulse sequence at a 20 μs time scale, and Fig. 5(b) shows the pulse sequence at a 2 μs time scale. The minimum pulse width is 388 ns. As shown in Fig 6, we measure the beam quality M2 factors. The transverse beam quality factor (Mx2) is 1.83 and the longitudinal beam quality factor (My2) is 1.65 which indicate that the Q-switched pulse laser has a high beam quality.ConclusionsTwo-dimensional zinc sulfide indium nanoflowers are synthesized by solution method. The Q-switched Nd∶YVO4 laser was realized by ZIS as SA. When the maximum pump power is 5.31 W, the maximum pulse repetition rate frequency of the pulsed laser is 629.08 kHz, the pulse width is 388 ns, and the maximum average output power is 240 mW. The corresponding single pulse energy and peak power are 0.38 μJ and 0.98 W. The results show that although the band gap of indium zinc sulfide is 2.32 eV and its absorption edge is located at 534 nm, the presence of sulfur vacancies introduces intermediate energy levels in the near-infrared band and enhances its light absorption. Therefore, the nanomaterials of indium zinc sulfide can still exhibit good saturation absorption characteristics in the near-infrared region. The laser with a high repetition rate and short pulse width can be obtained by ZIS as SA in the laser resonator. Therefore, zinc indium sulfide nanomaterials have a good application prospect in Q-switched pulse lasers.
ObjectiveUsing infrared radiation suppression materials is regarded as an effective method to address the worsening thermal pollution owing to their favorable low-emission and radiation-cooling properties. According to the Stefan-Boltzmann law, the reduction of the thermal surface emissivity of a material can effectively suppress the infrared radiant energy. Metamaterial (MM) is an emerging branch of infrared radiation suppression materials with highly flexible spectral modulation capability and spectral designability. The infrared emission bandwidth and position will be precisely regulated by adjusting their pattern shapes and structure parameters, and thus the selective modulation of the infrared emission spectrum can be realized. However, due to the limitation of computer resources and computation power, it has always been challenging to directly obtain the infrared spectral response of millimeter-scale metamaterials through simulation software. Therefore, we hope to establish a computational model of the infrared spectral response of millimeter-scale metamaterials, which provides a novel approach for the design of broadband infrared radiation suppression functional devices.MethodsIn this paper, the mid- and far-infrared spectral response of millimeter-square metamaterials is simulated based on the time-domain finite-difference method. Combined with the electric field scattering effect, the impact of the marginal electric field strength distribution of the millimeter square pattern on the infrared reflectivity is analyzed. According to the traditional empirical formula, the computational model of the infrared spectral response of millimeter-square metamaterials is proposed. Using the full-wave electromagnetic simulation software FDTD and the parameter scanning method, the effects of the thicknesses of Au and SiO2 on the infrared spectral response are investigated, and the optimal thicknesses of the reflector layer and the substrate layer are identified. Herein, two square metamaterials with the same filling ratio and different unit periods are designed. Then, this objective is discretized into independent solution units such as vertices, edges, and continuous media, while the x and y directions are set as PML and periodic boundary conditions, respectively. The infrared spectral response and electric field distribution of the millimeter-square metamaterial are obtained by iterative calculation and weighted superposition, and the influence of the electric field scattering effect on the spectral response in the mid- and far-infrared bands is verified. After that, the samples of the designed metamaterials are prepared in this paper by utilizing a stainless-steel mask plate and magnetron sputtering technology. In addition, the reflectance spectra of the samples in the full infrared band from 2 to 16 μm are measured using a Fourier transform infrared spectrometer.Results and DiscussionsThe simulation results in Fig. 5 show that the infrared reflectance spectral trends of the two models are nearly close within the 2-16 μm band. However, in the range of 8-10 μm, the amplitude of the infrared reflectance spectra of MM1 is larger than that of MM2, with a peak reflectance of up to 83.58%. To interpret the physical mechanism underlying the above phenomenon, the electric field intensity distribution in the marginal scattering region of the metamaterial is simulated at the reflectance peak of 8.8 μm in Fig. 6. Due to the variation of the unit period, the electric field scattering effect in the marginal region leads to a slight difference in the amplitude of the infrared reflection spectrum. To verify the theoretical reliability of the model and the practical infrared radiation suppression characteristics, the measured infrared reflection spectra are shown in Fig. 7. As the cell size reduces, MM1 exhibits higher infrared reflectance performance, verifying that the electric field scattering effect in the marginal region contributes significantly to the millimeter-scale metamaterial infrared spectral response. The error between the theoretical and practical values is approximately 5%. Finally, Fig. 8 compares the results of this work with relevant studies, demonstrating the advantages of lower layer number, wider bandwidth, and lower emission.ConclusionsA computational model of the infrared spectral response of millimeter-scale metamaterials is proposed to simulate the infrared reflectance spectra and electric field strength distribution of metamaterials. It can be found that when the filling ratio is identical, the decrease of the unit period leads to the enhancement of the marginal electric field scattering effect of the metamaterials, which improves their reflectance properties in the 8-10 μm long infrared wavelength band. Au square metamaterials are prepared using magnetron sputtering technology and stainless-steel mask plates. The reflectivity of the fabricated metamaterials exceeds 81.9% in the range of 2-16 μm middle and long infrared wavelength bands when the periodic cell is 0.5 mm. In addition, the infrared reflectivity even reaches 87.05% in the 8-10 μm wavelength range, which shows superior infrared radiation suppression properties of the sample. The infrared reflectance spectral trends obtained from the simulation and test are in good agreement. In conclusion, the computational model proposed in this paper effectively improves the design efficiency of millimeter-scale metamaterial infrared reflectors, which is promising in the field of broadband infrared radiation suppression functional device design.
ObjectiveAs structural materials, aluminum alloys are widely employed in aerospace, especially in the 5 series and 7 series aluminum alloys. Currently, most of these aluminum alloy materials are prepared by traditional forging processes. Additive manufacturing technology, especially selective laser melting (SLM) forming technology, has gradually demonstrated enormous technological advantages under numerous demanding requirements such as weight reduction and functional upgrading of aerospace structures. However, currently, SLM forming of aluminum alloy structural components mainly relies on low-strength aluminum alloys, and these aluminum alloys' strength and other indicators cannot meet the performance requirements of 5 series and 7 series aluminum alloys. Additionally, the size of structural aluminum alloy components formed by SLM often has certain limitations. The development of high-strength Al-Mg-Sc-Zr forming and joining processes is significant for the large-scale and integrated development of aerospace equipment. Currently, there is relatively little research on the joining technology of SLM-formed Al-Mg-Sc-Zr alloys both domestically and internationally. Therefore, we hope to find a method to improve the joining performance of high-strength aluminum alloys.MethodsDue to the difficulty in forming large-scale high-strength aluminum components by SLM directly, we investigate the directed energy deposition (DED) joining process of Al-Mg-Sc-Zr fabricated by SLM. The distribution and morphology of defects and their influence on the mechanical properties are analyzed. Moreover, the microstructure, element distribution, and properties of specimens joining with different DED process parameters and the addition of ultrasonic external field assistance are compared, and mechanical properties are improved by hot isostatic pressing.Results and DiscussionsThe results indicate that the defects are mainly distributed in the fusion zone, which is the interface between the base and the joining zone (Fig. 4). The aggregation of dense pores at the fusion zone leads to a lower hardness than that of the joining zone and the base and then affects the mechanical properties of the whole specimens. With the laser energy density of 75-150 J/mm2, the higher energy density leads to higher density and tensile strength (Fig. 6). The highest fusion zone hardness, joining zone efficiency of space filling, and tensile strength of 90 HV, 90.83%, and 203.38 MPa respectively are obtained using 3000 W laser power, 5 mm/s scanning rate, and 3.7 g/min powder feeding rate. Ultrasonic vibration promotes the precipitation of the Al3(Sc,Zr)-enhanced phases and refines the grains, and ultrasonic vibration reduces the pore number and size. With ultrasonic vibration, the comprehensive mechanical properties of the specimens are significantly improved (Fig. 7). Hot isostatic pressing after ultrasound can further enhance the comprehensive mechanical properties.ConclusionsWe employ the DED process to join SLM forming Al-Mg-Sc-Zr and explore the influence of different process parameters and ultrasonic external field assistance conditions on the microstructure and tensile mechanical properties of the joining samples. We also elucidate that the suppression of pore defects is a key factor in improving the microhardness and tensile mechanical properties of the connecting sample. Between 75 J/mm2 and 150 J/mm2 laser energy densities, the larger energy density brings fewer pores and higher tensile strength. The highest hardness, efficiency of space filling, and tensile strength of the fusion zone are obtained using 3000 W laser power, 5 mm/s scanning rate, and 3.7 g/min powder feeding rate, with values of 90 HV, 90.83%, and 203.38 MPa respectively. Ultrasonic vibration promotes the formation and precipitation of Al3(Sc,Zr)-enhanced phases, refines the grains, and solves the defects, causing the pores to tend to escape outward and disperse into the joining zone. With ultrasonic vibration at a frequency of 19.66 kHz and a 1.6 A current, the Al-Mg-Sc-Zr joining is carried out by DED. Ultrasonic vibration generates a stirring effect in the melt pool, providing sufficient escape speed for the upward movement of pores in the melt pool. Compared with the alloy samples without ultrasonic vibration, the pore defects in the sample are significantly reduced and distributed more evenly, with notably improved mechanical properties such as strength and hardness. The hardness at the fusion zone is 95 HV, the efficiency of space filling is 93.06%, and the tensile strength is 292 MPa, all of which are 5%, 2.4%, and 44% higher than those without ultrasonic vibration respectively. The post-treatment method using hot isostatic pressing after ultrasonic vibration can further improve the comprehensive mechanical properties. The hardness of the fusion zone is 160 HV, the efficiency of space filling is 99.99%, and the tensile strength is 405.71 MPa, which are 68.4%, 7.4%, and 38.9% higher than those without hot isostatic pressing respectively.
ObjectiveThe ozone layer in the sky efficiently blocks ultraviolet light with a wavelength range of 0.24-0.28 μm, preventing this spectrum of solar radiation from reaching the ground. This creates the "solar blind ultraviolet" band, which has numerous advantages in civilian, military, and police applications. Especially, it plays a valuable role in criminal investigation science, particularly in retrieving physical evidence without destroying the scene. It can access and search scenes quickly while extracting high-quality images of fingerprint marks, bloodstains, semen spots, fire and explosive residues, and other physical evidence. Nevertheless, the unique application of solar blind ultraviolet (UV) bands and optical materials poses challenges that traditional optical design cannot meet. The development of aspherical and diffractive surfaces offers an effective new solution to this problem. The rapid advancement of ultra-precision machining and testing technology has made it possible to machine and test diverse aspherical surfaces with high precision. The advantages of Q-type aspherical surfaces, such as efficient optimization of optical systems and simplified processing of aspherical surfaces, are even more highly valued by the industry. Therefore, it is essential to introduce the benefits of Q-type aspheres and diffractive optical elements into the design of day-blind UV optical systems. We hope that our design results can facilitate the development and application of UV refractive-diffractive hybrid imaging optical systems.MethodsBased on the requirements of the actual application environment, the detector selection is conducted for the day-blind UV optical system, which includes the need for stable zoom. To meet these needs, we comprehensively consider two optical materials—fused silica and calcium fluoride due to their cost and performance in the UV range. We optimize the initial structure with Zemax OpticStudio software and set Q-type aspherical and diffractive surfaces on a lens substrate. Then, we reduce the number of system lenses to five and improve image quality. Finally, we design a day-blind UV zoom hybrid optical system for criminal investigation. The image quality of the system is evaluated, and the machinability analysis of the relevant surface types and the imaging simulation for criminal detection are improved.Results and DiscussionsAfter the initial structure is optimized by Zemax OpticStudio software, we design a day-blind UV optical system with a configuration of five lenses. The 1st, 3rd, and 5th lenses are made of fused silica, while the 2nd and 4th lenses are made of calcium fluoride. Notably, the last lens features a Q-type asphere on the front surface and a diffractive surface on the back surface (Fig. 5 and Table 2). Machinability analysis is conducted for the parity aspheres, diffractive surfaces, and Q-type aspheres (Figs. 6-8). The evaluation of system image quality yields the following results. The modulation transfer function (MTF) exceeds 0.7 at all three focal lengths (Fig. 9). The field curvature remains below 0.3 mm across all wavebands, and distortion is less than 0.06% (Fig. 10). The cam curve of the lens exhibits a smooth trend without inflection points (Fig. 11). Tolerance analysis indicates that the system is highly feasible (Tables 6 and 7). Finally, imaging simulations are performed, which yield the desired results (Fig. 12).ConclusionsBased on the ARTCAM-407UV-WOM UV detector, we design an optical system for day-blind UV zoom using a combination of Q-type aspherical surfaces and single-layer diffractive elements in the UV band. The optimized system consists of five lenses with only two materials, calcium fluoride and fused silica, and the Q-type aspherical and diffractive surfaces are set on a convex flat lens, which is easy to process and use. The MTF values at Nyquist spatial frequency of 11 lp/mm are all higher than 0.7, and the full-field-of-view distortion is less than 0.06% in the working waveband. The optical system has a simple and compact structure and has high imaging clarity and resolution, which has certain advantages in criminal investigation detection, especially in the extraction of potential traces and physical evidence.
ObjectiveOptical tweezer technology makes the mechanical effect of light used in practice, and it can accurately control microscopic particles. Localized hollow beam has important applications in optical captivity and optical tweezers with its physical characteristics such as barrel light intensity distribution and small dark spot size. The method of producing hollow beams by axicon lens is simple and practicable, and it has high conversion efficiency, which is beneficial for the capture of small particles. In the design of optical systems based on an axicon lens, how to balance the energy loss, beam mass, and adjustment error is worth studying, which will make the research more valuable for engineering applications.MethodsIn this paper, a pair of axicon lenses was used as a shaper to produce collimated parallel hollow beams. First, the mathematical description of the conical mirror type was given, and then the appropriate configuration of the mirror group was selected according to the requirement of practical application. The expression of light intensity of the hollow beam was obtained according to the law of conservation of energy, and then the diffraction spot and cross-section light intensity distribution of the hollow beam at different propagation distances in free space were simulated based on the Fresnel diffraction integral formula. In addition, the relationship curve of beam quality factor with the ratio of truncation diameter to Gaussian beam radius and the blocking ratio was calculated, so as to obtain good beam quality in practice. The influence of cone-top angle consistency, eccentricity, and tilt error on the wavefront error was analyzed. Finally, near- and far- field measurements of the shaped hollow beam was made.Results and DiscussionsThe axicon lens configuration featuring front concave, rear convex, and adjacent planes can either avoid damage caused by backreflected light back to the laser or meet the same design requirements with shorter air spacing (Fig. 2). The hollow beam shaped by the axicon lens can maintain good hollow beam characteristics within the transmission distance of tens of meters, and the inner and outer diameters basically do not change (Fig. 4). However, with the increase in the transmission distance, the light intensity of the center (on the axis) is not zero and gradually increases, which is the result of the diffraction transmission (Fig. 5). The beam quality factor increases with an increase in the ratio of the truncation diameter to the Gaussian beam radius while the energy truncation loss decreases with an increase in the ratio of truncation diameter to the Gaussian beam radius (Figs. 6 and 7). Besides, a larger shielding ratio indicates a larger beam quality factor for both shaped hollow beams and plane wave hollow beams of the same size (Fig. 8). Whether it is consistency error, tilt error, or eccentric error of the cone angle, choosing axicon lens with larger cone-top angle can allow larger processing error (Figs. 10 and 12). The ratio of the two error sizes under the same root mean square (RMS) value is almost constant (Table 2). When the eccentricity and tilt corresponding to the same RMS value coexist, the wavefront error is almost doubled, and when one of the errors is reversed, about 96.2% of the aberrations can be offset. Therefore, there is a certain equivalent relationship between eccentricity and tilt error on the influence of the wavefront RMS value (Tables 3 and 4). In the Gaussian beam shaping experiment, the far-field beam mass of the Gaussian beam without shaping is 1.10, and that of the hollow beam after shaping is 1.44, which is slightly larger than the theoretical calculation result. This is because the experiment is affected by various aberrations loaded after the beam passes through the collimation and shaping system, processing errors of the axicon lens, air, and dust media (Fig. 14).ConclusionsIn this paper, some basic problems in the process of designing, machining, and assembling the hollow beam shaper of axicon lens groups are studied. Based on the Fresnel diffraction formula, the transmission characteristics of the shaped hollow beam are analyzed, and the hollow beam characteristics can be maintained within a transmission distance of tens of metres. The beam quality factor is calculated. The results show that a greater ratio of truncated diameter to the Gaussian beam radius indicates a greater beam quality factor. The beam quality factor also increases with the increase in the shielding ratio. The relative eccentricity and tilt of the conical mirror group in machining and setting will affect the wavefront error of the beam. The research results show that the design of an axicon lens with a larger cone-top angle allows a larger error tolerance, and the effects caused by the two errors have a certain equivalence, which can be used to offset most of the aberrations in practical applications. It provides a theoretical basis for offsetting eccentric and tilted aberrations in setting work. Finally, the axicon lens group structure based on the study is tested, and the results show that the beam quality factor of the hollow beam after shaping is consistent with the theory.
ObjectiveThe optical design with arbitrary illuminance distribution is always a key concern of non-imaging optics due to its difficulty in solving the smooth mapping relationship. At present, the Monge-Ampère equation method, the supporting quadratic method (SQM), and the tailor method can solve this problem, but they all have drawbacks such as complex ideas and difficult manufacture. To seek a simple and efficient method, we start with mapping grids partitioning, and study the characteristic and optimization method of the integrability and energy matching of grids, providing references for the design of non-uniform freeform lenses.MethodsThe discussed mapping grid partitioning method is shown in Fig. 1. Equal initial quadrilateral grids are performed within the unit circle of source projection and the rectangular target plane to make the grid nodes correspond one by one. According to the relationship in Fig. 2, the energy is calculated by the grid area, and the area evaluation function is constructed based on the difference between the grid area and the ideal one. The integrability evaluation function is constructed based on the direction derivative residual of the nodes, and the weights are set according to the design. Under the guidance of the evaluation function, gradient operation is performed on the area difference to solve the area optimization vectors, and integrability optimization vectors are solved by the simplified node angle relationship in Fig. 3 and are combined based on the weights. The nodes are moved according to the comprehensive vectors and subjected to boundary conditions and topological conservation relationships. New grids are generated and a new value of the evaluation function is calculated. When the value tends towards 0, the energy matching and integrability of the mapping are improved.Results and DiscussionsTo verify the effectiveness of the method, we design a freeform lens that can display a non-uniform rectangular spot with the words "ZJUT" on the target. The effective angle of the source is set to 45° and initial grids are made within the corresponding projection circle and target plane, with the final result shown in Fig. 4. According to Fig. 5, the area evaluation rapidly decreases during the iteration, and the integrability evaluation of the source also significantly reduces. However, as the grid is no longer uniform to fit the energy distribution, the integrability evaluation of the target has increased compared to the evaluation at the beginning. The trend of the comprehensive evaluation function is consistent with the area evaluation, and the overall energy distribution and integrability are ultimately balanced based on weights. The final simulation results are shown in Fig. 7, and the illumination ratio of the words to the background is 2∶1, which is in line with the design. The font's boundary is clear, and the overall rectangular boundary maintains sound. There are slight defects in the four corners, which can be attributed to the poor integrability of the four corners of the light source grid.ConclusionsBased on the grid partitioning, a mapping optimization method is proposed. This method constructs a comprehensive evaluation function for energy distribution and integrability, and optimizes the mapping through iteration under the combined effect of area difference gradient and integrability optimization vectors to make the mapping have good integrability and meet the energy distribution. The lens solved via mapping has been simulated and confirmed that the spot achieves the expected shape and illumination, with slight defects on the edge. There has also been a significant improvement in design efficiency. In summary, although this method still has optimization space in boundary and non-Lambert sources, its method is simple, with sound effect and improved design efficiency. Meanwhile, it is expected to play a role in customized fields such as non-uniform spot design.
ObjectiveTerahertz waves refer to electromagnetic waves between microwave and infrared wave, which can be applied in different fields such as communication, sensing, radar, and imaging. Terahertz coding metasurface, as an important device for modulating terahertz waves, has the advantages of simple structure, small size, low cost, low loss, and high efficiency. The coding metasurface units are arranged according to a certain coding sequence, and by changing the phase difference between the units, the flexible modulation of terahertz waves can be achieved to generate various forms of beams. However, when the design of a general terahertz coding metasurface is completed, the function and operating frequency are relatively single. In order to fully utilize the coding metasurface, an anisotropic metasurface is proposed, which can regulate the incident orthogonal polarized waves separately. And a frequency independent coding metasurface has been proposed, which can separately regulate the incidence waves at different frequency points to generate different forms of beams. In addition, the phase change materials such as vanadium dioxide (VO2) were used to achieve the switching of transmission and reflection modes of terahertz waves, thereby achieving the goal of full spatial modulation of electromagnetic waves. The above methods improve the ability of the coding metasurface to regulate terahertz waves, but the integration level still needs to be improved. Therefore, we integrate these technologies to achieve multi-frequency and multi-beam tunable terahertz coding metasurface in full space, greatly improving its ability to regulate terahertz waves.MethodsIn this paper, a coding metasurface which can regulate the circular polarized waves and orthogonal polarized waves separately is proposed by combining the principle of PB geometrical phase as well as the frequency independence and anisotropy of double crosses. In addition, introducing the phase change material VO2, flexible switching of terahertz waves between transmission and reflection is achieved by changing its phase change state. The details are as follows. When VO2 is in an insulating state, the designed coding metasurface is a single-frequency-point 3-bit PB geometrical phase transmitting coding metasurface, which generates transmission-type vortex waves with topological charge number of 1. When VO2 is in a metallic state, the designed coding metasurface is a dual-frequency-point independently adjustable 1-bit anisotropic reflective coding metasurface, which generates four symmetric beams, of which two symmetric beams on the xoz plane with RCS reduction and two symmetric beams are on the yoz plane, respectively.Results and DiscussionsThe designed coding metasurface units (Fig. 1) with identical metallic split-ring structures in the third, fifth, and seventh layers are rotated from 0° to 157.5° in a step of 22.5° to obtain a total of eight coding metasurface units (Fig. 2). When VO2 is in an insulating state and a circularly polarized wave with f1=0.6 THz is incident, the units maintain a high transmission amplitude and strictly satisfy a phase difference of 45°. The design conditions for a 3-bit transmission type coding metasurface unit are met. Arranging them according to a certain coding sequence [Fig.4(b)] can produce transmission-type vortex waves with topological charge number of 1 (Fig.5). When VO2 is in a metallic state and the orthogonal polarized waves of f2=0.5 THz and f3=0.85 THz are incident, a dual-frequency and anisotropic 1-bit reflective-type coding metasurface unit (Fig. 3) is designed by using the two cross structures. After arranging them according to a certain coding sequence [Figs. 4 (c)-(f)], the perpendicular incidence of y-polarized wave with f2=0.5 THz on the xoz plane produces two symmetric beams [Figs. 6(a) and 6(b)]. When a y-polarized wave with f3=0.85 THz is incident vertically, two symmetric beams are generated on the yoz plane [Figs. 6(c) and 6(d)]. When a x-polarized wave with f2=0.5 THz is incident vertically, four symmetrical beams are generated [Figs. 7(a) and 7(b)]. When a x-polarized wave with f3=0.85 THz is incident vertically, a diffuse scattering beam can be generated [Figs. 8(a) and 8(b)], realizing RCS reduction. The results show that with the rational design of the coding metasurface combined with the phase transition state of VO2, the frequency of the incident wave source, and the polarization state, the full space regulation of terahertz wave's reflection and transmission can be realized and five beam forms on the same coding metasurface can be obtained.ConclusionsIn this paper, a coding metasurface with full space multi-frequency and multi-beam tunability is designed by changing the phase transition state of VO2, combining the principle of PB geometrical phase and the cross unit structure with dual-frequency anisotropy. A 3-bit transmission coding metasurface with an operating frequency of f1=0.6 THz is designed to produce a transmitted vortex beam. And a dual-frequency 1-bit anisotropic reflective coding metasurface with operating frequencies of f2=0.5 THz and f3=0.85 THz is designed to produce various forms of symmetric and scattered beams. This coding metasurface, which introduces phase change material and realizes full space multi-frequency multi-beam regulation by transmission and reflection, is important for designing multifunctional terahertz beam modulation devices.
ObjectiveIn recent years, strong coupling between surface plasmons and excitons has become a research hotspot in light-matter interactions. As an important two-dimensional material, transition metal dichalcogenides (TMDs) have caught extensive attention due to their unique optoelectrical properties. TMD monolayers are direct band gap semiconductors and their excitons have large transition dipole moments and binding energy, which is beneficial to realize the strong coupling between photons and excitons at room temperature. Surface plasmons in metallic nanostructures feature near-field enhancement and small mode volume, providing an effective platform for realizing its strong coupling with excitons. Recently, the strong coupling has been achieved between surface plasmons and TMD excitons in plasmonic systems such as metallic nanoarray, nanoparticles, and nanocavities. One-dimensional (1D) metallic grating is a typical plasmonic structure, in which the coupling effect between surface plasmons and TMD excitons has been rarely studied till now. Thus, we investigate the plasmon-exciton strong coupling behavior in the 1D metallic grating integrated with monolayer tungsten disulfide (WS2).MethodWe build a simulation model by adopting the finite-difference time-domain (FDTD) method and numerically investigate the coupling effect between surface plasmons in the gold grating and excitons in monolayer WS2. The dielectric constants of gold and monolayer WS2 are described by the Drude model and high-order Lorentz model respectively. The spectral response and electric field distribution of the gold grating structure and gold grating/monolayer WS2 hybrid structure are calculated. We study the dependence of reflection spectra on the structural parameters (grating pitch p, width l, and height h) in the gold grating and gold grating/monolayer WS2 hybrid structures. Based on the temporal coupled-mode theory, we build a model of optical coupling between surface plasmons in the gold grating and excitons in monolayer WS2 and thus derive the theoretical formula of the reflection spectrum from the hybrid structure. The temporal coupled-mode theory is employed to fit the reflection spectra of the hybrid structures. Thus, we obtain the fitting parameters containing plasmonic and exciton decay rates and coupling strength in the hybrid structures with different grating heights. Then, the coupled oscillator model is utilized to calculate the splitting energy of the reflection spectra from the gold grating/monolayer WS2 hybrid structures. Finally, the dependence of the reflection spectrum on the environmental refractive index is studied by FDTD simulation.Results and DiscussionsThe results show that the reflection spectrum of the gold grating with the pitch p = 400 nm, width l = 300 nm, and height h = 95 nm possesses an obvious dip at the wavelength of 620 nm due to the generation of surface plasmons. When the monolayer WS2 is integrated with the gold grating, the plasmonic reflection spectrum will be split. There is an obvious reflection peak at 620 nm wavelength in the original reflection dip with two reflection dips around the peak [Fig. 1(b)]. The electric field of the gold grating is mainly localized at the vertex of the gold grating. With a monolayer WS2, the electric field intensity is weakened [Figs. 1(c) and 1(d)]. With the increasing pitch, width, and height, the reflection dip of the gold grating has a red-shifted [Figs. 2(a), 3(a), and 4(a)]. The reflection spectra of the hybrid structure are fitted by the temporal coupled-mode theory, and they are in good agreement with the simulated spectra [Figs. 2(b), 3(b), and 4(b)]. We find that the fitted decay rate and coupling strength are not sensitive to the height of the gold grating, and the plasmonic resonance frequency decreases with increasing h (Fig. 5). The analyzed results yielded by the coupled oscillator model show that the coupling between the surface plasmons and the excitons in the hybrid structure satisfies the criterion of strong coupling with the Rabi splitting of 54.6 meV (Fig. 6). The relationship between the coupling spectrum and environmental refractive index is studied in the hybrid structure. The wavelength difference between the two reflection dips is found to be approximately linear with the refractive index, which provides a possible way for optical sensing (Fig. 7).ConclusionsThe coupling characteristics of surface plasmons in the gold grating and excitons in monolayer WS2 are studied. The spectral response and electric field distribution of the 1D gold grating/monolayer WS2 hybrid structure are simulated by the FDTD simulation. The results show that the coupling between surface plasmons in the gold grating and excitons in monolayer WS2 can generate spectral splitting. The reflection spectra of the hybrid structure with different structural parameters are fitted by adopting the temporal coupled-mode theory. The fitting results are in good agreement with the numerical simulation. The theoretical analysis shows that the coupling between surface plasmons in the gold grating and excitons in the monolayer WS2 satisfies the strong coupling criterion. The Rabi splitting of coupling spectra from the hybrid structure is 54.6 meV, which is consistent with the temporal coupled-mode theoretical result. The simulation results show that the wavelength difference between the spectral dips of strong coupling presents nearly linear relations with the environmental refractive index, which will offer a new way for optical sensing. Additionally, this work will provide a new method for plasmon-exciton strong coupling in metallic grating integrated with TMDs and its applications in optical devices.
ObjectiveHigh-sensitivity, miniaturization, and integration sensors are still in great demand in medical detection, environmental monitoring, and other fields. One of the hot issues in the current research on sensors is to improve the sensitivity and reduce the size of sensors. Mach-Zehnder interferometer (MZI) is an important part of integrated optics, which is widely used in optical filters, optical lasers, optical sensors, and other fields. The refractive index sensor based on MZI has been widely utilized in sensing according to its advantages of simple structure, convenient manufacture, and large process tolerance. In general, MZI-based sensors implement sensing by detecting the variety of interference signals between the reference arm and the sensing arm. The proposed sensor schemes based on MZI usually have large sizes and complex structures. Therefore, the study of small-size and high-sensitivity MZI sensors is very suitable for the current development needs.MethodsTo improve the sensitivity of the sensor without increasing the complexity, we choose to add a new type of waveguide to the MZI-based sensor. The sensitivity of the MZI-based sensor is mainly determined by the difference in the length of the two MZI arms and the group refractive index of the optical signal transmitted in the waveguide. In traditional MZI-based sensor schemes, the light transmits in the same mode in the sensing arm and the reference arm, so the group refractive index difference is limited. To solve this problem, we transmit different modes on different MZI arms to obtain ultra-sensitive refractive index sensors. It is found that the sensitivity of a sensor can be improved effectively by increasing the intensity and the contact area between the waveguide and analyte. Therefore, we emit suspended slot mode into the sensing arm, launch TE0 mode into the reference arm, and adjust the length of both arms to maximize the sensitivity of the sensor.Results and DiscussionsAccording to formula (13), the sensitivity of the sensor is mainly determined by the waveguide sensitivity (SW) and the device sensitivity (S1). The magnitudes of S1 and SW are dependent on both the length of the two arms of the MZI and the waveguide structure. The slot gap (g)is assumed as 0.1 μm, the height of silicon (H) as 0.22 μm, and the hanging height (d) as 1 μm. According to the calculations, it is shown that within the range of 0.4-0.5 μm, the SW of the strip waveguide decreases as the width (Ws) of the strip waveguide increases. The SW of the slot waveguide increases as the waveguide width (Wslot) increases within the range of 0.25-0.26 μm, and the SW of the slot waveguide decreases as the Wslot increases within the range of 0.26-0.5 μm. SWof SSlot waveguide increases with the increase in SSlot waveguide width (WSSlot) in the range of 0.2-0.23 μm and it decreases with the increase in WSSlot in the range of 0.25-0.5 μm. The sensitivity of the suspended slot waveguide is superior to that of the slot waveguide and strip waveguide, reaching a maximum of 1.313 (Fig. 5). After optimizing the length of the tapered waveguide (Ltaper) and the width of the tapered waveguide (Wtaper), the conversion efficiency between TE0 mode and slot mode reaches 97.3% (Fig.7). The refractive index n of the analytical component region is set from 1.00029 to 1.00049, and the main bandwidth of the sensor spectral line decreases with the increase in refractive index. Through calculation, the sensitivity of the MZI sensor reaches 9.824×10⁴ nm/RIU (Fig. 11).ConclusionsWe propose a refractive index sensor with high sensitivity, utilizing an MZI based on silicon-on-insulator (SOI). The transmission and sensitivity formulas of the sensor are derived and analyzed. The structures of different waveguides are compared and analyzed, and it is found that the suspended slot waveguide outperforms the other two waveguides. Thus, the strip waveguide is selected as the reference arm and the suspended slot waveguide is selected as the sensing arm in the MZI sensor. Then, we conduct tests on the conversion efficiency between the TE0 mode and the slot mode in the sensor. After optimizing the length and width of the tapered waveguide, we can achieve a conversion efficiency of 97.3%. Finally, we optimize the arm length of the MZI and change the refractive index of the analyte region to obtain different transmission spectra. By detecting the wavelength shift between different transmission spectra, the sensitivity of the sensor is calculated by the formula to reach 9.824×10⁴ nm/RIU. Our scheme also has the advantages of small size and simple manufacture and can be widely applied in biomedicine, environmental monitoring, and other fields.
ObjectiveGlutathione (GSH) is the most abundant and important biological thiol antioxidant in living cells. It is not only able to directly scavenge free radicals but also is an important component of the glutathione peroxidase system to resist oxidative damage caused by free radicals and reactive oxygen species. Abnormal cellular GSH levels are considered an important biomarker for human health and are associated with the progression of various diseases, such as liver injury, aging, cancer, cystic fibrosis, and neurodegenerative diseases. Therefore, there is an urgent need to develop a simple method to detect GSH concentration. At present, the main detection methods for GSH include colorimetry, mass spectrometry, chromatography, magnetic resonance imaging, Raman spectroscopy, and electrochemical methods, which have been employed to determine glutathione in biological systems. However, some of the above methods have drawbacks such as low sensitivity, slow speed, poor selectivity, complex process, and expensive experimental equipment. Therefore, a fast, highly sensitive, and specific GSH sensor should be developed.MethodsWe adopt a two-step method to synthesize UFO-shaped oxidase-like Au@MnO2 nanoparticles (NPs). Firstly, sodium citrate reacts with chloroauric acid to generate AuNPs, and then the KMnO4 solution reacts with polyamine hydrochloride solution to form MnO2 wrapped on the surface of the AuNPs. Then, TEM, SEM, and linear scanning are adopted to characterize the prepared Au@MnO2 nanomaterials. Next, we optimize the reaction parameters of the sensor, such as pH value, OPD concentration, and incubation time of GSH. For GSH sensing, Au@MnO2 catalyzes the reaction of o-phenylenediamine (OPD) with oxygen to produce 2,3-diaminophenazine (DAP) with fluorescence. The etching of GSH to MnO2 results in weakened catalytic ability of the Au@MnO2 nanoparticles after the addition of GSH, and therefore the fluorescence intensity of DAP exhibits an obvious decrease and realizes the fluorescence sensitive detection of GSH.Results and DiscussionsIn the optimal experimental conditions, the fluorescence peak intensity changes of the system solution at 560 nm are investigated when different concentrations of GSH are added (Fig. 6). As shown in Figs. 6(a) and 6(b), as the concentration of GSH increases, the fluorescence peak at 560 nm gradually decreases. The solution color changes from orange to yellow and then to colorless under ultraviolet light. The fluorescence intensity at 560 nm is fitted and analyzed, as shown in Fig. 6 (c), and a good linear relationship between the fluorescence intensity change at 560 nm and the logarithm of GSH concentration (0.01-10 μmol/L and 50-1000 μmol/L) is acquired with the low detection limit of 0.003 μmol/L. Therefore, quantitative detection of GSH concentration can be achieved based on fluorescence changes. To investigate the influence of the nanoprobe on GSH detection in the presence of other interfering substances (metal ions and amino acids), we conduct interference experiments. The results are shown in Fig. 7. When 5 mmol/L amino acids (tyrosine, lysine, and glutamic acid) and ions (Na+, K+, and Mg2+) are added to the system, compared to the fluorescence intensity of Au@MnO2-OPD, the added amino acids have little effect on the fluorescence intensity of the system. However, when 0.5 mmol/L GSH is further added to the solution, the fluorescence intensity significantly decreases. This indicates that the system has good selectivity for GSH. To study the detection performance of this method in actual biological systems, we employ this sensor to detect GSH in serum. As shown in Fig. 8, the splendid linear relationship between the fluorescence intensity change at 560 nm and the logarithm of GSH concentration (0.01-10 μmol/L and 50-1000 μmol/L) is obtained. Additionally, for the test results of the same serum sample, our method is compared with the medical ultraviolet enzyme method as a reference standard. As shown in Table 1, this method has high consistency with ultraviolet enzyme method in determining GSH content in serum. This method can be utilized for GSH detection in serum and has great application prospects in clinical diagnosis.ConclusionsWe propose a simple and rapid method for preparing UFO-shaped oxidase-like Au@MnO2 nanoparticles. Based on the oxidase catalytic performance of this material, a fast, simple, and highly sensitive method for fluorescence detection of GSH is designed, which can detect GSH at concentrations of 0.01-10 μmol/L and 50-1000 μmol/L with a detection limit of 0.003 μmol/L. This analytical method has high selectivity, high sensitivity, simple operation, and short detection time, with broad application prospects in GSH detection.
ObjectiveHumidity is an important factor affecting industrial production, crop planting, food processing, microbial culture, human health, and cultural relics preservation because it is easy for bacteria, fungi, and viruses to grow and reproduce under appropriate humidity. Especially in the high humidity environment, the surface of organic cultural relics (such as leather, bamboo, paper, and textiles) is prone to breed mold. However, in a dry (low humidity) environment, it is subject to cause dry cracking of cultural relics, and even result in oxidation and deterioration of cultural relics. Therefore, accurate in-situ real-time detection of environmental humidity of cultural relics preservation is vital for effective preventive protection of cultural relics. At present, the main sensors adopted for on-line humidity detection are electrochemical humidity sensor, surface acoustic wave humidity sensor, and fiber optic humidity sensor. Optical fiber sensors feature small size, high temperature resistance, corrosion resistance, electromagnetic interference resistance, and quasi-distributed measurement, and have become one of the most promising sensors for online relative humidity detection. However, it still faces the problems of low sensitivity, long response time, and low accuracy. Therefore, it is necessary to develop a fiber optic humidity sensor with high sensitivity, short response time, and high accuracy.MethodsTo improve the performance of fiber Bragg grating (FBG) humidity sensors, firstly, we construct a new humidity-sensitive material composed of chitosan, polyvinyl alcohol, and nanocarbon powder. Secondly, the FBG humidity sensor is made. Thirdly, the principle of humidity detection by sensor is analyzed. Fourthly, the humidity measurement system is set up. Fifthly, the surface morphology and composition of the samples are characterized by scanning electron microscopy (SEM) and Fourier transform infrared (FT-IR) spectroscopy. Additionally, the influence of the preparation conditions and the environment on the sensor performance is studied experimentally, and the output spectrum, sensitivity, response time, and accuracy of the sensor are tested.Results and DiscussionsWe develop an FBG humidity sensor based on nanochitosan/polyvinyl alcohol/nanocarbon powder composite organic film. The research results show that the humidity sensor yields the best performance when the nanocarbon powder doping mass fraction in the humidity sensitive film is 10% (Fig. 4) and the thickness of the humidity sensitive film is 185 μm (Fig. 5). The best performance sensor can perform highly sensitive, fast, and accurate detection of relative humidity (20%RH-90% RH) in the temperature range of 5-65 ℃,when the wavelength of the optical radiation source is 220-1200 nm and the light irradiation intensity is 50 mW/cm2. Sensor sensitivity humidity reaches 57.7 pm/(%RH) [Fig. 5(d)], response time is 420 s, and recovery time is 540 s [Fig. 5(b)].ConclusionsWe develop a new FBG humidity sensor based on nanochitosan/polyvinyl alcohol/nanocarbon powder composite organic film. The presence of a large number of hydroxyl and amino groups in the chitosan/polyvinyl alcohol complex enhances the swelling effect of the polymer. Additionally, the nanocarbon powder with a larger surface area to the chitosan/polyvinyl alcohol complex enhances the water adsorption, greatly improving the sensitivity and response rate of the sensor to humidity. The reference grating is employed to decouple the temperature. The creative utilization of black PTFE capillary packaging structure eliminates the light interference on the FBG humidity sensor coated with humidity sensitive materials. Our research has application significance in in-situ, real-time, and online humidity detection, and also provides a new solution for humidity detection and sensing.
SignificanceThe ocean occupies more than 70% of the earth's surface, which has vast area and rich resources. Research and exploration of the ocean have never ended. Due to the complexity and variability of the underwater environment, the ocean has not yet been fully explored and utilized. Further exploration of the underwater environment plays an important role in climate change, oil and gas detection, disaster early-warning, biological research, and other fields. Underwater wireless communication ensures information transmission and interconnection between unmanned devices in the underwater environment during ocean exploration. As the demand for underwater data transmission increases, high-bandwidth and low-latency underwater communication has become a key technology for exploring and utilizing the ocean at a deeper level.Commonly used carriers for underwater wireless communications include sound waves, electromagnetic waves (e.g. radio frequencies), and light waves. Each of the three carriers has its own characteristics. Although sound waves, as a traditional underwater communication method, have the advantage of a wide transmission range and have been widely used, the problems of relatively narrow bandwidth and longer delay in the medium limit their applications. Electromagnetic waves are difficult to be widely used in underwater environments as they require complicated equipment and short transmission distances. As a new type of underwater communication technology, underwater wireless optical communication has gained widespread attention due to its advantages such as larger transmission bandwidth, better anti-interference ability, lower latency, and lower costs. Underwater wireless optical communication refers to an underwater communication system that uses light waves as the transmission carrier. In recent years, underwater wireless optical communication has made considerable progress in the transmission capacity through the expansion and utilization of multiple physical dimensions of light waves, such as wavelength, time, amplitude, phase, and polarization. However, there are challenges in further improving the transmission capacity. The exploration of the spatial dimension of light waves has become a feasible way for capacity scaling.Structured light refers to a special light field that exploits the spatial dimension by tailoring the spatial amplitude, phase, and polarization distribution of light waves to obtain the required characteristics. Especially, structured light with a spiral phase front carrying orbital angular momentum (OAM) has attracted interest in many applications such as optical manipulation, tweezers, sensors, metrology, microscopy, imaging, and quantum science. OAM-carrying structured light appears spatially as an annular intensity distribution due to phase singularity at the beam center. Since OAM-carrying structured light can accommodate multiple orthogonal spatial modes, it has important advantages in expanding the capacity of underwater wireless optical communication. We comprehensively reviewed the advances in underwater OAM optical communications.ProgressWe first introduced the development history of three types of underwater wireless communication technology, including underwater acoustic communication, underwater electromagnetic (radio frequency) communication, and underwater optical communication, and summarized their respective advantages and disadvantages. Then, we focused on underwater wireless optical communication using OAM modes, with their basic principle, generation, and measurement methods introduced. The research progress of underwater OAM mode wireless optical communication was comprehensively reviewed, including underwater OAM mode encoding and decoding communication, underwater OAM mode multiplexing communication, and underwater OAM mode broadcasting communication. Moreover, OAM mode optical communications involving air-water interface ("water-air-water" crossing air-water medium, total reflection by "air-water" interface) and fast auto-alignment assisted OAM mode optical communications were presented. In addition to the OAM mode, other underwater structured light (e.g. Bessel beam and Ince-Gaussian beam) communications were also introduced. Additionally, complex medium optical communications using OAM modes assisted by adaptive turbulence compensation and fast auto-alignment were presented.Conclusions and ProspectsOAM mode exploits the spatial dimension of light waves, providing a new way for the sustainable capacity expansion of underwater wireless optical communication. The future development trend of underwater wireless optical communication is as follows. From the spatial mode point of view, more flexible and powerful spatial light manipulation, a large number of OAM modes, more general structured light accessing the full spatial dimension (spatial amplitude, spatial phase, and spatial polarization), and full use of multiple dimensions are highly desired. From the underwater communication point of view, complex channel modeling, high capacity, long distance, and high robustness are highly expected. Key devices [lasers, modulators, detectors, converters, and (de)multiplexers] and techniques (high speed, high power, high sensitivity, high efficiency, high scalability, and high integration) are of great importance. Meanwhile, from the perspective of future underwater wireless optical communication, on the one hand, it is expected to be combined with electromagnetic (e.g. RF) communication and acoustic communication. According to different application scenarios and different capacity and distance requirements, one or more suitable communication methods and their combinations can be selected. On the other hand, the integration of underwater wireless optical communication technology and underwater perception technology (i.e. integrated communication and perception) is also an important research direction in the future, which is of great significance for improving the development capacity of marine resources, developing the marine economy, protecting the marine ecological environment, and serving the strategy of becoming a powerful marine country.
SignificanceNonlinear optical microscopy (NLOM) is a technology that combines nonlinear optical effect with optical microscopy to generate contrast images by nonlinear light-matter interactions. Additionally, NLOM differs from conventional microscopy, which is typically based on linear interactions such as absorption, scattering, refraction, and fluorescence. In the past few decades, nonlinear optical imaging techniques have become important tools for detecting biomolecules, cells, and tissues at the micrometer and nanometer levels. The NLOM advancements promote and enhance the basic research on biology, pharmacy, and medicine. The nonlinear imaging techniques mainly include second harmonic generation (SHG), third harmonic generation (THG), two-photon excited fluorescence (TPEF), three-photon excited fluorescence (3PEF), coherent anti-Stokes Raman scattering (CARS) microscopy, and stimulated Raman scattering (SRS) microscopy. These techniques rely on tight focusing of ultrashort pulses with high photon density to excite nonlinear processes, which feature diffraction-limited spatial resolution and optical sectioning. Additionally, nonlinear optical microscopes employ near-infrared light sources that provide strong penetration power and cause minimal photodamage to tissues, allowing label-free imaging at the subcellular level. The nonlinear optical properties of different molecules in biological tissues enable molecular specificity and selectivity, making nonlinear optical imaging techniques widely applicable in biomedical imaging.With the advances in biology, the applications of nonlinear optical imaging technology are expanding, and the complex structures and functions of living organisms pose new challenges to optical imaging. Biomedical research requires super-composite optical imaging technology to achieve multidimensional optical characterization of biological tissues and obtain comprehensive information about their microstructure and molecular metabolism. Multiple nonlinear contrastive imaging technologies eliminate the need for tedious tissue preparation and enable analysis of unlabeled tissue samples, which provides rich structural and functional information about complex organisms. Finally, the multimodal nonlinear optical imaging technology which integrates multiple optical characterization methods has emerged as a new direction in optical microscopy in recent years.It is necessary to summarize and explore the existing research progress and future development trends to further promote the development of multimodal nonlinear optical imaging technology and contribute to relevant biomedical research. This will provide references for researchers in related fields.ProgressThe generation of nonlinear optical effects relies on focusing ultrashort pulse lasers to achieve extremely high peak intensity. When multiple photons simultaneously interact with excited fluorophores or specific structures, nonlinear optical signals are generated by light-matter interactions. A deep understanding about the generation process of various nonlinear effects is necessary to obtain optical images with high signal contrast and signal-to-noise ratio (SNR). Furthermore, selecting appropriate excitation conditions and detection methods is crucial for effective nonlinear optical imaging. We introduce the generation process of different nonlinear optical signals and their imaging mechanisms, mainly including multiphoton excitation fluorescence (MPEF), SHG/THG, coherent Raman scattering (CRS), and two-photon fluorescence lifetime microscope (TP-FLIM).Multimodal nonlinear optical imaging technology allows for accurate and comprehensive multi-parameter optical physical information. It serves as an important tool in studying complex organisms and multi-threaded dynamic processes from a multi-dimensional perspective. This technology has extensive applications in biological research fields such as physiology, neurobiology, embryology, and tissue engineering. However, different nonlinear optical imaging systems have distinct requirements for optics and hardware in excitation conditions and detection methods. Therefore, the key to integrating multiple nonlinear optical imaging technologies lies in coordinating the synchronous excitation of multiple nonlinear effects and the simultaneous detection of multi-dimensional signals. Meanwhile, we elaborate on the technical challenges and solutions related to multimodal coupling in nonlinear optical imaging and introduce the research progress and biological applications of multimodal imaging with multiple coupling mechanisms.Additionally, we review the optimization schemes for multimodal nonlinear optical imaging from three aspects of imaging speed, spatial resolution, and SNR to further improve the performance of multimodal optical imaging system. System miniaturization is discussed, and multimodal nonlinear optical endoscopy is extended to enable dynamic monitoring of the epidermis and internal organs of living organisms. Furthermore, nonlinear optical imaging microscopes can visualize the tissue structure and molecules in organism specificity. The imaging results require combined image processing methods for the quantitative detection of biological molecules and tissue structures. Therefore, we further introduce quantitative analysis methods for different nonlinear optical images.Conclusions and ProspectsMultimodal nonlinear optical microscopy, along with corresponding quantitative analysis methods, can conduct imaging and characterize the structure and physiological dynamic processes of biological tissues from multiple information dimensions. It represents an important branch of nonlinear optical microscopy development, with extensive applications in biomedical fields such as cell detection, cancer diagnosis, and brain imaging. Additionally, it holds significant potential, particularly in clinical pathological diagnosis. However, there are still several aspects of this technology to be further developed and improved. Firstly, in multimodal imaging, TP-FLIM imaging based on time-correlated single photon counting (TCSPC) requires a longer accumulation time for photons to obtain the lifetime decay curve. Simultaneously, spectral scanning in stimulated Raman scattering (SRS) imaging necessitates changing the position of time delay displacement tables. The two imaging methods still limit the imaging speed of the system and hinder the multi-parameter optical characterization for certain dynamic physiological processes. Therefore, there is still a room for further research on fast multimodal nonlinear optical imaging schemes.Meanwhile, in practical applications, the images obtained from multi-parameter nonlinear optical imaging systems should be combined with corresponding analysis methods to extract relevant biochemical information. This requires extensive data processing and statistical analysis, particularly in the context of clinical pathological analysis. Exploring new analytical methods that enable rapid conversion from optical images to biological information will significantly enhance the clinical applicability of multimodal nonlinear optical imaging. In summary, despite the potential and utility in biomedical research presented by multimodal nonlinear optical microscopy, further advancements are needed to address challenges such as imaging speed and data analysis. By developing faster imaging schemes and exploring new analytical methods, the clinical applications of multimodal nonlinear optical imaging can be greatly enhanced.
SignificanceDue to the outstanding thermal-mechanical properties and the high resistance to radiation, abrasion, and corrosion, SiC ceramics can be ranked as the optimal materials for the manufacture of the optics and the precision structures for space/ground-based advanced opto-mechanical systems. They fulfill the increasing demands of aperture enlargement, weight budget reduction, thermomechanical management simplification, and long-term stability. During the past three decades, ESA, NASA, JAXA, CASC, China Academy of Sciences, and so forth have been making great efforts to develop SiC components for remote sensors and telescopes for civilian and military applications at the cutting edge of the new generation optomechanical system development. The material preparation technologies and the relevant fabrication technologies, which determine the performance of the SiC components, the modules, and even the whole system, are the focus of the investigation and study.ProgressThe major concerns of the great efforts paid to the SiC preparation technologies are the accomplishment of optical surface density, the homogeneity, and the isotropy of the SiC blanks, which are essential for the optomechanical application, as well as the improvement of the thermomechanical properties such as specific modulus and thermal stability, and the manufacturability of the large-scale structural complexities.Among various SiC preparing technologies presented in Fig. 1, the densification methods of pressureless sintering, the reaction sintering/bonding and the chemical vapor composition/converting (CVC), combining the suited forming techniques for preforms, are proven to be effective for the SiC optics and precision structures. The pressureless sintered SiC possesses relatively better mechanical performance and homogeneity. It has presented isotropy, thermostability, and machinability during the development and in-orbit services of Herschel Space Observatory's (2009) Φ3.5 m primary mirror, GAIA (2014) and Euclid's (2023) all-SiC optomechanical structures. The maximum sizes of monolithic pressureless sintered SiC (S-SiC) optics reported reach 1.7 m×1.2 m (BOOSTEC) and Φ1.5 m (Shanghai Institute of Ceramics, China Academy of Sciences). However, further enlargement encounters the difficulties of the large-size high-temperature sintering equipment construction, the high sintering shrinkage, and the resulting ununiform deformation and stress that might cause cracking. CVD or PVD cladding on the S-SiC surface is necessary for optical polishing due to the residual micropores. Typical reaction sintered/bonded SiC (RB-SiC) comprises SiC, free Si, and residual C that is detrimental to the materials. The results show that reaction sintering/bonding densification methods are suitable for various ceramic forming techniques and the shrinkages of the whole process can be kept lower than 1%. The sintering temperatures are as low as the melting point of Si and the homogeneous bonding of parts is practicable, which are the essential processes to realize the reported largest Φ4.03 m SiC mirror (Changchun Institute of Optics, Fine Mechanics and Physics, China Academy of Sciences, 2016), except for lower Young's modulus than that of single-phase SiC ceramics. The results of the previous study also demonstrated the effectiveness of the microstructure refining and the phase composition regulation on the improvement of the RB-SiC performance and optical manufacturability. SiC via chemical vapor composition/converting (CVC SiC) is a single-phase ceramic with high purity. Trex Enterprise developed the co-deposition of micro SiC powder and precursor derived SiC onto the mold along with the densification process. POCO company adapted the pure porous graphite as preforms, and the vapor SiO and Si as infiltration matters, which would react with the graphite to convert into beta SiC meanwhile promoting densification. The introduction of the heterogeneous nucleation cores of the micro SiC powders or the graphite surface increases the rate of the crystal growth via the vapor phase by 10 times more than that of the CVD process and helps to overcome the heterogeneity of the materials due to the columnar crystal growth and to reduce the stress between the interface of the sequential solidified phases, which enables the fabrication of 1.5 m class CVC SiC mirror blank. The properties of Trex's CVC SiC are as excellent as pure full-dense SiC ceramic and facilitate the direction polishing without additional surface modification for optical surface finishing. However, the deposit efficiency and the capability of the complex component fabrication are yet the bottleneck of the promotion of the CVC techniques.As another determining factor for the performance of the SiC components, the improved structural configurations, such as topology-optimized structures (Fig. 12) and structures with the integrated cooling medium channels, exceed the capability of conventional technologies. Additive manufacturing (AM) or 3D printing techniques enable the free-form components manufacture. According to Goodman's investigation, based on the AM or 3D printing techniques, the weight reduction of the SiC optics comes up to 39% for 1-2.5 m class SiC mirrors for FIR application compared to JWST, and up to 40% of cost reduction. Investigation results show that additive manufacturing shaping combined with reaction sintering densifying is optimal for the preparation of the SiC materials for optics and precision structures. Binder jet printing, stereolithography/digital light processing, fused deposition modeling, and selective laser sintering are promising candidate methods for SiC or SiC-C preform forming. However, the problems of the lower performance compared to the materials via conventional methods, the heterogeneities of the materials, and the difficulties in non-uniform deformation control during the debonding and the reaction sintering are yet to be resolved.The joint of SiC parts favors the large-scale optomechanical system construction less costly and risky. As a typical case of all-SiC structure, the Euclid payload demonstrated the bolt joint, epoxy bonding, ceramic bonding, and brazing of the pressureless sintered SiC parts (Figs. 17-18). The rigidity of the brazing joined components or the structural frames is more promising than that of the first two, though the bolt joint and the epoxy bonding might be realized at room temperature in a normal atmosphere and applicable for SiC and other materials. However, brazing will inevitably introduce residual stress due to the thermal mismatching of the base materials and the fillers, and due to the volume changing of the fillers during solidification. The residual stress cannot be eliminated through the post process, hence increasing the uncertainty for the dimensional stability of the precision structures. Reaction bonding techniques facilitate the homogeneous joint through Si-C reaction, which can be carried out simultaneously with the reaction sintering process and avoid the residual stress. The microstructure of the joining area can be tailored to be identical to the parent RB-SiC parts.The advantages of the SiC materials are expected to extend to the manufacture and applications of space/ground-based large aperture photoelectric imaging systems, short wave optics for ultraviolet to soft X-ray, high power laser optics, and other precision structures such as key components in semiconductor equipment. The merits brought about include the system rigidity and the weight lessening, and the improvement of the system sensitivity and reliability, thanks to the high specific stiffness, excellent thermal stability, high resistance to abrasion, and corrosion of the SiC ceramics.Conclusions and ProspectsThe pressureless sintered SiC, reaction sintered SiC, and CVC SiC ceramics exhibit advantages in the optomechanical system manufacture due to their thermal mechanical comprehensive properties. To further promote the application of silicon carbide in precision engineering, it is necessary to develop new fabrication methods such as additive manufacture of SiC ceramics, and advanced SiC joint technologies for the innovative structural forms within an acceptable cost space. The improvements of the material microstructures and the properties from micro to macro scale via technical breakthrough are needed in advanced material forming, densification sintering, connection technologies, and applied technologies.
SignificanceInverse Compton scattering (ICS) sources can generate high-energy radiation and have significant applications in various fields. In traditional ICS light sources, the electron beams are primarily sourced from storage rings. Storage rings provide high repetition rate electron beams, operate stably, and allow for multiple collisions with lasers, making it easier to achieve higher photon flux and enhance the average γ-ray flux. However, storage ring-based ICS devices cannot produce radiation with short duration, limiting their applications in ultrafast processes. In addition to storage ring electron accelerators, there are linear electron accelerators capable of providing high-brightness electron beams at high average currents. In recent years, with the continuous advancement of ultra-intense and ultra-short laser technology, ICS devices combining linear electron accelerators with ultra-intense and ultra-short lasers have begun to emerge. For example, the under-construction ELI-NP facility is based on this design and can generate X/γ-rays with shorter pulse widths, making it a highly promising source for ultra-short gamma radiation.However, both storage ring-based ICS devices and linear accelerator-based ones are costly. Furthermore, their bulky size limits their applications, particularly in desktop radiation sources. The progress in ultra-intense and ultra-short laser technology has propelled the development of laser plasma accelerators, especially laser Wakefield accelerators. Laser plasma accelerators offer a three-order-of-magnitude increase in acceleration gradient compared to traditional accelerators, significantly reducing the size of accelerators. Laser plasma accelerators open up a new technological pathway for high-energy radiation sources. Using electron beams generated by laser plasma accelerators for ICS enables all-optical inverse Compton scattering sources (AOCSs).The AOCS promotes the desktop applications of radiation sources and reduces their cost. Another prominent advantage of AOCSs compared to traditional accelerator-based ICS devices is their ability to generate higher brightness and ultra-short pulse γ-rays. The novel AOCSs, with their unique advantages such as high energy, high peak brightness, small source size, and quasi-monochromatic characteristics, have now become a crucial tool in many cutting-edge scientific fields. While significant progress has been made in AOCSs, there are still some challenges. We provide insights for future designs by summarizing past developments.ProgressThe ICS sources have made significant progress in generating high brightness, high-energy, quasi-monochromatic radiation, etc. The current all-optical ICS experimental schemes can be classified into two categories based on the source of scattering beams. One is the single beam combined with a plasma mirror approach, and the other is the dual-beam approach (Fig. 2). In the former, the scattering laser is derived from the driving laser reflected by a plasma mirror, while in the latter, the scattering laser comes from a separate laser source.AOCS is particularly suitable for generating high-brightness radiation. In 2012, the research team at the Laboratoire d'Optique Appliquée in France first employed the single-beam approach combined with a plasma mirror to achieve self-synchronized ICS, resulting in X-rays with energies of approximately 100 keV, a total photon count of 1×10⁸, and a brightness of 1×10²¹ photon·s-1·mm-2·mrad-2 per 0.1% BW (bandwidth). In 2014, Sarri et al. reported experimental evidence of nonlinear relativistic Thomson scattering (TS) in dual-beam and head-on propagation conditions, resulting in peak brightness of γ-ray exceeding 1.8×10²⁰ photon·s-1·mm-2·mrad-2 per 0.1% BW at 15 MeV. In 2016, the research team at the Shanghai Institute of Optics and Fine Mechanics, the Chinese Academy of Sciences, used a self-synchronized all-optical Compton scattering scheme to produce quasi-monochromatic and ultra-bright MeV γ-rays, with a brightness of 3×10²² photon·s-1·mm-2·mrad-2 per 0.1% BW. In 2022, a research team from Peking University obtained radiation with an estimated brightness of up to 1022 photon·s-1·mm-2·mrad-2 per 0.1% BW at 10 MeV.AOCS is also well-suited for producing high-energy radiation. In 2014, Liu et al. produced gamma photons with energies exceeding 9 MeV. In 2017, Yan et al. employed the dual-beam approach, utilizing ultra-intense lasers [a0(the magnitude of the normalized vector potential of the incident laser field)~12] and high-order (n>500) multiphoton ICS with electron beams to achieve γ-rays with a critical energy of approximately 27.9 MeV. In 2018, Cole et al. also used the dual-beam all-optical ICS approach with high-intensity lasers (a0~24.7) to collide with electron beams, resulting in γ-rays with critical energies exceeding 30 MeV. Due to the requirement for narrow-bandwidth X/γ rays in multiple application fields, researchers have focused on optimizing the monochromaticity of radiation. In 2014, Powers et al. reported tunable quasi-monochromatic X-rays with energies ranging from 70 to 1000 keV by varying the electron energies. In 2015, Khrennikov et al. achieved tunable quasi-monochromatic X-rays with energies ranging from 5 to 42 keV by controlling electron energies. Additionally, generating high photon yields in radiation is crucial. In 2019, Lemos et al. employed a scheme involving direct laser acceleration of electrons, followed by collision with a plasma mirror-reflecting high-energy electron beam, to obtain X-rays with energies ranging from 80 to 250 keV and photon counts of up to 1011.From the radiation parameters obtained in recent years of all-optical ICS experiments, it is evident that source sizes can reach the micrometer scale, and photon energies cover the range from tens of keV to tens of MeV. Photon yields range from 107 to 1011, and brightness can reach 1022 photon·s-1·mm-2·mrad-2 per 0.1% BW. Consequently, AOCS stand out in terms of brightness, spatial distribution, and photon flux, possessing unique advantages in various application domains. We summarize the design approach and outline relevant applications (Figs. 5 and 6) to serve as future application goals for the design of ICSs.Conclusions and ProspectsCompared to traditional ICS devices, AOCSs offer several key advantages: smaller size, lower cost, excellent spatial and temporal characteristics, and higher brightness. Therefore, AOCSs hold significant value for various applications. While AOCSs show great promise, they are currently in the experimental exploration and development phase and have not yet been widely deployed in large-scale projects. Enhancing the photon quality of AOCSs to meet application requirements remains a pressing challenge for research teams. Furthermore, some unique features of AOCSs are still waiting to be fully explored and exploited. If these issues can be addressed, AOCSs will bring new opportunities to the development of multiple fields.
ObjectiveThe formation mechanism of colors can be divided into two types: chemical color and structural color. Structural color, also known as physical color, is a visual effect produced by the interaction between light and the microstructure inside the material. Compared with chemical colors, structural colors have been widely studied and paid attention to by researchers due to their advantages such as resistance to photobleaching, low-temperature sensitivity, and low pollution. Tunable structural colors have good application prospects in dynamic displays, optical camouflage, and other fields, becoming a research hotspot that researchers are committed to breaking through. Self-assembled technology is an important means to achieve the structural color of photonic crystals, which is achieved by assembling monodisperse organic or inorganic particles into ordered colloidal crystals to obtain the structural color in the visible light region. Responsive photonic crystals adjust the structural color by changing the lattice spacing of photonic crystals. This method has the advantages of convenient tuning and wide tuning range and has achieved many distinctive application effects in experiments. Researchers usually prepare particles of various sizes and then test the structural colors to select particles of appropriate sizes. Although good experimental results have been achieved, this method of particle selection somewhat lacks guidance and is time-consuming and labor-intensive. A high-precision theoretical prediction model is required to guide the design of particle material and structural parameters, as well as the optimization range of tunable range.MethodsAfter summarizing typical experimental measurement data and theoretical calculation data of self-assembled structural colors that have been reported, we compare and analyze the errors between the measured and calculated results. We propose a finite element method prediction model based on face centered cubic three-dimensional photonic crystals. In addition, we study the effects of parameters such as the refractive index of nanoparticles, solvent refractive index, particle diameter, and particle spacing on reflection spectra. Based on the predicted model, Fe3O4@SiO2 nanoparticles of optimized size and an electrically-tuned device are prepared. The central wavelength of the reflection spectrum of the device is tested and compared with the finite element method prediction model for verification.Results and DiscussionsThe calculation results of the finite element method prediction model indicate that the central wavelength of the reflection spectrum of photonic crystals red-shifts with the increase in particle refractive index and solvent refractive index. Compared with the refractive index of nanoparticles, the influence of solvent refractive index is more significant (Fig. 4). The central wavelength of the reflection spectrum of photonic crystals will red-shift with the increase in particle size (Fig. 5). The tuning range of the central wavelength of the reflection spectrum is mainly contributed by changes in longitudinal spacing, while changes in transverse spacing have a negative effect (Fig. 7). Optimized parameters are obtained by the prediction model. Nanoparticles of the optimized parameters are experimentally prepared. The tested results are well consistent with the prediction, indicating that the central wavelength of the reflection spectrum shifts in the range of 680 nm to 455 nm (Fig. 11). Compared with the analytical prediction model, our three-dimensional finite element method prediction model has higher accuracy in predicting the central wavelength of the reflection spectrum. For mono-core shell structures, the prediction error ranges of the two models are 0.49%-1.70% and 0.82%-1.49%, respectively, showing comparable performance. For core-shell structures, the prediction error ranges of the two models are 3.51%-6.11% and 0.28%-1.34%, respectively. Our three-dimensional finite element method prediction model reduces the typical prediction error value to 1/5.9 of the original value (Table 2).ConclusionsWe propose a finite element method prediction model for predicting the dynamic tuning characteristics of reflection spectra of self-assembled photonic crystal structures in colloidal systems. Based on this model, we calculate and analyze the effects of material and structural parameters on the tuning characteristics of the reflection spectrum. A set of self-assembled photonic crystals that can cover the entire visible spectral range are designed and optimized for material and structural parameters. Fe3O4@SiO2 nanoparticles are synthesized with this optimized parameter as the target, and sandwich-structure color-changing samples are prepared. The tested results are consistent with that of the finite element method prediction model in terms of the central wavelength of the reflection spectrum. Experiments show that the finite element method prediction model can accurately predict the central wavelength of the reflection spectrum of self-assembled photonic crystals in colloidal systems. The model is simple with a wide range of applications, and the typical value of prediction error is reduced to 1/5.9 of the original value. The prediction strategy based on this finite element method prediction model helps to avoid the blind synthesis of nanoparticles, shorten the development cycle, and obtain the optimal filling coefficient to ensure the implementation of a large tuning range. The improvement research of prediction models should also focus on two aspects. 1) The self-assembled photonic crystal structure in colloidal systems may have the characteristics of short-range order and long-range disorder, allowing it to obtain very little change in reflection color at different incident angles. Therefore, finite element method models with higher accuracy prediction ability should also consider introducing perturbation variables into the crystal structure sequence, to obtain a high matching degree of the central wavelength, amplitude, and spectral width of the reflection spectrum between the prepared sample and the theoretical model at different incident angles. 2) The structural perfection and size consistency of synthesized nanoparticles need to be further improved to achieve high matching with theoretical models. The color display of high contrast also requires the nanoparticles to have better ball shape and homogeneous size.
ObjectiveThe two-dimensional photonic Moiré superlattice (PMS) possesses some properties that conventional photonic crystals do not have, such as flat-band features and optical localization phenomena different from Anderson localization. We construct the two-dimensional photonic Moiré superlattice by multiple-beam interference and investigate its band structure and optical field properties via the finite element method. By optimizing the effects of square photonic Moiré superlattice flims (SPMSs) thickness and air-hole radius on its flat-band and localization properties, the structure of SPMSs with high localization properties is obtained. The square lattice is found to have an optical localization effect of quasi-Dirac cone different from that of the hexagonal lattice. Our study provides reference significance for the development of high-performance micro- and nanostructured devices.MethodsWe adopt MATLAB software to simulate the multiple-beam interference for preparing SPMSs, and add the threshold processing part in the algorithm to optimize the blurring phenomenon in the interferogram due to the uneven distribution of interfering light intensity. Then, square lattice photonic crystals and SPMSs with clearer structures can be obtained, and the sublattice air-hole radius r of the SPMSs can be controlled by changing the threshold value. The SPMSs model prepared uses perfectly matched layers and periodic boundary conditions. The eigenmodes and band structures are calculated using the finite element method. Comparative simulations are carried out by varying r and film thickness h to test whether these two parameters affect the local and flat band properties of SPMSs.ConclusionsOptical localization and flat-band properties exist in SPMSs as in HPMSs, while quasi-Dirac cone localization phenomena exist in SPMSs differently from HPMSs. The sublattice air-hole radius of SPMSs r and the film thickness h affect the localization and flat-band properties of SPMSs. Specifically, smaller values deform localized modes and reduce flat-band properties, and larger ones decrease the strength and flat-band properties of the localized central electric field, both of which have optimal values. Generally, SPMSs with γ of 4.98°, r of 127.5 nm, and h of 700 nm have higher-quality optical and flat-band properties.
ObjectiveX-ray optical components are ones applied to the X-ray range and are widely employed in synchrotron radiation, free-electron lasers, high-energy astronomical observation, laboratory X-ray detection, and other scientific instruments. Among them, X-ray multilayers are important reflective optical components. Due to the short wavelength of X-rays, the multilayer period is usually in the order of a few to several tens of nanometres. In the case that the incident angle remains unchanged, the multilayer period decreases with the wavelength of X-rays. When the multilayer period is reduced to a few nanometres, the defects such as interface width and roughness will significantly reduce the X-ray reflectivity. Therefore, high-precision film preparation techniques are essential for fabricating X-ray multilayers with small periods. Several methods including ion beam sputtering, magnetron sputtering, and atomic layer deposition (ALD) have been adopted to prepare X-ray multilayers. Compared with other techniques, ALD shows advantages in achieving highly conformal films with precise control of film thicknesses on the order of angstroms. Thus, it has great potential for preparing multilayers with small periods. We study the preparation of an X-ray multilayer with small periods by the ALD method. Based on the film types that can be prepared by ALD, we calculate the X-ray (0.154 nm) reflectivity of four multilayers which consist of HfO2/Al2O3, Ir/Al2O3, Ru/Al2O3, and W/Al2O3 respectively. We also further analyze the effects of the structural parameters of multilayers on the reflectivity including periodic thickness, duty ratios, and number of periods. Based on these results, the HfO2/Al2O3 multilayer with period of 4 nm, number of periods of 60, and duty ratio of 0.5 is designed and prepared by ALD.MethodsIn the theoretical part, we adopt the Fresnel coefficient recursion method to calculate the X-ray reflectivity of multilayers with different layer materials, periodic thickness, duty ratios, and number of periods. The influence of these parameters on the X-ray reflectivity is investigated. Based on the calculated results, the HfO2/Al2O3 X-ray multilayer with periodic thickness of 4 nm, number of periods of 60, and duty ratio of 0.5 is designed. In the experimental part, ALD is applied to achieve HfO2 and Al2O3 films. For each film, in a growth cycle, two reactants are employed as precursors and they react to form films on the substrate surface in a surface self-limiting growth mode. The film thickness is controlled by the cycle numbers. As for testing methods, ThermoFisher's Scios 2 dual-beam system is adopted to obtain a cross-section sample of the multilayer that is suitable for transmission electron microscope (TEM) observation. Meanwhile, the structure of the multilayer film is observed by JEOL JEM-2100F TEM. The X-ray reflectivity of the multilayer is tested on the Beijing synchrotron radiation 1W1A line station with an X-ray wavelength of 0.154 nm. Before the test, the multilayer is placed on a horizontal stage, and the positions of the sample stage and detector are adjusted. The data of X-ray intensity at different grazing angles are acquired and fitted by IMD software. The parameters and X-ray reflectivity of the multilayer are obtained from the fitted results accordingly.Results and DiscussionsFigure 7 shows the TEM images of the cross-section of the HfO2/Al2O3 multilayer at different magnifications. The interface between HfO2 and Al2O3 is relatively sharp. However, the thickness of HfO2 is slightly larger than that of Al2O3 in one period, which indicates that a small interdiffusion exists between the layers. The results of measured and fitted X-ray reflectivity of the HfO2/Al2O3 multilayer are shown in Fig. 8. We find that two Bragg diffraction peaks appear at 1.15° and 2.23° respectively and the widths of the diffraction peaks are small, which reveals that the film deposition rate is stable and the thicknesses of each layer in the multilayer keep almost the same. By analyzing the fitted data, the X-ray reflectivity of the multilayer film is about 43%, which is a little lower than the theoretical value. The main reasons probably are the relatively large roughness of the Si substrate and the interdiffusion between the layers. For example, the roughness of the Si substrate can be transferred to the layers accumulatively, which leads to an increase in the scattering of X-rays and a decrease in the reflectivity.ConclusionsWe study the preparation of X-ray multilayers by ALD technique. X-ray (0.154 nm) reflectivity of the multilayer in ideal conditions with different layer materials and structural parameters is calculated. Additionally, we also discuss the effects of layer materials, periodic thickness, duty ratios, and number of periods on the X-ray reflectivity in detail. The calculated results show that the X-ray reflectivity of HfO2/Al2O3 multilayer with periodic thickness of 4 nm, duty ratio of 0.5, and number of periods of 60 is 53%. On this basis, the HfO2/Al2O3 multilayer film is prepared by ALD. TEM results of the multilayer show a relatively sharp interface between the layers. X-ray reflectivity results indicate that the X-ray reflectivity of the multilayer is about 43%, which shows the great potential of the ALD method for preparing X-ray multilayers with small periods.