


Please enter the answer below before you can view the full text.
7-2=

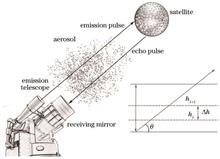
ObjectiveLaser return number is an important parameter to perform the detection ability of a satellite laser ranging (SLR) system, which is proven to be closely related to the atmospheric transmission characteristics of laser. Accurate evaluation of the laser return number in the SLR system not only provides a theoretical basis for system design and optimization but also is a key issue and primary link in the future development of SLR automation systems. In SLR system operation, the atmospheric scattering effect, atmospheric absorption effect, and atmospheric turbulence effect continuously reduce the laser energy during atmospheric channel transmission, directly affecting the size of the average laser return number in the SLR system. The influence of the atmospheric environment on photon detection becomes increasingly evident as the detection distance further increases. To effectively evaluate the average laser return number in the SLR system and explore the relationship between laser atmospheric transmission characteristics and the detection performance of the SLR system, we should analyze the atmospheric transmission characteristics of lasers.MethodsLidar atmospheric correction (LAC) model based on Mie scattering theory and actual meteorological conditions is built in our study. First, based on the tilted propagation theory of laser, the entire atmosphere transmittance at different wavelengths (450, 500, 550 nm) is calculated. Then, the average laser return number per unit time of the SLR system in different meteorological conditions is calculated, and the model is validated by the actual observation results of the 60 cm SLR system at Changchun Observatory. Finally, the effects of visibility and relative humidity on the average laser return number are analyzed.Results and DiscussionsCompared with the empirical formula adopted in conventional lidar equations, the mean average relative error of atmospheric transmittance calculated using the laser slanting revise theory decreases from 14.201% to 5.992%, which is about an order of magnitude smaller (Fig. 2 and Table 1). The calculated average laser return number per unit time of SLR system based on the LAC model exhibits good consistency with the measured data, with an average relative error of less than 15% (Fig. 4 and Table 2). The average laser return number received by the SLR system is proportional to visibility and inversely proportional to relative humidity (Figs. 5 and 6). When the elevation angle of the telescope is less than 15°, the influence of visibility and relative humidity on the average laser return number is not significantly different. When the elevation angle of the telescope is greater than 15°, the influence of visibility is slightly greater than that of relative humidity, and reaches its peak around 60° (Fig. 7). Additionally, we also find that due to the temperate continental climate of Changchun Observatory, there are significant seasonal variations in the average laser return number per unit time received by the SLR system (Fig. 8).ConclusionsAverage laser return number in SLR system is an important parameter characterizing the detection ability of the system, which is closely related to the atmospheric transmission characteristics of lasers. Based on Mie scattering theory and the actual distribution of aerosol particles, the LAC model is proposed and employed to calculate the average laser return number in the SLR system. By taking the 60 cm SLR system at Changchun Observatory as an example, the effect of climate conditions on the average laser return number in the SLR system is analyzed. The results indicate that the average laser return number in SLR system increases with the rising visibility near the surface and decreases with the increasing relative humidity. When the elevation angle of the telescope is greater than 15°, the influence of visibility is greater than that of relative humidity, and their influence reaches its peak around 60°. Our study not only elucidates the inherent mechanism by which climate conditions affect the detection performance of SLR system but also provides new theoretical solutions and technical support for SLR system site selection and performance evaluation.
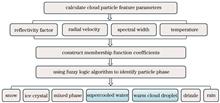
ObjectivePhase state recognition of cloud particles is an important content in cloud physics research and also significant for inverting other cloud microphysical parameters. With the development of remote sensing detection technology, researchers have developed various recognition methods of cloud phase particles, such as decision tree recognition, classic statistical decision recognition, neural networks, clustering algorithms, and fuzzy logic algorithms. However, due to the complex characteristics of cloud particles, the radar information corresponding to different particles does not have absolute features, and there may be some overlap degree. Thus, recognition algorithms based on rigid threshold conditions are not well suitable for phase recognition and classification of cloud particles. Fortunately, the fuzzy logic recognition algorithm can improve this rigid threshold defect, but the accuracy of the T-function coefficients in fuzzy logic will directly determine the accuracy of the recognition results. To accurately and finely identify cloud phase states, we propose an optimization algorithm based on fuzzy logic to recognize the phase states of cloud particles. The optimized fuzzy logic algorithm can also recognize supercooled water and warm cloud droplets compared to the original fuzzy logic algorithm which can only recognize ice crystals, snow, mixed phases, liquid cloud droplets, drizzle, and raindrops.MethodsBased on the induction and summary of a large number of aircraft and remote sensing instruments simultaneously observed data and comprehensive characteristic consideration of different cloud types, we adjust and optimize the T-function coefficients of fuzzy logic. A table of T-function coefficient parameters for different cloud phase particles is constructed as shown in Table 2. The corrected reflectivity factor, radial velocity, and spectral width detected by millimeter wave cloud radars with high spatiotemporal resolution, as well as the temperature detected by microwave radiometer, are adopted as input parameters for the optimized fuzzy logic algorithm. According to the phase recognition process of cloud particles shown in Fig. 1, snow, ice, mixed phase, supercooled water, warm cloud droplets, drizzle, and rain in cloud particles can be identified.Results and DiscussionsThe cloud particle phase of a snowfall observed on 6 February 2022 in Xi'an is inverted to verify the effectiveness and accuracy of the optimized algorithm. Additionally, we input the parameters (corrected reflectivity factor, radial velocity, spectral width, and temperature) that can characterize the features of cloud particles in Fig. 3 into the optimized fuzzy logic algorithm, and obtain the phase recognition results of cloud particles shown in Fig. 5. The cloud phase distribution in Fig. 5 (near the ground area, at a height of about 200 m) is highly consistent with the particle phase changes recorded by the ground precipitation phenomenon meter. Meanwhile, we also compare the recognition results of the optimized fuzzy logic algorithm (Fig. 5) with the original fuzzy logic algorithm (Fig. 4) and find that the optimized algorithm can identify supercooled water that cannot be recognized by the original algorithm, which is beneficial for explaining the particle phase transformation process and precipitation mechanism research in clouds.ConclusionsWe propose an optimized fuzzy logic algorithm by optimizing the asymmetric T-function coefficients and considering the effects of reflectivity factor attenuation and temperature on the accuracy of recognition results. The corrected reflectivity factor, radial velocity, spectral width, and spatiotemporal continuous temperature detected by the microwave radiometer are leveraged as input parameters for the optimized fuzzy logic algorithm. The optimized algorithm can accurately identify snow, ice, mixed phase, supercooled water, warm cloud droplets, drizzle, and rain particles in clouds, which would help study and invert cloud microscopic parameters.
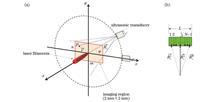
ObjectiveFilament refers to a plasma channel with high laser intensity and high plasma density formed by the propagation of intense femtosecond laser pulses in a transparent medium. Several literatures have shown that the cross-section image of an optical filament at a specific z usually contains abundant structural information such as filament diameter, length, and energy distribution, which is of great significance for the visualization study of the dynamic process of filament formation. Moreover, accurate acquisition of the spatial structure and energy deposition distribution of femtosecond optical filaments are also of great significance for the development of filamentation-based atmospheric applications. Nevertheless, it is also the inherent parameter most difficult to measure directly. To solve the problem, we introduce a new medical imaging method named photoacoustic tomography (PAT) for optical filament cross-section imaging. The feasibility of reconstructing monofilament and multifilament images by photoacoustic tomography is verified theoretically. Moreover, we also study the influence of the performance parameters of the ultrasonic transducers on the optical filament image reconstruction.MethodsWe adopt a forward simulation model based on the photoacoustic wave equation to simulate the acquisition process of ultrasonic signals induced by optical filaments in air. A circular-scanning-based PAT system is considered to obtain the cross-section image of the laser filament. To simplify the problem, we assume that the initial heat source distribution of the optical filament satisfies the Gaussian distribution form, which can represent both the small high-energy core of the optical filament and its weak background energy region with a larger range. Based on experimental measurements, the initial maximum energy deposition density is assumed to be in the order of 10 mJ/cm3, and the diameter of the heat source is assumed to be in the order of 100 μm. The simulated time series of the acoustic signal is then applied to reconstruct the transverse distribution of femtosecond laser filaments with delay and sum (DAS) algorithm. Moreover, we also analyze the influence of performance parameters of ultrasonic transducers such as center frequency, bandwidth, surface size, and detection surface sensitivity on the reconstruction of filament cross-sectional images. The back-projection amplitude distribution profile along the y-axis is leveraged to compare the effect of image reconstruction.Results and DiscussionsAccording to the time series of ultrasound signals generated by monofilaments and multifilaments recorded at different detection distances, the frequency of monofilament and multifilament induced by femtosecond laser with multi-millijoule pulse energy is mainly concentrated within 4 MHz (Fig. 2). The signal spectrum of monofilament is single-peak structure, while the acoustic signal spectrum of multifilament is multi-peak structure (Fig. 2). The amplitude value of sound pressure signal decreases rapidly due to the attenuation of air. As the center of the optical filament deviates further from the scanning center, the cross-section image of the optical filament reconstructed by the back-projection (BP) algorithm and the DAS algorithm appears an obvious "elongated" phenomenon in the tangential direction (y-axis), which is the so-called "finite aperture effect" (Fig. 3). For monofilaments, the maximum energy amplitude decreases significantly with the increase in the center frequency of the transducer, which may be related to the filtering out of more low-frequency signals (Fig. 4). The same method is adopted to reconstruct the image of multifilament. It is found that the reconstructed multifilament image appears serious deformation with the multifilament center position deviating from the scanning center (Fig. 5). When x0=1.0 mm, the two monofilaments near the scanning origin side can still be distinguished, whereas the two monofilaments near the transducer side are fused and cannot be distinguished. Therefore, the secondary filaments around the multiple filaments are more susceptible to the "aperture effect" and the fuzzy deformation occurs. The fuzzy deformation effect will be more obvious when the distance becomes larger from the scanning center or the distance becomes smaller from the surface of the transducer. Therefore, compared with monofilament reconstruction, multi-filament image reconstruction is more affected by the "aperture effect". Especially, the blur deformation of the surrounding sub-filaments is more likely. In summary, the characteristics of the transducer have an obvious influence on the reconstruction of monofilament and multifilament cross-sectional images. A larger bandwidth of the transducer will cause a smaller surface diameter, a larger surface sensitivity parameter, and a better reconstruction quality of monofilament and multifilament images. The influence of the center frequency of the transducer on the optical fiber image reconstruction is very complicated. Therefore, it is necessary to select the transducer with the appropriate center frequency combined with the spectrum analysis of the acoustic signal in the actual measurement.ConclusionsWe utilize a novel medical imaging method named PAT to reconstruct cross-section images of femtosecond laser filament formed in an air medium. The results show that the acoustic signal induced by a single filament has a single-peak structure, while that induced by a multifilament has a multi-peak structure. The performance parameters of the transducer have an obvious influence on the reconstruction results. A larger bandwidth of the transducer will lead to a smaller surface diameter, a larger surface sensitivity coefficient, and a better reconstruction effect of energy deposition distribution of optical filament. Compared with monofilament, the reconstruction of the multifilament image is more susceptible to the "finite aperture effect". Our study can provide some theoretical support for the experimental measurement of the spatial deposited energy distribution of femtosecond laser filament transmission under real atmospheric conditions.
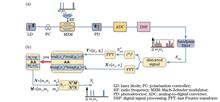
ObjectiveMicrowave photonic technology has an important potential in future high-speed microwave/millimeter-wave communication systems due to its large bandwidth, low loss, and immunity to electromagnetic interference. However, due to the inherent cosine response of the electro-optic modulators, the output signals of the broadband multi-carrier microwave photonic link (MPL) will suffer from nonlinear distortions, mainly including harmonic distortions (HD), cross-modulation distortion (XMD), and third-order intermodulation distortion (IMD3). Since HD can be filtered out by a suitable filter, the XMD and IMD3 are the main factors limiting the system performance. We build a nonlinear distortion model for in-band third-order IMD3 and out-of-band XMD compensation of a broadband MPL. Despite various optical and electrical methods are proposed to compensate for the IMD3, few methods can quickly compensate for both XMD and IMD3 of a broadband MPL spontaneously. Thus, a nonlinear distortion model is presented for compensating the in-band IMD3 and out-of-band XMD in the wideband MPL. This method does not require priori parameters of the system and signals, and a complicated training and iterative optimization process, which is more practical.MethodsWe provide a nonlinear distortion model for a broadband multi-carrier MPL. Firstly, due to large frequency differences between the HD signal and the fundamental frequency signal, the HD signal can be easily filtered by a digital filter. Then, the XMD and IMD3 signals are extracted, which are the opposite sign to the fundamental frequency signal. Thus, it is easy to obtain that the cubic power of the XMD and IMD3 signals is also the opposite sign of the fundamental frequency signal. Based on the characteristic, a cost function with a closed-form solution can be constructed, where an optimal linearization coefficient is obtained quickly and adaptively. Finally, this optimal linearization coefficient is introduced to compensate the XMD and IMD3 simultaneously in the digital domain.Results and DiscussionsSimulation experiments are built to verify the performance of XMD and IMD3 suppression. Figure 2 shows the signal spectra before and after linearization as two-tone signals are received. The XMD and IMD3 are suppressed by more than 35 dB and 29 dB respectively. The power of the fundamental frequency signal is found to remain unchanged, but the power of the XMD term increases linearly with the slope change of 2 (Fig. 3). Additionally, after compensation by the proposed algorithm, all the XMDs are suppressed below the noise and the compensation effect does not decrease with the increasing input fundamental signal power. As the power of the input fundamental signal increases, the powers of the fundamental signal and the IMD3 signal of the pre-compensation in-band signal rise linearly with slopes of 1 and 3 respectively. Meanwhile, the power of the XMD term after linearization increases linearly at a slope of 5. The spurious-free dynamic range of the compensated system is improved by more than 21.5 dB (Fig. 4). According to the simulation experiment, after algorithmic compensation, the error vector magnitudes (EVMs) of single-carrier orthogonal frequency division multiplexed signal (OFDM) and multi-carrier OFDM signals are optimized by 6.1% and 5.9% respectively (Figs. 6 and 7). As multi-carrier OFDM signals with different Vpp are input (Fig. 8), the best compensation effect is at 1 V, and the EVM is optimized by 7.2%.ConclusionsA nonlinear distortion model is presented for the XMD and IMD3 generated in a broadband multi-carrier MPL. Then based on the characteristic that the XMD and IMD3 signals have the opposite sign to that of the fundamental frequency signals, the out-of-band XMD and the in-band IMD3 can be suppressed. Compared with the traditional XMD and IMD3 compensation methods, this method does not require priori parameters of the system and signals, and a complicated training and iterative optimization process. Simulation results show that the XMD and IMD3 are suppressed by more than 35 dB and 29 dB respectively, and the spurious-free dynamic range is improved by about 22 dB as the multi-tone signal is transmitted. When a multi-carrier OFDM signal is transmitted, the EVM of the signal is optimized from 8.1% to 2.2%.
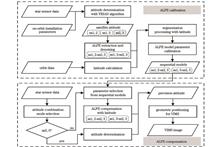
ObjectiveThe GaoFen-5B (GF-5B) satellite launched on September 7, 2021 can achieve comprehensive atmosphere and land observation. The visual and infrared multispectral sensor (VIMS) of the GF-5B satellite can obtain imagery data in 12 spectral bands from visible light to long wavelength infrared. With the advantages of a high signal-to-noise ratio and the ability of day and night observation, the imagery of visual and infrared multispectral sensors is widely applied to land degradation monitoring, crop growth analysis, and thermal pollution detection. GF-5B is equipped with three star sensors as the attitude measurement system to achieve high-precision attitude determination and geometric positioning. Among these star sensors, star sensors 2 and 3 have better measurement accuracy and stability performance and are often employed as conventional attitude determination modes to calculate satellite attitude parameters. However, owing to factors such as sunlight exposure and insufficient star number, there are only star sensors 1 and 2 or star sensors 1 and 3 working simultaneously to determine the satellite attitude parameters, which are named unconventional attitude determination modes. Due to the spatial thermal environment changes of satellites, the body structure and installation structure of the attitude measurement load undergo thermoelastic deformation, which causes attitude low frequency error related to the satellite orbit period. This seriously affects the consistency of attitude determination results between conventional and unconventional attitude determination modes and the stability of the geometric positioning accuracy of the image without ground control points. Therefore, we propose an improvement method of geometric positioning accuracy for visual and infrared multispectral imagery based on spatiotemporal compensation of attitude low frequency error.MethodsBased on the optical axis angle of star sensors, the spatiotemporal characteristics of low frequency error of star sensors are analyzed in 181 d for the GF-5B satellite. The median filtering denoising processing with the sliding window is applied to separate the low frequency error and the random error between conventional and unconventional attitude determination modes. Then, due to the complex local spatial locations, the attitude low frequency error between conventional and unconventional attitude determination modes is segmented based on satellite latitude position information. According to the spatial characteristics of attitude low frequency error, the low frequency error between conventional and unconventional attitude determination modes is calibrated in each position interval using the Fourier series model with the input parameter of satellite position latitude. For solving the drift problem of attitude low frequency error over time, we propose the sequential temporal models of low frequency error to ensure high-precision low frequency error compensation. In the attitude low frequency error compensation, the compensation model of attitude low frequency error of the unconventional attitude determination mode is selected among the sequential temporal models with the input parameter of sampling time. Then, the compensation parameter of attitude low frequency error is calculated using the Fourier series model with the input parameter of latitude position.Results and DiscussionsEmploying the experimental data of visual and infrared multispectral sensors, we analyze the calibration accuracy of attitude low frequency error, compensation accuracy of attitude low frequency error, and geometric positioning accuracy of visual and infrared images. For the calibration accuracy of attitude low frequency error, the model errors along yaw angle, roll angle, and pitch angle calibrated by the proposed method are 0.178″, 0.095″, and 0.131″ respectively (Table 3). Meanwhile, the model errors along yaw angle, roll angle, and pitch angle calibrated by the global Fourier series model are 4.155″, 2.200″, and 6.173″ respectively (Table 4). The proposed attitude low frequency error model can achieve high-precision modeling with sub angular second level and is better than the global Fourier series model. Furthermore, the geometric positioning accuracy of images of visual and infrared sensors is optimized from 4.274 pixel to 1.867 pixel (Tables 6 and 7). Before attitude low frequency error compensation, the cross-track errors fluctuate between 1 pixel and 4 pixel, and the along-track errors fluctuate between 2 pixel and 10 pixel, which makes the geometric positioning accuracy change between 40 m and 200 m (Fig. 7). After attitude low frequency error compensation, the geometric positioning accuracy of each image is significantly improved, with the cross-track error and along-track error less than 2 pixel (Figs. 7 and 8). Additionally, the proposed method can achieve high-precision geometric positioning accuracy for the images at different time and areas.ConclusionsTo improve the geometric positioning accuracy of the visual and infrared multispectral sensor of the GF-5B satellite, we put forward an attitude low frequency error compensation method based on the spatiotemporal characteristics. The spatiotemporal characteristics of attitude low frequency error within 181 d are comprehensively analyzed, and then a compensation strategy with time sequence and multi-spatial models is proposed. Additionally, we execute slowequential calibration with certain time intervals to eliminate the drift problem of low frequency error over time and build a compensation model with the input parameter of latitude position to compensate for the spatial differences of low frequency error. The low frequency error characteristics between conventional and unconventional attitude determination modes are unified by the proposed method. This method improves the geometric positioning accuracy of visual and infrared multispectral sensors of the GF-5B satellite with different imaging time and imaging areas.
ObjectiveThe output of the FY-3B satellite's medium resolution spectral imager (MERSI) visible on-board calibration (VOC) degrades with time, which causes concerns regarding its reliability in absolute radiometric calibration. The users must distinguish between the uncertainties determined by the VOC system's radiometric output and the MERSI detectors since this will lead to a detailed temporal evolution comprehension of the MERSI system and VOC radiometric characteristics. Additionally, this can ensure the remote sensing data are fully calibrated and utilized in the observed target study. We aim to investigate the output variation of the MERSI VOC system and have made special efforts to extract the information variations of VOC radiometric performance. The annual degradation rates which are defined as the percentage difference between the results of the first and last measurements of each year are employed to evaluate the VOC radiometric performance. The results are evaluated against the trap detector monitoring to further validate the proposed proceeding approach.MethodsBased on the characteristics of the satellite orbit and the structures of the MERSI VOC, we introduce a novel methodology to assess changes in the VOC system's radiometric output, with a particular focus on analyzing the relationship between the sunlight calibration opportunities and the angles of solar zenith and solar azimuth. Then we screen out the sunlight-based calibration data from multiple light sources (interior lamps, sunlight, space view background) calibration data. The analysis is to provide perspectives on the comparative radiometric performance of MERSI. Meanwhile, the majority band response seems to follow a somewhat downward trend. Subsequently, the performed relative response characterization step employs an exponential function created via least-squares fitting of the VOC data. High-quality MODIS data are leveraged to develop a top-of-atmosphere (TOA) bidirectional reflectance distribution function (BRDF) model and thus enhance the study precision. The time series of TOA reflectance acquired by BRDF model fitting is compared with that measured by MODIS, with the time series of BRDF modeling residuals analyzed. This model is consequently utilized in cross-calibration processing with nearly 10 years' worth of on-orbit data from MERSI. Cross-calibration processes include spectral matching between the two distinct sensors, viewing geometry correcting, and spectral interpolation. Additionally, the TOA reflectance is further converted to calibration coefficients using a calibration equation with zenith angle, azimuth angle, digital counts, and earth-sun distance. This is to comprehensively evaluate MERSI's absolute radiometric performance, and the relative and absolute radiometric characteristics of MERSI are standardized based on the initial regression point. This standardization treats the normalized difference as an indicator of the decay in VOC radiometric performance.Results and DiscussionsRecent studies using analysis of the MERSI sensor response to the Libya4 pseudo-invariant site and cross-calibration with MODIS show that the FY-3B MERSI has not deteriorated as much as the sunlight-based calibration trend has suggested. The comparison of the above lifetime trends and the relative and absolute radiometric characteristics of MERSI produce a distinction estimate in the calibrations of consecutive FY-3B MERSI pairs. We conclude that the degradation effects of the VOC radiometric performance can explain the observed differences. The results illustrate that the degradation rates of VOC radiometric performance are wavelength-dependent, with an initially higher rate gradually decreasing over the years and eventually stabilizing. Notably, in the early mission stages, the shortwave outputs (below 500 nm) exhibit a substantial degradation, reaching up to 49.51%. Conversely, the decay rates at longer wavelengths (800-1000 nm) are relatively modest, remaining within 26%. In the later stages of the satellite's mission life, the decay rates for most wavelengths are approximately 0.64%, except for 412 nm, which experiences a higher rate at approximately 1.91%. For further validating the employed proceeding approach, we make a comparison of the decay in VOC radiometric performance calculated by us with that monitored by the trap detector. Since we cannot determine how the data amount that passes through the filter changes while in orbit, the radiometric performance of VOC is all normalized by the first measurement value. The results indicate that the maximum percent differences observed throughout the instrument's lifetime remain below 15% at 470 nm and 14% at 65 nm.ConclusionsA general procedure is developed and implemented to provide users with the ability to characterize the decay rate in the VOC system's radiometric output. The results demonstrate that the maximum annual decay rates (ADRs) of the short-wave output (<500 nm) range from 46%-50%, while the longer wavelengths (800-10000 nm) reveal relatively smaller changes of approximately 26%. The current procedure implementation leads to further comprehension of changes in the VOC system output. The adopted novel methodology serves as a valuable reference for extending analogous endeavors that aim at conducting on-orbit absolute radiometric calibration for other sensors.
ObjectiveThe infrared Fourier spectrometer is based on interferometric spectroscopy, which features high spectral resolution and high sensitivity. Due to the ultra-fine spectral resolution of infrared hyperspectral atmospheric detection instruments, minor errors in spectral calibration can cause radiation measurement errors. High precision spectral calibration is an important prerequisite for quantitative inversion and the application of infrared remote sensing. The spectral calibration accuracy is affected by the limited field of view and off-axis effect. The traditional method is to obtain the spectral calibration coefficient by fitting multiple spectral lines. However, for issues such as ultra-high spectral resolution and wide observation spectral bands, most spaceborne infrared hyperspectral instruments employ forward modeling methods to build instrument spectral response models and remove various spectral effects.MethodsBased on the optical field of view characteristics, we conduct spectral simulations of limited field of view and off-axis effect, and study spectral correction methods for the plane array Fourier spectrometer. Firstly, the influence of instrument line shape function (ILS) is analyzed to determine the analysis methods for different influencing factors (such as finite optical path difference, finite field of view, and off-axis effect). Next, by taking a planar circular detector as an example, the ILS function is constructed by combining the optical characteristics of the instrument itself. Then, the spectral calibration error and spectral sensitivity caused by the off-axis effect are simulated by gas absorption spectroscopy. Finally, test data of the optical field of view is obtained via slit scanning. Based on the pre-launch spectral calibration data of FY-3F/HIRAS-Ⅱ, spectral correction and calibration accuracy verification are carried out.Results and DiscussionsThe experimental results indicate that the limited field of view and off-axis effect cause the spectrum to broaden and shift to a low wavenumber direction. There is a quadratic relationship between the off-axis angle θrc and the pixel field of view angle θR and the spectral calibration accuracy. The off-axis angle is more sensitive, and its contribution to the spectral calibration accuracy is much greater than that to the pixel field of view angle. When θR =60′, the error caused by measurement accuracy of 2′ is approximately 1.3×10⁻⁶. When θrc =101.82′(-72′, 72′), the error caused by the measurement accuracy of 2′ in a certain direction is about 12×10-6. After spectral calibration and correction, the spectral calibration accuracy of the center worst pixel decreases from -24.69×10⁻⁶ to 0.54×10⁻⁶, and the edge worst pixel reduces from -513.38×10⁻⁶ to -0.15×10⁻⁶. All pixels in the three bands meet the indicator requirement of less than 7×10⁻⁶.ConclusionsBased on the characteristics of the infrared hyperspectral atmospheric detector for the FY-3F satellite, the ILS function and spectral comprehensive effect matrix are constructed. The sensitivity analysis is conducted on the spectral calibration accuracy. By adopting the simulated results of HITRAN as the standard spectral line, the spectral calibration accuracy of long-wave NH3 absorption spectral lines under different off-axis angles and pixel field of view angles is studied. There is a quadratic function relationship between the spectral calibration accuracy and the angles. The sensitivity to off-axis angles is much higher than that to the pixel field of view angles, the spectral calibration accuracy of the central pixel is -18.84×10⁻⁶, and the spectral calibration accuracy of the outermost pixel is -451×10-6. Meanwhile, the spectral calibration accuracy caused by position error and pixel size error under the existing optical field of view testing conditions is 1.3×10⁻⁶ and 12×10-6 respectively. We have studied pre-launch spectral calibration and calibration methods based on instrument optical characteristics and completed the pre-launch spectral performance evaluation of FY-3F/HIRAS-Ⅱ. After spectral correction, the maximum spectral calibration accuracy of each pixel in the three bands is 2.23×10⁻⁶, which meets the spectral calibration index requirement of 7×10⁻⁶. Additionally, our study also has guiding significance for designing and testing optical field parameters in the future and improving spectral calibration accuracy.