


Please enter the answer below before you can view the full text.
8+4=

ObjectiveSystem stability and uncertainty are the two most important indicators of a clock, which represent the fluctuation of the clock output frequency in the time domain and the possible deviation between the clock output frequency and the absolute frequency, respectively. Stability improvement can reduce the measurement error of system frequency shifts and thus decrease systematic uncertainty. At present, the factors that limit the stability of an optical lattice clock mainly include quantum projection noise and Dick noise. By extending the optical probing time (τp), the effective operating rate of the clock can be improved, and the quantum projection noise and Dick noise can be reduced at the same time. However, compared with those of a case having smaller τp (such as 100 ms), the collisional frequency shifts are in the same order of magnitude as the Rabi frequency, and the loss of particles in the excited state due to inelastic scattering is enhanced when both τp and the number of atoms are large (e.g., τp=500 ms, N=6000). At the same time, the difference in Rabi frequency between the atoms in different external states and different lattice sites also rises (inhomogeneous excitation induced by atomic temperature, atomic interactions, clock laser frequency noise, and the detuning angle between the clock laser and the lattice light). All these factors make the excitation fraction of the clock transition spectrum line decrease and the linewidth widen when τp is large and eventually lead to the stability of the clock below the corresponding Dick limit.MethodsIn this paper, based on the prototype of the 87Sr one-dimensional space optical lattice clock, we experimentally observe the influence of atomic interactions on spectral linewidth and excitation fraction and even the corresponding influence on system stability. In the experiment, we measure the Rabi spectrum of clock transition at 6000 and 2000 atoms. In the measurements, the atomic temperature is kept at 3 μK (for T is constant, the number of atoms is proportional to the atomic density). The detuning angle between the clock laser and the lattice light is 13 mrad, and the optical probing time is set as 500 ms. Additionally, the stability of the optical lattice clock at two different atomic densities (for 6000 and 2000 atoms, respectively) is measured by the interleaved self-comparison method.Results and DiscussionsThe research results of the dramatic effect of atomic interactions on the Rabi spectrum (Fig. 4) are shown. The Rabi spectrum of clock transition at the high atomic density (6000 atoms) is achieved experimentally, which has a maximum excitation fraction of 0.49 and a full width at half maximum (FWHM) of 4 Hz [Fig. 4(a)]. On the contrary, the maximum excitation fraction is 0.68, and the FWHM is 1.9 Hz under the condition of the low atomic density (2000 atoms) [Fig. 4(c)]. The results clearly demonstrate that the suppression of the excitation fraction and the broadening of the spectrum are caused by atomic interactions [Fig. 4(a) and (c)], which is coincident with the theoretical expectation. Moreover, when the clock laser resonates with the clock transition, the atoms trapped in the lattice are decreased distinctly [Fig. 4(b)]. This indicates that inelastic collisions between excited particles make a part of atoms escape from the trapping of the lattice. When the total number of atoms is reduced, the atomic loss caused by inelastic collisions is nearly not observed [Fig. 4(d)] in the experimental setup. This result also conforms to the two-body interaction theory. We also present the experimental results of the self-comparison stability at high and low atomic densities (Fig. 5). The self-comparison stability under the high-density condition is 2.6×10⁻¹⁵ (τ/s)-0.5, while it is 1×10-15 (τ/s)-0.5 under the low-density condition. The stability of the system is improved to 2.6 times by reducing the number of atoms.ConclusionsIn summary, the suppression of the excitation fraction and the broadening of the clock transition spectrum induced by atomic interactions are observed experimentally on the prototype of the 87Sr one-dimensional space optical lattice clock, and the atomic loss due to inelastic collisions is also found. The Rabi spectra are measured experimentally in the conditions of 6000 and 2000 atoms in lattice. The excitation fraction and linewidth for the large number of atoms are 0.49 and 4 Hz, and those for the small number of atoms are 0.68 and 1.9 Hz, respectively. At the same time, the atomic loss caused by inelastic collisions is also observed when the number of atoms is large. In the experiment, by measuring self-comparison stability at different atomic densities, we confirm that reducing the number of atoms to 1/3 can improve the system stability by 1.6 times. Finally, a spectrum with a linewidth of 1.9 Hz is achieved, and the self-comparison stability of the prototype of the space optical lattice clock is improved to 1×10-15 (τ/s)-0.5. The experimental results in this paper are significant for the study of the influence of many-body interactions in optical lattices on the clock transition spectrum. The measurement results of stability show that the best stability can be obtained by optimizing the atomic density of the optical lattice atomic clock.
ObjectiveCooled infrared detectors can identify targets in complex environments through the temperature difference between the target and the background environment. However, the actual performance of infrared detectors is easily affected by the environment and their stray radiation. Stray light can affect the signal-to-noise ratio (SNR) of the detectors and imaging quality. For a large-format infrared detector, the large size of the detector chip corresponds to a larger cold shield installation interface and a higher height of the cold shield, and then there will be some problems, such as an increase in the mass and volume of the detector and a larger temperature gradient of the cold shield, which pose challenges for large-format infrared detectors with high sensitivity. At present, relevant studies are all focused on the design of the baffles of cold shields, the judgment of the advantages and disadvantages of cold shields, and structure optimization methods for cold shields. There are few discussions on the design of the cold shield structure and the vent hole under different F numbers. This paper discusses the selection of cold shield height and structure for different F numbers and the optimization of the vent hole structure and proposes an optimal design idea for the cold shield structure of cooled infrared detectors.MethodsThe cold shield model of cooled infrared detectors is built by optical simulation software, and the stray light simulation analysis is carried out by using the forward ray tracing method. Combining the non-uniformity of focal plane responsivity and the maximum temperature gradient at different cold shield heights, the selection of the cold shield height at different F numbers is analyzed. Four cold shield structures with different appearance are proposed. The point source transmittance (PST) at different off-axis angles of light sources is calculated, and the selection of cold shield structures under different F numbers is analyzed. Three kinds of vent hole structures are proposed, and the effects of different vent hole structures on the heat radiation suppression inside cooled infrared detectors are analyzed.Results and DiscussionsAs the cold shield height increases, the maximum response gradient of the focal plane under cold shields with different F-numbers does not decrease uniformly, and the cold shield with small F numbers has a larger clear aperture, thereby introducing more stray radiation to the focal plane. The overall response uniformity of the focal plane is reduced. For small-clear-aperture cold shields with large F numbers, stray radiation has less effect on focal plane uniformity. Considering that the maximum response gradient of the focal plane should not exceed 25%, and the maximum temperature gradient of cold shields needs to be lower than 5 K, 25 mm is selected as the design cold shield height [Fig. 3(a)]. The PST of the cold shields of the four structures is calculated. It is found that when the F number is small, the clear aperture of the cold shields is large. At this time, the stray light suppression ability of a cold shield is determined by its structure (such as side wall inclination and maximum outer diameter). When the F number is large, the clear aperture of the cold shield is relatively small, and the width of the baffles increases. In such a case, the effect of cold shield structure on the stray light suppression ability is weakened (Fig. 5). Combined with the PST curve, the selection of cold shield structures under different F numbers is obtained (Table 2). Three vent hole structures are designed, and the vent hole structure at the top of the cold shield increases the transmission paths of internal stray radiation. The countersunk-head vent hole and the stepped vent hole structures make the incident stray radiation absorbed by the baffles and at the same time increase the number of reflections for the stray radiation entering the vent hole to reach the front of the image. The improved three vent hole structures reduce the internal stray radiation of the detector which is received by the image plane by about 87% compared with those before improvement (Fig. 7).ConclusionsThe optimal design analysis of the cold shield structure of cooled infrared detectors is carried out. Considering the non-uniformity of the focal plane responsivity and the maximum temperature difference of cold shields, this paper proposes design ideas of cold shields for large-format infrared detectors on the basis of the investigation of the stray light suppression effect under different F numbers and cold shield structures and the optimization direction of the vent hole position. The focal plane of 1280×1024 (pixel spacing is 10 μm) is taken as an example. At different stages of increasing the cold shield height, the focal plane uniformity exhibits different states (increased, decreased, and unchanged) for the cold shields with different F numbers due to the different influences of stray radiation caused by the clear aperture. The cold shield height is taken as 25 mm under the condition that the maximum response gradient of the focal plane does not exceed 25% and the maximum temperature difference requirement of cold shields is considered. Cold shields of four structures are designed, and their PST curves at F1.2, F2, F3, F4, and F5.5 are calculated. In addition, the stray light suppression effect and scheme of each cold shield structure at different F numbers are analyzed. Three optimization schemes are proposed for the vent hole position, which can completely suppress the stray radiation of the window frame from passing through the vent hole to the image plane. With the optimized vent hole structure, the stray radiation inside the detector which is received by the image plane is reduced by about 87% compared to that before optimization. The design idea proposed in this paper has guiding significance for the optimal design of the cold shield structure of cooled infrared detectors.
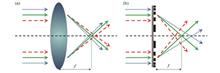
ObjectiveTraditional refractive lenses usually have a large thickness, thus limiting their application in some small optical systems. Diffraction lenses have a much smaller thickness than refractive lenses, so they are mostly employed in lightweight systems. Diffraction lenses, however, are usually designed to operate in a single band, which makes them more chromatic than refractive lenses. In fact, the chromatic difference of traditional refractive lenses is usually only determined by the material dispersion, while that of diffraction lenses is mainly caused by the change of diffraction angle on the microstructure of different positions. The angle is directly proportional to the wavelength of the incident light, and the dispersion caused by the change is much stronger than the material dispersion. At present, most achromatic diffraction lens technologies are characterized by complex structures and difficult processing. Therefore, designing an achromatic diffraction lens with simple structure and easy processing is the key to widely employing diffraction lenses.MethodsThis paper proposes a design method of multi-wavelength diffraction lens (MDL). The spectral point spread function (PSF) of a series of wavelengths is almost identical via adjusting and optimizing the distribution of diffraction microstructure on the plane substrate. This method can balance the PSF distribution of each wavelength, and reduce the color difference and complexity of the wideband imaging system. It provides a new idea for the application and development of diffraction imaging systems. The heights of diffraction lens microstructure are discretized and are assumed to be invariant over a width interval. An objective function is constructed to describe the sum of the deviations between the complex transmission function of MDL and the complex transmission function of DOE at each operating wavelength, and then the microstructure height that minimizes the objective function is found. The process is repeated on the whole surface of the lens, and the weight of each wavelength in the evaluation function is adjusted according to the simulation results. To verify the feasibility of the design method, this paper designs an MDL with three wavelengths and four steps combined with the existing processing conditions. The scalar diffraction theory is employed for simulation analysis and comparison with DOE. The design parameters are shown in Table 1.Results and DiscussionsThe simulation results show that MDL has the expected achromatic performance. DOE only has a sharp crest in its designed band, while in the other two bands, it almost does not respond or is diffused. A lot of noise is generated in the whole image plane, which leads to declined overall image quality. MDL has relatively sharp wave peaks in the three bands designed by MDL, and the response of the three bands in the image plane is relatively consistent, which will not produce a lot of noise in the image plane and can effectively reduce the color difference generated during the diffraction lens imaging, indicating that MDL has a certain achromatic ability. Half-peak full width (FWHM) is the peak width at half of the normalized light intensity. Compared with that of DOE, the minimum FWHM of MDL is slightly increased, but the overall performance is more balanced, and the mean square error of FWHM is only 0.0053 (Fig. 5). The spot size of MDL is also consistent at different wavelengths and has good imaging effects when the three wavelengths are incident together (Fig. 6). MDL sacrifices the diffraction efficiency of a certain band in exchange for improving the diffraction efficiency of the other bands. MTF of MDL in small field of view has little change, which reflects that MDL has certain anti-interference ability in small field of view (Fig. 8). When the three wavelengths are incident together, the diffraction efficiency of MDL is significantly higher than that of DOE (Fig. 9). The MDL is optimized for the bandwidth of the light source, and the achromatic performance of the optimized MDL is significantly improved under a certain bandwidth (Fig. 10). In terms of processing feasibility, the designed lens meets the processing conditions of multi-mask lithography.ConclusionsThis paper proposes a design method of diffraction lens that can work in multiple wavelengths simultaneously and designs a four-step MDL for simulation analysis. The results show that it can balance the imaging effect at multiple wavelengths. By comparison between PSF and MTF of DOE, the essence of MDL is found to sacrifice the imaging quality of one band to exchange the imaging quality of the other bands by regulating the surface microstructure distribution. The diffraction efficiency of MDL is also calculated, and the results show that the diffraction efficiency of MDL is higher than that of DOE when multiple wavelengths are incident together. Considering that there is no single wavelength of light in practical application, the MDL is optimized to have a good achromatic effect even under the light source with a certain bandwidth. Finally, the processing feasibility of MDL is analyzed, and the results show that it meets the existing processing conditions, thereby ensuring the feasibility of MDL in practical application.
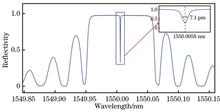
ObjectiveIn geophysical, marine science, oil and gas well detection, aircraft structure health monitoring, and other application scenarios, the sensor is required to have small size, high resolution, and robust against harsh environments and electromagnetic interference. Especially in underground and deep-sea observation scenarios, the temperature sensor should be equipped with remote monitoring ability and temperature resolution of milli Celsius level. In these scenarios, electronic temperature sensors are difficult to meet the requirements due to their limitations, and fiber grating-based temperature sensors have the advantages of high resolution, large dynamic measurement range, and multiplexing sensing capability. This paper proposes a high-resolution multiplexed temperature sensing system based on optical fiber grating, which adopts the phase-shifted fiber Bragg gratings with different center wavelengths utilizing wavelength division multiplexing technology as the temperature sensing unit. The resonant wavelength of each optical fiber grating is detected by sweeping laser wavelength, and a hydrogen cyanide absorption chamber is introduced as the wavelength reference. An unbalanced Mach-Zehnder interferometer is employed to compensate for the nonlinearity in the wavelength sweeping of the laser to improve the wavelength measurement accuracy. In the experiment, the simultaneous detection of ten temperature sensing heads is achieved with a temperature resolution of 10-4 ℃ and measurement range of 0-100 ℃. This fiber grating temperature sensing system has a broad application prospect in the fields which require high-resolution temperature measurement.MethodsThis study puts forward a high-precision multiplexed temperature sensing system based on fiber grating. The swept laser is divided into four paths after the coupler. The first path is the probe light for sensor heads, which enters the sensing grating array by wavelength division multiplexer. The second path is directly connected to the detector, which is utilized to compensate for the power fluctuation of the swept light source. The third path is connected to the unbalanced MZI interferometer, which compensates for the sweeping nonlinearity of the light source. The fourth path passes through an HCN gas absorption chamber, which provides an absolute frequency reference for the laser. The spectrum of the phase-shifted fiber Bragg grating is recorded, and then a cross-correlation operation is carried out to detect the spectrum movement of the grating. The offset of the correction peak indicates the frequency movement of the fiber grating caused by the temperature change, and then the current temperature of the environment is obtained based on the temperature sensitivity coefficient and the initial frequency of the fiber grating. The sensing fiber grating is packaged with metallization to improve the temperature sensitivity in this study. The fiber grating is enclosed in a capillary copper tube. The thermal expansion coefficient of the capillary copper tube is larger than the fiber grating, so the fiber grating is subjected to additional strain caused by the thermal expansion of the copper tube, which increases the shift of the resonant frequency. Finally, a handle structure is designed to reduce external vibration interference and protect the fiber grating.Results and DiscussionsThe linearity between wavelength and temperature is verified, and the temperature sensitivity coefficient of the encapsulated grating is calculated to be 22.335 pm/℃ (Fig. 3), about twice the original sensitivity coefficient of unpackaged fiber grating. The sensor array is placed in an oil bath for temperature measurement, and the whole system can realize a temperature measurement range from 0 ℃ to 100 ℃. The sensing probe multiplexing scale reaches ten (Fig. 6). The system employs a comparison with the theoretical value to verify its temperature resolution. The sensing probe is placed in water to measure the natural cooling of water for 3000 s. The measured temperature basically follows the exponential decay form. The time window of 60 s is chosen to perform the first-order exponential fitting, and the standard deviation of the residuals is (Fig. 8), indicating that the temperature resolution of the system reaches10-4 ℃.ConclusionsThis paper proposes a temperature sensing system of high-resolution wavelength division multiplexed fiber grating based on a swept laser, which contains four main optical paths. One path is to probe the sensing probe array, and the other three paths are employed for the power compensation of the swept laser, the compensation of the laser swept nonlinearity, and the calibration of the absolute frequency of the laser. The encapsulation of fiber grating is studied to improve the temperature sensitivity, and a metalized encapsulation structure for the fiber grating is designed to increase the temperature sensitivity of fiber grating. In the demonstrational experiment, a temperature measurement range of 0-100 ℃ is achieved through an oil bath, and the number of sensor multiplexing scales reaches ten. Based on the comparison between the theoretical and measured temperatures of water, a temperature resolution better than 10-4 ℃ is verified.
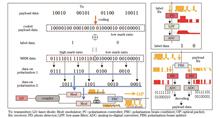
ObjectiveDue to the rapid growth of packet-based traffic and data exchange in networks and data centers, the demand for optical packet switching is higher and higher. Traditional electrical switching adopts the form of optical-electric-optical switching, which has serious problems of electronic bottlenecks and high-power consumption and thus can hardly meet the growth demand of switching networks. Optical label switching transfers information exchange from the electrical domain to the optical domain, which improves the exchange rate and boasts high speed, transparency, low costs, large bandwidth, and low power consumption. Optical label switching is an effective solution to optical packet switching. It separates the label from the payload so that only the label is read at intermediate nodes without the need to detect the payload. At each node, part of the power of the optical packet is first extracted to the low-speed receiver for label detection. If the packet has the same destination address as the node, the packet is sent to the payload receiver. Otherwise, the packet is forwarded directly without being handled over any other layers. Optical label switching minimizes the overhead of packets and simplifies network control and management. As a result, the efficiency, scalability, and throughput are improved, especially in networks with numerous intermediate nodes. It is expected that modified mark ratio modulation can be helpful for optical label switching.MethodsMark ratio modulation is proposed in the paper. Firstly, the payload data is coded a new 5b8b code with a low mark ratio. Then, the coded payload data is combined with low-speed label data by XOR operation. After that, eight-bit cells are of a high or low mark ratio when the label bit is "one" or "zero", respectively. The label data is superimposed by mark ratio modulation. Subsequently, the mark-ratio-modulated data is divided into two sequences for the following polarization division multiplexing. The first four bits in each eight-bit cell are assigned to one sequence, and the last four bits are assigned to the other one. The two sequences are amplitude shift keying (ASK) modulated onto two optical carriers as two optical signals, which are polarization division multiplexed as an optical packet and transmitted. When an optical packet arrives at a node, part of the power is drawn into a low-speed receiver for label information receiving. The polarization-division-multiplexed optical signals are directly converted to an electrical signal by a photodetector without polarization beam splitting. When the packet has the same address as the node, the packet is sent to the payload receiver. In the payload receiver, the two optical signals on two polarizations are separated by a polarization beam splitter. The two optical signals are detected and analog-to-digital converted. Finally, the converted two sets of data are combined and decoded to recover the original payload data.Results and DiscussionsAfter the low-pass filter, the waveforms of the mark ratio modulation show that the high-mark-ratio sections and low-mark-ratio sections are converted to high levels and low levels, respectively. The mark ratio difference is converted to the amplitude difference. The mark ratio information corresponding to the label data is converted to the ASK signal (Fig. 3). In the first row of tested eye diagrams, the recovered label signal shows better performance when the bit rate ratio is lower as it suffers from lower crosstalk from the coded payload signals. In the second and third rows, the performance of mark-ratio-modulated signals on two polarizations is almost the same under different bit rate ratios. The coded payload signals suffer from no crosstalk from the overlaid label signal (Fig. 4). In addition, the bit error rate (BER) curves of the mark-ratio-modulated signals are almost coincident with different rates on overlaid label signals. The label signal with a higher bit rate shows worse performance due to the higher crosstalk from the coded payload signals (Fig. 5). The receiving sensitivity of the label is improved compared with that of the 4PPM code before the improvement. The BER of the payload does not change much. The modified mark ratio modulation maintains the advantages of 4PPM mark ratio modulation (Fig. 6).ConclusionsModified mark ratio modulation is proposed for optical label switching. The code for payload data is changed to a novel 5b8b code, whose code efficiency is increased to 62.5%. The high-speed payload data is coded in 5b8b code and combined with low-speed label data by XOR operation. Then, the combined data is divided into two sequences. The two sequences are ASK modulated on two optical carriers that will be polarization-division-multiplexed. The overlaid label signal is recovered directly through a low-speed ASK receiver, which removes the high-speed coded payload signal. Label receiving requires no decoding or polarization separation, which has a low cost and low operation complexity. The modified mark ratio modulation maintains the advantages of mark ratio modulation while increasing the effective bit rate of the payload data to 125% of the transmission rate, 250% of the previous value. Optical label switching based on modified mark ratio modulation is demonstrated by simulation. The transmission bit rate is set to 40 Gbit/s so that the effective bit rate of the payload data reaches 50 Gbit/s. The label data is set to 10.00 Gbit/s, 5.00 Gbit/s, 2.50 Gbit/s, and 1.25 Gbit/s separately. The signals in the modified mark ratio modulation can all achieve error-free operation. The label signal of a higher bit rate suffers from higher crosstalk. The test results show that the optical packet with the bit rate of 40 Gbit/s (the effective bit rate of the payload is 50 Gbit/s) can travel almost 60 km even without in-line amplifying and pre-amplifying. The simulations verify the feasibility of the proposed modified mark ratio modulation-based optical label switching. An experimental demonstration will be given next to verify the proposal.
ObjectiveStranded fiber optic cables are widely used in telecommunications, sensing, industrial monitoring, and other fields. The research on the three-dimensional shape reconstruction algorithm of stranded fiber optic cables is of great significance for cable maintenance, breakpoint positioning, building settlement monitoring, deformation sensing, etc. To obtain the shape and position information of optical cables, most of the current methods are based on manual calibration. Such methods are time-consuming, labor-intensive, inefficient, greatly affected by the cable laying environment, and difficult to implement, and the reconstruction result is rough. To solve the above problems, researchers have proposed corresponding solutions using different distributed strain measurement technologies combined with the "strain-deformation" model. However, these solutions are all based on the structure of multi-core parallel optical cables, and the original model is no longer applicable to the spiral structure of stranded fiber optic cables. Therefore, we propose a space curve reconstruction method based on stranded fiber optic cables. The strain along the optical cable is simulated, and the improved "strain-deformation" model makes it suitable for stranded fiber optic cables.MethodsThe space curve reconstruction method based on the stranded fiber optic cable proposed in this paper includes four processes. First, the model of the stranded fiber optic cable is simplified into a spiral structure, and the stranded fiber optic cable is generated on the software SOLIDWORKS with the space curve to be reconstructed as the central axis. In addition, the discrete strain values are simulated for the outer core of the optical cable according to the physical meaning of the strain. Second, the improved "strain-deformation" model is used to convert the discrete strain values into the curvature and torsion of the corresponding points on the curve. Third, the curvature and torsion of the curve are taken as the input values of the Frenet frame. The differential equation of Frenet is inversely solved, and the curve is reconstructed. The comparison of the coordinate error between the reconstructed curve and the real curve verifies that the proposed method is effective. Finally, some parameters in the model are adjusted, such as the sampling density of strain points, as well as the helix radius and the bending radius of the curve to be reconstructed, and the rule and scope of application of this method are discussed.Results and DiscussionsResearchers focus more on the optimization of the "strain-deformation" model to avoid the usage of expensive strain measurement means. According to the physical meaning of the strain and the software SOLIDWORKS, a strain simulation method is designed (Fig. 2). In addition, the "strain-deformation" model is improved according to the characteristics of the stranded fiber optic cable (Fig. 6), and the improved model accurately solves the direction angle and torsion of the curve (Fig. 7). Then, the curvature and torsion obtained are taken as the input of the Frenet frame to construct the curve, and the maximum curve reconstruction error is 2.1% (Fig. 8). The reconstruction effect of the same curve before and after the model improvement is compared to further reflect the superiority of the improved model. The maximum reconstruction error before the model improvement is 102%, while that after the model improvement is only 2.1%. This shows that the model before the improvement cannot be used for the curve reconstruction of the stranded fiber optic cable because it cannot accurately solve the torsion of the curve (Fig. 10). Finally, some parameters in the "strain-deformation" model are adjusted, and the factors affecting the reconstruction accuracy of this method are discussed (Figs. 11, 12, and 13). The experimental results shows that the most influential factor is the sampling density of strain points. When the strain point spacing changes from 10 mm to 20 mm, the reconstruction error will increase from 2.1% to 18.6%. The helix radius and the bending radius of the curve to be reconstructed have the least impact. When the variation of the helix radius is between 3 mm and 9 mm, the variation range of the maximum reconstruction error is 0.6%. When the bending radius of the curve changes between 50 mm and 400 mm, the variation range of the maximum reconstruction error is 0.75%.ConclusionsIn this paper, a space-curve reconstruction method based on stranded fiber optic cables is presented. The effectiveness of this method for space curve reconstruction is preliminarily verified by simulation. Then, the influence of some super parameters on the method is studied. The results show that the method is most affected by the sampling density of strain points but less affected by the helix radius and the bending radius of the curve. For a 300 mm-long stranded fiber optic cable, the best reconstruction effect can be achieved when it is equally divided into 30 sections, and the maximum reconstruction error is 2.1%. Compared with the existing shape reconstruction methods, the proposed method simulates the strain in the software SOLIDWORKS, which can make researchers focus more on the optimization of the curve reconstruction model and greatly reduce the cost of strain measurement means. Then, according to the characteristics of the stranded fiber optic cable, the "strain-deformation" model is improved so that the torsion of the curve is not affected by the spiral structure. Finally, on the basis of the proposed method, the factors that affect reconstruction accuracy are discussed. The applicability and robustness of the curve reconstruction method can be expanded with a higher sampling density of strain points.
ObjectiveSince the 1980s, optical fiber communication technology has gone through the development process of time division multiplexing (TDM), wavelength division multiplexing (WDM), polarization division multiplexing (PDM), and quadrature amplitude modulation (QAM). The transmission rate and capacity of the optical communication network are constantly improving, and the system capacity is gradually approaching the Shannon limit. In recent years, for the sake of effectively breaking through this capacity limitation, space division multiplexing (SDM) technology has attracted great attention. For example, the mode division multiplexing (MDM) technology makes it possible to simultaneously propagate several spatial modes in a few-mode fiber (FMF), which thereby greatly improves the fiber capacity. Few-mode erbium-doped fiber amplifiers (FM-EDFAs) can amplify multiple spatial modes at the same time for extending the transmission distance of MDM signals and help to greatly reduce the cost of MDM systems. The combination of the MDM technology and WDM-based optical transport network (OTN) can greatly alleviate the increasing bandwidth pressure. At the same time, dual-polarization quadrature phase shift keying (DP-QPSK) or QAM formats have been widely used in coherent communication systems. The amplification and transmission of dual-polarization signals in free-space FM-EDFAs have been reported in some references. Up to now, few papers have reported the amplification and transmission results of high-speed dual-polarization signals in all-fiber FM-EDFAs. Therefore, it is also worthwhile and practical to investigate the amplification and transmission performance of the dual-polarization signals in all-fiber FM-EDFAs.MethodsThis paper aims to experimentally study the amplification and transmission performance of high-speed DP-QPSK MDM signals in an all-fiber FM-EDFA. For this purpose, we build up a 100 Gbit/s DP-QPSK MDM system, including an MDM transmitter unit, the FM-EDFA, and an MDM receiver unit (Fig. 1). The MDM transmitter unit is composed of several commercial OTN optical transmitters (TXs), a serial of variable optical attenuators (VOAs), a mode-selective photonic lantern (MSPL), and a few-mode polarization controller (FMPC). The all-fiber FM-EDFA is developed from two homemade few-mode isolated wavelength division multiplexers (FM-IWDMs) and a section of few-mode erbium-doped fiber (FM-EDF) (Fig. 2). Two co-propagating LP11a and LP11b modes as pump lasers are excited at 1480 nm by another MSPL. The MDM signals are amplified by the FM-EDFA and then are input to the MDM receiver unit for mode demultiplexing and coherent reception. The MDM receiver unit is composed of an FMPC, an MSPL, a serial of wavelength-selective switches (WSSs), and multiple OTN optical receivers (RXs). To measure the amplification of the DP-QPSK MDM signals, this study employs the wavelength mapping method to calculate the modal gain with an optical spectrum analyzer (OSA).Results and DiscussionsFirstly, the modal gain and noise figure of the FM-EDFA are tested (Fig. 3). When the pump power of each mode is 24.5 dBm, the minimum differential modal gain (DMG) of 1.27 dB is obtained. With the pump power of each mode increasing to 29.2 dBm, the average modal gain and the DMG are up to 21 dB and 1.97 dB, respectively. Secondly, we test the receiver sensitivity curves of each channel with and without the FM-EDFA (Fig. 4). Compared with the MDM system without the FM-EDFA, the one with the FM-EDFA shows that the receiver sensitivities of LP01, LP11a, and LP11b channels are degraded by 0.55 dB, 1.47 dB, and 0.99 dB, respectively. The polarization-dependent loss (PDL) of each channel is also measured. In the MDM system with the FM-EDFA, the PDL of each channel is also raised to some degree. Finally, the influence of DMG on the sensitivity equalization is studied in the amplification experiment of two modes (LP01 and LP11b), in which the DMG is changed by adjusting the pump power (Fig. 6). It is found that the channel sensitivity equalization is independent of the DMG, and the channel sensitivity degradation is related to the amplified spontaneous emission (ASE) noise and the PDL from the FM-EDFA.ConclusionsIn this paper, an amplification and transmission system is built up for 100 Gbit/s DP-QPSK MDM signals, which mainly includes the transceiver units of MDM signals and the all-fiber FM-EDFA with FM-IWDMs. According to the amplification and transmission experiment for three modes of LP01, LP11a, and LP11b, it is shown that the receiver sensitivity of each channel at the bit error rate of 10-2 is, respectively, degraded by 0.55 dB, 1.47 dB, and 0.99 dB due to the introduction of the FM-EDFA. The influence of DMG on sensitivity equalization is also studied in the amplification experiment of two modes (LP01 and LP11b), and there is no direct correlation between them. However, the DMG will affect the optical power margin of each channel. The conclusions can provide a reference for MDM amplification and transmission of dual-polarization signals.
ObjectiveHolographic near-eye displays (NEDs) have attracted ever-increasing attention in recent years. Through wavefront modulation of the incident beam by the spatial light modulator (SLM), a holographic NED can achieve multiple functions that are not within the reach of conventional two-dimensional (2D) displays, such as controlling the depth of the displayed image and dynamically correcting the aberration. However, due to the limited space-bandwidth product of the SLM, the etendue of the entire system is small, leading to a long-standing trade-off between the field of view (FOV) and the eyebox. For example, Microsoft reported at the SIGGRAPH conference in 2017 that they had achieved a FOV of 80°, but the eyebox was small. Two main types of methods have been proposed to expand the eyebox, i.e., active methods and passive methods. The active methods utilize a pupil-tracking system and move the eyebox subject to the position of the user's eye. Their energy efficiency can be high, contributing to lower power consumption of the system, longer battery life, and simpler thermal design. However, the main challenge for achieving high immersion in augmented reality (AR) use cases is low motion-to-photon latency, which is more difficult to obtain when the process of eye-tracking is incorporated. The passive solutions generally provide multiple discrete eyebox points simultaneously to expand the entire eyebox. However, they are exposed to the risk that no or two eyebox points may enter the pupil at a certain position as the user's eye moves. In such a case, missing of fields, low brightness uniformity, or ghost artifact occurs. In this paper, a holographic NED system with an expanded eyebox based on a surface relief grating (SRG) waveguide is investigated, showcasing a continuously and two-dimensionally expanded eyebox.MethodsIn the calculation of holograms, the angular spectrum method (ASM) and the stochastic gradient descent (SGD) algorithm are adopted because they can provide much better image quality than that offered by the traditional Gerchberg-Saxton (GS) algorithm. This advantage is confirmed by the comparison result of the peak signal-to-noise ratio (PSNR). To increase the etendue of the holographic NED, this paper utilizes a waveguide incorporating an in-coupling grating and a 2D surface relief out-coupling grating. The beam width corresponding to each image point in the holographic image is expanded two-dimensionally and continuously, and a two-dimensionally expanded eyebox is thereby obtained. Furthermore, the influence of pupil expansion on holographic display is assessed. By calculating the optical path difference between adjacent out-coupling beams, the paper finds that the angular period of the interference pattern is too small to be observed, and its impact on image quality is thus negligible.Results and discussionsAn experimental prototype (Fig. 6) is built to verify the effectiveness of the investigated system. Firstly, the display performance of the system on a monochromatic image verifies that the fine details of the resolution pattern can be reconstructed (Fig. 7). Then, the system's capability of displaying color images is demonstrated. Since the principle of the system's display of color images is time-division multiplexing, the monochromatic images of three colors are acquired independently and then synthesized (Fig. 8). The color image looks reasonably well despite a certain amount of stray light. Next, the paper verifies the aim of the 2D expansion of the eyebox. The baseline case without the waveguide is assessed first. The results (Fig. 9) reveal that when the eye relief is 20 mm, only a small part of the target image can be captured at each position within the range of 4 mm×4 mm. In contrast, when the waveguide is added to the system, the entire image can be observed across an eyebox range of 8 mm×6 mm (Fig. 10). In this range, 15 points are sampled continuously and uniformly, with the horizontal sampling points located at 0, ±2 mm, ±4 mm and the vertical sampling points at 0, ±3 mm, respectively. Furthermore, an AR display test (Fig. 11) is conducted, and the results demonstrate that the user can observe virtual and real scenes simultaneously. After that, the stray light and uniformity of the system are discussed. The stray light in the upper part of the displayed image is mainly due to the scattering at the defects on the waveguide and the higher energy of the beam transmitting in the waveguide in the upper part. A uniformity of 39.47% is obtained by evaluating the average grayscale of nine points uniformly sampled in the display area. Finally, the possibility of displaying 3D scenes is discussed.ConclusionsTo mitigate the challenge of obtaining a sufficiently large eyebox under a proper FOV for holographic NEDs, this paper investigates a holographic NED system with an expanded eyebox. A waveguide incorporating a 2D surface relief out-coupling grating is utilized to expand the beam width of the holographic image two-dimensionally and continuously. Experiments confirm that when the eye relief is 20 mm and the FOV is 38.6°, an eyebox of 8 mm×6 mm can be obtained. The problem of the incompetence of the FOV is thereby effectively mitigated. In the follow-up work, research will be conducted on deep learning-based computer-generated holography (CGH) algorithms, which can provide suitable pre-compensation of phase for the image coupled into the waveguide, to achieve the high-quality reconstruction of 2D and three-dimensional (3D) scenes.
ObjectiveCascaded double-phase encoding (CDPE) is an optical cryptosystem, and it comprises two phase-only masks (ciphertext mask and key mask). Among optical cryptosystems, CDPE is of great importance due to its superiority in security. Its ciphertext is a phase-only mask whose content cannot be directly read out by the intensity-sensitive device such as the charge-coupled device (CCD) or human eyes. Although there is already published research on CDPE, few of them focus on simultaneous compression and encryption. In this paper, we propose a novel iterative encryption algorithm (IEA) to achieve double-image encryption in CDPE, which employs the position of the key mask as a controllable parameter. Compared with that of the traditional CDPE, the encryption capacity of the proposed algorithm has been substantially improved. The proposed algorithm opens up a new way for simultaneous compression and encryption in CDPE, and it may offer new inspiration for the design of other cryptosystems.MethodsThe optical architecture for decryption in this paper comprises two phase-only masks (ciphertext mask and key mask). Parallel monochromatic light is employed for illumination. The positions of the ciphertext mask and the output plane are fixed during decryption. Two positions along the axis are specified for the key mask. When the key mask locates respectively at these positions, two distinct plaintexts can be individually generated at the output plane. Essentially, the decryption employs two different optical architectures which differ only in the position of the key mask. According to the decryption principle, an IEA is proposed to encrypt the two plaintexts into the ciphertext mask. The IEA requires parallel iteration in the two optical architectures. For each architecture, the light wave virtually illuminates the scheme and finally reaches the output plane after being modulated by the two phase-only masks. At the output plane, the amplitude of the wavefront is replaced with the plaintext. The renewed wavefront at the output plane then propagates back to the input plane and forms a complex amplitude. The two complex amplitudes from the two architectures are superposed and then phase-reserved to obtain a new estimation of the ciphertext mask. The first iteration completes after the update of the ciphertext mask, and then the second iteration begins. The iteration will continue until the decrypted plaintexts at the output plane sufficiently approximate the original ones.Results and DiscussionsFirst, we validate the effectiveness of the proposed algorithm with binary images in the simulation context of MATLAB R2016a. The proposed IEA shows excellent convergence, and it terminates after 238 iterations. Both the subjective and objective metrics indicate the high quality of decrypted plaintexts (Fig. 3), which verifies the effectiveness of the proposed algorithm. Second, we analyze the key space created by each of the secret keys, including the wavelength, axial distances, and key mask. The key space of the proposed algorithm is as large as 2104856, which is robust enough to resist brute-force attacks. Third, we investigate the condition for successful multiplexing. The results show that a minimum position interval of 2 mm of the key mask is required (Fig. 7), and an interval exceeding this value will cause obvious cross-talk noise in the decrypted images. Fourth, we verify the proposed algorithm with grayscale images and successfully extend it to multiple-image encryption (Fig. 8 and Fig. 9). The corresponding results show that the quality of the decrypted images decays with the image number for multiplexing. Therefore, there must be a compromise between the encryption capacity and the quality of decryption. Fifth, we test the robustness of the proposed algorithm against noise attacks, and the results show that the ciphertext can still ensure high-quality decryption in spite of severe contamination (Fig. 10). Sixth, we analyze the robustness of the proposed algorithm to cryptoanalysis. It is found that a chosen-plaintext attack (CPA) based on the G-S algorithm fails to crack the proposed algorithm (Fig. 11). Seventh, we further demonstrate the effectiveness of the proposed algorithm with experimental results (Fig. 13 and Fig. 14), which highly agree with the simulated ones.ConclusionsIn this paper, a double-image encryption method based on position-multiplexing in the CDPE system is proposed. A new IEA is presented to encrypt two plaintext images into a single phase-only mask (ciphertext mask). Compared with that of the traditional CDPE, the encryption capacity of this method is doubled. For decryption, the key mask is placed respectively at two preset axial positions, and two different plaintext images can be individually obtained at the same output plane. In addition, for successful position multiplexing to avoid crosstalk, the distance between the two axial positions of the key mask must be greater than a certain value. The security analysis shows that the proposed algorithm has a huge key space that is enough to resist brute-force attacks. Furthermore, the G-S algorithm is adopted to provide a CPA to the proposed algorithm, and the results show that the proposed algorithm is robust to the CPA. In addition, the feasibility of extending the proposed algorithm to multiple-image encryption is proven, which indicates that the encryption efficiency of CDPE systems can be further enhanced.
ObjectiveX-ray Fourier-transform ghost imaging (XFGI) is a new imaging technology that has emerged in recent years. Unlike traditional X-ray imaging, the resolution limit of this imaging method is theoretically limited only by the X-ray wavelength, which makes it possible to obtain higher spatial resolution than real-space imaging. Moreover, the phase information of the sample can also be obtained by this technique, which is of great significance for the imaging of weakly absorbing biological samples. However, the current FGI experiments mainly utilize transmissive pseudo-thermal light sources. The longitudinal size of the speckle generated by the transmissive source is too large, which limits the longitudinal resolution of imaging. Meanwhile, the luminous flux of transmissive pseudo-thermal light is low, which makes it difficult to carry out three-dimensional FGI. In contrast, the reflection method can provide more room for design and adjustment, allowing the longitudinal size of the speckle to be reduced. Furthermore, grazing incidence can be used to increase the reflected light flux and hence improve imaging quality. Therefore, the three-dimensional characteristics of the speckle field of the reflective pseudo-thermal light source are studied in hope of guiding and improving the light source system of three-dimensional FGI and thereby enhancing the longitudinal imaging resolution.MethodsAccording to the Fresnel diffraction theory, the position of the pending sample is taken as the observation position, and the correlation function of the intensity fluctuation of the speckle field emitted by the scattering screen is derived. The speckle size is defined as the full width at half maximum of the speckle field. The longitudinal speckle size of speckle fields emitted by scattering screens at different spatial positions and inclination angles is discussed. Then, the numerical simulation based on statistical optics is carried out in the visible light region. Through the simulation, the light-field intensity distribution of the speckle field is obtained, and the normalized light intensity fluctuation correlation function between the observation position and its adjacent area under the ensemble average is calculated to verify the theoretical results. Moreover, various factors affecting the longitudinal speckle size at the observation position of the speckle field are analyzed, such as the size of the scattering screen, propagation distance, scattering angle, and azimuth angle. Finally, for high-resolution three-dimensional XFGI, the longitudinal speckle size of the grazing-incidence silicon scattering screen reflective pseudo-thermal light source is also considered.Results and DiscussionsFrom the point of view of statistical optics, the longitudinal speckle size of speckle fields emitted by scattering screens at different spatial positions and inclination angles is given, which is consistent with the numerical simulation results under the ensemble average (Fig. 3). In the visible light region, the influence of various factors on the longitudinal speckle size at the observation position is discussed and numerically simulated (Fig. 4). The longitudinal speckle size can be effectively reduced by the following four strategies, i.e., increasing the size of the scattering screen, increasing the azimuth angle of the scattering screen, shortening the propagation distance, and reducing the scattering angle. In the end, the longitudinal speckle size at the observation position is decreased to less than 100 nm under the rational design of the spatial position and inclination angles of the silicon scattering screen in the X-ray region. When the wavelength of the incident light wave is 0.1 nm, the size of the silicon scattering screen is 20 mm, the incident angle and the scattering angle are both 89.86°, the azimuth angle of the scattering screen is 20°, and the propagation distance is 20 mm, the longitudinal speckle size at the observation position can reach 79.31 nm, and the lateral speckle size can reach 28.94 nm (Fig. 5) .ConclusionsIn this paper, the second-order statistical characteristics of the speckle field generated by the reflective pseudo-thermal light source are studied, and the intensity fluctuation correlation function of the speckle field of the reflective pseudo-thermal light source is theoretically derived. In addition, the longitudinal speckle size of the scattering screen placed at different spatial positions and inclination angles is given. The numerical simulation results based on the statistical optics are consistent with the theoretical results. The results show that the size, spatial position, and tilt state of the scattering screen will affect the speckle size at the observation position. The size of the speckle decreases with both the incident light wave's wavelength and the propagation distance. The size of the projection scattering screen in the scattering direction can be increased, which will reduce the size of speckles under a larger scattering screen and a smaller scattering angle. Moreover, the longitudinal speckle size decreases with the increasing azimuth of the scattering screen and changes abruptly at small angles since the speckle size along the scattering path is significantly bigger than that in other directions. Finally, the longitudinal speckle size of the reflective pseudo-thermal light source under different parameters is given in the X-ray region. The longitudinal speckle size at the observation position can be effectively reduced to less than 100 nm under the rational design of the spatial position and inclination angle of the scattering screen. In this way, the longitudinal resolution of imaging can be improved, which is of great significance for the development of three-dimensional FGI.
ObjectiveThe reconstruction of a three-dimensional flame structure mainly includes multi-view measurement and unidirectional optical path measurement methods. As for the former, the number of cameras needs to be increased for the spatial resolution improvement of test results. However, it is not suitable for reconstructing a three-dimensional flame field in a burner due to the constraint of limited test space, which refers to the light occlusion by the burner wall. On the contrary, the latter is immune to testable space limitations and has remarkable advantages in diagnosing a three-dimensional flame structure by means of tomography based on light field imaging. Traditional light field imaging is achieved with the aid of a liquid zoom lens or a micro-lens array, which can reconstruct the three-dimensional field by refocusing different objects from one projection. The focused surface of the liquid lens can be changed easily by adjusting the voltage, which is helpful to get refocused images. But the temporal resolution of this operation is so insufficient that it is not applicable to highly dynamic flames. The position and direction information of a three-dimensional flame field can also be reconstructed by acquiring refocused images with a micro-lens array. However, the existing light field imaging method based on a micro-lens array processes images by data calculation, which leads to the compatible problem of temporal and spatial resolution. Therefore, it is not applicable to a highly dynamic flame environment with temporal-spatial heterogeneity. It is necessary to establish a three-dimensional reconstruction method with high temporal and spatial resolution for dynamic flame.MethodsIn this paper, the multi-camera common-optical-path imaging method is proposed to characterize the temporal and spatial resolution characteristics of flame by tomography. In the optical imaging path structure, cascaded optical splitters are used to allocate light energy to different detection channels, and cameras are placed at each detection channel for light collection. By a synchronous controller, cameras are driven to focus on different sections of the transient flame at the same time. On the basis of Fourier optics theory, the defocused mapping relationship between a spatial object and an image of the optical tomography system is established by convolution, and the spontaneous emission characteristics at different sections of flame are numerically analyzed by the deconvolution algorithm. When light radiation passes from the interior to the surface of flame, light attenuation properties corresponding to the divided flame sections are different. The attenuated light intensity needs to be further compensated for each section. Here, the attenuation is calculated by comparing the recorded image of a light spot passing through flame with that when only a light spot is present. According to the distance between each focused section and the flame edge along the main optical axis of the imaging system, different energy compensation on tomographic images is carried out to obtain the real radiation characteristics of each section.Results and DiscussionsThe results show that the focused images of different flame sections can be captured by different cameras simultaneously and independently (Fig. 9), which improves the temporal resolution greatly and realizes the high spatial resolution test of dynamic flame at the same time. The performance of the tomographic imaging system is verified by reconstructing the three-dimensional combustion flame of carbon oxides and propane-butane mixed combustion flame. The spatial evolution characteristics of flame are analyzed by observing different sections of flame at the same time (Fig. 12 and Fig. 15), and the temporal evolution characteristics of flame can be analyzed by comparing the changes of gray values at different time in the same position (Fig. 13 and Fig. 16). The reconstructed flame structure is unevenly distributed in space, and the section near the flame center is brighter than that at the edge. The flame varies quickly in a short time, which is consistent with the temporal and spatial resolution characteristics of flame. In addition, combustion is also related to the contact area between flame and air as well as the spatial distribution of fuel. For the combustion of carbon oxides, the flame is brighter where the fuel gathers (Fig. 11), and the propane-butane mixed combustion flame is brighter where the air contact area is larger (Fig. 14). This difference is because fuels used in these two experiments are solid and gas, respectively. The flame brightness distribution of solid fuel combustion depends on the spatial distribution of the fuel, while that of gas fuel combustion is related to the contact area with air.ConclusionsThis paper proposes a method of multi-camera common-optical-path flame tomography using cascaded optical splitters based on unidirectional optical path projection. It is verified that the proposed method can reconstruct a three-dimensional flame structure effectively by the tomography of the combustion flame of carbon oxides and propane-butane mixed combustion flame. Compared with the light field tomography method based on a micro-lens array, the method in this paper has improved compatibility between time and space detection, which can be used to diagnose the temporal and spatial evolution characteristics of dynamic combustion flame structure. The proposed system can be potentially applied to a more highly dynamic and unevenly distributed combustion field environment by improving camera configuration.
ObjectiveA ghost imaging (GI) system, as a new-type imaging system different from traditional imaging systems, has gained much attention and shown its imaging capabilities in related fields. GI is an imaging mode that requires computational reconstruction to obtain image information. For this type of imaging mode, the uncertainty of the retrieved image information cannot be obtained by direct measurement and is related to the specific reconstruction algorithm. Therefore, relevant research on error uncertainty analysis is required. Existing studies mostly give reconstruction error distributions corresponding to the intensity correlation algorithms. For algorithms of other types, it is hard to obtain a theoretical result since there is no explicit formula for the reconstructed information, and studies on related estimation methods have not been reported. Although there are some theoretical results about the reconstruction error of compressed sensing (CS) algorithms, they cannot be directly applied to the uncertainty estimation of GI, since there are differences between the speckle patterns in GI and the measurement matrix used in the CS theoretical derivation. In this study, we use the Bootstrap method to estimate the uncertainty of image information reconstruction. Bootstrap technology can effectively give the uncertainty estimation map of the entire reconstructed image in practical imaging scenarios where the theoretical expression cannot be given, and there is no original image for reference. It is expected that the proposed method can contribute to estimating the uncertainty map of image reconstruction with different reconstruction algorithms in practical GI systems.MethodsIn GI, detection signals Iti in the object arm and Iri(rr) in the reference arm are used together to retrieve the image information T(rr). There are various reconstruction algorithms, and they can be all expressed as Eq. (1). In this study, the uncertainty of the reconstructed T^(rr) is estimated, and the Bootstrap method is applied. The Bootstrap method is a technique in statistical analysis, and its core idea is to use the original sample of size n as a pseudo-population for resampling. Its steps are as follows. First, the computer is used to generate random numbers, and Bootstrap samples (y1*,y2*,?,yB*) of size n are independently drawn. Second, for each Bootstrap sample yb*, the corresponding parameter estimation is calculated, which results in a set of estimators T^b*, b=1,2,?,B. Third, the standard deviation of T^b* is calculated by using Eq. (3) to approximately estimate the standard error of T^. Finally, the approximate confidence interval at a confidence level of 1-α can be obtained by using the Bootstrap-t method. In thermal-source GI, the observed signals obtained by each sampling are mutually independent and identically distributed due to the random fluctuation characteristics of thermal light. Therefore, if each sampled signal Iri,Iti is considered as a sample, the obtained data Iri,Iti (i is from 1 to n) from a total number of n actual samplings are independent and identically distributed samples. Taking the data as the original sample and considering the reconstruction results T^(rr)=fIr(rr),It as the estimator, the uncertainty and confidence interval of the reconstructed image can be described by the non-parametric Bootstrap method.Results and DiscussionsTo verify the effectiveness of the Bootstrap method, we first apply it to estimate the standard error of the reconstructed image from the intensity correlation algorithm, and a theoretical formula has been derived. The imaging target is selected as a hole with Gaussian distribution transmittance [Fig. 2(a)]. The result is shown in Fig. 3. It can be seen that the standard error map estimated by the Bootstrap method is highly consistent with the theoretical one. They have backgrounds of almost the same level. The difference in the region around the peak is mostly due to the statistical fluctuation in the estimation, but the estimated error map still has characteristics that the error of the central region is higher than that of the surrounding regions. Then, we use Bootstrap to estimate the result reconstructed from the CS algorithm. Specifically, the two-step iterative shrinkage thresholding (TwIST) algorithm with total variation regularization is used for reconstruction here. The result is shown in Fig. 4. It can be seen that the estimated standard error map is well correlated with the true absolute error map, and they have similar characteristics. In addition, a map that shows a confidence interval of 99% is shown in Fig. 4(b). In order to more accurately and quantitatively give the error distribution map, the bias and absolute error of the CS algorithm are estimated via the corresponding Bootstrap variants. Specifically, quantities in Eqs. (11) and (12) are estimated, and the result is shown in Fig. (5). It can be seen that the estimated bias and absolute error maps are consistent with the true ones in both the shape and the specific values. This shows that the proposed estimation can give a quantitative description of the reconstructed error map.ConclusionsWe propose to apply the non-parametric Bootstrap method to estimate the uncertainty of GI image information reconstruction. Simulation results show that the estimated standard error of the intensity correlation algorithm by Bootstrap is consistent with the theoretical one, which illustrates the reliability of the Bootstrap method in estimating the standard error of the GI algorithm. Furthermore, the Bootstrap method has been applied to estimate the uncertainty of the CS-based reconstruction. The TwIST algorithm is taken as an example, and the standard error map of the reconstructed image information is estimated, which has well demonstrated the confidence level of the reconstructed result in different positions of the target image. In addition, the bias and absolute error of the reconstructed T^ are estimated with the corresponding Bootstrap variant, which demonstrates that the Bootstrap results can quantitatively describe the image information error of the original sample reconstruction. Our research provides an effective solution for estimating the uncertainty of the reconstruction algorithms of GI, which is especially suitable for cases where there is no real reference image, and an explicit expression cannot be given. Subsequent work is applying the Bootstrap method to estimate the uncertainty of other reconstruction algorithms (e.g., deep neural network algorithm) of GI.
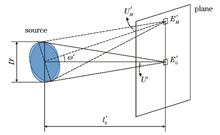
ObjectiveBeam scanning has been widely used in laser radar and optical communications. Conventional beam scanning methods with mechanical structures suffer from many limitations, such as large volumes, low switching speeds, and high powers. Optical phased array is a new technique that enables beam scanning, and phase modulator components used in optical phased array scanning technology mainly include liquid crystal, optical waveguide, electro-optical crystal, microlens array, and micromirror array. Electro-optical scanning device has some problems, such as low response speed, high driving voltage, and difficult large-aperture beam scanning. The scanning technology with a microlens array has the advantages of simple structure, miniaturization, lightweight, high scanning speed, and large aperture. Scanning imaging optical system with a microlens array includes microlens array elements, and the rays do not fill the clear aperture of the microlens array owing to the effect of scanning angle and microlens array structure. One property of the microlens array system is that the wavefront exiting the microlens array is no longer continuous, and the motion of the microlens array results in non-rotational symmetry of the system, which brings new challenges to the traditional design methods and performance evaluation of optical systems. In this paper, a preliminary theoretical study is conducted on the performance and imaging models of imaging optical systems based on optical phased array scanning technology with a microlens array, which can benefit the design and evaluation of microlens array systems.MethodsThe scanning imaging optical system with a microlens array is a combined optical system, and the scanning function is accomplished by the motion of the microlens array. Firstly, the performance of the system is affected by the discontinuity and periodicity of the beam passing through the pupil, and the fill factor is adopted in this study to characterize the fill rate of rays at the pupil position of the microlens array system. The effect of the fill rate of the beam at the entrance pupil position on the detection distance of the system is analyzed according to the formula of the detection distance of the point target of the optical system in the infrared environment, and that at the exit pupil position on the point spread function and the modulation transfer function of the system are analyzed according to the information optics theory. Secondly, the paraxial optical model of a scanning optical system with a microlens array is constructed, and a calculation method of the fill factor based on the paraxial optical model is proposed. The effect of the system structure parameters on the fill factor is analyzed, and a design method of the scanning optical system with a microlens array is proposed based on the calculation method. Finally, a scanning imaging optical system with a microlens array is designed by using the proposed design method, and the design result verifies the theoretical analysis and design method.Results and DiscussionsSeveral important results are obtained as follows. Firstly, the detection distance simulation results (Fig. 2) show that appropriately increasing the effective entrance pupil area is beneficial to increase the detection distance of the system. The point spread function of the scanning optical system with a microlens array (Fig. 3) is the product of the diffractive optical intensity distribution of a single microlens unit and the fixed periodic optical intensity distribution with a grid pattern determined by the microlens array structure. The energy proportion of the zero-order principal maximum in the point spread function reduces with the decrease in αex, and more energy enters the other-order principal maxima. Therefore, the resolution of the system degrades owing to the increased diffusion of the light spot. A similar periodicity is observed in the modulation transfer function curve that does not decrease monotonically, and the reduction in the fill factor αex decreases the contrast at the middle spatial frequency. When the fill factor αex decreases to 25%, multiple zeros are observed before the true cutoff frequency, which indicates that a very small fill factor can cause the microlens array system to lose a part of the object information in the middle frequencies. Secondly, the effects of different parameters on the fill factor are analyzed. The results show that the system scanning angle and detection distance are mutually constrained, and increasing the scanning angle needs to be accomplished by reducing the detection distance [Fig. 6 (b)]. Increasing the value of In [Fig. 6(a)] and decreasing the value of Ig1 [Fig. 6(c)] are beneficial to increase the fill factor of the system. Finally, an optical system consisting of two square microlens arrays of 5×5 is designed, with a fill factor αen of 0.16, αex of 0.87, and scanning angle of ±4°. For a point target with a radiation intensity of 0.5 W·sr-1, the detection distance is 7.8 km when the average transmittance of the atmosphere is 0.4. The simulation results show that most energy of the point spread function of the design system is concentrated in the zero-order principal maximum, and the dispersion degree of the diffracted spot is low [Fig. 9(a)]. The contrast decreases in the middle spatial frequency of the modulation transfer function curve [Fig. 9(b)], but it is not obvious. The geometric radius of the maximum spot in the spot diagram is 4.76 μm [Fig. 9(c)], and the performance of the designed system is excellent.ConclusionsThe scanning imaging optical system with a microlens array is lightweight, and the displacement of the mechanical movements is small. The rays do not fill the clear aperture of the microlens arrays during the scanning process, which affects the detection distance and imaging resolution of the system. The fill factor is proposed for characterizing the fill rate of rays at the entrance and exit pupil positions of the microlens arrays system, and its effect on the detection distance, point spread function, and modulation transfer function are analyzed. On the basis of the paraxial optical model, a method to fast calculate the fill factor is proposed, and a scanning imaging optical system with microlens arrays is designed. The simulation results and theoretical calculations are in good agreement, and the design results show that the performance of the system is excellent. This work can benefit the design and evaluation of microlens array systems.
ObjectiveWhen the focal length of a lens is measured by the magnification method, a microscope is used to obtain a line pattern image of the Perot plate. Line pair spacing is then measured to determine the focal length of the lens and the coordinates of its focal point. Consequently, the sharpness of the line pattern image, namely, the focusing accuracy, affects the measurement accuracy of the focal length and focal coordinates of the lens. Due to its poor accuracy, inefficiency, and subjectivity, manual focusing has been gradually replaced by autofocusing. Currently, a grayscale-based evaluation function is frequently employed to determine the sharpness of a microscopic image. Although increasing the calculable directions of the evaluation function in a haphazard manner may improve the robustness of the function to some degree, it considerably prolongs the focusing time. To address the aforementioned issue, this study, starting from a line pattern's grayscale distribution, designs an evaluation function that retains favorable robustness and focusing accuracy without extending the focusing time when the angle of the line pattern varies.MethodsThe direction of the line pattern is correlated with the grayscale distribution of the line pattern's edges. Grayscale variation is not apparent in the direction along the line pattern. In contrast, the grayscale value varies drastically in the direction perpendicular to the line pattern. A larger amplitude of the grayscale operator in the evaluation function corresponds to a smaller effect of noise on the evaluation function. Consequently, obtaining the angle of the line pattern and introducing the evaluation function are applicable to the autofocusing of line patterns. Specifically, Hough transform-based line detection is performed on the first image acquired (the image with a large defocusing amount). Being highly resistant to interference, Hough transform-based line detection is able to overcome negative effects, such as edge loss due to defocusing and more precisely determine the angle of a blurred line pattern. With due consideration given to the angle of the line pattern, a Hough transform-based sharpness evaluation function for line patterns is constructed to ensure that the direction of the grayscale operator in the function is always perpendicular to that of the line pattern. The proposed function is utilized for autofocusing under various angles of the line pattern to quantitatively evaluate the performance of the evaluation function and to investigate the effect of the angle of the line pattern on the performance of the evaluation function.Results and DiscussionsTo accommodate the strong directionality and uncertain direction of the line pattern, this study presents a Hough transform-based sharpness evaluation function for line patterns without sacrificing focusing efficiency. The proposed function improves the robustness of focusing and ensures high focusing efficiency. For line patterns with different defocusing amounts, Hough transform-based line detection can obtain their angles accurately. Moreover, the deviation of the angle of the line pattern obtained is invariably smaller than 2° (Table 2), indicating that the performance of the evaluation function is essentially unaffected. For line patterns at different angles, the Hough transform-based grayscale function exhibits small fluctuations in the smooth area, strong noise immunity, and favorable stability when the image is heavily defocused (Fig. 6). Additionally, the mean of the smooth area of the evaluation curve is 0.051, and its maximum fluctuation rate is 16.60%. The standard deviation of this area is 0.037 (Tables 3-7). Near the in-focus position, the focusing error is small, and the device has high focusing accuracy (Fig. 6), with a deviation smaller than 0.1 steps from the in-focus position (Tables 3-7). The Hough transform-based grayscale function also outperforms the conventional evaluation function (Fig. 6) in that it reduces the mean of the smooth area, the standard deviation, and the focusing deviation by 59.85%, 46.05%, and 92.63%, respectively, on average. Since the function has just one gradient operator, the computational effort is saved markedly, and the average running time is reduced by as much as 36.37% (Tables 3-7). In the measurement of a lens' focal length, the relative error in the focal length is reduced by 62.12% (Table 8).ConclusionsIn this study, a Hough transform-based sharpness evaluation function for line patterns is constructed. This function can be used to accurately detect the angle of defocused line patterns by Hough transform-based line detection, and it incorporates the angle of the line pattern into the construction of the evaluation function. The grayscale operator in the evaluation function is perpendicular to the direction of the line pattern, and the grayscale value of the pixels perpendicular to the line pattern changes drastically with a large amplitude of the gradient operator. The grayscale value and distribution of the noise in the image of the line pattern are random, and the proposed evaluation function does not amplify the effect of the noise. The noise immunity is thereby enhanced. The experimental results show that the focusing accuracy and stability of the Hough transform-based grayscale function are not affected by the angle of the line pattern in the Perot plate. This function can prevent the search algorithm from falling into the trap of local extremes. Its focusing accuracy and focusing speed are also superior to those of the conventional focusing function, enabling it to meet the need for rapid and accurate focusing. In the measurement of a lens' focal length, the improvement of focusing accuracy ensures the measurement accuracy of line pair spacing, which in turn improves the measurement accuracy of focal length. As a result, the relative error in the focal length is reduced by 62.12%. The proposed Hough transform-based sharpness evaluation function for line patterns can effectively improve the accuracy and operational efficiency of autofocusing in focal length measurement. It has practical significance for images with obvious directionality, such as those in defect detection, microscopic workpiece measurement, and pathological analysis.
ObjectiveActive magnetic field diagnosis based on the Faraday rotation effect is widely used in experimental studies on magnetized plasmas. The Faraday rotation angle is correlated with both magnetic field strength and electron density, and magnetic field information can be obtained through simultaneous measurement of interferometric and polarization information. Conventional designs introduce the diagnostic beam into an interferometer and a polarimeter, respectively, which require multiple back-end recording devices. As a result, the complexity of the optical path is increased, and inter-device sensitivity calibration problems are encountered. Therefore, a compact optical path design with multiple probes incident on the same recording device is expected to be able to avoid these problems.MethodsIn response to the above needs, this paper proposes a compact polarization interferometer, which is capable of obtaining plasma interference, polarization, and shadowgraph images simultaneously on a single recording device and acquiring magnetic intensity with a single shot measurement. The polarized light enters the target chamber in parallel, and the lens system images the plasma region and relays the images to the target chamber. The prism separates two virtual images, and then the lens images the two virtual images to the CCD. A Nomarski interferometer with Wollaston prisms and polarizers is located before the CCD so that four images are obtained on a CCD, and the images involve the interference pattern containing the plasma electron density information and the polarization pattern containing the Faraday rotation angle information. The Faraday rotation angle obtained from the experimental diagnostics contains the information of the diagnostic light path integral, which cannot directly reflect the three-dimensional magnetic field structure. We calculate the plasma evolution by using magnetohydrodynamic simulation, design a ray-tracing program to simulate the behavior of diagnostic light passing through the plasma and compact polarization interferometer, and finally synthesize the line-integrated image on CCD. The reliability of the diagnostic instrumentation and numerical simulations is cross-validated by comparing the experimental diagnostic images with the numerically synthesized images.Results and DiscussionsAfter error calculation and parameter scanning, the compact polarization interferometer reaches the theoretically optimal sensitivity of 0.013°. In the solid target laser-ablation experiment, the instrument successfully diagnoses the signal of the self-generated magnetic field. The measured deflection angle is about 0.7°, and the self-generated magnetic field region is about long and wide. In addition, the electron density is about 1019 cm-3, and the estimated magnetic field strength is about 0.9×10⁶ Gs. The intensity and spatial structure of the magnetic field are in good agreement with the numerical simulation, and the images synthesized by the simulation results show characteristics similar to the experimental diagnostic images.ConclusionsThe compact polarization interferometer has successfully diagnosed self-generated magnetic fields on the order of ten Tesla at a spatial scale of several hundred microns. Numerical simulations interpret the dynamic evolution and three-dimensional structure of the magnetic field. This compact polarization interferometer is expected to reduce the risks associated with imaging device variations and the complexity of diagnostic systems and improve the efficiency of magnetic field diagnosis.
ObjectiveWith the further development of precision optical systems such as space telescopes and high-power solid-state laser devices, high-efficiency and batch processing requirements for medium- and large-aperture optical planar elements are put forward. For common deterministic polishing methods such as small tool polishing and ion beam polishing, which have high machining accuracy and positive removal effect, there are still some shortcomings such as low removal efficiency and long processing period, and thus they fail to meet the urgent needs of the market for precise optical components. The ring-pendulum double-sided polishing has been a promising method due to its high convergence rate, short processing cycle, and easy batch production. However, during the process of ring-pendulum double-sided polishing, it is difficult to establish a stable removal function to predict the surface profile due to the constant changes in the contact area between the polishing disc and the workpiece surface, which thus makes it impossible to provide sufficient guidance for the polishing process. In order to solve this problem, a prediction model for the uniformity removal of ring-pendulum double-sided polishing based on the kinematics of abrasive particles is proposed, and it can be used to analyze the element surface uniformity removal under the influence of different process parameters and provide the optimization strategy of process parameters, so as to improve the convergence efficiency and controllability of surface accuracy.MethodsA prediction model for the uniformity removal of ring-pendulum double-sided polishing based on abrasive particle kinematics is built. Firstly, the main factors influencing the removal distribution in the ring-pendulum double-sided polishing are explored according to the polishing mechanism and removal law following the Preston equation. Then the kinematic models of abrasive particles on the upper and lower surfaces of a workpiece are established respectively, in view of the differences in polishing methods between the upper and lower surfaces of the workpiece with ring-pendulum double-sided polishing. A prediction model for the uniformity removal of ring-pendulum double-sided polishing based on abrasive particle kinematics is presented, and its reliability is verified by simulation and actual machining results. Based on the machining prediction model, the distributions of removal amount and uniformity removal on the upper and lower surfaces of the workpiece are studied, and the abrasive track and the uniformity distribution of polishing removal under different polishing homogeneity influencing factors are analyzed. By changing parameters such as center eccentricity, radial swing distance, and radial swing speed, virtual machining experiments are carried out to find the mapping rules of surface removal distribution and these parameters. Finally, experiments are designed to verify that the ring-pendulum double-sided polishing uniformity removal method presented in this paper can achieve fast convergence of the surface pattern of optical elements.Results and DiscussionsThe presented prediction model of ring-pendulum double-sided polishing can reflect the mapping of process parameters to the surface profile of the workpiece. Three groups of transparent fused quartz workpieces with different initial surface shapes and process parameters are selected to verify the processing prediction model. The prediction results are basically consistent with the actual machining results, which have the same removal characteristics of the surface (Fig. 4). The results have shown that the removal amount of the lower polishing plate is about 2-3 times that of the upper polishing plate, while the degree of removal irregularity of the upper polishing plate is 3-5 times that of the lower polishing plate (Fig. 6 & Fig. 7). Through simulation analysis, it is found that changes in parameters such as center eccentricity, radial swing distance, and radial swing speed will affect the homogeneity of workpiece surface removal. Experiments are designed according to the mapping between different process parameters and workpiece surface patterns. Finally, the experimental results show that the PV of 1# workpiece is 1.28λ (λ=632.8 nm), and that of 2# workpiece is 1.05 after machining (Fig. 12).ConclusionsBased on the kinematic model of abrasive particles, a prediction model of the ring-pendulum double-sided polishing process is established. The simulation and actual machining experiments have verified that the model can correctly reflect the real machining surface profile results under different machining parameters. With the presented prediction model, the removal distributions of the upper and lower surfaces of the workpiece are studied. The simulation results show that although the removal amount of the lower surface is much larger than that of the upper surface of the workpiece, the non-uniform distribution of removal from the upper surface of the workpiece is the main source of the overall removal of the non-uniform distribution of the workpiece. By changing parameters such as center eccentricity, radial swing distance, and radial swing speed, the mapping of different process parameters to uniformity removal of the workpiece surface can be obtained, and then the purpose of even material removal of the workpiece surface can be achieved by combining the information of initial workpiece profile. The actual machining experiments show that the machining parameters are optimized under the guidance of the prediction model presented in this paper, which thus elevates the surface processing accuracy and provides a reliable solution for the machining efficiency of ring-pendulum double-sided polishing.
ObjectiveDim small target detection in infrared images with complex backgrounds is a key technology for precise guidance systems and infrared surveillance systems, and the detection performance directly determines the success or failure of tasks. As a result, it has become a hot topic, and different detection methods have been presented. Compared with traditional algorithms, deep network algorithms have achieved remarkable results in many aspects in recent years, and some frameworks designed based on existing deep networks have been applied to detect the dim small target. Although these methods can improve the detection performance of small targets by modifying the network structure because the infrared images have only information of one dimension and limited features in small targets, it is difficult to obtain satisfactory results when the deep network is directly applied to detect dim small targets in the complex infrared background, and the large network scale makes it difficult to deploy the above methods on the embedded platform with constrained resources.MethodsIn view of the characteristics of single information dimension in infrared images and inconspicuous features of dim small targets, this study enriches the information of original images and incorporates multiple filters with different structures into the YOLOv5n network. In this study, three filters with different structures, namely the Top Hat filter, difference of Gaussian filter (DoG), and mean filter, are selected from the perspective of highlighting targets, suppressing backgrounds, and filtering high-frequency noises. By introducing three heterogeneous filters to process the images in the input layer of the network, the one-dimensional gray information of the original image is expanded into three dimensions, and then they are fed to the network through three channels, which improves the adaptability of the network to dim small targets in complex backgrounds.YOLOV5n network is selected in this study and improved as follows. 1) In order to make the deep network improve the feature weight of the region of interest and suppress the response of the unrelated region during training, the lightweight convolutional block attention module (CBAM) is added to the backbone of YOLOv5n so that the extracted feature map can play a greater role in the subsequent target extraction. The output in the convolution layer first passes through the channel attention module (CAM) to improve the weight of target-related features and then through the spatial attention module (SAM), which enables the weighted feature to remain in the deeper network. 2) In the standard YOLOV5n network, target detection is carried out using the feature maps of P17, P20, and P23 layers. In the process of target extraction, targets are searched and selected through preset anchor boxes of different sizes. Since the shallow network has a feature map with a large size and contains rich original information, it is conducive to small target detection. Therefore, this study adjusts the size of the anchor in P3 layer to [5, 6, 6, 8, 9, 11], which is beneficial to small target detection. 3) The perception field of view of the shallow network is small, which is conducive to extracting the local features of the target. The deep network has a large perception field of view, which is mainly used to extract the global features of the target. For the application scenario of small target detection, the features extracted by the deep network are limited and may even interfere with the final detection results. After multi-layer feature extraction of the backbone network, the deep network almost does not contain small target features, so the standard YOLOv5n network is cropped to remove P5-P23 layers, and only P3-P17 and P4-P20 output features are used for detection. By adding attention modules, adopting small anchor strategies, and cutting deep branches of the network, the dim small target detection performance of the YOLOv5n network is improved, and the consumption of computational and storage resources is reduced.Results and DiscussionsIn order to verify the performance of the algorithm, this study selects the dim small target detection and tracking infrared dataset against the ground/air background. Multiple deep network algorithms dedicated to small target detection are selected for comparison. Furthermore, the classical target detection network algorithms which are modified for small target detection are selected. In terms of detection performance, the proposed algorithm obtains the second-highest average precision (AP) value of 0.888, which is 1.4% lower than the highest value and 3% higher than the third-highest value. In terms of network size and computational efficiency, the proposed algorithm achieves the fastest processing speed of 416 frame/s at the smallest network size (3 MB), and the network size is half that of the algorithm in Ref. [7]. Compared with the algorithm with the best detection performance, the proposed algorithm performs approximately 60 times more efficiently, and the network size is approximately 1/16. This study analyzes the performance gains of improvement measures, such as introducing multi-heterogeneous filters, adding attention modules and small anchor box strategies, and cropping deep networks. The experimental results show that the proposed algorithm can still maintain an excellent detection performance with the smallest parameter size and the highest operational efficiency.ConclusionsIn order to improve the detection performance of dim small targets and enhance the deployment ability of algorithms, a light dim small target detection network with multi-heterogeneous filters is proposed. Experimental results show that the proposed algorithm can detect dim small targets in the complex infrared background effectively. In addition, fewer computational and storage resources are consumed, which lays a foundation for deployment on the embedded platform with constrained resources.
ObjectiveValley pseudospin is an important approach to construct optical topological insulators, and its properties determine the topological transmission characteristics. Using topological structures to control light transmission makes it ideal to control light waves in all concerned wavebands. However, the previously reported valley topology photonic crystal studies often break only one degeneracy point in photonic crystal bands, achieve topological phase transition through band inversion, and obtain valley topological edge states of single wavebands. This can only play a role in light propagation in a very narrow range but cannot modulate light propagation in more wave ranges. Thus, this paper researches the light transport characteristics of dual-band valley topological photonic crystals to modulate light propagation in a wider wavelength range as far as possible. The designed photonic crystal structure has two degeneracy points in the band and can make the two points open at the same time by rotating the scatterer to generate two band gaps. In this way, valley topological phase transitions can occur in two ranges, and the light propagation within the two wavelength ranges can be modulated. Finally, a supercell structure with topological edge states is constructed, and the transport characteristics and robustness of topological edge states with different interface types are investigated, which provides a basis for the design and application of dual-band valley topological edge states.MethodsIn this paper, photonic crystal supercells with a dual-band valley structure are constructed. The transport characteristics and robustness of zigzag and armchair interface topological edge states in two bands are studied. The band structures of zigzag AB (interface I1), BA (interface I2), armchair AB (interface I3), and BA (interface I4) are calculated by the finite element method, and the electric field modes of light propagation corresponding to different interface topological edge states are compared and analyzed. The transport characteristics of plane waves along interfaces I1, I2, I3, and I4 are calculated in the first and second topological edge states. Finally, the disturbance of defects, impurities, and sharp corner structures on the transport characteristics of zigzag and armchair interfaces is investigated.Results and DiscussionsFor zigzag interfaces, the edge states of AB (interface I1) and BA (interface I2) are different, regardless of the first or second topological edge states. For armchair interfaces, the rule is quite different from the zigzag interface, and the edge states of AB (interface I3) and BA (interface I4) are completely identical. For zigzag interfaces, the light transport characteristics of symmetric interfaces are significantly different from those of antisymmetric interfaces. Symmetric interfaces allow plane wave transmission while antisymmetric interfaces greatly inhibit plane wave transmission. However, the light propagation does not show any difference for armchair interfaces. For the interfaces allowing plane wave transmission, both zigzag and armchair interfaces feature good robustness against impurities, defects, sharp corners, etc.ConclusionsBand range expansion of topological edge states is vital for the practical application of optical topological insulators. This paper constructs a photonic crystal supercell with a dual-band valley structure and compares the band structure and light transport characteristics of the interfaces I1, I2, I3, and I4. Different transmission phenomena of zigzag and armchair interfaces are discovered, and the robust transmission ability of topological edge states is verified. The constructed topological edge state can simultaneously modulate the light transport characteristics in two ranges, which will provide ideas and guidance for expanding the application fields of optical topological insulators. The physical mechanism of different interfaces exhibiting various transport characteristics needs to be further explored.
ObjectiveThe traditional localized surface plasmon resonance (LSPR) stimulated in metal materials has been studied and applied in the ultraviolet, infrared, and even terahertz band. Unfortunately, it has limited application in the infrared LSPR because of the large absorption loss. Indium tin oxide (ITO), a highly doped semiconductor material, can be an ideal LSPR material in the near-infrared (NIR) band. This is due to the wavelength corresponding to the zero dielectric constant that is located in the NIR band, as well as its small absorption loss in the NIR band. In addition, the LSPR wavelength can be controlled by the tuning of the carrier concentration of the ITO material, and the ITO is unsusceptible to mutual diffusion when in contact with a semiconductor. Although there have been some reports on the promising applications of the LSPR effect in ITO materials, there have been relatively few studies on the relevant impact parameters of the LSPR bands in ITO materials. In this study, the ITO material is chosen to simulate and analyze the LSPR effect, and the effective modulation of the LSPR wavelength of the ITO nanorods in the infrared band is achieved by the tuning of relevant parameters.MethodsIn this paper, we systematically simulate and analyze the extinction characteristics and the field intensity profiles of cuboid ITO nanostructures in the 780-5000 nm band using the finite-difference time-domain (FDTD) method. The dielectric constants of ITO materials with different carrier concentrations are calculated according to Drude's model. The construction of LSPR simulations for ITO nanostructures involves the following steps: first, a cuboid ITO model is constructed on the SiO2 substrate, where the X and Y directions are set as periodic boundaries, and the Z direction is set as the boundary of a perfectly matched layer; second, a 780-5000 nm linearly polarized plane light source with an incident angle of 0° is set directly above the ITO nano model; third, reflectance and transmittance monitors are set to detect the intensity of reflected and transmitted light, and the electric field monitors for the XY (Z=0) plane and XZ (Y=0) plane are set to obtain the changes in the electric field around ITO nanoparticles (Fig. 1). The corresponding extinction spectra and the electric field intensity profiles are obtained by the tuning of the carrier concentration, size, spacing, and substrate refractive index of the ITO nanorods to tune their infrared-band LSPR peaks effectively.Results and DiscussionsAccording to the calculations by Drude's model, the real part of the dielectric constant of the ITO gradually decreases while the imaginary part increases with the incident wavelength. In addition, the wavelength corresponding to the zero dielectric constant decreases with the increasing carrier concentration (Fig. 2). The influence of the carrier concentration, size, spacing, and substrate refractive index on the LSPR effect of cuboid ITO nanorods in the NIR band is investigated. It is shown that when the carrier concentration of cuboid ITO nanoparticles rises, the resonance peak position undergoes a blue shift, and the peak intensity is increased. Within a certain range, an increase in the carrier concentration leads to an enhancement of the local field, and the trends of the electric field intensity and the peak intensity are consistent (Fig. 3). As the length of cuboid ITO nanoparticles increases, the resonance peak position goes through a redshift, and the peak intensity increases (Fig. 4). As the height or width of the cuboid ITO nanoparticle grows, the resonance peak position undergoes a blue shift, and the peak intensity increases (Figs. 5 and 6). As the spacing of the cuboid ITO nanoparticles widens, the resonance wavelength changes slightly while the peak intensity declines significantly (Fig. 7). As the value of the refractive index of the substrate enlarges, the resonance peak position goes through a redshift while the intensity of the peak drops (Fig. 9). The adjustment to the above parameters enables the localized surface plasmon resonance wavelength of cuboid ITO nanostructures to be modulated effectively in the NIR band.ConclusionsIn this paper, the FDTD method is used to research the LSPR phenomenon of the ITO material, and the influence of the carrier concentration, size, spacing, and substrate refractive index on the LSPR effect of cuboid ITO nanorods is discussed. The effective modulation of the LSPR wavelength in the infrared band is achieved thanks to the carrier concentration tunability of the ITO and the advantages of the ITO nanorod structure. Under the same structure, the corresponding LSPR wavelength is tuned from 2850 nm to 1985 nm by the adjustment to the change in the carrier concentration. Under the same conditions, the corresponding LSPR wavelength is tuned from 2090 nm to 3710 nm by the adjustment to the length of ITO nanoparticles from 100 nm to 400 nm. This indicates that the LSPR effect stimulated by ITO materials with nanorod structure has a great effect on the tuning of the LSPR wavelengths. The above parameters can be adjusted to achieve an effective modulation of the LSPR wavelength of cuboid ITO nanostructures in the infrared band, which has important research implications for broadening the application of ITO nanostructures to LSPR effects in the infrared band.
ObjectiveWith the rapid development of aerospace technology, high-effective turbine engines are increasingly required. How to accurately measure the pressure in the turbine under a harsh environment becomes the key issue. The traditional piezoresistive sensor is greatly affected by electromagnetic interference, while the application temperature of the quartz optical fiber sensor is relatively low, which makes it no longer applicable. The sapphire optical fiber pressure sensor has high-temperature resistance, anti-electromagnetic interference, and other excellent characteristics, which make it an ideal device for monitoring pressures at temperature above 1000 ℃. There are few studies on the high-temperature refractive index of sapphire, and the highest temperature of refractive index measurement is only 700 ℃. In this study, an experimental device for measuring the refractive index anisotropy of crystals is designed based on the Huygens principle. As temperature ranges from room temperature to 1200 ℃, the ordinary refractive index no and the extraordinary refractive index ne of sapphire at wavelength of 445 nm are measured by the laser displacement method. In addition, optical parameters such as the refractive index of sapphire in this temperature range are calculated by the first-principles method. Finally, the experimental and calculated results are compared to verify the reliability of the measured data.MethodsIn this study, the high-temperature refractive index of sapphire is studied by experimental tests and computational verification. Firstly, we build an experimental device that can indirectly measure the high-temperature refractive index of sapphire. This device can adjust the temperature from room temperature to 1200 ℃ and guide the laser to pass through the sapphire crystal at a certain angle, and then make it received by the position-sensitive sensor. Besides, we install a polarizer on the optical path to measure the anisotropic refractive index of the crystal. Based on this device, we propose the laser displacement method to measure the refractive index of a single sapphire crystal under different temperatures. When the polarization direction of the laser is perpendicular to the optical axis of the crystal, the measured refractive index is no. When the polarization direction is parallel to the optical axis of the crystal, the measured refractive index is ne. Subsequently, we perform error analysis and thermal expansion correction on the experimental results. In addition, we measure unit cell parameters of sapphire at high temperatures by variable temperature X-ray diffraction (XRD). According to the first-principles thinking, we calculate the band structure and optical properties of sapphire under different temperatures. The reliability of the laser displacement method is verified by experimental results, and the increase in the refractive index is explained in terms of lattice expansion.Results and DiscussionsThe practicability and credibility of the experimental device (Fig. 2) and laser displacement method (Fig. 3) are verified in this study. The ordinary refractive index no and the extraordinary refractive index ne (Fig. 6) measured by the laser displacement method increase linearly with the increase in temperature. To improve the accuracy and reliability of the data, we analyze the horizontal error of laser translation and the pixel size of the complementary metal oxide semiconductor (CMOS) camera. Besides, we have corrected the error caused by the thermal expansion. The final thermo-optical coefficients of the sapphire are 1.5793×10⁻⁴ K-1 (o-ray) and 1.5517×10⁻⁴ K-1 (e-ray), respectively. The lattice parameters a and c [Fig. 4(a)] of sapphire measured by XRD increase linearly with the increase in temperature. To further verify the reliability of experimental data, we use the first-principles calculation to obtain the relationship between the refractive index of sapphire and temperature (Fig. 8 and Fig. 9). The results show that the changing trend of the calculated data is the same as that of the experimental data, and the reason why calculation results are smaller is analyzed. In addition, we calculate the relationship between the band gap and temperature (Fig. 10) , and explain why the refractive index of sapphire becomes larger under high temperatures.ConclusionsSapphire is an ideal structural material for high-temperature pressure sensors at a temperature above 1000 ℃. The dearth of refractive index under high temperatures restricts the development of these sensors. In this paper, an experimental device for measuring the refractive index anisotropy of crystals is designed based on the Huygens principle. As temperature ranges from room temperature to 1200 ℃, the ordinary refractive index no and the extraordinary refractive index ne of sapphire at wavelength of 445 nm are measured by the laser displacement method. The final calculated thermo-optical coefficients are 1.5793×10⁻⁴ K-1 (o-ray) and 1.5517×10⁻⁴ K-1 (e-ray), respectively. In addition, optical parameters such as the refractive index of sapphire in this temperature range are calculated by the first-principles method. The results show a similar variation of refractive index with temperature. The experiment and simulation results are in good agreement and verify the reliability of high-temperature refractive index data. Besides, we find that lattice expansion is the cause of a smaller band gap and a larger refractive index. The data provides an effective reference for the development and application of sapphire materials and the performance optimization design of related devices.
ObjectiveAn imaging system and processing algorithm for the extraction and three-dimensional imaging of subcutaneous blood vessels is proposed to overcome the difficulty of vascular recognition in thick parts of surface tissue. Vascular visualization technology is used in the medical field to treat scenarios such as venipuncture and interventional therapy to reduce the additional trauma to the patient. Since hemoglobin in the blood has a higher absorption rate of light in the near-infrared (NIR) band (700-1000 nm) than lipids, proteins, and water, vascular tissue appears as a dark shadow area projected on the surface of the skin in images taken in the NIR band, and the position of the shadow area changes with the viewing perspective. According to the above principles, some researchers use multi-view imaging technology to perform three-dimensional reconstruction of subcutaneous blood vessels. This technique consists of two main steps: the first one is the vascular segmentation on the grayscale image, and the second one is the stereo matching on multi-view images to reconstruct the three-dimensional information of blood vessels. However, in the available literature, the applicable body parts of the equipment are limited due to the light source and camera arrangement. Other drawbacks include the noise line segment in the extraction result and the lack of algorithm efficiency optimization. Therefore, we hope to design a vascular recognition module for the automatic puncture robot from the aspects of the light source and camera arrangement design and the improvement in the vascular skeleton extraction algorithm.MethodsThe optimization of the vascular segmentation effect includes the optimization of the original image quality and that of the image processing algorithm. Some studies have shown that improving the irradiance uniformity of the light source on the body surface can make the vascular region more distinctive in the grayscale image. Given such knowledge, our imaging system design uses a convergent binocular NIR-enhanced camera kit and a NIR LED array. We calculate the radiation of the LED bead according to the irradiance distribution formula of the approximate Lambertian source and use MATLAB software to simulate the total irradiance distribution of the LED array on a cylindrical surface (Fig. 2) and make a symmetrical two-board LED array light source according to the optimal design parameters (Fig. 3). The subsequent research on vascular skeleton extraction is carried out on the images taken with the designed imaging system. It includes seven steps: 1) selecting the region of interest (ROI); 2) weakening the image background; 3) performing contrast-limited adaptive histogram equalization (CLAHE); 4) performing two-dimensional Frangi filtering of multi-scale images; 5) performing Otsu's adaptive-threshold image binarization; 6) extracting the vascular skeleton by Zhang's thinning method; 7) performing skeleton branch pruning to remove noise line segments. The vascular skeleton in the left image is extracted by the above algorithm, and then the depth of the vascular skeleton is calculated by an improved sliding window algorithm with the information on the corresponding right image.Results and DiscussionsFirst, the designed imaging system is used to take NIR images of different parts of the body surface, including the back of the hands, forearms, and neck. The intermediate results of the vascular skeleton extraction algorithm (Fig. 5) and the three-dimensional reconstruction results of those body parts (Fig. 12) are analyzed. In addition, a bionic model is built with defibrinated sheep blood, beef slices, and pig skin (Fig. 8) to evaluate the consistency between real blood vessels and the vascular skeleton obtained by this system. The image processing results verify that the central line of the vascular skeleton extracted by this system can be consistent with the real blood vessel (Fig. 10), and the three-dimensional information on the obtained blood vessel is accurate (Fig. 11). For a higher processing speed of the vascular skeleton extraction algorithm, we rewrite the aforementioned algorithm to a parallel mode for GPU acceleration, then shoot 45 sets of left and right image pairs of different body parts, and record the processing speed of the original CPU algorithm and the GPU algorithm for a single image frame. The statistical results show that the GPU algorithm after acceleration takes an average of 64.40 ms per frame, which is 64% less than the original CPU algorithm. The improved sliding window matching algorithm takes an average of 105.32 ms per frame, and hence, the whole three-dimensional reconstruction process with GPU acceleration takes about 170 ms per frame.ConclusionsThe proposed three-dimensional imaging system for NIR subcutaneous blood vessels can effectively generate accurate three-dimensional images of subcutaneous blood vessels, which is suitable for various body parts such as the neck, forearm, and back of the hands and can also achieve good performance in thicker parts of surface tissue. The experimental results show that the extracted blood vessels are consistent with the real blood vessels, and the designed image processing algorithm takes an average total processing time of about 170 ms per frame. Hence, the expected reconstruction frame rate can reach 5 frame/s, which meets the requirements of intraoperative real-time modeling. To make this imaging system a module of the automatic puncture robot in the future, follow-up studies should include two aspects. The first one is to collect subcutaneous vascular patterns of people with different skin colors and different body fat content for the research on the adaptive adjustment method of skeleton extraction algorithm parameters. The second one is to build a theoretical model of light propagation in superficial biological tissues to correct the error of vascular depth estimation caused by light scattering.
ObjectiveThe balanced homodyne detector (BHD) is widely used in quantum noise measurement, gravitational wave detection, high-sensitivity interferometric timing measurement, continuous-variable quantum key distribution, and quantum random number generation. Highly sensitive to the amplitude and phase of the incident light, the BHD can reliably extract quantum fluctuations, suppress the classical common-mode noise, and amplify quantum fluctuations to the macro level. However, the performance of the BHD is limited by the bandwidth, signal-to-noise ratio (SNR), and common-mode rejection ratio (CMRR) of the detector. The optimal design of the BHD has always been a research hotspot. The transimpedance circuit based on a direct current (DC) coupled circuit is not suitable for detecting quantum noise. The reason is that as the power of the incident light increases, the unbalanced DC increases rapidly, and the transimpedance amplifier is saturated, which significantly reduces the dynamic range of the BHD. The BHD based on an inductor-capacitor (L-C) coupled circuit generates higher electronic noise at an analyzing frequency in the kHz range. It is not suitable for low-frequency measurements due to the parasitic effect of the inductor and the low impedance of the inductor at an analyzing frequency in the kHz range. In this paper, the noise sources of the BHD are analyzed theoretically, and a resistor-capacitor (R-C) coupled transimpedance circuit is used to improve the performance of the BHD at an analyzing frequency in the kHz range. Furthermore, the transimpedance circuit is optimized to increase the bandwidth to 200 MHz. The CMRR of the BHD is improved by designing a self-subtraction photodetector scheme, a variable optical attenuator, and an adjustable reverse bias voltage. These designs allow the BHD to meet the low-frequency and high-frequency measurements with high SNR and CMRR in quantum noise measurement.MethodsTo enable the BHD to measure both low-frequency and high-frequency signals with high sensitivity, this paper adopts the BHD based on an R-C coupled transimpedance circuit. Two photodiodes are connected in series, and the balanced current signal in the two photodiodes is divided into a DC signal and an alternating current (AC) signal by the R-C coupled structure. The AC signal is converted into a voltage signal by a transimpedance amplifier (TIA) and is further used to measure the shot-noise power of the incident light. The DC signal is converted into a voltage signal by a load resistor and is then used to measure the balance between the two incident lights. To reduce the crosstalk between the DC circuit and the AC circuit, an isolation amplifier is added after the load resistor. An adjustable bias voltage (BV) circuit is used to adjust the junction capacitance of the photodiodes and further improve the CMRR. To compensate for the difference in the amplitude of the two photodiodes and thereby improve the CMRR of the BHD, the paper also utilizes a variable optical attenuator based on fiber bending, where variable attenuation is achieved by changing the radius of the bent fiber. The attenuation of the fiber is precisely adjusted to balance the photocurrent. In addition, an equivalent noise model is constructed. The electronic noise from the TIA circuit includes four parts, i.e., the noise introduced by the dark current in the photodiodes, the thermal noise in the feedback resistor, the noise generated by the input current noise in the TIA, and the noise produced by the input voltage noise. On the basis of theoretical analysis, reasonable DC load resistance and feedback capacitance, photodiodes with low dark current and low junction capacitance, and a TIA with low input noise are selected to reduce the electronic noise and improve the SNR of the BHD.Results and DiscussionsA BHD with an R-C coupled circuit structure is designed (Fig. 1). A test device is built to test the performance of the BHD. The AC output is connected with a spectrometer to measure the bandwidth and the SNR of the BHD. The DC output is connected with an oscilloscope to make sure that the power of the two incident lights is balanced (Fig. 3). When the incident optical power is 8, 4, 2, and 1 mW, respectively, the paper tests the shot-noise spectrum and the electronic noise spectrum of the BHD with different analyzing frequencies. The test results show that the 3-dB bandwidth of the BHD is 1 kHz-200 MHz. The resolution bandwidth (RBW) and the video bandwidth (VBW) of the spectrum analyzer are set to 10 Hz and 1 Hz, respectively, and the number of averaging times is set to 40. In this case, the SNR is 12 dB at the analyzing frequency of 5 kHz under an incident optical power of 8 mW. The SNR is 20 dB at the analyzing frequency of 100 MHz when the RBW is 200 kHz and the VBW is 100 Hz. Moreover, in the analyzing frequency range of 10 kHz-200 MHz, the shot-noise power decreases by about 3 dB when the incident optical power decreases by half, indicating that the AC output of the BHD has favorable linear gain characteristics in the range of 1 mW to 8 mW (Fig. 4). In addition, 5 kHz and 100 MHz sinusoidal signals are loaded into an electro-optical amplitude modulator to modulate the incident light and thereby test the CMRR. The results show that the CMRR is 70 dB at the analyzing frequency of 5 kHz and 66 dB at the analyzing frequency of 100 MHz (Fig. 5).ConclusionsBy analyzing the noise sources of the BHD, adopting the R-C coupled transimpedance circuit, and optimizing the TIA circuit, this paper implements a broadband balanced homodyne detector that works in the bandwidth range from 1 kHz to 200 MHz with low noise and high CMRR. In the case of an incident optical power of 8 mW@1550 nm, the shot-noise power is 12 dB higher than the electronic noise power and the CMRR reaches 70 dB at the analyzing frequency of 5 kHz, and the shot-noise power is 20 dB higher than the electronic noise power and the CMRR reaches 66 dB at the analyzing frequency of 100 MHz. Such a homodyne detector can serve as a high-performance detection tool in various applications, such as low-frequency gravitational wave detection, high-speed continuous-variable quantum key distribution, and high-speed quantum random number generation.
ObjectiveIn order to achieve electromagnetically induced transparency (EIT) in the quantum field, it is necessary to meet harsh experimental conditions such as extremely low experimental temperatures, high-intensity light sources, and huge experimental equipment. Therefore, the development of EIT is greatly limited. With the development of photonics, the realization of EIT in the field of photonics will avoid harsh experimental conditions and accelerate the research on EIT. The electromagnetically induced absorption (EIA) effect is contrary to EIT. The physical mechanism of EIA is radiation and sub-radiation resonator, which realizes EIA through the near-field coupling between them. The EIA effect can be used in the fields of optical switches and slow light devices. In addition, compared with Lorentz linetype, Fano linetype has the characteristics of asymmetry, and the transmission efficiency of the Fano effect is higher. In view of the difficulty in realizing the EIT effect in the quantum field, the application scope of the EIA effect, and the transmission advantages of the Fano effect, the feasibility of these physical effects in a simple and compact device is worthy of studying.MethodsTwo main research methods are used in this study, namely the transmission matrix method and the finite difference time domain (FDTD) method. The transmission matrix method is used to analyze the transmission characteristics of devices. Specifically, the transmission matrixes of the air hole, Fabry-Perot (FP) cavity, and coupling between the microring and the FP cavity are established using the parameters such as the reflection coefficient of the air hole, the length of the FP cavity, the wavelength, the effective refractive index, the circumference of the microring, and the transmission loss coefficient. Through the relationship between these matrices, the input mode and the output mode in the waveguide are connected. By analyzing the input and output modes, the expression of normalized transmittance is obtained. The device is simulated by FDTD. It mainly simulates the mode field, transmission spectrum, and performance parameters [quality factor and extinction ratio (ER)] of a microring resonator (MRR). The mode field is simulated at the wavelength of 1550 nm. According to Eq. (9) and the group refractive index in the simulation results, the bending losses of microgroove microring and single waveguide microring are compared. The simulation of the transmission spectrum is mainly shown in the device structure simulation and optimization module. By changing the structural parameters, such as the coupling distance, the length of the FP cavity, the radius of the air hole, and the width of the microgroove, the optimal output linetype can be ensured.Results and DiscussionsIn this study, the coupling structure of the FP cavity and microgroove microring is adopted (Fig. 1), which makes the light mode of continuous state in the FP cavity and that of discrete state in the microring couple interfere with each other. In addition, the waveform is distorted by the high refractive index difference of the straight waveguide and the FP cavity, and Lorentz linetype, Fano linetype, EIT-like linetype, and EIA-like linetype appear between two adjacent resonance peaks of the FP cavity. In order to improve the utilization of light, reduce the loss, and improve the quality factor of the device, two air holes are introduced outside the FP cavity, and the microgroove structure is adopted. The microgroove structure restricts light. When the distance between the external air hole and the FP cavity increases, the cavity length (L) of the FP cavity of the reflector composed of the air hole increases. In this process, it can be seen from Eq. (8) that the transmissivity of the structure mentioned in this study increases. This phenomenon can be clearly seen in Fig. 7. With the increase in L, the resonance intensity in the EIT transparent window gradually increases. When the radius (Rhole) of the air hole increases, L will decrease relatively. In this process, it can be seen from Eq. (8) that the transmissivity of the device will gradually decrease, and this process is consistent with the results shown in [Fig. 8(a)]. Fig. 8(b) also shows that when Rhole increases, the quality factor slowly decreases.ConclusionsIn this study, a microgroove MRR based on the FP cavity is proposed. Two air holes are introduced outside the FP cavity. By adding air holes, the utilization of light is improved, the coupling ability between the FP cavity and the microring is enhanced, and the transmissivity of the device is improved. FDTD is used to simulate the effects of coupling distance, FP cavity length, air hole radius, and micro slot width on the output linetype of the device. The results show that: the coupling distance can directly control the EIT-like linetype, and the EIT transparent window can be opened and closed by changing the coupling distance; the length of the FP cavity and the radius of the air hole determine the utilization of light; the width of the microgroove can realize the regulation of EIA. In addition, this study also compares the advantages and disadvantages of single waveguide microring and microgroove microring. The fabrication of single waveguide microring is simple, but the bending loss of microgroove microring is small. In order to simulate the realizability of the device, the fabrication tolerance of the device is simulated on the premise of ensuring the optimal output linetype. The results show that the proposed device has favorable fabrication tolerance and strong realizability. Through the simulation analysis, the multiline output is realized; the Q value of the structure reaches 90112, and the ER is about 15 dB. The proposed structure can be used in the field of optical switches.
ObjectiveWhen sunlight enters the earth through the atmosphere, the light in the solar-blind ultraviolet (UV) band (200-280 nm) will be absorbed by the ozone layer. As a result, solar-blind UV detection has the advantages of little background interference, low false alarm rate, and high resolution. Solar-blind UV detection can be widely used in UV communication, high-voltage discharge detection, missile warning, search, rescue, navigation, and positioning. The solar-blind UV filter is an important component of a UV detection system. The solar-blind band-pass filter should achieve high transmittance in the range of 200-280 nm while maintaining deep cut-off in other bands. There are two kinds of solar-blind UV filters: absorption filter and interference filter. At present, although band-pass in the solar-blind band can be realized by a variety of existing optical medium structures, some problems remain to be solved. For example, the transmittance of the solar-blind UV band and the cut-off steepness on both sides of the band-pass are not high, and the uniformity of the band-pass is poor. In this paper, a band-pass filtering method is proposed by weakening photon localization and multi-defect coupling effect. The defect peak of the photonic crystal is amplified, and its shape is adjusted. The amplified and adjusted defect peak can effectively improve the transmittance of the solar-blind UV filter and have better cut-off steepness.MethodsThis paper proposes a high-transmittance band-pass filtering scheme based on the coupling of multiple photonic crystal defects. The optical transmission characteristics of a solar-blind UV band-pass filter are studied by the transmission matrix method. Firstly, by reducing the photonic crystal periods on both sides of the defect layer and weakening photon localization effect, the defect peak can be widened in the transmission spectrum. Secondly, by adjusting defect coupling, the paper studies the influence of the number of defect modes on the transmission spectrum shape, the average transmittance of the band-pass, and the cut-off steepness. Then, it investigates the influence of medium thickness on the position of the transmission spectrum and optimizes the structural thickness parameters. Finally, this paper analyzes the degree of band-pass blue shift and the filtering performance of photonic crystal at different incident angles in TE and TM modes and studies the sensitivity of the structure to incident angles.Results and DiscussionsBy adjusting the structure of the defect layer, photon localization effect can be weakened, and the bandwidth of the band-pass can be effectively widened. When N1 is equal to 1, the band-pass has the maximum bandwidth (Fig. 3). By analyzing the defect peak characteristics formed by multi-defect coupling, it is found that with the increase in N2, the central position of the band-pass does not move, but the shape of the photonic crystal transmission peak keeps changing (Fig. 4). The cut-off steepness of the photonic crystal band-pass is getting better and better. The band-pass transmittance first increases and then decreases with the increase in the number of defects. When N2 is 4, the average transmittance of the band-pass has a maximum value of 91.01%. As the thickness of the dielectric layer increases, the band-pass of the photonic crystal shifts in the long wavelength direction (Fig. 5). The optimization of the thickness parameters of three media yields the band-pass range of 238.8-280.3 nm for the photonic crystal, the bandwidth of 41.5 nm, and the average band-pass transmittance of 90.71%. The average transmittance of the band-stop in the range of 290-360 nm is 1.47% (Fig. 6). With the increase in angle, the transmission spectra of the TE mode and the TM mode are separated at the same time as blue shift (Fig. 7). When the incident angle is less than 15°, the band-pass bandwidth is still about 40 nm, and average transmittance is close to 90% in both the TE mode and the TM mode (Table 3 and Fig. 8).ConclusionsIn light of the defect coupling principle, this paper designs a one-dimensional photonic crystal band-pass filter with high transmission at 239-280 nm and deep cut-off on both sides of the band-pass. Firstly, a multi-defect photonic crystal model with structure [(H/L)N1A(H/L)N1]N2 is proposed. By weakening photon localization effect, the transmission peak is widened. When N1=1, the band-pass reaches a maximum bandwidth of 42.2 nm. Secondly, the band-pass shape of the photonic crystal is adjusted by coupling different numbers of defects to improve the cut-off steepness and increase the average band-pass transmittance. It is found that when N2=4, the band-pass transmittance is the highest, and the cut-off steepness is better. Then, the influence of medium thickness on the location of the band-pass is analyzed, and the thickness parameters of the structure are optimized. Finally, the blue shift of the transmission spectra under different incident angles is studied. The filtering effect is still ideal when the incident angle is less than 15°. A solar-blind UV band-pass filter is obtained with the structure of [(Si3N4/SiO2)1Air(Si3N4/SiO2)1]4 and a medium thickness of dSi3N4=30 nm, dSiO2=40 nm, and dAir=67 nm. The average transmittance of the filter band-pass (239-280 nm) is 90.71%, which can achieve high transmittance in the solar-blind UV region. The average transmittance of the band-stop (290-360 nm) is 1.47%, which can achieve deep cut-off. This paper employs the method of widening the transmission region of the band-pass and adjusting the shape of the band by weakening photon localization and multi-defect coupling, which can provide a new idea for the design of high-transmission band-pass filters.
ObjectiveAnti-reflective microstructured silicon surface could greatly improve the light trapping performance for silicon-based energy harvesting devices, thereby increasing the optical absorption efficiency and reducing the surface reflection. In the manufacturing of anti-reflective silicon surfaces, the thermal effect produced by laser ablation may lead to the collapse of microstructures with high aspect ratios, thus resulting in the rapid increase of reflectivity by seriously affecting the light trapping effect on microstructured silicon surfaces. Therefore, the microstructure characterization on silicon surfaces is of great significance for product quality and loss assessment of parts. Currently, offline methods including spectrometer or scanning electron microscopy (SEM) are widely employed. It needs to transfer the samples for observation after the preparation, and the fabricating process could not be optimized in time referring to processing results. To improve the quality of laser processing on anti-reflective silicon surfaces and shorten the optimization periods, researchers have proposed corresponding solutions via real-time monitoring. Laser ablation is often accompanied by the generation of acoustic, optical, electrical and thermal signals, and can be monitored based on a variety of sensors in real-time. Compared with other signals, acoustic signals exhibit excellent spatial resolution. At present, real-time monitoring technology based on acoustic signals is mostly adopted to monitor the changes in laser parameters or processing quality, while few studies focus on the forming of surface microstructures. Therefore, a real-time acoustic signal monitoring and processing method is put forward based on time-frequency domain processing to analyze the forming process of surface microstructures.MethodsIn this paper, real-time monitoring of acoustic signals includes two steps of sampling and feature extraction. The acoustic signal is converted into electrical signal through a pre-polarized capacitive microphone with a frequency response range from 20 Hz to 31.5 kHz. Then, the electrical signal is collected by an oscilloscope at a sampling frequency of 240 kHz. The frequency composition of real-time signal and its intensity change with time could be obtained by MATLAB software for short-time Fourier transform and fast Fourier transform. The acoustic signal is normalized in the characteristic section, and the proportion of the amplitude in the frequency domain of the acoustic signal could be extracted as the characteristic parameter for analysis to improve the linearity between the characteristic parameters of the acoustic signal and the average depth of surface microstructures. Based on the sound source generation mechanism, the surface morphology of the silicon surface during laser ablation could be monitored by the time-frequency spectrum of the corresponding acoustic signal. An acoustic measurement method based on the fast Fourier transform is proposed to obtain the height and width of microstructures. The reflectivity of the sample is considered the evaluation standard of the sample processing quality, and the amplitude of each acoustic signal frequency is taken as the input. The artificial neural network is applied to predict the processing quality of the anti-reflective silicon surface.Results and DiscussionsFirstly, the correlation between the acoustic signals in 0-30 kHz and characteristic sizes of the surface microstructure fabricated by laser ablation could be analyzed by the time-frequency spectrum of the acoustic signal. The acoustic signal generated during laser processing can reflect whether the ablated silicon surface forms periodic microstructure (Fig. 3), and the frequency composition of the acoustic signal could be tuned by microstructured width (Fig. 4). Then the effects of laser power and processing times on the microstructure depth are analyzed in detail, corresponding to the amplitude changes of each acoustic signal frequency. In the case of a fixed microstructure width, the normalized acoustic signal characteristic parameters change linearly with the microstructured depth, and the influence of laser power changes could be ignored (Fig. 10). Additionally, an artificial neural network is applied to forecast the processing quality by utilizing the acoustic signal as the input. The reflectivity of 5% on the silicon surface is defined as the processing quality boundary, and the actual measurement accuracy of processing quality prediction could exceed 90% via the artificial neural network. This indicates that the acoustic online monitoring can be employed to evaluate the surface processing quality of anti-reflective silicon surface in real-time (Fig. 13).ConclusionsThe real-time acoustic signal analysis in this paper can effectively monitor the surface microstructure morphology and predict the machining quality. Results show that the acoustic signal with the same frequency could be always captured during laser processing, regardless of whether the microstructured surface exists or not. The acoustic signal frequency related to the microstructure could be influenced by the microstructure depth and laser scanning speed. The ratio of the frequency component intensity to the total signal intensity is linearly correlated to the average structural depth on microstructured silicon surfaces. The proposed method can effectively work even after partial structured collapse. The artificial neural network is adopted to verify the correlation between the acoustic signal and the machining quality. The accuracy of the classification prediction is higher than 90%. This study provides a theoretical basis for the real-time quality monitoring of anti-reflective silicon surfaces fabricated by laser ablation. In the future, more attention could be paid to the underlying mechanism and monitoring method of acoustic signal generation at the moment of microstructured collapse, which could be combined with other existing signal processing methods to yield better processing quality.
ObjectiveHyaluronic acid is a large acidic mucopolysaccharide that is commonly found in the connective tissues of animals, including joints, the vitreous body, synovial fluid, the umbilical cord, cartilage, and skin. Different molecular weight variations of hyaluronic acid exhibit distinct biological and physical properties, including plasticity, high viscoelasticity, and excellent biocompatibility. Hyaluronic acid has various applications, such as in eye preparations, supplementing missing support, regulating muscle movement of fat and dermal tissue, and improving the effects of drug treatments in slow-release preparations. Additionally, macromolecular hyaluronic acid and oligohyaluronic acid have high moisturizing and transdermal properties, making them useful for antiinflammatory and promoting tissue repair, particularly in skin burn healing and postoperative antiadhesion. Moreover, oligohyaluronic acid can serve as a targeting carrier for antitumor drugs that can be better absorbed in tumors and lymph nodes. Given its medical value in clinical medicine and other fields, the concentration change of hyaluronic acid can directly reflect the body's health status. However, due to its low concentration in the body, it is challenging to detect hyaluronic acid using traditional methods. Therefore, there is a need for rapid and highly sensitive trace detection methods of hyaluronic acid.MethodsFor this experiment, hyaluronic acid samples were obtained from Sigma Aldrich Corporation. A terahertz time-domain spectrum system (THz-TDS) (TAS7400), produced by Advantest in Japan, was used with a spectral range of 0.03-7 THz and a dynamic range of approximately 60 dB. To obtain transmission responses, 512 measurements were cumulatively averaged within the spectral range of 0.1-4.0 THz, with a resolution of 7.9 GHz. To minimize experimental error, the four repeated measurements method was employed for each sample. All experiments were performed at room temperature (~22 ℃) and with a humidity level of less than 3% to eliminate the effects of humidity and temperature on the experiment. The sensor used consisted of two-gap cut-induced split ring resonators with an asymmetry of g=13 μm for testing the hyaluronic acid sample. Standard hyaluronic acid solution was diluted into different concentrations by mixing it evenly with deionized water to obtain 0, 1, 2, 4, 8, and 16 mɡ·ml-1 concentration diluted hyaluronic acid solution. The sensor was dried with air and 5-μL sample solution was dropped onto the metasurface using a motorized pipette. The sensor was dried for 5 min and then measured using THz-TDS at room temperature to obtain the transmission responses. To reduce error, five repeated measurements were performed for each sample solution, and after each measurement, the sensor was cleaned and dried for half an hour.Results and DiscussionsThe transmission spectrum of the cut-induced asymmetric split ring resonator shows two resonances: the Fano resonance at low frequency and the dipole resonance at high frequency. The sensitivity of the resonator is influenced by the spatial overlap between the analyte and the electromagnetic field. With an increase in the asymmetric parameter g, the sensitivity of the Fano resonance decreases, while the sensitivity of the dipole resonance increases. For this experiment, a value of g=13 μm was chosen because both resonances have similar sensitivity, enabling better quantification of the hyaluronic acid solution using both resonances. As the mass concentration of the hyaluronic acid solution increased from 0 mɡ·ml-1 to 16 mɡ·ml-1, both resonances showed a redshift. To analyze the relationship between dual resonance frequency changes and hyaluronic acid solution concentration, we used the Hill model, which is commonly used in the biomedical field. The correlations of Hill fitting for dual resonances were found to be 0.996 and 0.994, respectively. The limit of detection is as low as 1 mɡ·ml-1. These results demonstrate that hyaluronic acid solution can be detected quickly and accurately using the proposed method.ConclusionsWe present an innovative approach to detect hyaluronic acid at trace levels, using an ultrasensitive THz dual-band Fano metasurface sensor that breaks the symmetry of cut-induced split ring resonators. By carefully selecting the symmetric parameter, we achieved sensitivities of both the Fano and dipole modes that reach ~150 GHz/RIU. In our experiment, we achieve a remarkable limit of detection of 1 mɡ·ml-1. The correlation of Hill fitting between resonance frequency shifts and hyaluronic acid concentrations is higher than 0.99, demonstrating the potential for accurate and quantitative analysis of hyaluronic acid at trace levels.
ObjectiveSurface enhanced Raman scattering (SERS) is a multifunctional detection technology widely used in chemical and biological molecules. It has the advantages of high detection sensitivity, no sample treatment, nondestructive testing, etc. SERS technology can realize ultra-low concentration molecular detection or even single molecule detection. As a flexible substrate material, paper is different from the traditional rigid substrate. The rigid substrate is fragile, which greatly limits the application of plasma nanostructures. The flexible substrate can be easily cut into different shapes and sizes to meet the needs of non-planar, flexible, and other applications. At the same time, as paper has the characteristics of easy access and low cost, there are many explorations in the preparation of paper-based SERS substrates, and there are various preparation methods for paper-based SERS substrates, such as pen on paper, spray preparation, and other preparation methods. However, the preparation process of these paper-based SERS substrates is relatively cumbersome, and it is difficult to meet the different pattern design requirements under different environmental conditions. In this paper, the Ag-paper-based SERS substrate is prepared by inkjet printing, and the high-performance paper-based SERS substrate is prepared by selecting the optimal parameters.MethodsIn this study, an Ag-paper-based SERS substrate is prepared by inkjet printing on hydrophobic A4 paper. Firstly, a brown-green silver sol solution with an average particle size of 58.6 nm is prepared by the Lee preparation method, and the parameters of silver nitrate, sodium citrate, and heating time are set. Silver ink is prepared as follows. Silver sol is centrifuged and ultrasonically operated, the supernatant is removed, and the silver sol washing process is repeated twice. According to the silver sol concentration multiples of 10, 20, 33, and 50, supernatants of 50, 53, 54, and 55 mL on the surface are removed, respectively. The absolute ethanol and glycerin are added according to the configuration scheme of silver ink, and the silver ink is filtered with a polytetrafluoroethylene (PTFE) membrane filter (with a pore size of 0.2 mm), so as to ensure the working fluency of the silver ink. After that, the paper receives hydrophobic treatment with a 20% mixed hexanol solution of dodecene succinic anhydride (DDSA). Next, the silver ink is put into the ink cartridge for a few minutes and printed on the hydrophobic A4 paper. Finally, the prepared Ag-paper-based SERS substrate is used for Raman detection of probe molecules.Results and DiscussionsThe prepared Ag-paper-based SERS substrate can be mass-produced rapidly. At the same time, it is cheap, and the preparation scheme is simple. The operator can quickly start to prepare and apply and thus realize multi-molecule detection. Through the optimal selection of silver ink multiples and the number of printing layers (Fig. 2), when the silver ink concentration is 50 times, and the number of printing layers is 7, the prepared Ag-paper-based SERS substrate has high Raman enhancement performance, with the maximum enhancement factor of about 1.92×10⁹ and the relative standard deviation (RSD) of 14.3% (Fig. 3). After hydrophobic treatment of A4 paper, Raman detection sensitivity is greatly improved (Fig. 4). This is because after hydrophobic treatment, the contact angle of liquid droplets on the paper surface has been greatly improved, which leads to more silver nanoparticles per unit surface area. Therefore, Raman detection intensity has been enhanced. Paper is a flexible material. The flexible characteristic experiment (Fig. 5) shows that the prepared Ag-paper-based SERS substrate also shows excellent uniformity after bending, which proves that the Ag-paper-based SERS substrate has strong stability.ConclusionsIn this paper, the silver ink is printed on the hydrophobic A4 paper surface by an inkjet printing method, so as to serve as a flexible SERS substrate. By studying the influence of different silver ink multiples and printing layers on Raman detection sensitivity, it can be found that when the silver ink concentration is 50 times, and the number of printing layers is 7, the detection concentration of R6G molecules on SERS substrate is as low as 10-10 mol/L, and the maximum enhancement factor is about 1.92×10⁹. At the same time, the SERS substrate has excellent uniformity, and the optimal RSD calculation result is 14.3%. The flexibility of Ag-paper-based SERS substrate is studied on the apple surface, and the detection of multi-molecules is realized. The method has the advantages of low price and mass production. Finally, according to the scanning electron microscope (SEM) results of the SERS substrate, the electromagnetic field enhancement characteristics of the SERS substrate are calculated by using finite-difference time-domain (FDTD) software. According to the numerical simulation and experimental results, the optimal number of printing layers is 7.
ObjectiveIn the measurement of particle size distribution, light scattering methods have the advantages of a wide measurement range, high speed, and non-contact measurement. Among them, the dynamic light scattering technique is an important method to measure the size distribution of nanometer to micron particles.In medical testing, the analysis of red blood cells is a common method for disease diagnosis. The variation coefficient of the red cell volume distribution width (RDW) is generally used to characterize the uniformity in size and shape of red blood cells in blood samples, whose increment often indicates diseases. The variation coefficient of RDW can be calculated by inversion of the particle size distribution of blood cells, which can provide reliable support in the early detection and diagnosis of some major diseases.Current particle size inversion algorithms are mostly based on the regularization method, but the traditional regularization algorithm lacks the inversion model and algorithm for the particle size distribution of non-spherical particle systems. Moreover, its performance on narrowly distributed particle systems and the multi-angle scattered light analysis are not satisfying, which limits its application in biomedical fields.Therefore, the corresponding model and algorithm for particle size distribution analysis based on machine learning are developed in this study, and the simulation results are provided.MethodsIt has been shown that neural networks have advantages in expressing complex objective functions such as particle size distribution, which can hierarchically describe effective data characteristics from a large amount of input data. Of the neural networks, generalized regression neural networks have been proven to be effective for function approximation. Thus, it can be widely used in various research fields requiring parameter inversion of nonlinear pathological equations without a priori knowledge of the complex arithmetic relations involved in the problem model.In this paper, the idea of introducing generalized regression neural networks into the inversion of particle size distribution is adopted. A generalized regression neural network based on the inversion model and algorithm for the particle size distribution of particle systems is designed, which can be applied to the particle size analysis by the multi-angle dynamic light scattering method. The proposed algorithm is tested by simulations using biconcave-disk and ellipsoidal red blood cells as typical non-spherical particle models in the biomedical field.Results and DiscussionsThe evaluation indexes selected in the training process of the inversion model are clarified, and the particle size distributions of non-spherical particle systems such as biconcave-disk red blood cells (Fig. 4) and ellipsoidal red blood cells (Fig. 7) are retrieved by the neural network. The optimization method for the training matrix expansion is proposed in the training process of the network (Table 1 and Table 3). During the inversion of the particle size distribution curves of biconcave-disk and ellipsoidal models, the use of 20 sets of training matrices to jointly train the neural network can result in evaluation indexes with mean values as small as 1.0027 and 0.6568, respectively.The network (Table 2 and Table 4) is tested, and the result reveals that it has a significant advantage over the conventional regularized Tikhonov algorithm (Fig. 5 and Fig. 8) using at least two scattering angles. The use of only two scattering angles means that it is easier to build and debug a multi-angle dynamic light scattering measurement system for practical applications, which can reduce the systematic errors introduced by the consistency of concerned devices.ConclusionsThe experimental results show that compared with the conventional regularized Tikhonov algorithm, the inversion algorithm designed in this paper is more accurate and less time-consuming, and the neural network model can be well adapted to biconcave-disk and ellipsoidal models. The number of scattering angles in the multi-angle dynamic light scattering method is also considered, and the results show that the accurate inversion of the particle size distribution of non-spherical particle systems can still be achieved with data obtained at only two scattering angles. As long as the shape of the particles in the particle system to be measured can be clearly expressed, such as a mathematical expression for the particle shape, the network model can be extended to many other cases of non-spherical particle systems.As an example of analyzing a non-spherical particle system, if the RDW-CV is to be further calculated after the inversion of the particle size distribution of the red blood cells, it is required that the particle size distribution curve obtained from the inversion is as close as possible to the actual particle size distribution curve at each particle size. The evaluation indexes used in this study can precisely characterize the difference between the two particle size distribution curves. Hence, it is expected that if the accuracy step of particle size inversion is appropriately reduced, it can be applied to rapid clinical detection of the particle size distribution of red blood cells for early detection and diagnosis of some major diseases.
ObjectiveLight emitting diode (LED) features high luminous efficiency, adjustable luminance and color temperature, fast response, and long life, and it is widely applied in various fields. During the operation of LED light sources, the temperature change exerts an impact on its emission spectrum and energy efficiency. In previous studies, the designs of heat dissipation structures are mainly adopted to reduce the impact of temperature on LED luminous efficiency and performance. Some researchers have also employed other methods to study the impact. A closed-loop negative feedback system is designed to reduce the influence of temperature on the spectrum of the light source, and the temperature spectrum compensation method of RGBY four-color LED light source is proposed based on visual and non-visual effects. The white LED for lighting is mostly obtained by blue excited yttrium aluminum garnet phosphor. However, its color temperature cannot be adjusted and color rendering is poor. A mixed white LED cluster can achieve dynamic adjustment of color temperature and high color rendering index. Therefore, the optimization method of multi-channel LED white light with tunable color temperature and high color rendering index has been extensively studied. However, the influence of the thermal effect on the optical parameters of a mixed white LED is rarely considered. Thus, this paper studies the impact of temperature on the spectrum of red/green/blue/warm-white (R/G/B/WW) four-color LED and obtains the spectral model with temperature change. Additionally, the spectral optimization model of R/G/B/WW LED mixed white light is built by the adaptive differential evolution (JADE) algorithm based on the temperature and duty ratio, and it is verified through experiments.MethodsThe experimental setup mainly consists of microcontroller (MCU), R/G/B/WW LED light source, integrating sphere, HASS-2000 spectral radiometer, and CL-200 temperature control device.Two R/G/B/WW four-color LED clusters are connected in series. The MCU can generate four different pulse width modulation (PWM) signals with specific duty ratios (DR, DG, DB and DWW) to achieve four-color LED mixed white light. The HASS-2000 spectral analysis system is adopted to measure the spectral power distribution (SPD) of each LED in the R/G/B/WW LED clusters, and the parameters of mixed white light including the luminous flux, color rendering index, and correlated color temperature. The stability of LED temperature is controlled by the CL-200 temperature control device. The temperature range is from 20 ℃ to 90 ℃ with error margin of ±0.1 ℃, and the temperature interval is 10 ℃. In addition, the driving output current of the R/G/B/WW four-color LED clusters is 350 mA and the driving voltage is 6 V. Eight groups of spectral power distribution curves of each monochrome LED light source with temperature between 20 ℃ and 90 ℃ and the interval of 10 ℃ are measured by experiments when the duty ratio is 1. Three modes of Gaussian, Gauss-Lorentz, and Bigaussian are utilized to study the temperature spectral model of LED light source respectively. Additionally, the spectral model changing with temperature can be obtained.Results and DiscussionsThe four-color LED mixed white light with color temperatures of 3000 K, 5000 K, and 6500 K is employed to verify the accuracy of the temperature spectrum model (Fig. 3). Based on the temperature spectral model, the SPDs at temperatures of 20 ℃, 60 ℃, and 90 ℃ are calculated, respectively. The results show that the SPD of the model with temperature change is approximately the same as the measured results (Fig. 4). According to the temperature spectrum model, the parameters of light source containing illuminance (EV), color rendering index (Ra), correlation color temperature (TC), blue light hazard factor (ηB), circadian action factor (CAF), and considering visual/non-visual effects can be calculated at different temperatures. Meanwhile, the calculation results are compared with the measured parameters of the light source at different temperatures (Table 2). The maximum deviation between the model parameters and measured parameters in the three LED light sources is 3.79%, and the chromaticity difference is less than 5.4×10⁻³. The light source spectrum and parameter values can change with the rising temperature (Fig. 5). Finally, the JADE algorithm is adopted to acquire the single channel duty ratio to optimize the light source spectrum and related parameters. At the above three LED light sources, the optimization duty ratio obtained by the JADE algorithm shows a linear relationship with the temperature. Based on the optimization model, the SPDs and parameter values of light source at different temperatures after optimization can be obtained. The optimized SPD is approximately the same as the light source spectrum at the initial temperature (Fig. 6), and the maximum relative error of the parameter values is 2.62% (Table 3).ConclusionsIn this paper, according to PWM dimming technology, the JADE algorithm is leveraged to study the spectrum optimization of R/G/B/WW LED mixed white cluster with temperature change. According to the temperature spectral model, the R/G/B/WW LED mixed white spectra changing with temperature are obtained. Based on the obtained mixed white light spectra at different temperatures, the spectral optimization model that can effectively adjust the spectrum of the light source at different temperatures is built in accordance with the compensation results of the JADE algorithm. After compensation, the measured spectra are basically consistent with those of the optimization model, and the maximum relative error of LED light source parameter values is 2.62%. This method can compensate for parameters of light source caused by temperature, and guide the optimal design of health lighting system. In future studies, the method of obtaining real-time junction temperature of LED chips should be further explored, and the feedback control system should be constructed to realize the dynamical compensation of the light source parameters.
ObjectiveSpectral imaging technology, capable of integrating images and spectra, is widely used and has developed rapidly in the fields of color imaging, cultural heritage, artwork research, etc. Traditional color replication technology uses related equipment for direct replication through RGB values, which is affected by the isochromatic spectrum and results in inaccurate color replication. For more accurate color reproduction, spectral reflectance can be used as a medium for color information transmission to ensure that the reproduced color is the same as the actual color. Spectral reflectance reconstruction is an important research topic in optics. Its purpose is to reconstruct the spectral reflectance of an object through the equipment-related RGB values obtained by various imaging equipment, which is independent of equipment and illumination. Some traditional reflectance reconstruction methods, such as the principal component analysis and the pseudo-inverse method, are still insufficient in accuracy. There are also some improved methods based on them. For instance, the reflectance reconstruction method using a single lighting image combined with the weighted pseudo-inverse method can reduce the collected lighting images, but the matching information between colors is less. Therefore, the requirements for experimental conditions become higher, and there may be a homochromatic phenomenon affecting the reconstruction accuracy. To reduce the complexity and cost of spectral reflectance reconstruction equipment and achieve more accurate reflectance reconstruction on the wideband spectra, this study improves the principal component analysis and reconstructs spectral reflectance by combining the weighting coefficient and error correction function.MethodsIn this paper, a wideband multispectral imaging method is adopted. The red, green, and blue light of a projector is used as the light source to illuminate the surface of an object, and the spectral images are sampled by a color digital camera. According to the Euclidean distance relation, the experimental samples are sorted, and the 31 samples most relevant to the test samples are selected as the locally optimal training samples. The weight factor is added on the basis of the principal component analysis, and an error correction item is introduced according to the pseudo-inverse method to correct the reflectance reconstructed by the weighted principal component analysis. The corrected reflectance is used as the final output. The improved method is used to reconstruct the reflectance of SG140 color cards, dyed paper, and oil painting surfaces to verify the accuracy.Results and DiscussionsThe improved method, principal component analysis, and weighted pseudo-inverse method are employed to reconstruct the reflectance separately. The results show that the experimental method has improved the accuracy of the reflectance reconstruction to different degrees after comparison. According to the reflectance of the reconstructed four pieces of dyed paper (Fig. 7), three kinds of data representing the reconstruction accuracy (Table 2), and the reflectance of some points on the reconstructed oil painting surfaces (Fig. 9) and its accuracy data (Table 3), the reflectance reconstruction accuracy of the painting and oil painting surfaces can also meet the expected requirements. According to the root-mean-square error data on the reflectance of the reconstructed SG140 color cards (Fig. 10), the root-mean-square error of the method in this paper is 2.4995, and that of the principal component analysis is 4.5812, while that of the weighted pseudo-inverse method is 3.4851. The proposed method significantly improves the reflectance reconstruction accuracy upon the improvement in the principal component analysis.ConclusionsIn the experimental analysis, three indexes (root-mean-square error, fitting coefficient, and spectral matching skewness index) are used to characterize the reflectance reconstruction accuracy and measure the reconstruction effect. The comparison with the principal component analysis and weighted pseudo-inverse method shows that the spectral reflectance reconstruction accuracy of the method in this experiment increases by about 45% on the basis of the principal component analysis. The color difference of SG140 color cards reconstructed by the three methods is further calculated, and the average value of the color difference is also smaller than that of the method proposed in this paper. The Euclidean distance between the training sample and the test sample is used to select the locally optimal training sample. When the number of samples is large, the amount of computation will be increased, which is not suitable for the situation requiring rapid reflectivity reconstruction.
ObjectiveElectrochromic technology has been widely applied due to its advantages of energy conservation, environmental friendliness, intelligence, and controllability, among which the industrialization of WO3-based electrochromic devices is most mature. However, in a conventional electrochromic device consisting of upper transparent electrode ITO/counter-electrode/electrolyte/WO3/lower transparent electrode ITO, the existence of counter-electrode layers not only reduces the transmittance of the device in the bleached state but also affects its cyclic stability due to incomplete matching of the electrochemical properties between the counter-electrode layers and electrochromic layers. Though the structures of electrochromic devices have been continuously optimized, the existing counter-electrode in WO3-based electrochromic devices cannot be solved. Therefore, this paper first prepares WO3 films by magnetron sputtering and then fabricates a brand-new curtain-like electrochromic device without a counter-electrode layer based on the "current-driven model". Highly controllable color changes are achieved in the curtain-like device, and influence of the counter-electrode on device performance is eliminated because the counter-electrode is no longer required. This research can provide new pathways for structure innovation of electrochromic devices.MethodsWO3 films are fabricated by magnetron sputtering of reactive radio frequency (RF) using a W target (purity of 99.99%), an Ar flow rate of 12 sccm (1 sccm=1 m3/min), and an O2 flow rate of 4.8 sccm. The substrates are clean ITO glasses with the sheet resistance of 8 Ω/sq. The employed RF power is 80 W, and the substrate heating temperature is 200 ℃. WO3 films at different thicknesses are obtained through different sputtering durations. Meanwhile, a 1 mol/L Li ion electrolyte is prepared by dissolving LiClO4 in polycarbonate (PC) solution. Finally, the curtain-like WO3-based electrochromic devices are fabricated by sealing the ITO glass, electrolyte, and WO3 film with the UV sealant. Scanned electron microscopy images of the WO3 films are taken on a Sigma 500 instrument (Zeiss) at 10.0 kV. Phase structures of the films and ITO substrate are examined by X-ray diffraction (XRD) analysis through Cu Ka radiation (Philips X' Pert diffractometer), and X-ray photoelectron spectra (XPS) are recorded by a Thermo Fisher Scientific ESCALAB 250Xi XPS system. Finally, cyclic voltammetry (CV) tests are carried out at the voltage range of -0.8-0.8 V at a scan rate of 100 mV/s on the electrochemical workstation (CHI760E), and transmittance spectra are recorded via the UV-Vis spectrophotometer (Hitachi F-4600, Japan).Results and DiscussionsFirstly, amorphous WO3 films with the thickness of 800 nm are prepared (Fig. 1) and are preferred for ion injection and extraction. The optical modulation rate at wavelength of 550 nm is as high as 78%, and decay rate of the storage charge density is only 3.5% after 1000 CV cycles, which is far better than reported (Fig. 2). Then, curtain-like WO3-based electrochromic devices are proposed to switch between being colored and bleached without a counter-electrode under the control of a flowing current in the bottom ITO layer (Fig. 3). Bezel between the storage area and the window area of the curtain-like device is designed by introducing an artificial fissure (Fig. 4). Additionally, effect of the WO3 film thickness on the response time, recovery time and cyclic performances of the device is investigated, and the results show that the best overall performances are realized at film thickness of 800 nm (Fig. 5). The size of the storage area is also explored, and when it is similar with that of the window area, the cyclic performances could be ensured (Fig. 6). Finally, the curtain-like WO3-based electrochromic device fabricated using the above-mentioned parameters shows a higher transmittance than conventional structured ones, with excellent memory effects (Fig. 7).ConclusionsThis paper prepares high-performance WO3 films by magnetron sputtering, whose modulation rate at a wavelength of 550 nm is as high as 78%, and decay rate of the storage charge density is only 3.5% after 1000 CV cycles. Then a curtain-like electrochromic device without a counter-electrode layer is designed based on the current-driven model, where the bezel, thickness of WO3 films, and size of the ion storage area are systematically optimized. Results show that an artificially-introduced fissure in the WO3 film can simultaneously increase the response time and modulation rate of the device, and facilitates the design of the working area bezel. The overall performances of the device are best when the WO3 film is at a thickness of 800 nm. The cycling life of the device can be guaranteed when the ion storage area and the working area are similar. Finally, with the employment of optimal designing parameters, the fabricated curtain-like WO3-based electrochromic device shows excellent performances, and the transparent transmittance at a wavelength of 550 nm is 76%, which is 9 percentage points higher than that of the conventional device with an 80 nm TiO2 film as the counter-electrode. Moreover, the device also shows an excellent memory effect with the colored transmittance at 20%, only increasing by 7.5 percentage points after being placed for 10 days. These characteristics result in the great application advantages of curtain-like devices in information encryption and famous painting protection. Compared with traditional structures, the curtain-like electrochromic device features a simple structure and highly controllable color-changing patterns, which can provide guidance for the structure innovation of electrochromic devices.
ObjectiveInfrared high reflective materials are widely employed to reduce surface emissivity. According to Kirchhoff's law, increasing the reflectivity of a material in the atmospheric window of mid- and far-infrared wavelengths can reduce the thermal radiation intensity of an object, thus decreasing the radiation difference between this object and surrounding environments. As a periodic structured functional material, photonic crystal (PC) has been extensively studied due to its extremely high infrared reflectivity and spectral compatibility. Various schemes have been designed in terms of PC film thickness and periodic structure to improve its forbidden band width and reflectance. However, there is a challenge to designing one-dimensional PCs for achieving the infrared high reflectance in 3-5 μm and 8-14 μm while minimizing the number of layers as much as possible. Therefore, this paper hopes to broaden the photonic forbidden band by constructing PC energy bands and adopting new material systems.MethodsDue to the action of the periodic potential field in semiconductor materials, electrons will form band structure and energy gaps exist between bands. However, photons in the periodic arrangement of dielectric materials will change their propagation properties and form a similar band structure. Based on Maxwell's equation, the propagation characteristics of electromagnetic waves in one-dimensional PCs are equivalent to superposition in multiple monolayer media. Since the wave vector k outside the Brillouin region is repeated, when the light wave reaches the boundary of the region, it is reflected back to the Brillouin region. After repeated reflections, a standing wave is formed, which constitutes the photonic band gap region. The upper and lower frequency regions are completely separated by the standing wave to form a photonic band gap. The light waves in the band gap cannot propagate, so the band gap in PC means high reflectance. Based on this, the transmission matrix of light waves is derived, and the PC band structure and band gap reflectance are calculated by MATLAB and CST software. According to the calculated results, the parameter is optimized and the new material system is adopted to design the one-dimensional PC model with better performance. The sample is prepared by the magnetron sputtering method for experimental verification.Results and DiscussionsFirstly, the optical properties of monolayer SiO2, ZnO, and Si films at room temperature are compared and analyzed (Fig. 3). SiO2 has a low refractive index at 3-5 μm, it is suitable as a dielectric layer in PCs. However, when the refractive index and extinction coefficient increase sharply at 8-14 μm, the PC reflectance with SiO2 as the low refractive index layer decreases greatly. The refractive index and extinction coefficient of ZnO vary less in the band of 2-14 μm, and it has a smoother reflectivity in 8-14 μm when employed as a low refractive index layer in PC (Fig. 7). In addition, the combination of one-dimensional PCs with different center wavelength structures can achieve 3-5 μm and 8-12 μm band infrared compatible high reflection. Based on this, 9-17 layers of PCs are designed and their infrared reflectances are compared (Table 1). Considering the performance of PCs and the process complexity and cost of multilayer film preparation, a 13-layer Si/ZnO one-dimensional PC is designed. The photonic band gap can be adjusted by changing the thickness of the film layer. Comparing the calculation results, it is found that the bandwidth range of each layer is optimal at one-quarter wavelength optical thickness. The structure is optimized and the final designed PC structure is shown in Fig. 7(a). The relations of the reflection spectrum with incident angle (Fig. 8) and the electric field intensity distribution of incident electromagnetic wave in PC (Fig. 9) are calculated, indicating that the structure possesses a very high infrared reflectance while being stable to the incident angle.ConclusionsIn this paper, a new one-dimensional PC for infrared high reflectance is designed based on the energy band theory. According to Maxwell's theory, the reflectances of the 3-5 μm and 8-12 μm forbidden bands of PC under the dispersion conditions are derived and calculated. A comparison of two material systems, Si/ZnO and Si/SiO2, reveals that the material with smaller dispersion can form more stable photonic forbidden bands. The selection of Si/ZnO is beneficial to achieve high infrared reflectivity in the 3-5 μm and 8-12 μm forbidden bands. Finally, a 13-layer Si/ZnO one-dimensional PC is designed and prepared. The results show that the reflectance is greater than 91.3% in the infrared bands of 3-5 μm and 8-12 μm. The experimental results are in good agreement with the simulation results, which verifies the high reliability of the model and theory.
ObjectiveTitanium dioxide (TiO2) photonic crystals can be applied to prepare guided-mode resonance (GMR) filters that allow gratings to have high reflectance at resonance wavelengths. A GMR filter is a photonic crystal resonant reflector with a perfect resonant reflection of incident light with specific polarizations in arbitrarily narrow bands while allowing the light in other wavelengths to pass through. In China, few studies have been conducted on GMR filters prepared from TiO2 films. The current research on GMR filters mainly focuses on the design of GMR filters, such as sub-wavelength grating GMR filters with tunable resonance wavelengths, but their structures are more complex, which makes device fabrication difficult to be realized. In this work, a GMR filter is prepared by depositing a thin film of TiO2 on a two-dimensional patterned photonic crystal grating structure as an optical waveguide layer by atomic layer deposition (ALD). The device can produce high reflectance at the resonance wavelengths. The band of resonance wavelengths is sensitive to the refractive index of the filling material in the grating region. By controlling the refractive index of the TiO2 film, the resonance wavelength of the device can be precisely controlled, and an efficient and controllable narrow linewidth filter can be prepared.MethodsIn this present experiment, TiO2 films are deposited on a two-dimensional patterned quartz glass by the ALD technique, and then the prepared TiO2 films are annealed at different temperatures to have different refractive indices. Then we simulate the reflection spectrum of the filters by using the rigorous coupled wave algorithm (RCWA). In addition, we use a D8 X-ray diffractometer (XRD) from Bruker for the phase identification and structure analysis, a SIGMA 500 field emission scanning electron microscope (FESEM) from ZEISS for microstructure analysis, an ICON2-SYS atomic force microscope (AFM) from Bruker for surface roughness analysis, and a spectroscopic ellipsometer (SE 850 DUV) from Sentech for thickness and refractive index analysis of the thin film samples.Results and DiscussionsThe prepared TiO2 thin film samples show tetragonal anatase structure at the anneal temperatures of 200 ℃, 300 ℃, and 400 ℃, and no other characteristic peaks are found (Fig. 1). The grain sizes of the prepared TiO2 thin film samples at the anneal temperatures of 200 ℃, 300 ℃, and 400 ℃ are calculated to be 380.2 ?, 390.3 ?, and 423.6 ?, respectively, by using Scherrer's formula (Table 1). The intensity of the characteristic peaks of the TiO2 thin film samples gradually becomes higher with the increase in the annealing temperature, which indicates that the crystalline quality of the prepared samples becomes better. The FESEM and AFM photographs show that the surface of all the samples is flat and smooth, with a surface roughness of less than 0.4 nm, which indicates that the prepared thin film samples have positive denseness and flatness (Fig. 2 and Fig. 3). The thickness of the TiO2 films is 80.5 nm, 80.7 nm, and 80.8 nm after annealed at 200 ℃, 300 ℃, and 400 ℃, respectively, and the thickness of the films is independent of the annealing temperature. By changing the refractive index of the TiO2 film, the resonance wavelength of the device can be precisely controlled, and a high reflectance close to 100% at the resonance wavelength can be achieved for the application in high-efficiency narrow linewidth filters (Fig. 4). As the refractive index becomes larger, the shape of the reflection spectrum does not change, and the resonance wavelength is gradually red-shifted with resonance peaks of 946.9 nm, 959.4 nm, and 967.9 nm, respectively, and the position of the resonance peak changes within 22 nm, with full widths at half maximum of 0.74 nm, 0.77 nm, and 0.79 nm, respectively, and there is almost no change in the sideband reflectivity (Fig. 6). Therefore, by changing the refractive index of the waveguide layer TiO2 film, a narrow linewidth GMR filter can be designed for the required resonance wavelength.ConclusionsIn this paper, high-quality TiO2 films with different refractive indices are prepared on a two-dimensional patterned quartz glass by the ALD technique and annealed at different temperatures. The XRD and AFM test results show that the TiO2 films have an anatase structure, and their surface roughness is less than 0.4 nm at an annealing temperature of greater than 200 ℃. Different anneal temperatures change the refractive index of TiO2 films. The effect of the refractive index on the resonance wavelength is analyzed by the RCWA. By changing the refractive index of the TiO2 film of the optical waveguide layer, the position of the resonant peak can be effectively controlled. As a practical application example, we design a GMR filter that can control resonance wavelength in the range of 946.9-967.9 nm, and a narrow linewidth (less than 0.8 nm) is always maintained within the scope of usage. By using this method, one can achieve precise control of the resonance wavelength peak, which is beneficial to the practical application of future devices.
ObjectiveAnti-reflection (AR) is important in enhancing the display effect of display panels and the photovoltaic conversion efficiency of solar cells. The construction of AR structures using hollow silica (SiO2) particles (HSPs) as an effective method has been attracting related researchers. Plastic substrates, represented by polycarbonate (PC) and polymethyl methacrylate (PMMA), have broad market potential in replacing inorganic glass. However, due to the great differences between the surface properties of plastic substrates and inorganic materials, many AR coating technologies that can be easily industrialized on inorganic materials are difficult to be transferred to plastic substrates. In this context, a big challenge in constructing AR structures on plastic substrates is how to fix HSPs on organic substrates at low temperatures. Anchoring HSPs with low-temperature curable resin is a very promising strategy for industrialization with low cost and easy operation. However, the quality of AR coatings prepared by this strategy is greatly affected by the physical and chemical properties of the coating solution and the complex hydrodynamic effects during coating and drying. Many factors should be considered and optimized to obtain AR coatings with excellent performance. There are too many uncertain factors, long optimization cycle, and poor repeatability and reliability, so optimizing conditions by experimental methods willbe time-consuming and laborious. In contrast, optimizing the surface structures through simulations has incomparable advantages over traditional experimental strategies. The simulation results can point out the direction for further experimental research and accelerate experimental processes.MethodsThe effects of HSPs and HSP-solid SiO2 particle hybrid on the optical properties of as-prepared AR surfaces in the visible light range are studied by COMSOL Multiphysics. Some specific factors are examined, including the diameter of HSPs, hollowness degree, spacing between particles, resin coverage height, incidence angle, and particle arrangement pattern. A three-dimensional model is employed for simulation. The model consists of PC substrate, HSPs, resin (PMMA), and air. The minimum cell structures are studied under periodic boundary conditions. Three patterns of particle arrangements are considered (Fig. 1): square lattice arrangement, where HSPs are arranged in the X-Y plane in a square lattice; hexagonal lattice arrangement, where HSPs are arranged in the X-Y plane in a hexagonal lattice; HSP-solid SiO2 particle hybrid arrangement, where small size solid SiO2 particles are inserted into the gaps of HSP hexagonal lattice. For the square lattice arrangement, the effects of some factors on the reflectivity of the coatings are investigated, including the HSPs' size, the HSPs' hollowness degree, spacing between particles, the height of resin coverage, and incidence angle.Results and DiscussionsWhen the HSPs with a radius of 10-100 nm and hollowness of 0.7 are arranged in the form of square lattice and the resin covers half the height of the particles, coatings with low reflectance in the visible light range (380-780 nm) can be obtained (Fig. 2). The coating with the best AR effect is the one using HSPs with hollowness of 0.7. The hollowness is defined as the ratio of cavity radius to particle radius. Smaller spacing between particles facilitates lower reflectance over a broader wavelength range. When the radius of HSPs is 100 nm and the resin coverage height is 100-125 nm, the coating has the lowest reflectance in the whole visible light band (Fig. 3). The reflectance of the coatings constructed by all sizes of HSPs is lower than that of the bare PC substrate in the incidence angle range of 0°-85° (Fig. 4). For those three different patterns, the reflectance at 550 nm is 0.17% for square lattice arrangement, 0.03% for hexagonal lattice arrangement, and 0.12% for HSP-solid SiO2 particle hybrid arrangement. The average reflectance in the visible light range (380-780 nm) is 0.57% for square lattice arrangement, 0.51% for hexagonal lattice arrangement, and 0.24% for HSP-solid SiO2 particle hybrid arrangement, respectively. The changes of effective refractive indexes in the Z-direction are calculated by effective medium theory under different resin coverage heights, different degrees of hollowness of HSPs, and three particle arrangement modes. The results show that the HSP-solid SiO2 particle hybrid arrangement has one more refractive index variation gradient than the other two arrangement modes in the height of 0-40 nm (Fig. 6). However, since the effective medium theory can only qualitatively explain part of the results, the simulation via COMSOL Multiphysics is a strategy that can quickly and accurately optimize the experimental scheme of AR coatings.ConclusionsThe AR performance of coatings constructed by resin-anchored SiO2 particles is studied by COMSOL Multiphysics. The results show that the average reflectance of the coating constructed by HSPs (radius of 100 nm, hollowness degree of 0.7) arranged in a square lattice can be reduced to 0.57% in the visible light band. Compared with the bare PC substrate, the reflectance of the coating is reduced by 79.7% with the incidence angle of 0°-75°. The conditions such as hollowness degree of 0.7-0.8, resin coverage height of half the height of HSPs, and small spacing between particles are favorable to the construction of surfaces with outstanding AR performance. The hexagonal lattice arrangement of HSPs results in lower reflectivity in the 500-780 nm band, while the square lattice arrangement leads to lower reflectivity in the 380-500 nm band. When the gaps between the HSPs arranged in hexagonal lattice mode are doped with solid SiO2, the AR performance of the coating can be further improved in a broader wavelength range, and the average reflectance in the whole visible light range can be as low as 0.24%. Finally, the effective medium theory is adopted to further explore the AR mechanism of the coating. Some qualitative results are consistent with the simulation results.