


Please enter the answer below before you can view the full text.
7+1=

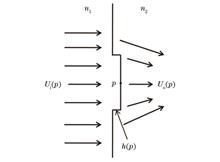
ObjectiveCompared with the traditional optical elements, diffractive optical elements (DOEs) have many advantages, such as light weight, flexible design, and unique dispersion. Greatly promoting the miniaturization and lightweight of optical systems, DOEs are widely used in laser communication, laser radar, space imaging, high-precision optical testing, and other fields. The high-precision analysis of light field modulation by DOEs is a key point in the application of DOEs. However, most optical design software calculates the deflection of light by DOEs with the grating equation model, ignoring the physical structure of DOEs. The quantitative analysis of the comprehensive performance of the system has defects, especially the analysis of energy utilization, stray light, and other performance. The thin element approximation (TEA) model based on the scalar diffraction theory is widely employed to quantitatively analyze the complex-amplitude transmittance, diffraction efficiency, and other properties of DOEs. When the microstructure size of a DOE is larger than 10 times the wavelength, the TEA model can obtain comparatively accurate results. However, the error increases rapidly as the microstructure size gradually approaches the order of magnitude of wavelength. The vector diffraction theory using mathematical tools to strictly solve Maxwell equations is a perfect solution for high-precision analysis of DOEs. Unfortunately, strict vector diffraction calculation involves a large amount of data and is thus generally applicable to small-size elements only. When the diffraction phenomenon of the microstructures is analyzed by the strict vector diffraction theory, violent oscillation of the light field is only observed at the positions with abrupt changes in height. Due to this phenomenon, the paper equates the effect of step microstructures on light wave modulation with step response functions and synthesizes the modulation effect of the DOE as the coherent superposition of multiple step response functions (STEP-RFs). When the incident light wave and the step microstructure have space-invariant characteristics, the modulation of the incident light wave by a large-size element can be quickly obtained by this method. The proposed method is expected to serve as a practical solution for high-precision and rapid analysis of large-aperture DOEs and promote the engineering application of such DOEs.MethodThe surface microstructures of most DOEs can be decomposed into multiple step structures. For example, the boss structure in Fig. 1 can be decomposed into a rising-edge step and a descending-edge step. Then, the modulation of the incident light field by the step structures is calculated by the vector diffraction theory and solidified into a step response function. Finally, the step response functions of all steps are synthesized into the response of the DOE according to the principle of coherent combination of the light fields. For large-aperture diffractive elements, this paper only needs to find out the characteristic step structures and conduct vector analysis of the characteristic steps by the strict vector theory to obtain the response functions before synthesizing the light field distribution after the incident light field is modulated by the DOE by the above method. Sub-window splicing is the most direct and effective strategy for light field synthesis for large-aperture DOEs. To ensure the influence of a step structure on the light field of adjacent sub-windows, the overlapping area of the sub-windows must be larger than half of the range of the response function.Results and DiscussionsSpecifically, the three main factors affecting calculation accuracy, i.e., the minimum linewidth of microstructures, the range of the response function, and the step positioning error, are studied. To quantitatively evaluate the calculation accuracy of the proposed response function method, this paper uses the results calculated by the finite-element method (FEM) as a reference to calculate the relative errors in amplitude and phase point by point and takes the root-mean-square (RMS) value of the relative errors as the quantitative evaluation index. When the range of the response function is larger than 7λ, the relative-error RMS of the light field tends to stabilize with small fluctuations (Table 1). Even when the minimum linewidth of the microstructure reaches one time the wavelength, the combined relative-error RMS of the amplitude and phase is kept below 6.1% (Fig. 3). The relative-error RMS increases linearly with the positioning error approximately (Fig. 5). When the positioning error is kept below 30 nm, the relative-error RMS increment of light field amplitude remains smaller than 5%, and the relative-error RMS of phase remains below 2%. For the further evaluation of the far-field characteristics of this method, the far-field distribution of the 2-level Fresnel lens is calculated by the Kirchhoff diffraction integral formula on the basis of the near-field obtained by the STEP-RFs. The diffraction efficiency and the characteristics of the point spread function are analyzed, as shown in Table 3. Compared with the results calculated by the FEM, the maximum relative light intensity error of the lens calculated by the proposed response function method is 1.8%, and the maximum relative error in diffraction efficiency is 1.64%. In addition, the calculation efficiency of the STEP-RFs is at least 1500 times higher than that of the COMSOL software (Table 5).ConclusionsThis paper proposes a fast and high-precision analysis method for large-aperture DOEs with variable periods. The minimum linewidth of the microstructure, the range of the response function, and the step positioning error are three main factors that affect calculation accuracy. The numerical calculation results show that a smaller minimum characteristic size of the microstructure corresponds to a larger calculation error. When the minimum linewidth of the microstructure is close to one time the wavelength, the relative-error RMS is smaller than 6.1%, and the accuracy is still high. When the range of the response function is larger than 7λ, the relative-error RMS of the light field tends to stabilize with small fluctuations. The relative-error RMS increases linearly with the positioning error approximately. When the positioning error is kept smaller than 30 nm, the relative-error RMS increment of the light field amplitude remains below 5%, and the relative-error RMS of phase remains smaller than 2%. The positioning error is inevitable in the calculation of large-aperture diffractive elements. Nevertheless, even if a positioning error smaller than 25 nm is present, the differences between the maximum light intensity and diffraction efficiency of the far field and the results of strict vector theory analysis are still smaller than 2%, and the accuracy is still high. At last, the computational efficiency of the proposed method is at least 1500 times higher than that of the COMSOL software, and the efficiency improvement effect is more salient for larger apertures.
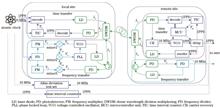
ObjectiveHigh-precision time and frequency transfer plays an important role in frontier scientific research and major science and technology infrastructure projects, such as astronomy and geodetic surveying. At present, two-way satellite time and frequency transfer (TWSTFT) and satellite common-view (CV) are primarily applied for the transfer and synchronization of time and frequency signals from different time-keeping clocks. However, these conventional methods, which are based on radio transmission, are unable to satisfy some customers' unique requirements for ultra-high accuracy, stability, and security. Compared with the global navigation satellite system (GNSS)-based time transfer and long-wave time transfer, optical fiber time transfer has the advantages of low loss, low noise, and anti-electromagnetic interference. The bidirectional signal transfer characteristic of single optical fiber ensures a highly symmetric time delay of a bidirectional signal. For this reason, the optical fiber time delay can be compensated to pave the way for picosecond time transfer and frequency transfer. This research is expected to achieve the high-precision common optical fiber transfer of a 1PPS time signal and a 10 MHz frequency signal and ultimately meet the requirements of long-range comparison among time and frequency standards with hydrogen atomic clocks as time-keeping clocks.MethodsTo fulfill the engineering application requirements of atomic clock time and frequency comparison, this paper designs an optical fiber time and frequency transfer system based on a wavelength division multiplexing scheme. The methods of dual-wavelength bidirectional comparison and remote site compensation are applied to the time transfer. The time delay of the optical fiber link and its change are measured in real time, and a time-delay phase controller is used at the remote site to compensate for the time delay of the optical fiber link. In this way, the 1PPS signal output at the remote site is accurately synchronized with the reference 1PPS signal at the local site. The information, such as the comparison data, is loaded onto the optical carrier by the encoding technology to achieve information transfer. The transfer of the comparison data by additional links is thereby avoided. The single-wavelength pre-compensation method is employed for the frequency transfer, and phase detection and compensation are carried out at the local site. The phase of the transmitted frequency signal is controlled by a phase-locked loop to compensate for the time delay shift and phase noise caused by the optical fiber link. On this basis, the remote site outputs a 10 MHz frequency signal that is stable relative to the reference frequency signal. The remote-site equipment is connected with the local-site equipment by the standard single-mode optical fiber. The high-precision common optical fiber transfer of the 1PPS time signal and the 10 MHz frequency signal is achieved by wavelength division multiplexing. The fixed time delay of the equipment is further corrected to ensure the high-precision synchronization between the input and output time signals of the system.Results and DiscussionsTo test the noise floor of the equipment, this study presents a test system constructed in the laboratory, which uses short optical fiber to connect the local-site equipment with the remote-site equipment. The test results show that the time transfer stability can reach 4.2 ps@1 s, 1.6 ps@10 s, 0.84 ps@100 s and 1.2 ps@104 s. The stability of 10 MHz frequency transfer can reach 1.9×10⁻¹⁴@1 s、4.2×10⁻¹⁵@10 s and 4.8×10⁻¹⁶@104 s and is thus much better than that of the hydrogen atomic clocks, which reaches 1×10-13@1 s. Finally, an optical fiber time and frequency transfer test is carried out on a 102-km field optical fiber link, and the stability of 10 MHz frequency transfer is 3.4×10⁻¹⁴@1 s and 1.5×10⁻¹⁵@104 s. Time transfer with the stability of 15.7 ps@1s and 3.9 ps@1000 s, and the uncertainty of 25.3 ps is accomplished by correcting the time delay and dispersion of the equipment.ConclusionsIn the present study, high-precision transfer of a 1PPS time signal and a 10 MHz frequency signal on a field optical fiber link is achieved by dense wavelength division multiplexing (DWDM). The methods of dual-wavelength bidirectional comparison and remote-site compensation are applied to the time transfer, which raises transfer precision to more than 30 ps on a 100-km optical fiber link. The single-wavelength pre-compensation method is employed for the frequency transfer, and the stability of the 10 MHz frequency transfer achieved is superior to that of a hydrogen atomic clock. Finally, the development of the equipment is completed to satisfy the requirements of long-range comparison among time and frequency standards with hydrogen atomic clocks as time-keeping clocks.
ObjectiveOptical tweezers were first proposed by Arthur Ashkin in 1986 and were first used in the biological science field in the late 1980s. Since then, optical tweezers have been applied to atomic physics, micromachining, chemistry, biomedicine, and microelectromechanical systems. Meanwhile, on the basis of application development, other new optical tweezer systems such as femtosecond and vacuum laser systems have also been derived. In addition, they have been widely combined with new biomedical technologies in recent years and used for pathological detection of cells, single-cell microsurgery, and designs of biological lasers, cell-based biological photonic waveguides, and biological micro-lenses by using biological entities such as viruses, cells, and tissues. With the rapid development of the microoperation field, functional requirements of fiber optic tweezers are becoming higher and higher, so it is particularly important to improve their utilization efficiency and integration. A variety of methods have been proposed to transport particles, and some of which are made by using double optical fibers to capture cell chains and make a conveyor belt. Some pull the bending port to enhance the evanescent field, while others pull micro-nano fibers and control the power of two lasers to transport them. Most of them transport particles over optical fibers, but optical tweezers with directional emission functions are less involved. Moreover, the use of dual fiber probes requires an extremely precise operation to prevent bending, and it takes time to capture cells when assembling long conveyor belts. Or the bending degree and flame conditions required by nanofibers make it difficult to fabricate fiber ports and thus need to consider repeatability and other issues. To solve the above problems, this paper designs a fin dolphin-shaped fiber optical tweezer structure, which combines with a high-order LP21 mode to realize the function of a fiber conveyor belt. This method is simple and provides a new possibility for optical fiber manipulation.MethodsIn this paper, a light source of 650 nm is fed into a high energy ratio LP21 mode in a G.652D fiber with a typical operating wavelength of 1550 nm. The characteristic of the LP21 mode light field is that the outgoing direction is biased towards the central axis and extends symmetrically around, which forms a light field with a unique four-petal center symmetric intensity distribution. Moreover, the high-order four-petal LP21 mode beam has the intensity distribution of high transmission stability in the fiber, and the bending and torsion of the transmission fiber can hardly cause the deformation of the intensity distribution of this mode. In addition, the stiffness of the axial optical trap in the four-beam optical trap is stronger than that in other modes, which not only ensures the stability of the axial capture but also improves the stability of the transverse capture. Therefore, the LP21 mode beam is used in this paper to capture and transport particles. In addition, in order to ensure the stability of particle transport, a fin dolphin-shaped fiber probe is designed, which has a smooth flow arc shape and extends the tip forward, so as to converge the diverging laser on both sides of the fiber. At the same time, this paper makes an ordinary conical fiber for comparative experiments to study the transportation performance of the fin dolphin-shaped fiber and measures the transportation speed of the two kinds of fiber under high and low power. A glass capillary tube is used as the target location for particle transport. The feasibility of the experiments is analyzed by the finite element method.Results and DiscussionsThe experimental and simulation results show that the evanescent field at the sudden change of the diameter of the fin dolphin-shaped fiber is significantly enhanced, and it extends from the arc to the top of the tip, with a strong lateral capture force. Compared with common tapered fibers, the evanescent field near the tip is the strongest. With the increase in the tip distance, the diameter gradually increases, and the light field gradually weakens. Furthermore, the focusing region near the top is shifted to both sides. Therefore, in the particle transportation process, the evanescent field is too weak in the early period, which results in a small light trapping force, and particles are not easy to be captured or escape. In the late period, when particles are near the top, it is easy to deviate from the course and be away from the tip, which brings difficulties for the directional emission of subsequent particles. Several comparative experiments are carried out under different optical power. The results show that the fin dolphin-shaped fiber has more advantages in transportation speed and stability.ConclusionsIn this paper, we design a fin dolphin-shaped fiber optical tweezer structure and enhance the optical field intensity of the side edge of the fiber through a high-order LP21 mode beam to achieve the function of a fiber conveyor belt, and particles are finally transported to the tip for ejection. The finite element method is used to simulate the intensity distribution of the optical field, which shows that the arc structure at the fiber port has significantly enhanced the evanescent field intensity at the side of the fiber. The influence of the side trapping force on the particle transport speed is analyzed by comparing it with conventional conical fiber. The results show that the special structure of the fiber is superior. It expands the direction of the combination of particle transport and particle emission and provides a new possibility for the research on new fiber optic tweezers and the biological cytology field.
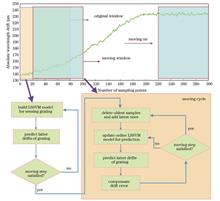
ObjectiveTunable Fabry-Perot (F-P) filters powered by piezoelectric ceramics are prone to hysteresis and temperature drift in fiber Bragg grating (FBG) sensing systems. The demodulated wavelength of tunable F-P filters may produce significant drift during long-term monitoring, which exerts a significant impact on the measurement accuracy of FBG sensing systems. Incorporating a hardware calibration module into the FBG sensing system, including the reference grating method, gas absorption line method, F-P etalon method, and composite wavelength reference method, is the current way of error compensation for the tunable filter. These techniques can successfully reduce the drift error of tunable filters, but typically increase the technical complexity, structural complexity, cost, and even unidentified problems. As a result, it is now practical and affordable to employ a software compensation technique to predict and correct the output drift error of the tunable filter induced by hysteresis and temperature fluctuations. Unfortunately, the output drift error trend of tunable filters over time cannot be accurately tracked by conventional offline models, which limits the model's capacity to make up for it. Therefore, based on least squares support vector machine (LSSVM) and numerous reference gratings, this study proposes a dynamic compensation approach for tunable filter demodulation errors.MethodsFour FBGs (FBG0, FBG1, FBG2, and FBG3) are employed for the reference and sensing gratings in this study. Firstly, the experimental environment's direct temperature-related values are chosen to serve as the dynamic compensation model's input characteristics. The high association between the wavelength drift errors of each FBG in the tunable filter's output spectrum is also thoroughly taken into account in this study. The drift of the reference grating is adopted in this study as one of the input features of the dynamic compensation model to compensate for the absence of precise temperature information inside the F-P cavity. This study employs moving window technology to continuously update the input and output feature quantities of the model and rebuilds the error compensation model to realize real-time prediction and compensation of the most recent drift error of the filter, thus preventing the model performance from degrading. It also highlights how the dynamic model's performance is affected by the moving window's length, the number of reference gratings, and the characteristic wavelength's separation between the reference grating and the sensing grating. The aforementioned approach has been validated in several temperature variation modes.Results and DiscussionsFirstly, FBG3 positioned in the top of the FBG arrangement distribution receives error compensation (Table 2). In the cooling mode, the maximum absolute error after dynamic compensation reduces from 39.12 pm to 2.53 pm as the number of reference gratings increases. As the number of reference gratings rises in the cooling-heating mode, the maximum absolute error after dynamic compensation falls from 77.02 pm to 8.78 pm. Secondly, FBG2 at the center of the FBG arrangement distribution receives error compensation (Table 3). In the cooling mode, the maximum absolute error after dynamic compensation reduces from 33.65 pm to 3.63 pm as the number of reference gratings in the dynamic model input features rises. The maximum absolute error after dynamic compensation falls from 69.25 pm to 7.84 pm in the cooling-heating mode as the number of reference gratings grows. The aforementioned findings demonstrate that as the number of reference gratings grows, the dynamic model's compensation accuracy gradually increases. Additionally, the experimental findings regarding the characteristic wavelength's distance between the reference grating and the sensing grating indicate that, for the same number of reference gratings, the closer characteristic wavelengths of the reference grating and the sensing grating leads to better compensation capacity of models whose spectral position is adopted as the input feature.ConclusionsFirstly, this paper adopts the moving window technique as the foundation for building the online drift soft compensation model to prevent performance degradation of the initial model. Then, the experiment builds a nonlinear model between the surface temperature of the filter and the output drift error using the spectral locations of several reference gratings as the input features. The effectiveness of the model is also discussed concerning the moving window's length, the variety of reference gratings, and the characteristic wavelength's distance between the reference and sensing gratings. The experimental results on two datasets with various patterns of temperature variation show that the model's compensation capacity grows as the window length and the number of reference gratings do. Additionally, when the number of reference gratings is the same,the characteristic wavelengths of the reference grating and the sensing grating are closer to one another,and the dynamic model's compensation capacity is greater. In addition to the current hardware compensation method, the online dynamic soft compensation method presented in this study offers a fresh idea for real-time dynamic compensation of F-P filters' output drift errors.
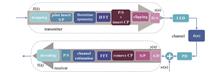
ObjectiveIt has been widely noticed that visible light communication (VLC) has the advantages of anti-electromagnetic interference, abundant spectrum resources, and low cost. This paper introduces an efficient asymmetrically clipped optical orthogonal frequency division multiplexing (ACO-OFDM) modulation method to accommodate visible light communication systems using orthogonal frequency division multiplexing (OFDM) with positive real number constraints. However, the signal is easily distorted by multi-path interference of the channel during transmission, which results in poor communication quality of the VLC system. The VLC system mainly recovers the signal by obtaining the channel state information, and how to provide accurate feedback on the high-dimensional state information is particularly important to improve the communication quality of the VLC system. The commonly employed channel estimation method is based on the guide frequency assisted method. Among the existing methods, least squares (LS) method treats the channel as an ideal one and ignores its noise for channel estimation. Despite low complexity, the estimation accuracy is not high. Minimum mean square error (MMSE) is utilized for channel estimation due to the assumption that the second-order statistical information of the channel is known and adopted for channel estimation, but the estimation accuracy increases with the complexity. Deep learning provides a new solution for accurate feedback of channel state information, but few deep learning methods for channel estimation in ACO-OFDM systems have been reported. To improve the problems of low estimation accuracy and efficiency, and a large number of leads in channel estimation of ACO-OFDM systems, this paper proposes a deep neural network channel estimation method to improve the communication quality of the system.MethodsA deep neural network (DNN)-based channel estimation method is proposed for the channel estimation of the ACO-OFDM visible light communication system. Within this scheme, an end-to-end approach is applied to implicitly estimate channel state information and directly recover distorted signals. The DNN network is divided into an offline training phase and an online implementation phase. In the offline training phase, the fast Fourier-transformed received signal at the receiver is leveraged as the input of the DNN network, and the original transmitter signal is the ideal output of the network. The mean square error (MSE) is adopted as the loss function of the network to minimize the MSE between the network output and the ideal output. The well-trained DNN model is then implemented in the ACO-OFDM system for online deployment. In addition, with an aim to accelerate the DNN network training and ensure that the model can make accurate predictions on the test data, the DNN network is optimized through gradient centralization (GC), which is embedded in the optimizer for processing and acts on the gradient of the weight vector to constrain the loss function. The estimation accuracy of the DNN-based ACO-OFDM channel estimation method is further improved to enhance the communication performance of the system.Results and DiscussionsThe effectiveness of the proposed method is verified by the relationship between the performance indexes of bit error rate (BER) and MSE and signal noise ratio (SNR). The conventional methods of least squares (LS) and MMSE are selected as the comparison algorithms. The parameters of the system are set as shown in Tables 1 and 2. The convergence speed and MSE of the DNN network after the introduction of the gradient concentration (GC) method are better than those of the DNN network using the classical gradient descent method (Fig. 5). When channel estimation is performed at 8 pilots and 64 pilots, the method in this paper shows the best BER performance compared with other methods. At 8 pilots, the LS and MMSE methods are no longer effective for channel estimation. At 64 pilots and BER of 10-1, the proposed method improves the SNR gain by 10 dB and 4.2 dB compared to LS and MMSE (Fig. 6). The proposed method also exhibits the best MSE performance at different pilots, which indicates that the proposed method is robust to the pilots and can obtain better estimation performance at fewer pilots, thus improving the spectrum utilization (Fig. 7). The robustness of the pilots is analyzed, and the BER and MSE performances of the proposed method are not affected by the pilots (Fig. 8). Cyclic prefix (CP) is important for OFDM systems, but the CP inclusion in the system reduces the data transmission rate and wastes time and efforts. The BER performance of the proposed method is not affected when analyzing with/without CP, but the conventional method can no longer work properly without CP. The proposed method improves the SNR gain by 19.1 dB and 11.9 dB at a BER of 0.266 compared to the LS and MMSE methods respectively (Fig. 9). This shows that the proposed method does not significantly affect the channel estimation by removing CP and reduces the dependence of inter-symbol interference and inter-carrier interference on CP. The gradient centralization optimized DNN method outperforms the DNN method with the classical gradient descent method in terms of BER and MSE performances.ConclusionsTo address the problems of low accuracy and inefficient channel estimation facing traditional methods, this paper proposes a DNN-based channel estimation method. The simulation results show that the BER and MSE performances of this method are significantly improved compared with the traditional methods of LS and MMSE. The method is applicable to the channel estimation of the visible light communication system and is important to improve the performance of the visible light communication system. Additionally, it still works well under less guide frequency and removing. The proposed method has better spectral utilization and stronger robustness than the DNN model optimized by the classical gradient descent algorithm, and the DNN model optimized by gradient centralization has higher convergence speed and better MSE performance than the DNN model optimized by the classical gradient descent algorithm. In summary, the proposed method provides an effective channel estimation reference scheme for visual light communication systems to achieve high spectrum utilization and reliability.
ObjectiveSince its inception, ghost imaging technology has drawn wide interest and has been reported in many application scenarios due to its advantages, including strong anti-scattering capacity, lens-free imaging, and off-object imaging. In practice, however, ghost imaging technology still struggles with a number of fundamental issues, such as reliable signal recognition and quick imaging in challenging situations. These requirements call for more sophisticated algorithms, as well as hardware design and control. In this study, we design and develop a sequence-controlled ghost imaging system on the basis of the pseudothermal light ghost imaging technology scheme, which can achieve high-quality imaging under various conditions by precisely controlling the main components of the system. Apart from the fundamental correlation imaging algorithm, this system presents three more imaging algorithms, namely, differential ghost imaging, normalized ghost imaging, and positive-negative correlation imaging. A secondary optimization scheme for the images reconstructed by the positive-negative correlation algorithm is proposed to further improve the imaging quality. For the development of ghost imaging systems for a larger range of applications and more complicated situations, we hope that our system can serve as a model.MethodsIn this paper, the sequence control capability of the ghost imaging system and the algorithm's optimization impact on the imaging quality are demonstrated through comparison tests. Figure 1 (a) is the schematic diagram of the pseudothermal light ghost imaging system. Figure 1 (b) is the GUI interface of the system, through which the operations of the system can be directly controlled, such as the position of the displacement platform, the speed of the ground glass, the sampling times, and the imaging algorithm. The synchronous control of the system and the control of the electric displacement platform are realized by the control unit while the signal acquisition is completed. In addition, the differential ghost imaging, normalized ghost imaging, as well as positive-negative correlation algorithm and its optimization algorithm, are integrated to further improve the performance of the ghost imaging system.The system's sequence control performance is empirically demonstrated by research on the precise control of the speckle size and the sufficient sampling times for higher-quality imaging under different conditions. Comparison experiments of traditional ghost imaging, differential ghost imaging, normalized ghost imaging, and positive-negative correlation imaging and its optimized algorithm are conducted for various objects to verify the optimization effect of the system's algorithm on the imaging quality.Results and DiscussionsThe system improves the imaging quality via both precise hardware control and an optimized algorithm (Fig. 1). The research shows that the speckle size of the object surface directly affects the imaging quality, and this system can accurately adjust the speckle size by controlling the relevant components to image objects of different sizes with the optimal resolution. In the experiment, two objects of different sizes are selected; the speckle size is adjusted, and the imaging with different speckle sizes is compared. The effect of the speckle size on the imaging quality and the optimal speckle sizes corresponding to different objects can be found through observations of the quality curves (Figs. 2 and 3). In addition, since traditional pseudothermal light ghost imaging requires sufficient sampling to achieve higher-quality imaging, the system generates a large amount of effective data by controlling the position of the rotating glass to satisfy this requirement (Figs. 4 and 5). Meanwhile, different imaging algorithms are combined in the system to optimize the imaging effect to a certain extent for different objects. In the comparison experiments of traditional ghost imaging with differential ghost imaging and normalized ghost imaging, the optimization effects of differential ghost imaging and normalized ghost imaging on imaging quality are confirmed. Both have a similar noise reduction effect under a large sampling times, and the optimization effect on different transmission-type objects also differs (Figs. 6 and 7). Meanwhile, noise reduction is performed again on the reconstructed images of the positive-negative correlation algorithm. It is found that the imaging noise is significantly reduced, and the value of the modulation factor is changed to avoid serious loss of some information on the object during noise reduction for optimal imaging results (Figs. 9 and 10).ConclusionsBased on the principle of traditional pseudothermal light ghost imaging, we designed and developed a sequence-controlled pseudothermal light ghost imaging system, which could achieve precise control of the speckle size and quantity of sampling for ghost imaging, while combining different imaging algorithms and proposing further optimization schemes to finally improve the imaging quality for different objects.
ObjectiveThe large-scale equipment manufacturing represented by aircraft and ships continues to promote digitalization and gradually develops toward intelligence, which leads to a sharp increase in the geometric measurement missions on the manufacturing site and a more complex and changeable on-site environment. Therefore, measurement must take into account adaptability, efficiency, and accuracy. Frequency scanning interferometry (FSI) ranging technology can be applied to non-cooperative targets to tackle the low measurement efficiency problem in the manufacturing field. However, it also confronts some problems, such as weak interference signal strength, low signal-to-noise ratio (SNR), and a large amount of data. According to the characteristics of FSI signals of non-cooperative targets, the distance to be measured is usually calculated with the interference beat frequency resolved through the spectrum. However, the discrete spectrum is affected by signal truncation in the time domain, and its amplitude, phase, and frequency are subject to large errors. Hence, spectrum correction is required for higher accuracy. The existing signal processing methods are based on the fast Fourier transform (FFT)+spectrum thinning algorithm, which are inefficient and difficult to meet the requirements of manufacturing sites. Therefore, according to the characteristics of FSI signals of non-cooperative targets, this paper uses the sparse Fourier transform (SFT) algorithm to quickly solve the range spectrum and introduces the synthesized Rife (s-Rife) algorithm to precisely correct the range spectrum, which greatly improves the understanding efficiency while considering the accuracy of range calculation.MethodsIn this paper, a mathematical model is built to study the basic principle of FSI and the influence of the surface roughness, spatial distance, and incident angle of non-cooperative targets on FSI signal strength and SNR. A fast detection method for FSI signals of non-cooperative targets is proposed to overcome the shortcomings of existing processing methods in accuracy, efficiency, and adaptability. This method includes two processes: spectrum estimation and spectrum correction. For massive signal data (2×10⁶ points) after the correction of the nonlinearity of optical frequency scanning by resampling, the SFT algorithm is used instead of the fast Fourier transform (FFT) algorithm to ensure the effectiveness of the spectrum solution at the target position and shorten the running time. To correct the discrete spectrum affected by time-domain truncation, this paper selects the s-Rife algorithm to obtain the best estimation of the beat frequency. This algorithm has fast calculation speed, high correction accuracy, and strong anti-noise ability, and can adapt well to various measurement targets and measurement conditions. Finally, the whole algorithm is deployed on the field-programmable gate array-digital signal processor platform to achieve high-precision real-time calculation of the distance to be measured.Results and DiscussionsTo verify the adaptability, timeliness, and accuracy of the fast detection method for FSI signals of non-cooperative targets proposed in this paper, an experimental device to measure the FSI signals of non-cooperative targets is built (Fig. 5). Different algorithms are used for spectrum estimation and correction of the collected interference signals. The feasibility of the SFT algorithm and s-Rife algorithm is verified by comparison (Figs. 6 and 7). For adaptability, the solution results can be obtained when non-cooperative targets with different roughness are measured at different spatial distances and incident angles, and the standard deviation of measurement results is less than 10 μm (Fig. 8). For timeliness, the distance calculation time is shortened from 2.8543 s to 0.1224 s compared with the case of the classical FFT+CZT method (Table 1). For accuracy, the comparison error with the measurement results by the commercial interferometer within the range of 12 m is less than 13 μm, and the standard deviation of measurement results is less than 10 μm (Fig. 9). The experimental results show that the design in this paper has good adaptability, timeliness, and accuracy and can meet the actual measurement needs.ConclusionsThis paper studies the method to rapidly acquire and calculate the range of FSI signals of non-cooperative targets, analyzes the time-frequency characteristics of FSI signals of non-cooperative targets, estimates the frequency spectrum of the resampled interference signals using the SFT algorithm, and interpolates the frequency spectrum using the s-Rife algorithm. The above methods are implemented and verified on the FPGA-DSP platform, and it is proven that they can realize high-precision and fast calculation of the distance to be measured. The experimental results show the fast detection method designed in this paper can effectively collect and process the FSI signals of non-cooperative targets with various roughness. Compared with the results of the classical FFT+CZT method, the distance calculation time is optimized from 2.8543 s to 0.1224 s. The comparison error with the measurement results by the commercial interferometer is less than 13 μm within the range of 12 m, and the standard deviation of the measurement results is less than 10 μm. This method has good adaptability, timeliness, and accuracy and can meet the needs of large absolute distance measurements in the industrial field.
ObjectiveIn digital image correlation methods, the sub-pixel matching error is related to the speckle image and shape function. For the gradient algorithm and curve fitting algorithm without iterative operation, the shape function is difficult to adapt to the sub-pixel distribution law of different speckle images. Although the calculation time is short, the sub-pixel matching error is large. For the Newton-Raphson algorithm with an iterative operation, the sub-pixel matching error can be greatly reduced through the infinite approximation of the target image to the original image or the original image to the target image, but the calculation is time-consuming. Generally, in the displacement range of 0.1-0.9 pixel, the sub-pixel error is mainly S-shaped, and the S-shaped error is related to the image speckle diameter. The S-shaped error is much more different for different speckle diameters. In the field of displacement measurement, the speckle image is fixed and determined, and how to select an appropriate shape function matching the known speckle image to shorten the sub-pixel matching time and improve the sub-pixel matching accuracy has become the focus of this paper.MethodsIn order to reduce sub-pixel matching error, this paper proposes a sub-pixel matching method based on parameterized shape function with an exponential variable and background variable, and the core of the method is to decompose the 3×3 correlation coefficient C(i, j) into the 3×1 correlation coefficient A(i) in the x direction and the 1×3 correlation coefficient B(j) in the y direction. Specifically, i and j vary in the set of -1, 0, and 1, and then the 3×1 correlation coefficient A(i) and the 1×3 correlation coefficient B(j) with the exponential variable and background variable are weighted. In the paper, the difference between the absolute displacement and the sum of relative displacement is defined as a sub-pixel matching error, which includes linear and S-shaped errors. The shape function parameters are calibrated by using different regulation rules of the shape function parameters of the exponential variable and background variable on the sub-pixel matching error so that the proposed method features short sub-pixel matching time and small matching error.Results and DiscussionsThe experiment takes the Gaussian speckle pattern with a speckle diameter of 2 pixel, 10 pixel, and 20 pixel as an example, and 10 images with the displacement of 0.1-0.9 pixel in the x direction are generated respectively. The regulation rule of the shape function parameters on the sub-pixel matching error is experimentally studied. The research results show that the exponential variable of the shape function parameter has the primary regulation function to change the slope of the linear error and the secondary regulation function to change the direction of the S-shaped error (Fig. 4). The background variable of the shape function parameter has the primary regulation function to change the direction of the S-shaped error and the secondary regulation function to change the slope of the linear error (Fig. 5). Under the coordinated regulation of shape function parameters, the sub-pixel matching error of the above speckle image is less than 0.001 pixel (Table 1, Table 2, and Table 3). At the same time, the influence of the speckle diameter of the speckle image from 2 pixel to 20 pixel on the shape function parameters is studied (Table 4, Fig. 7, and Fig. 8). It is found that when the speckle diameter is greater than 6 pixel, the influence of the speckle diameter on the shape function parameters becomes weak, and the influence curve becomes flat, which also lays a good foundation for applying the method in the field of deformation measurement. Finally, according to the actual displacement speckle image provided by DIC Challenge, the proposed method is verified (Table 5).ConclusionsThe sub-pixel matching method described in this paper makes the shape function approximate to the sub-pixel distribution law of the speckle image by calibrating the shape function parameters to obtain the optimal shape function and greatly reduces the sub-pixel matching error. Since the shape function calculation only involves the addition, subtraction, multiplication, division, and exponential operation of nine correlation coefficients, as well as no more than six cycles of calculation, the sub-pixel matching time can be ignored in the digital image correlation calculation. Compared with the gradient algorithm and curve fitting algorithm without iterative operation, the sub-pixel matching method of parameterized shape function can obtain ideal sub-pixel matching accuracy for speckle images with different speckle diameters, which cannot be achieved by gradient algorithm and curve fitting algorithm. Compared with the Newton-Raphson algorithm with the iterative operation, the proposed method has comparable sub-pixel matching accuracy in the field of displacement measurement and is more suitable for online displacement measurement due to the short matching time. However, in the field of deformation measurement, there are still some problems to be solved and further studied, such as the influence of the equivalent speckle diameter change of speckle image under deformation conditions on the shape function, as well as the dynamic calibration for shape function parameters.
ObjectiveThe digital light processing (DLP) projector has been widely used in fringe projection profilometry (FPP) for three-dimensional (3D) shape measurement. The mostly used bit depth of projected fringe patterns in FPP is 8 bit. It limits the number and switching speed of projected patterns and leads to the limitation of available algorithms for the 3D reconstruction and the redundancy of the camera rate due to the inherent constraints of some DLP projectors. Meanwhile, the binary defocusing projection technique with 1 bit fringe patterns that can obtain a faster refresh rate of patterns is greatly limited in measurement accuracy and the measurement depth range because of the down-sampling of patterns and the defocusing of projectors. In addition to the commonly used 8 bit and 1 bit fringe patterns, there is a lack of research on fringe patterns of 2-7 bit and no selection scheme for the optimal bit depth of projected fringe patterns in different application scenes. To balance the measurement performance in terms of measurement accuracy, speed, and depth range, this study proposes a 3D shape measurement method by projecting arbitrary-bit fringes using DLP projectors and a strategy of determining the optimal bit depth in different application scenes.MethodsThe basic idea of the method of projecting arbitrary-bit fringe patterns for 3D shape measurement is to split arbitrary-bit fringe patterns into several 1 bit patterns, load them into the DLP projector in order, and select the corresponding bit depth of fringe patterns for projection. Firstly, the bit depth of the used fringe patterns is determined by the actual measurement system and requirements, and the gray level of a line of the corresponding sinusoidal fringe pattern is calculated. Then, the quantified gray level is converted into a binary number. After that, the same bit binary number is extracted and expanded by row to several 1 bit patterns according to the spatial characteristics of the fringe patterns. Next, these 1 bit patterns are loaded into the DLP projector for projection and shooting, and the suitable 3D reconstruction algorithms in the corresponding systems are used to reconstruct objects' information. As a result, arbitrary-bit fringe patterns can be used in 3D measurement based on FPP. Meanwhile, according to the analytical strategy considering the reconstruction speed or camera shooting speed, the used algorithm, measurement accuracy, and other conditions, the optimal bit depth can be selected.Results and DiscussionsThe results of the measurement for the whiteboard, standard gauges, and complex plaster model demonstrate that the measurement accuracy of the 6 bit fringe projection is close to that of the 8 bit fringe projection (Table 1, Figs. 6 and 7). As the number of allowed projected 6 bit fringe patterns is more than that of 8 bit fringe patterns, 6 bit fringe patterns have the advantages of flexible coding and anti-noise ability in the measurement scene with high noise and can be applied in more 3D measurement scenes (Fig. 8). In addition, they are more resistant to motion-induced errors due to their faster refresh rates in the projector than 8 bit fringe patterns (Figs. 9 and 10). Meanwhile, the measurement depth range of the 6 bit fringe projection method with the focused projector is larger than that of the 1 bit fringe projection method with the defocusing projecting (Fig. 11). Moreover, the 4 bit fringe patterns obtained by the proposed method can be used in 3D measurement based on FPP (Fig. 12), but the measurement performance needs to be improved. Finally, the measurement performance and applicable scenes of fringe projection using different bits are given (Fig. 13), and the corresponding operational parameters of the fringe projection measurement system are summarized to guide the selection of the optimal bit depth of fringe patterns in different application scenes (Fig. 5).ConclusionsThis study proposes a 3D shape measurement method by projecting arbitrary-bit fringes using the DLP projector, which offers diverse options for the bit depth of projection and coding strategies. It demonstrates that 6 bit fringe patterns have the advantages of flexible fringe projection, and they can make full use of the redundancy of the camera rate and expand the range of available algorithms for 3D reconstruction compared with 8 bit fringe patterns. The measurement depth range of the 6 bit fringe projection is larger than that of the 1 bit fringe projection. Considering the characteristics of the DLP projector and the camera, the relationship between the operational parameters of the 3D measurement system based on fringe projection is summarized. On this basis, a method for selecting the bit depth of fringe patterns is proposed, providing a valuable reference for the selection of the optimal bit depth in different measurement systems. The method can make full use of the hardware's performance in the actual applications and enable the flexible usage of different 3D reconstruction algorithms and can be applied to more measurement scenes.
ObjectiveThe laser amplifier is an important part of a high-power solid laser system and a key link for the system to achieve high-power output. Two main problems deserve special attention in the research of laser amplifiers. One is to optimize the characteristics of the gain material according to the requirements of the system on energy gain. The other is to analyze the optical load capacity of the gain material and optimize the structure design accordingly. Once the optical field inside the material exceeds its load capacity, amplifier damage leaves the whole system unable to operate normally, which necessitates the study of the damage characteristics of the amplifier.MethodsTaking the laser diode (LD) end-pumped monolithic neodymium glass laser amplifier as an example, this paper investigates the characteristics of the optical field inside the gain material in the pumping process and the end-face strain caused by the thermal effect. Drawing on the theory of electron proliferation, the paper constructs a model for analyzing the field-induced damage characteristics of a laser gain material under ideal and thermal conditions. It further explores the rates of avalanche ionization and multi-photon ionization in the gain material and determines the specific location of damage according to the critical free electron number density.Results and DiscussionsThe energy and pulse width of the incident laser can be reasonably optimized to fully exploit the amplification performance of the gain medium. As the incident laser energy and laser pulse width increase, the location of damage moves toward the incident end [Fig. 4 (b)]. When the pulse width is increased from 10 ns to 13 ns, the damage point moves by approximately 14 mm. Within the range with an optical field value of 4×10⁴ V/m, the movement range of the damage point is 14% of the material thickness. Within the range with a pulse width of 3 ns, the movement range of the damage point reaches 35% of the material thickness. Therefore, when the signal light is amplified, the laser pulse width should be smaller than 10 ns, and the initial optical field value should be lower than 3.3035×10⁶ V/m if the thickness of the neodymium glass is 40 mm. In this case, the damage inside the neodymium glass can be avoided. Moreover, due to the influence of the thermal deformation of the material on its damage characteristics, the material is affected by both gain and the thermal effect under different pump power densities, and the damage location is closer to the incident end than that in the ideal case (Fig. 8). Specifically, when the pump power density is 1×10⁴ W/cm2 and 1×10⁵ W/cm2, the internal damage positions is at 22.51 mm and 6.43 mm, respectively.ConclusionsThis paper builds an analysis model for gain material damage by taking the LD end-pumped monolithic neodymium glass laser amplifier as an example. Then, it studies the rates of avalanche ionization and multi-photon ionization in the gain material and determines the specific damage location in the material under the two conditions according to the critical free electron number density. The calculation model is further extended according to the actual situation. Effective measures are put forward to prevent the gain material from damage and prolong its service life. The results show that under the influences of the thermal effect and pump power density on the material gain, no damage actually occurs in the material when the pump power density is 1×10³ W/cm2 because the material gain is small. In contrast, when the pump power density is 1×10⁴ W/cm2 and 1×10⁵ W/cm2, the field-induced damage in the material occurs at the positions of 22.51 mm and 6.43 mm, respectively. This can be attributed to different modulation of the optical field of the incident signal light caused by the different influences of the thermal effect on the gain material and the different degrees of end-face deformation. A larger pulse width of the incident laser corresponds to a smaller damage threshold of the material and damage closer to the incident end. When the initial optical field value is constant and the pulse width increases from 10 ns to 13 ns, the damage point moves forward by about 14 mm. If the thickness of the neodymium glass is 40 mm, the peak power of the pump light should be lowered to reduce the impact of the thermal effect on the end face on the initial signal light. In addition, the laser pulse width should be smaller than 10 ns, and the initial optical field value should be lower than 3.35×10⁶ V/m. In this way, the damage inside the glass can be avoided. Therefore, after the thickness of the neodymium glass is determined, the initial optical field value and the pulse width of the incident laser and the pump power density can be adjusted to avoid the material damage as a result of excessive modulation of the optical field caused by end-face deformation or excessive amplification of laser energy in the material and ultimately improve the service life of the gain material.
ObjectiveAs an important optoelectronic device for optical fiber communication, the 980 nm semiconductor laser has the advantages of a wide wavelength range, easy modulation, and high efficiency. It can excite ground-state erbium ions to a metastable state, thereby paving the way for stimulated radiation. It is thus an optimal pumping source for the erbium-doped fiber amplifier (EDFA). However, as an important factor influencing the power stability and spectral shift of the 980 nm semiconductor laser, temperature affects the stability of the output wavelength of the EDFA. The traditional control methods, mainly using the microcontroller unit (MCU) to implement the proportional-integral-derivative (PID) algorithm, have the weaknesses of cumbersome hardware circuits and control processes. In this paper, the field programmable gate array (FPGA) with high speed and flexibility is used as the main controller to switch the internal finite state machine (FSM), thereby achieving the automatic temperature control of the 980 nm semiconductor laser and stabilizing the output power of the laser. Then, the above method is applied to an EDFA system, and the results show that it reduces the shift and improves the stability of the output spectrum. The proposed temperature control method is expected to promote the development and application of the temperature control of semiconductor lasers.MethodsThe structure and properties of the 980 nm semiconductor laser are investigated, and the analysis shows that the thermoelectric cooler (TEC) and the thermistor can respectively be used as the actuating element and the temperature sensor. Besides, the FPGA, as a core control component, is utilized to control the analog-to-digital chip (ADC) collecting the voltage of the thermistor and further to obtain the internal temperature of the semiconductor laser. In addition, the FSM is adjusted and switched to different states in real time to control the magnitude and direction of the current flowing into the TEC. The above measures are taken to achieve automatic temperature control. An FPGA-based experimental device with an EDFA system is built to verify the feasibility of the proposed method. For this purpose, an experiment is conducted under different temperatures by analyzing the variations of output power-current (PI)curves of the 980 nm semiconductor laser and the output spectra of the EDFA with time and temperature. The results prove the feasibility of the proposed method.Results and DiscussionsThis paper proposes a real-time temperature control method for the 980 nm semiconductor laser that uses the FPGA to automatically switch the internal FSM (Fig. 7). An FPGA-based experimental device with an EDFA system is built (Fig. 9) to verify the feasibility of the proposed method. The experimental results show that when the threshold temperature of the FSM is set to ±0.2 ℃, the temperature of the laser within 60 min largely remains stable, with a maximum temperature difference of smaller than 0.4 ℃ (Fig. 11). When the temperature of the 980 nm semiconductor laser stabilizes at 25 ℃, the proposed temperature control method increases the goodness of linear fit of the PI curve by 23.07% and reduces the wavelength shift of the EDFA by 62.5% within 60 min (Fig. 13). The application of the proposed temperature control method effectively ensures the stability of the output power of the semiconductor laser and that of the output wavelength of the amplifier.ConclusionsAs the current temperature control methods for semiconductor lasers are faced with the slow transmission speed and complex structure of the controller, an FPGA-based real-time temperature control method for the 980 nm semiconductor laser is presented in this paper. The method uses the FPGA as the main controller to obtain the internal temperature of the semiconductor laser in real time by measuring the voltage of the thermistor. The FSM state could be switched in real time according to the collected temperature, thereby controlling the direction and magnitude of the current flowing into the TEC in the semiconductor laser. In this way, the internal temperature control of the semiconductor laser is achieved. An FPGA-based experimental device with an EDFA system is built to analyze the temperature control effectiveness of automatic switching of the internal FSM by the FPGA when the temperature is 25 ℃ and the working time is 60 min. When the threshold temperature of the FSM is set to 0.2 ℃, the temperature of the semiconductor laser is generally 0.4 ℃ under control. The goodness of linear fit of the PI curve of the 980 nm semiconductor laser is improved by 23.07% from 0.9584 to 0.9784. The maximum shift and variance of the output wavelength of the EDFA are respectively reduced from 40 pm to 14 pm and from 14.4 pm to 5.4 pm. The wavelength shift and variance are thus respectively reduced by 65% and 62.5%. The simple constant current source is combined with devices inside the semiconductor for temperature acquisition and cooling, and the internal FSM program is controlled by the FPGA to achieve temperature control. The proposed method, with a simple structure and fast speed, is of great significance for promoting the development and application of the temperature control of semiconductor lasers.
Objective1550 nm transverse mode semiconductor laser has been applied in many fields such as optical fiber communication, spectral analysis, photoelectric detection, medical cosmetology. At the same time, it is also the research basis of communication band semiconductor optical amplifiers and narrow linewidth transverse mode semiconductor lasers. The kink effect refers to the fact that the P-I curve of the fundamental transverse mode device will be bent, which will greatly reduce the output power of lasers. At the same time, the steering effect will cause the far-field divergence angle of the horizontal direction of the device to shift and reduce the beam quality of the fundamental transverse mode device. For the 1550 nm semiconductor laser in the communication band, it will affect the efficiency of coupling with the single-mode fiber. In this paper, a 1550 nm high-power AlGaInAs/InP-based transverse mode semiconductor laser is designed and fabricated, and the kink effect is studied.MethodsIn this paper, a gradual Al component is introduced into the waveguide, and the atomic number fraction is 0.31-0.35. In addition, the atomic number fraction of Al component becomes lower when getting closer to the active region. This design can effectively reduce the oxidation of Al near the active region at the high-power output and improve the reliability of the device. At the same time, with the gradual increase in the Al atomic number fraction, the refractive index of AlGaInAs decreases gradually, which reduces the confinement factor of the whole device, improves the saturation power of the device, and lowers the far-field divergence angle. In order to realize the fundamental transverse mode output, the relationship between the residual thickness of cladding and ridge width is calculated according to the effective refractive index method. In view of the actual process, the final ridge width is 5. 4 μm, and the etching depth is 2 μm(Fig. 2). In order to analyze the kink effect occurring after device fabrication, a temperature model with high-order mode cutoff is established(Fig. 8). The mode output characteristics of the device before and after temperature rise are analyzed, and the influence of temperature on the kink effect is proved by measuring devices with different cavity lengths(Fig. 10).Results and DiscussionsThe threshold current of the device designed and fabricated in this paper is 29 mA, the maximum slope efficiency is 0. 35 mW/mA, and the maximum output power is 138 mW(Fig. 3). At the highest output power of the device, the vertical and horizontal divergence angles are 32. 9° and 11. 1° , respectively(Fig. 4), which proves that the device has good fundamental transverse mode output characteristics, and the internal quantum efficiency and loss are 53. 6% and 6. 24 cm?1, respectively(Fig. 5). The P-I curve of the device at different operating temperatures is observed(Fig. 6). The current increasing curve tends to be flat at the same temperature, which is caused by the broadening and reduction of the gain spectrum due to the increase in the current and the saturation state of the device due to a large amount of carrier leakage. For the P-I folding phenomenon at a high temperature, according to the temperature model of the higher-order mode cut-off, it is believed that the temperature rise is more likely to make the higher-order mode compete with the fundamental transverse mode generation mode. Furthermore, as the gain of the higher-order mode increases, the gain of the fundamental transverse mode decreases, which leads to the kink effect. With the kink effect, the far-field divergence angle also has a steering effect. The peak of the far-field divergence angle shifts by 2. 2°(Fig. 9), which is caused by the non-uniform lateral distribution of charge carriers. For devices with different cavity lengths, a longer cavity length is often accompanied by a higher current value of the kink effect. As the long cavity length structure has better heat dissipation, it proves not only that the temperature affects the occurrence of the kink effect but also that the long cavity length structure can better suppress the kink effect.ConclusionsIn this paper, a 1550 nm high-power AlGaInAs/InP laser with the transverse mode is designed and fabricated. The device achieves a slope efficiency of 0. 35 mW/mA and a power output of 138 mW at room temperature. The vertical and horizontal far-field divergence angles are 32. 9° and 11. 1°, respectively. By analyzing the kink effect in the P-I curve of the device at a high temperature and using the relationship between the refractive index of the waveguide and the temperature, a temperature model of the high-order mode cutoff is established. It shows that the heat changes the refractive index and then affects the high-order mode cutoff condition, which leads to the reduction of the gain of the fundamental transverse mode and the occurrence of the kink effect in the device. The non-uniform carrier distribution caused by the effect of hole burning in space makes the far-field divergence angle show the steering effect. By comparing the current at which the kink effect occurs in devices with different cavity lengths, it is proved that the device with a long cavity length can effectively prevent the occurrence of the kink effect.
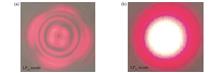
ObjectiveThe laser light source is generally Gaussian intensity distribution, and its energy concentration features uneven surface energy density of the sample, material damage, and other problems in the fields of micro-precision machining such as laser drilling, MicroLED repair and transfer, and laser cutting. In this paper, the micron-scale uniform light spot is prepared based on diffractive optical elements (DOEs), and the shape and size of the uniform light spot can be flexibly designed with a high degree of freedom. The difficulty in DOE design for preparing small-sized uniform light spots is to achieve steep and sharp transition areas and characteristic parameters with uniformity of less than 5% in the flat-top area. If the DOE is designed based on the analytical method, the transition area of the uniform light spot changes slowly, and the uniform area effectively used is quite smaller than the diameter. The analytical method is not suitable for preparing small-sized uniform light spots. Therefore, the numerical analysis method is used to design the DOEs. The most effective one is the iterative Fourier algorithm, including the Gerchberg-Saxton (GS) algorithm and its various improved algorithms, which are effective tools in DOE design. Usually, the parameters of the optical system are not easily changed after being determined, but the detector position is prone to deviation. In order to analyze the application of this DOE in the engineering environment, the influence of the defocus on the beam shaping is analyzed through simulation and experiments.MethodsBefore the DOE element is introduced into the optical system, the diffraction limit of the system should be calculated, and the DOE can only prepare a uniform light spot larger than the diffraction limit. Based on diffraction limit constraints, an ultraviolet (UV) short wavelength light source is used. This paper combines the basic GS algorithm and the modified GS algorithm. Firstly, the basic GS algorithm is used to calculate the primary phase distribution of DOE. The initial phase will affect the number of iterations and the convergence speed of the GS algorithm. Moreover, it is easy to fall into the local optimal solution. Based on the principle of spatial filtering, the initial phase is calculated, which can reduce the number of iterations. Secondly, this phase is used as the initial phase of the modified GS algorithm. In the frequency spectrum range, the range of the uniform light spot is defined as the signal area S, and the rest of the range is defined as the noise area. The frequency domain amplitudes both in the signal area and the noise area are limited [Eq. (11)]. The beam shaping is realized through the spatial DOE phase and frequency domain amplitude constraints. The schematic diagram of the comparison between the basic GS algorithm and the improved GS algorithm is shown in Fig. 4. According to the beam shaping system (Fig. 6), the analytical method, the basic GS algorithm, and the basic GS algorithm combined with the modified GS algorithm are compared to analyze their effects of beam shaping.Results and DiscussionsThe size of the uniform light spot prepared based on the analytical method is limited by that of the incident light spot, the parameters of the optical system, etc., and it has strong constraints and can only prepare regular shapes, and simulation results are shown in Fig. 1. Because the size of the uniform spot is close to the diffraction limit, the basic GS algorithm has an unsatisfactory shaping effect and does not change the Gaussian intensity distribution. As a result, it cannot meet the parameter requirements, and the Gaussian beam cannot be shaped into a uniform spot only by the phase of the blazed grating. Therefore, in addition to the phase degree of freedom, the amplitude degree of freedom is added to modify the GS algorithm and improve the beam shaping effect. The basic GS algorithm combined with the modified GS algorithm designs the uniform light spot by DOE, and the light intensity stability and uniformity are greatly improved and tend to become the ideal uniformity (Fig. 5). According to the simulation and experimental results, it is concluded that the defocus leads to the deformation of the uniform spot, which destroys the well-defined light intensity distribution in the transition area and the flat-top area. When the detector is far away from the geometric focus along the beam transmission direction, the spot size becomes slightly larger. The flat-top area shrinks, and the energy in the central area accounts for a large proportion. When the detector is close to the DOE direction, or in other words, the detection surface is in front of the geometric focus, the energy is concentrated in the four corners of the square edge, and the collapsed structure with weak light intensity is in the flat-top area (Fig. 8 and Fig. 9). The square uniform spot with a side length of 28 μm is more sensitive to defocus error. When |Δz|ConclusionsIn this paper, the DOE phase distribution is designed by combining the basic GS algorithm and the modified GS algorithm, and the Gaussian beam of UV light source with a diameter of 3 mm is shaped into a square uniform spot with a side length of 28 μm. The effectiveness and reliability of the method are verified by simulation and experiments. Within a certain error range, the experimental results are consistent with the theoretical simulations. In the follow-up, research work to improve the beam shaping effect of DOE in engineering applications will be carried out. This paper provides data reference for the design method of uniform spot shaping DOE and the application of DOE in an engineering environment.
ObjectiveIdentifying and reconstructing fusion plasma boundaries accurately are important research areas in controlled thermonuclear fusion. The traditional electromagnetic measurement methods will inevitably suffer from the accuracy problem arising from neutron radiation and long-term drift. The traditional optical diagnostic methods are non-intrusive and reach a high level of spatial resolution. However, they are commonly limited to two-dimensional imaging. As the processes within the plasma flow are inherently three-dimensional, it is necessary to develop a three-dimensional method for plasma measurement. In order to capture the dynamic information of the plasma and avoid signal distortion, three-dimensional imaging must be achieved at a high speed in parallel or sequential imaging of multiple planes. However, the existing three-dimensional reconstruction methods based on tomography technology are limited by spatial and temporal resolution, and multiple images have to be captured from various angles, or complex experimental setups are needed. All the above methods are not applicable to reconstructing the three-dimensional plasma boundaries in real time. The light field camera is an emerging image acquisition device, in which a microlens array is placed between the main lens and the sensor. With the light field camera, multi-angle information can be captured within a single exposure. Plasma flow is the typical semi-transparent and dispersive media. To date, some studies have used the light field deconvolution algorithm to reconstruct the plasma, but the algorithm requires a long computation time. To this end, we propose a light field deconvolution algorithm based on optical sectioning imaging, which has the advantages of simplicity and speed. We hope that our method can be helpful in the three-dimensional reconstruction of plasma.MethodsThe depth information and point spread function are the key parameters of the method in this paper. We obtain these two parameters through experiments. First of all, with the digital refocusing technology, we calculate the relationship between the light-field refocused parameters and real-world depth by using the scale and the image sharpness evaluation algorithm. Then, we determine five points to calculate refocused section images, and by the edge method, the point spread function at these locations is computed for the subsequent iterative deconvolution operation. Finally, we perform the deconvolution operation on the image to be reconstructed and the point spread function to remove the out-of-focus information from the image to be reconstructed.Results and DiscussionsIn order to verify the effectiveness of the proposed method, simulation experiments are conducted. The defocusing effect is simulated by setting different point diffusion functions and image convolution (Fig. 14). The simulation results show that the proposed method can effectively remove the out-of-focus image information. In addition, the effect of the number of sections and section intervals on the reconstruction accuracy is explored, and the structural similarity (SSIM) is used to evaluate the performance (Figs. 16 and 17). The results show that as more sections are involved in the deconvolution, and the spacing gets smaller, the reconstruction performance becomes better. Finally, an experiment with the flame is conducted as the research object. The proposed method recovers the original structure of the section image successfully, and the trend is consistent with the actual flame distribution (Fig. 22), which verifies the experimental efficacy of the proposed reconstruction method.ConclusionsIn order to address the problems in traditional optical diagnostic techniques such as three-dimensional information loss and poor real-time performance, a light field deconvolution method based on optical sectioning imaging is proposed, so as to achieve the three-dimensional reconstruction of plasma boundaries by a single camera without focus adjustment. The three-dimensional reconstruction is transformed into the two-dimensional section reconstruction, which reduces the computational cost greatly. The results show that the original section image of the flame can be reconstructed by the proposed method, which initially demonstrates the feasibility of the three-dimensional reconstruction method of the plasma based on light field imaging. With the optical imaging conditions in this paper as an example, the depth-of-field resolution of the three-dimensional reconstructed object should be close to the depth of the object within the focal plane, and for high depth-of-field resolution, 100 or more focal planes are likely to be required to span the full depth of the object, while only five sections are selected to verify the effectiveness of the proposed method. To further improve the spatio-temporal resolution of the reconstruction, we will make attempts to achieve a more accurate extraction of the point spread function by using a high-precision electrodynamic displacement stage and performing deconvolution operations with more section images.
ObjectiveAs emerging services have a higher demand for internet performance, high-capacity, multi-channel, and flexible fiber optic communication systems have become the trend of optical communications with the advantages of dynamic, high-capacity, and transparent transmission. Complex link impairments in large-capacity and multi-channel optical communication systems put forward higher requirements for optical performance monitoring (OPM) technology. The number of monitoring parameters and links of OPM needs to be increased continuously with a higher monitoring accuracy and a larger dynamic range. In the previous papers, existing monitoring mechanisms for optical fiber communications focus on OPM performance and are still dominated by single-channel monitoring schemes. The so-called multi-channel monitoring schemes are operated sequentially by selecting specific channels through tunable optical filters, which may introduce measurement delays for multi-channel systems such as wavelength division multiplexing (WDM) systems. Besides, in next-generation dynamically reconfigurable optical networks, OPM is also conducted on intermediate nodes except for the receiver. Obviously, there are few studies on this flexible OPM. In order to meet these demands for future OPM schemes, it is necessary to develop OPM that can be used for multi-channel monitoring with portability, low complexity, and high accuracy. Therefore, a simplified multi-channel parallel OPM scheme is proposed based on deep learning to overcome the shortcomings in multi-channel monitoring.MethodsIn this paper, a multi-channel parallel OPM scheme based on signal spectrum and multi-task deep neural network (MT-DNN) is proposed to deal with the shortcomings of the multi-channel OPM. This scheme processes the collected multi-channel spectrum from the fiber link by downsampling, filtering, signal waveform separation, and power normalization. Then, the number of signal sample points is counted based on each power value interval to generate amplitude histograms (Ahs). The Keras library in the TensorFlow deep learning framework (version 2.0) is used to build an MT-DNN model. Since Ahs reflect the statistical distribution of signal amplitude, the bin number vector of Ahs is used as the input of MT-DNN for training, which can realize the multi-channel modulation format identification (MFI) and optical signal-to-noise ratio (OSNR) monitoring of a WDM system. In order to further investigate the performance of this OPM scheme and cope with the complex transmission environment, a transfer learning-assisted multi-task deep neural network (TL-MT-DNN) is proposed for parallel monitoring of multi-channel MFI and OSNR. This paper shares the parameters of the MT-DNN model in the source domain (DS) except for the output layer to the TL-MT-DNN model in the target domain (DT) to replace random initialization of the network parameters. The parameters of the output layer of the TL-MT-DNN model are randomly initialized. The parameters of the TL-MT-DNN model are tuned for better monitoring performance by using Fine-Tuning, a parameter-tuning method commonly used in transfer learning.Results and DiscussionsThe proposed MT-DNN model for multi-channel parallel MFI and OSNR monitoring is demonstrated in this paper. In the established three-channel WDM coherent optical communication system, an accurate monitoring with MFI accuracy of 100% and mean absolute error (MAE) of 0.16 dB for OSNR monitoring is achieved for three-channel signals with ten modulation formats combined by PDM-4QAM/16QAM/64QAM (Fig. 10 and Fig. 11). In order to deal with a more complex transmission environment, the paper transfers the parameters of MT-DNN to TL-MT-DNN to achieve parallel monitoring of multi-channel MFI and OSNR according to the principle described in Fig. 5. This scheme has better portability and saves a large number of samples and training epochs (Fig. 12). The MFI accuracy can reach 100%, and the MAE of three-channel OSNR monitoring is 0.24 dB, 0.20 dB, and 0.19 dB, respectively (Fig. 13). The results show that the simplified multi-channel parallel OPM scheme based on deep learning proposed in this paper can monitor the multi-channel optical system without processing each channel individually and requiring additional filtering equipment. The scheme can be extended to any node of the fiber optic link or receiver side to achieve multi-channel monitoring, which is suitable for future high-capacity and elastic optical transmission systems.ConclusionsThis paper proposes a multi-channel OPM technique based on signal spectrum and MT-DNN at the intermediate node of the WDM system for multi-parameter parallel monitoring of high-capacity multi-channel optical networks. The method can monitor multi-channel OPM without processing each channel individually. The performance of this scheme is demonstrated, and the scheme can accurately monitor multi-channel signals. The influence of hyperparameters of MT-DNN (weighting factor of each task, optimizer, and training set size) on its monitoring performance is studied. In order to verify the portability of this OPM scheme for complex transmission environments, a TL-MT-DNN model is proposed and demonstrated with a low training cost and low implementation complexity. The results show that the proposed intelligent OPM scheme requiring only one spectrometer and a single MT-DNN can achieve accurate multi-channel monitoring, which can be extended to any node of the fiber optic link or receiver side to achieve accurate monitoring. Due to these advantages, this method provides a certain research reference for future flexible and high-capacity optical network performance monitoring.
AbstractThe cermet-based solar selective absorbing coatings consisting of metal nanoparticles and ceramic matrices are the most widely used photothermal conversion coatings. However, these coatings cannot function at high temperatures for a long time due to the insufficient thermal stability of metal nanoparticles. Various methods, including element alloying, the method of covering the metal nanoparticles with a passivation layer, and the method of substituting metal nanoparticles with oxide/nitride nanoparticles, have been proposed to improve the thermal stability of nanoparticles in cermet coatings. As the method of covering the metal nanoparticles with a passivation layer is not suitable for large-scale production, the approaches by alloying or substituting the metal nanoparticles with oxide/nitride nanoparticles as light absorption components offer huge development potential. It is worth noting that the detailed spectral selective absorption mechanisms for different particles, such as bimetallic, oxide, and nitride nanoparticles, are still lacking sufficient research. Therefore, we employ the first principle calculation and finite-difference time-domain (FDTD) simulation to investigate the effect of band structure, binding, and distribution of nanoparticles on the solar selective absorbing characteristics of cermet coatings for photothermal conversion. Furthermore, we propose a new strategy to enhance the thermal stability of cermet coatings while retaining the selective absorption performance.MethodsThe light absorption principle of metal nanoparticles is localized surface plasmon resonance. To be specific, the free electrons on the metal surface turn into heat energy via non-radiative dissipation under the influence of external electromagnetic fields. The substantial orbital hybridization of bimetals alters the electrical structure significantly. Meanwhile, oxides and nitrides contain metallic bonds, ionic bonds, and covalent bonds. The energy band structure is significantly different from that of metal nanoparticles, which can show metallicity and dielectric properties. Moreover, the size and distribution of nanoparticles can influence the performance of the photothermal conversion coating as the particle size of the nanoparticles in the cermet is much smaller than the incoming wavelength. The electronic structures and energy bands of WTi, Cr2O3, and TiN are estimated and analyzed by the first principle in this study. The electron redistribution inside WTi, Cr2O3, and TiN is calculated with conventional electronic properties such as differential charge density and electronic density of states, as well as the bonding state between constituent atoms. In this way, we reveal the photothermal conversion mechanism of cermet coatings with various types of nanoparticles as light-absorbing components. On this basis, the FDTD simulation is used to simulate the effect of nanoparticle distribution characteristics on the selective absorption characteristics. Given the above results, a microstructure containing multi-scale layered nanoparticles is designed and fabricated by ion-source-assisted cathodic-arc plating. Then, the thermal stability and optical properties of the as-deposited and annealed coatings are investigated.Results and DiscussionsThis paper theoretically investigates the band structures and electron binding characteristics of bimetals, oxides, and nitrides and analyzes the effect of nanoparticle type on the absorbing behavior of cermet-based solar selective coatings. The results show that the doping of Ti in the bimetallic nanoparticle WTi can produce strong atomic orbital hybridization, which leads to the band upshift and narrow bandwidth. This can strengthen the local confinement of electrons and help enhance the inter-band coupling and the surface plasmon resonance effect. There is a narrow band gap in the oxide nanoparticle Cr2O3, and the bond length is easy to change. Therefore, the light absorption mechanism of Cr2O3 will change from the electron transition mode to the surface plasmon resonance effect under high temperatures. There is no forbidden band in the nitride nanoparticle TiN, which reflects a wider range of light absorption wavelengths. Meanwhile, the stable bond length and high carrier concentration between particles enhance the stability of the system and the light absorption effect of free carriers. The FDTD simulation demonstrates that in the band range of 0.3-1.5 μm, small-sized nanoparticles have a high absorption coefficient while large-sized nanoparticles are more dependent on scattering. Thus, the layered distribution of nanoparticles shows superiority to the conventional layered structure and the randomly dispersed structure (Fig. 8). Thus, a Cr/AlCrN/AlCrON/AlCrO multilayer coating consisting of lamellarly distributed nanoparticles in the absorbing sublayer is designed and fabricated by ion-source-assisted cathodic arc plating (Fig. 12). More importantly, the multilayer coating shows an outstanding selectivity (0.901/0.184) (Fig. 9) and excellent thermal stability even after annealing at 500 ℃ for 1000 h in the air (Table 2). This suggests that the deposited coating is a potential candidate for photothermal conversion under high temperatures.ConclusionsIn this paper, the effects of band structure, electron binding properties, and distribution characteristics of WTi, Cr2O3, and TiN on selective absorption characteristics are studied by the first principle calculation and the FDTD method. Intense electron localization of WTi prevents free carrier absorption, which makes its absorption mechanism more susceptible to surface plasmon resonance and intrinsic absorption. Optical absorption effect of Cr2O3 is largely in the form of an electronic transition at room temperature, with exciton absorption in the low energy photon region. However, at high temperatures, the transition absorption effect is decreased owing to the crystal volume expansion, atomic spacing increase, and additional band gap rise while thermal movement boosts lattice vibration and surface plasmon resonance. The strong electron delocalization in TiN encourages carrier absorption, and as it has both covalence and metallicity, TiN contains optical absorption modes such as intrinsic absorption. Nanoparticles with varying diameters have distinct absorption benefits. Small-sized nanoparticles of 0.3-1.5 μm have a high absorption coefficient, whereas large-sized nanoparticles have a great scattering coefficient but not a high absorption coefficient. In addition, the layered distribution of nanoparticles in the absorbing sublayer can enhance the interaction between the solar light and nanoparticles, which will increase the absorptivity. This unique microstructure can retard the agglomeration of nanoparticles during long-term operation at high temperatures, and thus boost the thermal stability of the multilayer coating. Moreover, a Cr/AlCrN/AlCrON/AlCrO tandem multilayer coating is prepared by ion-source-assisted cathodic arc plating. The coating exhibits a relatively high absorptance of 0.901, a relatively low emittance of 0.184, as well as outstanding thermal stability with a selectivity of 0.914/0.198 even after annealing at 500 °C for 1000 h in the air.
ObjectiveAs one of the most important lightweight structural materials, Al-Mg alloy has been widely used in the aerospace field due to its low density, high specific strength, and high stiffness. As a new type of high-strength aluminum alloy, Al-Mg-Sc-Zr alloy offers high elastic modulus, high specific strength, and excellent damage resistance. As the aerospace manufacturing industry develops, higher performance requirements are placed on aluminum alloy structures with complex geometry. Additive manufacturing (AM) technology has significant advantages in solving such problems. This paper is designed to achieve the wide application of high-performance aluminum alloys in primary load-bearing structures in the field of aerospace and obtain additive high-strength Al-Mg-Sc-Zr alloy samples with high compactness and no porous defects.MethodsThe laser melting deposition (LMD) technology is employed to prepare samples with a size of 70 mm×10 mm×40 mm (length×width×height). The processing parameters for the deposited Al-Mg-Sc-Zr alloy samples are a laser power of 3500 W, a scanning rate of 10 mm/s, a powder-feeding rate of 0.7 r/min, a spot diameter of 4 mm, a carrier gas flow rate of 3.3 L/min, an overlap ratio of 50%, and an oxygen mass fraction ≤50×10-6. The experimental study of LMD-processed Al-Mg-Sc-Zr alloy reveals that pores are the most important current defect in this alloy, and it is also one of the factors that greatly affects the mechanical property of the deposited Al-Mg-Sc-Zr alloy samples. In this paper, hot-rolling experiments with different reduction drafts (15%, 30%, and 50%) are conducted to weld the pores in the deposits at a later stage and thereby strengthen the alloy samples. Then, the paper further analyzed the influence of the reduction draft on the pore welding behavior, micromorphology, and mechanical property of the LMD-hot rolling (LMD-HR)-processed Al-Mg-Sc-Zr alloy.Results and DiscussionsFor the wide application of the Al-Mg-Sc-Zr alloy with high performance and low porosity in primary load-bearing structures in the field of aerospace, Al-Mg-Sc-Zr alloy samples are prepared by the LMD-HR composite process. Metallographic microscopy, scanning electron microscopy, microhardness tests, and tensile tests at room temperature are conducted to explore the relationship of the composite process with microstructure and mechanical property. The optimal process parameters are determined. Then, the paper examins the influence of the hot-rolling reduction draft on the microstructure evolution, microporous defect closure behavior, and mechanical property of the as-deposited samples. The results show that the microporous defects gradually decrease with the increase in the reduction draft. When the reduction draft reaches 50%, the microporous defects are completely closed (Fig. 4). Moreover, the strength and hardness of the sample are significantly improved, and the distribution of alloy elements in the fusion line area becomes uniform. Under the optimized process parameters, the tensile strength, yield strength, elongation, and hardness of the samples prepared by the composite process are 412 MPa, 243 MPa, 23%, and 118.76 HV, respectively, which are 22.6%, 12.5%, 54.1%, and 53.3% higher than those of the unrolled samples, respectively (Fig. 9).ConclusionsIn this paper, bulk Al-Mg-Sc-Zr alloy samples are prepared by the LMD-HR composite process under different conditions. The effect of the hot-rolling reduction draft on the pore welding behavior, microstructure evolution, and mechanical property of the deposited samples is emphatically studied. Moreover, comprehensive factors affecting the improvement of mechanical property are clarified. The main conclusions are as follows: the composite process of HR assisting LMD can significantly improve the compactness of the deposited samples, ultimately affecting the comprehensive mechanical property of the additive workpieces. When the reduction is increased from 15% to 50%, the microporous defects tend to close gradually from a round-shape morphology as the reduction draft of the deposited sample increases. The strength and hardness of the alloy increase linearly as the reduction increases, and the hardness distribution in the deposition direction becomes more uniform gradually. Owing to the synergistic strengthening effect of porous defect elimination, work hardening effect, grain fragmentation, and fragmentation of the crystal phase at grain boundaries, the performance of the deposited samples prepared by the composite process is significantly improved. When the hot-rolling reduction draft is 50%, the average microhardness of the samples can reach (118.76±2.4) HV0.2. The tensile strength, yield strength, and elongation are increased by 22.6%, 12.5%, and 54.1%, respectively, from 336 MPa, 216 MPa, and 14.8% in the deposition state to 412 MPa, 243 MPa, and 22.8% of the samples prepared by the LMD-HR composite process.
ObjectiveNitrofuran is a typical broad-spectrum antibiotic. Its derivatives and nitrofuran compounds are widely used in clinical practice and veterinary medicine and can be employed to preserve animal feed, prevent and treat gastrointestinal infections caused by bacteria, and accelerate animal growth. However, studies have proven that nitrofuran and its metabolites have carcinogenic and teratogenic side effects on humans and that diseases such as hemolytic anemia and acute liver necrosis can also occur if excess nitrofuran antibiotics are consumed. This has gradually caused concern. Therefore, high-sensitivity monitoring of nitrofuran is important for safeguarding human health and life safety. Traditional methods such as chromatography, enzyme-linked immunosorbent assay (ELISA), and liquid chromatography-mass spectrometry (LC-MS) have the disadvantages of a long pre-treatment and analysis period, cumbersome processing, massive sample usage, and a high false-positive rate of test results. Therefore, it is necessary to find a rapid, accurate, and stable assay for monitoring the use of nitrofuran drugs. As biological samples are often present in a diluted state, sensitive detection of biomolecules without any binding site markers or aids remains challenging. Metamaterials have unique optical properties and exhibit unique characteristics, such as local electric field enhancement, which can be tuned by the geometric design of metamaterials. The electric field enhancement in metamaterials can improve the interaction between the sample and terahertz (THz) waves. Thus, the use of THz metamaterials as a sensing platform can overcome the low sensitivity of biological samples in the THz range and enable biomolecular detection in a label-free manner. We hope that the use of metamaterials will enable the non-destructive and rapid detection of nitrofuran drugs.MethodsTHz waves are parts of electromagnetic waves between far infrared and microwave, which have good safety and fingerprinting properties for substance identification without damaging effects on substances. The basic principle of THz time-domain spectroscopy is to use femtosecond pulses to generate and detect time-resolved THz electric fields and to obtain spectral information of the measured item through the Fourier transform. Since the vibration and rotation energy levels of macromolecules are mostly in the THz region, and macromolecules, especially biological and chemical macromolecules, are groups of substances with physical properties, the structure and physical properties of substances can thus be analyzed and identified through characteristic THz frequencies. Meta-surfaces are two-dimensional artificial sub-wavelength periodic structures that can better respond to electromagnetic waves compared to natural materials. The electromagnetic waves are modulated by the change in the shape and size of the structure. A change in the refractive index of a sample attached to the surface of a meta-surface sensor can alter the local field of the meta-surface, which is reflected by the change in the resonance peak of the spectrum. In this paper, a symmetrical open-ring meta-surface structure is designed, which has two layers. The open-ring surface structure is constructed from metallic aluminum (Al), and the substrate structure is constructed from polyimide (PI). PI is a flexible material that has the advantages of a small dielectric constant and stable properties and is non-damaging to biological materials. Simulations of the meta-surface are based on the simulation software CST Studio Suite with a full-vector finite element method (FEM). The structure has a refractive index sensitivity of 196 GHz/RIU and can be applied for high-sensitivity sensing detection. Experiments are performed with different mass concentration gradients of furazolidone and furantoin solutions. 60 μL of different mass concentrations of analytes are added dropwise to the meta-surface structure by a pipette, and then it is heated to 50 ℃ and left to dry. THz pulses are incident vertically on the furan-covered meta-surface for spectral acquisition.Results and DiscussionsThe meta-surface structure designed in this paper is simple and has a low processing cost, and its detection is more intuitive and faster and requires fewer samples than conventional methods. The refractive index sensitivity of 196 GHz/RIU is achieved when the refractive index n varies from 1.0 to 1.8, which allows the structure to be used as a high-sensitivity refractive index sensor (Fig. 7). To demonstrate the enhanced detection capability of the meta-surface structure for nitrofuran drugs, we measure THz spectra before and after the dropwise addition of the furazolidone solution to the polyimide substrate. No significant change in the transmission spectrum is observed. In contrast, the meta-surface structure shows a significant red shift in the position of the transmission peak after the dropwise addition of the furazolidone solution (Fig. 8). In the measurement of the THz transmission spectra of furazolidone and furantoin in the mass concentration range of 10-1000 mg/dL, there is a regular red shift at the resonant frequency of the sensor with the increasing concentration and a significant frequency shift. The experimental results indicate that the meta-surface structure can effectively enhance the interaction between furazolidone and THz waves with high sensitivity. The results of several experiments demonstrate that the limited detection mass concentration of 10 mg/dL for both furazolidone and furantoin is achieved (Figs. 10 and 13). This meta-surface is expected to be used for highly sensitive sensing detection.ConclusionsIn this paper, the resonance characteristics and sensing performance of a THz meta-surface sensor based on a symmetrical open ring are investigated. Theoretical simulations show that its refractive index sensitivity reaches 196 GHz/RIU and can be applied to high-sensitivity sensing detection. The results indicate that the sensor can detect two nitrofuran drugs (furazolidone and furantoin) at a minimum mass concentration of 10 mg/dL. This sensing method is mainly based on the difference in dielectric properties of the analytes to be measured, and thus, the meta-surface structure can be applied to the detection of other antibiotics or biochemical samples. This provides a good theoretical and experimental basis for the future development of high-sensitivity sensors.
ObjectiveCerebral blood flow (CBF) is the main objective index for clinical diagnosis of cerebrovascular diseases such as cerebral infarction and cerebral hemorrhage. Among them, the measurement of regional cerebral blood flow (rCBF) is of great significance for targeted long-term and real-time detection of target areas of specific diseases such as epilepsy and Alzheimer's disease. In recent years, non-invasive spectral methods for CBF detection have developed rapidly. The more widely employed blood flow monitoring methods are laser speckle contrast imaging (LSCI), diffuse correlation spectroscopy (DCS), interferometric diffusing wave spectroscopy (iDWS), and diffusing speckle contrast analysis (DSCA), which all share the advantage of non-invasive measurement of blood flow adopting non-ionizing radiation. In addition to building an analytical model for detecting rCBF, this paper proposes an interferometric diffusing speckle contrast analysis (iDSCA) method and further constructs an experimental system. The system consists of three modules of laser source module, optical heterodyne module, and imaging acquisition module.MethodsThe iDSCA method combines the advantages of iDWS and DSCA, which can achieve high sensitivity and high-resolution two-dimensional velocity imaging, and is of research significance for the long-term detection of rCBF. The electric field intensity of scattered light carries the motion information of scattered particles. In the DSCA principle, the speckle contrast K of diffusing speckle is the integral function of the electric field time autocorrelation function within the exposure time, and it is also the blurring degree of the dynamic speckle image. The reciprocal of its square is employed as the relative blood flow index (BFI) of scattered particles to evaluate the actual blood flow state. Aiming at the measurement error caused by various noise interference in the iDSCA model to calculate the speckle contrast K, the real speckle contrast K obtained by pre-evaluating and correcting the system noise can avoid interference such as laser source noise and camera noise. In this study, the feasibility of this method to detect the linearity of rCBF flow velocity, and the discrimination ability and quantitative analysis ability of this system for different target regions of blood vessels to be measured are verified by analyzing the parameters of multiple diameters and multiple distances through the local phantom flow velocity experiment of the brain. In addition, in vivo experiments and cuff-induced occlusion protocol experiments are carried out at different parts, and blood pressure is measured simultaneously.Results and DiscussionsThe system can effectively improve the signal-to-noise ratio and detection accuracy of non-invasive rCBF detection. The results of phantom flow velocity experiments show that the relative BFI has good linearity with the actual flow velocity, and the average linear correlation coefficient within the source-detector distance (SD) of 6–12 mm is 0.9881 ± 0.0005 (Fig. 6). This detection method can distinguish the flow velocity changes in different target areas, and the relative error of 4.8 mm tube diameter is 2.04% (Table 1). Combined with the vascular diameter measurement method, the flow velocity and flow can be effectively monitored. The increasing trend of BFI measured at SD of 6-12 mm is consistent with the change of flow. The results show that the system can better detect the target area to be measured with a large cross-sectional area within the effective range (Fig. 7). Through in vivo experiments and cuff-induced occlusion protocol experiments (Fig. 8 and Fig. 9), it is proven that the system can detect the flow velocity information of rCBF in vivo and has good detection accuracy within the range of effective measurement flow velocity.ConclusionsAs the optical method for monitoring rCBF is difficult to achieve two-dimensional blood flow imaging, this paper builds a diffusion speckle imaging system with optical heterodyne structure based on the diffusing interference spectrum technology. The improved diffusing speckle contrast analysis method is combined to detect rCBF in real time. Firstly, the feasibility of the system to detect the flow velocity linearity, the discrimination ability, and the quantitative analysis ability of different target areas to be measured are verified through the experimental design of the phantom flow velocity of the brain from analyzing multi-diameter and multi-distance parameters. Secondly, the in vivo experiments of different parts are further designed to verify the measured BFI signals by combining signals of blood pressure. Additionally, the cuff-induced occlusion protocol is conducted to compare the BFI waveforms in three states to verify the reliability of the system detecting and distinguishing rCBF in different regions. This study is expected to achieve non-invasive and long-term monitoring of rCBF and provide a theoretical basis for early diagnosis and treatment of cerebrovascular diseases. In the future, studies will be further conducted on the qualitative and quantitative analysis ability of the system combined with the iDSCA method to detect rCBF, and the clinical application value of rCBF two-dimensional blood flow imaging.
ObjectiveProgressive addition lenses (PALs) not only solve the problem that the elderly need different focal powers for distance and near visions but also overcome the image jump of bifocal lenses owing to their continuously varying focal power along the meridian. Therefore, PAL design methods have a broad development prospect. PALs are mainly designed by a direct method and an indirect method. Although the indirect method offers convenient design, its prism is large when the focal power changes. The design of PALs by the direct method has the disadvantage that the maximum peripheral astigmatism exceeds two times the addition power (ADD) according to the Minkwitz theorem. Nevertheless, the direct method has relatively favorable advantages for the distance and near areas. The optimization of the direct method in China and abroad mainly focused on the changes in the focal power along the meridian, the optimization of the local average focal power, and the calculation equations for different surface heights. In contrast, how to obtain reasonable focal power profile distributions on the lenses has rarely been reported. In addition, a conic parametric equation can be changed into an equation satisfying the conditions of the focal power profile distribution along the meridian. Therefore, this paper proposes a method based on a conic parametric equation to reasonably distribute the focal power profile on the entire lens, achieve the design of PALs by the direct method, and ultimately reduce peripheral astigmatism.MethodsOn the basis of the principles of geometry and the direct method, the law of curvature change along the meridian of the lens is determined to satisfy the trigonometric function in this study, and the surface height equation is calculated as a spherical equation. Specifically, the function of the focal power profile distribution is solved by the circular parametric equation and also by the hyperbolic, parabolic, and elliptic equations. Then, the four sets of surface height data are used to simulate the focal power and astigmatism of the lenses in the simulation software. The designed lenses are processed and tested by the free-form surface machining machine, and the experimental results are verified. Finally, the influences of different conic parametric equations, i.e., hyperbolic, parabolic, elliptic, and circular equations, are analyzed for the optical properties, such as the focal power and astigmatism, of the lenses.Results and DiscussionsTheoretical analysis, actual processing, detection, and comparison reveal that the method of solving the focal power profiles of lenses by conic parametric equations is feasible (Fig. 7). The actual focal power in the distance area and ADD of the four groups of lenses meet the national standard (GB 10810.1—2005). The conic parametric equations mainly include the hyperbolic, parabolic, elliptic, and circular equations, and different equations can be used to design the focal power profile on the whole lens. Moreover, the width of the distance and near areas can be set as required, and the distribution of peripheral astigmatism can be adjusted. With the same parameter (Table 1), the maximum peripheral astigmatism of the lens obtained by solving the hyperbolic equation is 1.36 times the ADD, and the visual effect is relatively poor (Table 2); the distortion of the lens on the periphery of its area of the fixed focal power calculated by the elliptic equation is the smallest. The maximum peripheral astigmatism of the lens obtained by solving the parabolic equation is the smallest, and the corresponding ratio of the maximum peripheral astigmatism of the lens to the ADD is also the smallest. The area with peripheral astigmatism larger than 1.75 D on the lens obtained by solving the elliptic equation is relatively small (Fig. 8), and the width of the actual visible area at the fixed focal power point in the distance area is the largest. Therefore, the elliptic equation can be used as the basis for further optimization design in the future.ConclusionsIn this paper, the focal power profile distributions obtained by four different conic equations are proposed to design PALs, and the four groups of lenses are simulated, evaluated, and processed. The results show that the focal power profile distributions obtained by different conic equations have an impact on the design of PALs. With the design parameters, the peripheral astigmatism of the lens obtained by solving the hyperbolic equation is large and thus highly likely to cause severe vertigo when people wear such lenses to look around. In contrast, the peripheral astigmatism of the lenses calculated by the elliptic, circular, and parabolic equations is all smaller than that calculated by the hyperbolic equation. On this basis, variables are added to control the size of the distance and near areas so that the visible area at the fixed focal power point can be adjusted. However, a larger area of the fixed focal power corresponds to larger distortion and dispersion of the spherical lens. Consequently, the actual width at the fixed focal power point will be smaller than the theoretical value. When the area of the fixed focal power is small, the distortion of the PAL designed on the basis of the circular equation on the periphery of its area of the fixed focal power is the smallest. In future research, the inner surface of PALs can be transformed from a spherical design to an aspherical design on the basis of this design method to further study the optimal design of PALs, reduce the tangential error, and obtain more accurate actual results.
ObjectiveBecause liquid crystal itself does not emit light, a backlight unit (BLU) is needed to provide illumination rays. The brightness and volume of a BLU largely determine the performance of a display. Ultra-thinness has become a popular trend, which requires a light-emitting diode (LED) BLU to minimize its thickness as soon as possible. The direct-lit BLU has the advantages of high brightness, high energy utilization rate, and good uniformity. In order to reduce the production cost, the number of LEDs in the direct-lit module is decreasing, and the distance between LEDs is increasing, which makes the optical distance (OD) larger. Free-form lenses have been widely used in direct-lit BLUs to reduce the thickness and increase the distance-height ratio (DHR). However, when the OD is quite small, the size of the designed lens is relatively small, which results in a large processing error. Furthermore, the illuminance uniformity will be reduced when the lens designed based on the point source method is used for the extended light source. A lot of complicated optimizations are needed to improve uniformity. Therefore, an ultra-thin lens based on the surface microstructure is designed in this paper. The lens first collimates the rays emitting from an LED and then reflects the rays by the microstructures, which can increase the size of the illumination spot during the limited OD. The curvature of the designed surface is small, which can help avoid the influence of processing errors.MethodsIn this paper, a lens design method based on the surface microstructures is proposed for an ultra-thin BLU that consists of an array of LEDs with a pitch of Δpitch,x×Δpitch,y (Δpitch,x is pitch of x direction, and Δpitch,y is pitch of y direction). This design is different from the traditional double free-form surface lens which uses the free-form surface with a large curvature to refract the light at a larger angle. In this paper, the free-form surface is used to collimate the rays from the light source, and then the collimated rays are reflected to the bottom by the surface microstructure. After that, the rays are reflected again by the reflection film at the bottom so that the spot size can be effectively increased under the small OD. In addition, the collimation effect of a traditional total internal reflection (TIR) lens designed based on a point light source is not ideal under an extended light source. Therefore, the proposed method uses the edge ray principle to improve the collimation of the rays passing through the free-form surface under the extended light source. It requires no complicated optimization when the point light source is replaced by the extended light source.Results and DiscussionsThe design is carried out in a BLU with a mini-LED number of 3×3, an array pitch of 15 mm×15 mm, and an OD of 3 mm. Based on Snell's law, the paper firstly designs three free-form surfaces to collimate the ray emitted by the light source and then designs surface microstructures to reflect the collimated rays to the bottom (Fig. 2). In addition, based on the edge ray principle, the paper optimizes the free-form surfaces so that it can improve the collimation of the rays when the light sources are changed to the extended ones (Fig. 10). The simulation model is built in LightTools. The simulation results show that the uniformity can reach 82% for a 3×3 LED array with an OD of 3 mm and a DHR of 15 mm. Compared with that of the traditional double free-form surface lens, the uniformity is improved by 40.7%.ConclusionsFree-form surface lenses have been widely used in direct-lit BLUs to reduce the thickness and increase the DHR. However, when the OD is small, the size of the designed lens is relatively small, which results in a large processing error. In addition, the illuminance uniformity will be reduced when the lens based on the point source method is used to form the extended light source. In this paper, an ultra-thin lens based on the surface microstructure is designed according to the TIR principle. The free-form surfaces are used to collimate the rays from the light sources. Then the collimated rays are reflected to the bottom by the microstructures. The rays are reflected once more by the reflection film. Therefore, the spot size can be effectively increased under the small OD. In addition, the edge ray principle is used to improve the collimation of the rays passing through the free-form surface under extended light sources. With no larger curvature, the designed lens can avoid the influence of processing error and achieve satisfying illumination. The proposed method does not need a lot of complicated optimization work, which presents high practical application value.
ObjectiveMicrophones have been widely applied in fields such as unmanned aerial vehicle (UAV) detection and tracking, noise monitoring, medical devices, and disaster warning. Optical microphones based on grating Fabry-Perot (FP) interferometry have the advantages of high sensitivity, easy integration, and low power consumption. Therefore, they provide a development direction for integrated grating interferometric microphones. There are two challenges in implementing integrated grating interferometric microphones: 1) how to optimize the design of the microphone structure to guarantee a small size and a high performance; 2) how to stabilize the microphone at the quadrature operating point for high-fidelity and high-sensitivity detection of acoustic signals. Owing to the thermal expansion effect on the FP cavity length of the grating interferometric microphone, the operating point of the microphone inevitably drifts with the ambient temperature. A conventional method to overcome this drawback is to modulate the FP cavity length through electrostatic force to compensate for the temperature-induced cavity length variation. However, this method is effective merely when the drive voltage is greater than 10 V. Moreover, the electrostatic force between the diaphragm and the back electrode will affect the elasticity of the diaphragm and thus make the frequency response characteristic of the microphone change. In this work, we develop an integrated grating interferometric microphone, which consists of a micro-electro-mechanical system (MEMS) diaphragm on the silicon on insulator (SOI) substrate, a metal grating on the glass substrate, a vertical cavity surface emitting laser (VCSEL), and a miniature photodetector (PD). In addition, we propose a simple method to compensate for the temperature-induced cavity length variation, which is to modulate the VCSEL wavelength to match the quadrature operating point of the microphone. We also analyze the effect of the divergence angle of the VCSEL on the design parameters of the microphone, conclude a rule of designing the integrated grating interferometric microphone, and successfully match the operating point to the quadrature operating point by modulating the wavelength. Our work can overcome the current challenges in preparing integrated grating interferometric microphones.MethodsIn order to optimize the design of the microphone structure for a small size and a high performance, a VCSEL and a miniature PD are adopted to build a microphone. Since the VCSEL still has a certain divergence angle, an optical design model is established by analyzing the reflection diffraction and transmission diffraction processes of the grating interferometer using geometric optics. Under the given PD active area, grating period, and FP cavity length, the optical design model can derive the best placement position of PD to ensure the high integration of a grating interferometric microphone. In addition, a laser wavelength tuning method by applying the thermoelectric effect of VCSEL is proposed to match the operating point to the quadrature point. The method discriminates the operating point by monitoring the normalized light intensity and the frequency-domain harmonic components. The amplitudes of the fundamental frequency (FF) component and second harmonic (SH) component at different operating points are analyzed. The FF component with a larger amplitude is selected as a reference, which can make the method have higher accuracy. The method can avoid the problems of high voltage and low reliability introduced by conventional methods.Results and DiscussionsBy using the geometric optical design model proposed in this work, an integrated grating interferometric microphone is fabricated. The overall size of the microphone is 10 mm×10 mm×2.5 mm, and the sensing core size is 0.93 mm×0.34 mm×2.5 mm (volume of 0.79 mm3) (Fig. 8). An experimental setup for the acoustic test is built to verify the operating point adjustment method and characterize the microphone performance (Fig. 9). The operating point determination test results show that the laser wavelength tuning method is realized under the conditions of an operating voltage of 5 V and a drive current of no more than 15 mA (Fig. 10). The method features low voltage and low current. Thus the proposed microphone can be applied to cases with low voltage. The performance characterization results show that the proposed integrated microphone has a high-quality response waveform in the low-frequency range of 50-100 Hz (Fig. 11). Moreover, the sensitivity of the proposed integrated microphone is 22.10 mV/Pa at 251.2 Hz, and the microphone has a flat response with a fluctuation range of no more than ±3 dB in the low-frequency range from 50 Hz to 300 Hz (Fig. 12). Therefore, the proposed microphone can be applied to the field of low-frequency acoustic detection.ConclusionsIn this work, an integrated grating interferometric microphone with a sensing core size of 0.93 mm×0.34 mm×2.5 mm (volume of less than 0.8 mm3) has been proposed and experimentally demonstrated. In order to optimize the design of the microphone structure, the effect of laser divergence angle is analyzed, and thus an optical design model for grating interferometers is proposed. According to the optical design model, an integrated microphone with an overall size of 10 mm×10 mm×2.5 mm is fabricated. The experimental results of the operating point determination test show that the proposed operating point adjustment method is realized in low voltage conditions. The experimental results of performance characterization show that the microphone has a flat frequency response curve in the low-frequency range from 50 Hz to 300 Hz with a sensitivity of -33.11 dBV/Pa at 251.2 Hz. Compared with the existing studies, the proposed integrated grating interferometric microphone has a smaller sensing core and a low-voltage modulated operating point and thus can be widely applied. Moreover, the proposed microphone has an excellent response in the low-frequency range and thus shows a great application prospect in the field of low-frequency acoustic detection.
ObjectiveIn recent years, with the rapidly growing transmission capacity of global optical communication networks, silicon photonics (SiP), featuring compatibility with CMOS and high integration, has attracted great attention in optical communication systems, in which the modulator is an important part of the optical communication link. Mach-Zehnder (MZ) modulator based on traveling-wave electrode (TWE) carrier depletion has been widely employed in practical communication equipment because of its thermal stability and high robustness. However, the large junction capacitance and low modulation efficiency of the traditional ridge waveguide modulator limit its performance. In recent years, academic circles have made innovations in junction structures. Heteromorphic structures such as interleaved pn junction increase the interaction area between the light field and carrier, and improve the phase shifting efficiency. However, this is achieved at the expense of junction capacitance and bandwidth. Additionally, the TWE of the modulator must be well designed to ensure the matching between the refractive indexes of the RF signal and the optical signal, and the matching in electrode impedance to reduce the reflection at the source and the terminal to ensure the modulation depth. This paper aims at the large pn junction capacitance and low modulation efficiency of the silicon-based modulator with a single-drive push-pull scheme. We propose a hetero-doped silicon-based slot waveguide modulator to increase the bandwidth on the basis of ensuring modulation efficiency.MethodsThe whole design is divided into two parts of pn junction structure and electrode design. pn junction is formed by ion doping into the silicon waveguide, in which the boron atom is doped into the silicon waveguide to form the p region of pn junction, and the phosphorus atom is doped into the n region of pn junction. The top and bottom of the silicon waveguide are coated with silicon dioxide cladding. The two L-doped pn junctions and the intermediate heavily doped n++ region are reversely connected as the main part of the MZ modulator phase shift region. The DC bias voltage is applied to the n++ doped region, which makes both pn junctions work in the reverse bias state. The hetero-doped structure increases the interaction region between the optical field and the charge carrier, but also increases the junction capacitance. Therefore, the ridge waveguide structure is etched with slit regions to reduce the dielectric constant in them and reduce the junction capacitance. To maximize the modulation depth, this paper designs the TWE structure, adopts the T-shaped capacitive load electrode structure, and optimizes the parameters to ensure that the refractive index of the electrode is the same as that of the light in the waveguide, and the electrode impedance is matched by 50 Ω. Finally, the proposed structure at the link level is simulated to prove its high-speed modulation performance.Results and Discussionspn junction adopts the hetero-doped slot waveguide structure. This paper simulates the loss and phase shift efficiency of the proposed structure and the traditional ridge waveguide structure. The results show that the proposed structure does not introduce excessive optical loss and ensures phase shift efficiency (Fig. 5). In addition, a decimation comparison of the junction capacitance values is conducted, and the proposed structure leads to a 24% reduction in junction capacitance compared with the conventional ridge waveguide (Fig. 6). Then, the electrode design is optimized by the ABCD matrix method, which ensures the matching of the refractive index and impedance of the electrode. The bandwidth of the traditional ridge waveguide and the proposed structure modulator are compared through simulations. Under the bias voltage of 4 V, the bandwidth of the proposed structure modulator reaches 42 GHz, which is 32% higher than the bandwidth of the traditional ridge waveguide (Fig. 10). Finally, the modulation performance of the hetero-doped slot waveguide structure in a 70 Gbit/s high-speed link is demonstrated, and the extinction ratio of eye diagram reaches 5.2 dB.ConclusionsThis paper proposes an all-silicon modulator design for hetero-doped slot waveguides with single-drive push-pull TWEs, thereby increasing the interaction between the carrier depletion region and the optical field and ensuring modulation efficiency. Compared with the conventional ridge waveguide, the junction capacitance is reduced by 24%, and the bandwidth is increased by 32%. The hetero-doping ensures sound modulation efficiency. Under DC bias voltage, the modulation efficiency of 1-4 V is 1.8-2.5 V·cm, and the waveguide loss in the active region caused by carrier doping remains below 0.1 dB/cm. The slot waveguide structure reduces the dielectric constant in the etched area of the waveguide, reduces the junction capacitance, and increases the bandwidth. At the same time, the T-shaped track electrode is designed based on the waveguide structure design, and the excellent impedance matching and refractive index matching of the electrode are carried out by the transmission line equivalent circuit model. Under 4 V DC bias voltage, the electro-optic 3 dB bandwidth of the modulator reaches 42 GHz. Finally, the OOK signal modulation eye diagram of the hetero-doped modulator with slot waveguide is obtained at a low peak voltage of 2 Vpp of 70 Gbit/s, and the extinction ratio of the eye diagram reaches 5.2 dB, which proves that the designed modulator has a good high-speed modulation performance.
ObjectiveThis study designs a biconical axicon to overcome the limitation of a short non-diffraction distance of terahertz Bessel beams generated by a traditional axicon. The traditional axicon is widely used to generate terahertz Bessel beams because of its simple structure and high conversion efficiency. However, when the radius of the incident terahertz wave is fixed, the non-diffracting distance of the terahertz Bessel beam is inversely proportional to the base angle and refractive index of the axicon. At present, the materials used to make terahertz lenses are mostly high-density polyethylene (HDPE), and the refractive index changes little with the frequency of the terahertz wave. Most studies increase the non-diffracting distance of terahertz Bessel beams by reducing the base angle of the axicon. However, the small-angle axicon is prone to produce errors in the processing process, which affects the quality of terahertz Bessel beams. Hence, the traditional axicon has certain limitations in generating terahertz Bessel beams with a long non-diffracting distance, which restricts the application of terahertz Bessel beams in some fields such as large depth-of-focus imaging and nondestructive testing. Therefore, on the basis of the traditional axicon, we design a biconical axicon with a simple structure, which does not require complex optical path adjustment to generate terahertz Bessel beams with a long non-diffracting distance.MethodsThe theory of geometric optics is used to analyze the principle of generating terahertz Bessel beams by the biconical axicon and derives the expression of the non-diffracting distance of terahertz Bessel beams. Then, the optical field distribution of the terahertz wave after passing through the biconical axicon is analyzed with the integral theory of diffraction. The finite-difference time-domain method is employed to simulate and analyze the transmission characteristics of terahertz Bessel beams and the influence of different processing errors on the transmission characteristics. Finally, the function of the biconical axicon is verified by the transmission terahertz time-domain spectroscopy system.Results and DiscussionsBy the finite-difference time-domain method, the traditional axicon with a base angle of 20° and the biconical axicon with base angles of γ2=20°and γ1=15° are simulated and calculated. The non-diffracting distance of the terahertz Bessel beams generated by the terahertz wave through the traditional axicon is 27.55 mm. Under the same parameter conditions, the biconical axicon can generate terahertz Bessel beams with a non-diffracting distance of 110.18 mm, namely that the non-diffracting distance is broadened by 82.63 mm (Fig. 5). The non-diffracting distance increases as the base angle of the biconical axicon grows (Fig. 6). Meanwhile, the simulations show that the vertex alignment error does not affect the non-diffracting distance of the terahertz Bessel beams when it does not exceed 0.2 mm (Fig. 8). The experimental results demonstrate that the terahertz Bessel beams with a non-diffracting distance of 110 mm can be generated by the terahertz wave through the biconical axicon with base angles of γ2=20° and γ1=15° (Fig. 11), which is consistent with the simulations.ConclusionsIn this paper, a biconical axicon capable of generating terahertz Bessel beams with a long non-diffracting distance is designed. The theory of geometrical optics is used to analyze the generation mechanism of terahertz Bessel beams, and the diffraction theory is applied to derive the expression of the optical field distribution of terahertz Bessel beams. The transmission characteristics of non-diffracting beams and the influence of processing errors on transmission characteristics are simulated and analyzed. The simulations show that compared with the traditional axicon, the biconical axicon can generate terahertz Bessel beams with a longer non-diffracting distance. The non-diffracting distance increases with the rise in the base angle of the conical bottom surface, and the vertex alignment error does not affect the non-diffracting distance of the terahertz Bessel beams when it does not exceed 0.2 mm. Meanwhile, a transmission terahertz time-domain spectroscopy system is built to verify the function of the biconical axicon. The biconical axicon with base angles of γ2=20° and γ1=15° is used to generate terahertz Bessel beams with a non-diffracting distance of 110 mm. Compared with the case of the traditional axicon, the non-diffracting distance is broadened by 82.63 mm. The experimental results are consistent with the theoretical simulations. The results indicate that the biconical axicon can generate terahertz Bessel beams with a long non-diffracting distance, which improves the practicability of terahertz Bessel beams in terahertz nondestructive testing.
ObjectiveThe optical vortex is a spatially structured optical beam, the photon of which carries orbital angular momentum (OAM). When this beam illuminates the surface of a rotating object, the frequency of scattered light shifts. This phenomenon is called the optical rotational Doppler effect (RDE). The value of the frequency shift of the scattered light is related to the topological charge of the optical vortex and the rotational speed of the object. In engineering applications, the quality of the optical vortex is not ideal. For example, the mode of the optical vortex is usually not pure due to atmospheric turbulence. Additionally, the optical axis and the rotation axis do not always coincide with each other, and the optical beam may be partially cut out. All the circumstances above will make the scattered light from a rotating object have more than one frequency shift value, which causes many peaks in the frequency spectrum of the scattered light. In that case, it is difficult to distinguish the frequency peak related to the topological charge and the rotational speed, and thus, the amount of measurement errors increases. An optimized signal processing method is urgently required. To raise the measurement accuracy of the rotational speed, we analyze the characteristic of the broadened frequency spectrum on the basis of OAM decomposition and present dual Fourier analysis to transform the broadened frequency spectrum into a spectrum with a single peak related to the rotational speed.MethodsThe broadened frequency spectrum of the scattered light is essentially related to the OAM-mode broadening. A standard Laguerre-Gaussian (LG) mode is a solution to the paraxial wave equation in the cylindrical coordinate system and carries a single OAM. All of the standard LG modes make up a complete set of orthogonal vectors, and any optical beam can be represented as a superposition of standard LG modes. When the mode of the optical vortex is not pure, a lateral displacement exists, or the beam is not intact, and the LG modes that constitute the illuminating beam are not single, which leads to more than one rotational Doppler shift value. Due to the quantization of the OAM, the interval between topological charges of the LG modes that constitute the illuminating beam is one (Fig. 2) when near the original topological charge of the illuminating optical vortex. Hence, the interval between the rotational Doppler shift values is the rotational frequency of the rotating object. When the rotational speed is fixed, the frequency interval between the peaks in the frequency spectrum of scattered light is the same. Therefore, we consider the frequency spectrum as a periodic function of frequency, whose period is the rotational frequency. By performing Fourier transform again to the frequency spectrum, we can obtain the secondary frequency spectrum with a single peak whose frequency value is the reciprocal value of the rotational frequency. For easy distinction, the original frequency spectrum is called the primary frequency spectrum. As we perform Fourier transform twice on the scattered light signal, we call this method dual Fourier analysis.Results and DiscussionsWe design an experiment of RDE using an LG vortex with an impure mode or a lateral displacement and a half-covered LG vortex (Fig. 3). After the Fourier transform on the signal received by the photodetector (PD), we can obtain the primary frequency spectrum (Fig. 6). The frequency values of the peaks in the primary frequency spectrum have an interval of the given rotational frequency (Fig. 6). As the intensity of LG modes constituting the beam is different, the amplitude of these peaks varies. Thus, we consider that the primary spectrum is a periodic function modified by an amplitude modulation function. Then, we take a logarithm of the primary spectrum function and perform Fourier transform again to obtain the secondary spectrum with a single peak whose frequency value is the reciprocal value of the rotational frequency (Fig. 6). In situations of the impure LG mode, beam misalignment, and incomplete beam, we can acquire the same result using this method, and the rotational speed can be always measured from the secondary frequency spectrum. By this means, we separate the rotational speed from the broadened primary frequency spectrum, and the rotational speed measured from the secondary frequency spectrum is relatively accurate.ConclusionsBy analyzing the characteristic of the broadened frequency spectrum based on the mechanism of the OAM decomposition, we present a method called dual Fourier analysis to transform the broadened frequency spectrum into a spectrum with a single peak. Accurate rotational speed can be measured from the second frequency spectrum. This method simplifies the demand of beam quality and incidence conditions, and hence, it can obtain the rotational speed of the object in a more convenient and clearer manner. The method also promotes the application of RDE in practical projects.
ObjectiveBased on the rotational Doppler effect (RDE), the vortex beam carrying orbital angular momentum (OAM) can be sensitive to the rotation movement along the normal direction, so the vortex beam is widely used for measuring the rotational speed. At present, the commonly used beam in RDE research is the Laguerre-Gaussian (LG) beam. However, most studies focus on the relationship between the azimuthal index in the vortex beam and OAM, frequency shift, and other physical quantities. Few researchers have paid attention to the radial index. Compared with Bessel beams, the LG beam with a high radial index shows better self-healing. Under equal conditions, the LG beam with a high radial index shows a certain degree of nondiffracting characteristics, and the beam quality is better during propagation. Although the influence of the non-zero radial index on RDE has been explored in previous literature, it is only limited to the case where the vortex beam coincides with the rotational center of the object. In practical noncooperative measurement, it is more common that the LG beam does not coincide with the object's rotating axis. Therefore, this research mainly explores the influence of the LG beam's radial index on the rotational Doppler signal under the misaligned condition. It is found that different from the alignment condition, although the radial index of the LG beam can enhance the amplitude of the rotational Doppler signal under the condition of lateral misalignment, which is helpful for rotational speed extraction, the relationship is not linear. With the increase in the radial index, the amplitude of the frequency signal increases first and then decreases. There is an optimal radial index, which maximizes the signal amplitude. This discovery expands the practical application range of RDE and helps to select the appropriate radial index, so as to improve the detection range under the condition of lateral misalignment. Therefore, it is of great significance for reference.MethodsIn the study, LG beams with different radial indexes are used as the detection light source. First, the physical meaning of the radial index is described, and the influence of the radial index on the intensity distribution of the LG beam is analyzed. Combined with the small scattering model, we have theoretically analyzed the influence of radial index on the rotational Doppler signal under the misalignment condition and the reason. Second, a proof-of-concept experiment is designed for rotational speed detection by using different radial indexes. The experiment shows that the radial index affects the accuracy of target speed measurement and the amplitude of the frequency signal when the LG beam axis is not coaxial with the rotation axis of a spinning object. The experimental results are in good agreement with the theory. Third, different conditions are set to verify the generality and correctness of the rule through repeated experiments.Results and DiscussionsBy comparing the experimental results (Fig. 4), it is found that the average amplitude of the rotational Doppler signal first increases and then decreases with the increase in the radial index. When the radial index is 1 or 2, the effective average frequency amplitude is maximum. This is because, in the beginning, the increase in the radial index makes the number of concentric vortices increase. In addition, the beam intensity gradually increases, and the effective reflected signal and the frequency amplitude rise. Then, with the increase in the radial index, the energy of the central optical ring is concentrated, but the radius of the innermost ring gradually decreases. On the basis of the small scattering model, the radius decreases obviously, the rotational Doppler spectrum gradually broadens, and the average frequency amplitude decreases. After that, we change the topological charge of the vortex beam and do several repeated experiments. The measurement results (Fig. 6) have shown the same rule and proved the generality and correctness of the rule.ConclusionsThis study analyzes the influence of the radial index in the LG beam on the rotational Doppler signal under the condition that the object rotation axis is misaligned with the vortex beam axis. The experimental results show that with the increase in the radial index, the average signal frequency amplitude increases first and then decreases. Therefore, there is an optimal radial index to maximize the signal amplitude. Under the condition that the surface material of the rotating object is tinfoil, the average frequency signal is maximum when the radial index is 1 or 2. It is worth noting that when the influence of the radial index is considered, the material and shape distribution on the surface of the spinning object cannot be ignored. The optimal radial index for different materials has its particularity, which needs to be specifically considered when the rotational speed of the object based on RDE is measured. This research provides a reference for improving the rotational speed measurement ability in practical engineering, expands the practical application range of RDE, and contributes to selecting the appropriate radial index to increase the detection range of the spinning object. Therefore, it is of great reference significance for the engineering of rotational speed detection of spinning objects.
ObjectiveIn squeezing-enhanced system, the stability and squeezing level of the squeezed states directly affect the improvement of quantum enhancement sensitivity and signal-to-noise ratio (SNR). Squeezed states can be generated by an optical parametric oscillator (OPO) based on second-order nonlinearity. At present, Pound-Drever-Hall (PDH) is the most commonly employed method for locking the OPO cavity, and the photodetector plays a key role in extracting extremely weak signals. For PDH locking systems, the useful signals coupled to photodetectors are narrowband signals at the modulated frequency, while the traditional wideband photodetectors amplify signals and noise in the whole frequency band, which is not conducive to improving the SNR. It is worth noting that the seed light is employed in the active stable parametric cavity in the preparation of the bright squeezed state, and the increased seed power will lead to the coupling of the pump noise into the bright squeezed state, thereby resulting in the reduced squeezing level. However, the increased optical power of extracting signal can improve the error signal of the locked parameter cavity. Thus, it is important to design photodetectors with high gain and SNR. Photodiodes have certain junction capacitance, and combined with variable inductance, inductance and capacitance (LC) resonance circuit can be formed to enhance the resonance of specific frequency signals. The detector is named resonant photodetector (RPD). The LC resonance circuit can be equivalent to the parallel resonance circuit and is regarded as a bandpass filter, which only amplifies the required frequency band and suppresses the noise of unnecessary frequency bands. However, the quality factor Q directly characterizes the suppression effect on the external noise signal of the resonant frequency, and the SNR of the error signal directly affects the minimum jitter of the cavity length and phase after locking.MethodsTo evaluate the newly designed RPD, this paper builds a test platform to evaluate transfer functions and error signals, as shown in Fig. 4. The laser source is a single-frequency laser of 1550 nm. The half-wave plate HWP1 is employed to adjust the laser power reaching the modulator, and HWP2 is to adjust the polarization direction of the laser, perpendicular or horizontal to the modulator. This means that the direction is 45°from the main axis of the electro-optical crystal. The network analyzer sets the start and end frequencies of the test (starting from 1-100 MHz in the experiment, and then being refined according to the resonance frequency). The output signal is divided into two parts, one of which is loaded on the modulator for modulating the laser beam, and the other is returned as a reference signal. The second part is the measurement of the error signal, which adopts the electro-optical modulator (EOM). MC is closely related to the preparation of high level squeezed state. According to PDH technology, the anti-interference ability of locking is proportional to the peak-to-peak value of the error signal, and the larger peak-to-peak value will lead to stronger anti-interference ability. In addition to the incident laser power, the amplitude and SNR of the error signal also depend on the signal extraction capability of the photodetector, so the SNR of the error signal extracted by the photodetector determines the stability of the whole feedback loop. Therefore, the performance of the developed resonant detector is evaluated by the SNR and the stability of the error signal in MC cavity locking.Results and DiscussionsThis paper measures the transfer functions of commercial BPD (THORLABS PDA10D2) and RPD under the same conditions (Fig. 5). At the resonant frequency of 20 MHz, the gain of RPD is about 30 dB higher than that of BPD. The high gain helps to obtain a stable phase locking at lower power, thus improving the stability of the system in the squeezed state without reducing the quantum noise. Through external mixing and integrated circuit design, the 3 dB bandwidth of RPD is 0.285 MHz. The quality factor Q of RPD is 70 and can be calculated from the measurement results by Formula (5). The experimental results are shown in Figs. 6 and 7. The SNR improvement of the newly designed RPD is more obvious than that of BPD, and the SNR is defined as the ratio of the peak-to-peak value to the noise of the error signal. The error signal is a DC signal, which cannot be measured by a spectrum analyzer and can only be recorded by an oscilloscope. At the resonance frequency of 20 MHz, the peak-to-peak value of the RPD error signal is 560 mV, the peak-to-peak value of noise is 42 mV, and the SNR is about 22.5 dB. The peak-to-peak value of the BPD error signal is 35 mV, and the peak-to-peak value of noise is 20.8 mV. The SNR of the newly designed RPD is about 18 dB higher than that of BPD.ConclusionsBased on the theoretical analysis of the resonance circuit and cross-resistance amplifier circuit, the selection of low noise devices, and the optimized circuit layout, this paper develops a resonant detector with Q factor of 70 and SNR of 22.5 dB. Compared with the traditional broadband photodetector (BPD), the gain of RPD at 20 MHz is about 30 dB higher than that of BPD. By measuring the peak-to-peak value and SNR of error signals, the peak-to-peak value of RPD locking cavity error signals is 16 times that of BPD, and the SNR of RPD error signals is about 18 dB higher than that of BPD under the same condition. This RPD can provide a key device for photoelectric feedback control and the preparation of continuous variable nonclassical light fields.
ObjectiveAn optical reflectometer is a powerful optical instrument, and it is widely adopted in distributed fiber optic sensors for loss location and temperature and stress measurement. Usually, optical reflectometers include optical time domain reflectometers (OTDRs) and optical frequency domain reflectometers (OFDRs). OFDR uses a sweeping laser as the light source. Compared with OTDR, it has higher spatial resolution and larger dynamic range. However, when the detection length is longer than the coherence length of the light source, the phase noise will degrade the system performance greatly. Meanwhile, a high spatial resolution requires a wide range of sweeps of the probe light. Because of the high cost of narrow linewidth lasers and modulators, OFDR is difficult to be commercialized at present. Therefore, most OFDR studies focus on phase noise and sweep ranges. There are already many ways to suppress OFDR phase noise, such as narrow linewidth lasers and coding and phase compensation algorithms. Time-gated digital optical frequency domain reflectometry (TGD-OFDR) is also a method proposed in recent years to suppress phase noise and improve detection length. The frequency sweep method of OFDR is generally divided into external modulation and internal modulation. External modulation has better sweep performance and is easier to be controlled, but the sweep range is limited. The internal modulation has a large sweep range, but it has problems such as nonlinearity of the sweep frequency and linewidth broadening, and compensation or correction is often required through other means. Therefore, designing low-cost, long-range, and high-resolution TGD-OFDR systems is the main work in this paper.MethodsThe TGD-OFDR system has the characteristics of a simple structure, which can effectively overcome phase noise and achieve long-distance detection. By taking the advantages of low cost, easy integration, and high sweep range of distributed feedback (DFB) lasers, an internally modulated DFB laser is selected as the swept frequency light source, and a TGD-OFDR system based on the DFB laser is designed. Firstly, by analyzing the modulation method and frequency sweep characteristics of DFB lasers, a pre-distortion system based on the Mach-Zehnder interferometer (MZI) and Hilbert variation of DFB laser sweep nonlinearity is designed. The system is a closed-loop feedback system and is divided into an optical path part and a circuit part. The optical path part is an MZI with a delay path, while the circuit part includes a computer-controlled acquisition card and an arbitrary waveform generator. In addition, the calculation of the Hilbert variation and proportion integral differential (PID) algorithms realizes the pre-distortion processing of the swept frequency. Secondly, the current-modulated DFB laser is used as the swept frequency light source, and it is proposed for demodulation. A frequency-stabilized laser is added as a local detection light. At the same time, due to the uncertainty of the frequency sweep rate of DFB lasers and the system characteristics of TGD-OFDR, a photodetector is added to receive the analog reference signal, and the analog reference signal is used as a matching filter to directly perform the cross-correlation algorithm to obtain the trace curve.Results and DiscussionsIn the demonstration reflectometry experiment, the duration of the pulse τp is set to 6 μs by an acoustic optical modulator. The pulse chirp range is about 1.1 GHz, corresponding to a theoretical spatial resolution of 9 cm. The local reference laser is a tunable single-frequency diode laser. A high speed analog to digital device (NI 5185) acquisition card with a sampling rate of 6.25 GSa/s and a resolution of 8 bit is used to sample the beat signal on the balanced photo detector. The fiber under test (FUT) is composed of three coils of single-mode fibers with a length of 24.7, 24.8, and 24.7 km, respectively. The measured trace is shown in Fig. 9(a). The dynamic range is measured to be 23.3 dB, and 2100 measurements at seven different laser wavelengths are carried out. The dynamic range can be further improved if the laser's power is large. The spatial resolution at the start of the FUT is 10 cm, as shown in Fig. 9(b), which is very close to the theoretical spatial resolution. The spatial resolution at the far end of the FUT is about 18 cm, as illustrated in Fig. 9(c). The spatial resolution degeneration is mainly caused by the phase jitter of laser2 and the accumulation of phase noise, which is much larger than the linewidth of the DFB laser. Although the spatial resolution degenerates with a longer distance, it is still the best spatial resolution ever reported for the OFDR system with a measurement range of over 60 km.ConclusionsIn this paper, an internally modulated DFB laser is used as the probe in the TGD-OFDR system. A frequency modulation range of up to 1.1 GHz with a fast modulation rate is achieved by using a current-modulated DFB laser, and a narrow linewidth diode laser is employed as the stable oscillator. A spatial resolution of 18 cm is realized over a fiber link of 74 km, which is believed to be the best resolution ever reported for the OFDR system of over 60 km. The system performance can be further improved by more precise pre-distortion algorithms, more stable oscillators, and stronger light source power.
ObjectiveLaser-induced breakdown spectroscopy (LIBS) is a valuable element analysis method that has been widely applied in many fields including biomedical, industrial, and environmental analysis. It uses a pulsed laser beam to interact with the sample and produces a plasma plume above the sample surface. The emission spectra of the specific elements can be obtained from the plasma, and element compositions and contents of the sample can be gained by spectral analysis. The properties of plasma and sample analysis depend on the related parameters of the LIBS system, which includes the laser pulse and physical situation of the sample. Related works have been carried out to describe the effects of such conditions on laser-induced plasma through numerical simulation. Spatial confinement is an effective method to enhance LIBS signals. The plasma evolution, including its morphological characteristics, is affected by the presence of the cavity. The plasma confined by the cavity is physically modified, with its morphology changed, because of its interaction with the cavity walls. In this work, the effects of spatial confinement on plasma evolution and spectra in LIBS are investigated by the model. The laser-induced plasma plume of Al with or without the cavity is analyzed, and numerical information on the plasma particles is acquired during the expansion of plasma. In addition, the distributions of electron number density and electron temperature are studied. According to the plasma evolution data, the specific spectral signal intensities of the cases with different cavity widths are calculated. Under the same conditions as the simulation, experiments are performed to show the enhancement effect on signal intensity with the presence of the cavity and make a comparison with the simulation.MethodsIn this study, Al is employed as the sample material for the laser-induced plasma. Firstly, the initial conditions of the simulation process are determined, including relevant parameters of the incident laser, the spatial state of the sample (cavities with different sizes), and the boundary conditions of the simulation region. Given the state equation of the plasma evolution process and the simulation program FLASH, relevant data of the plasma can be obtained, including the plasma morphology and the spatial and temporal distributions of electron number density and electron temperature. Then, through the Saha equation and Boltzmann equation, the electron distribution information on the specific energy level can be further calculated. On the basis of the electron transition probability and absorption coefficient equation, the spectral intensity per unit can be acquired. After that, the overall spectral signal intensity is gained by the integration of the spectral signal of the acquisition region. In addition, experiments are conducted according to the parameters of the simulation, and the spectral signal intensities under different cavity widths are collected for further analysis combined with the simulation.Results and DiscussionsThe plasma evolution is significantly different in the case with or without the cavity. When the cavity exists, the expansion of plasma is affected by cavity walls, and the plasma morphology varies (Fig. 3). At the position of 1.0 cm above the Al surface, both the electron temperature and electron number density are enhanced (Fig. 5). This is because the shock wave produced by the laser-induced plasma is reflected by the wall, and then the reflected shock wave acts on the plasma and raises collision probabilities of particles in the plasma, which increases the electron number density and electron temperature and eventually leads to improvement of the spectral signal. The spatial confinement effect on plasma also contributes to the increase in the spectral signal intensity, the enhancement effect depends heavily on cavity width, and the maximum signal intensity is obtained at the width of 1.4 cm (Fig. 8). In addition, the tendency of the spectral signal intensity collected by the experiments is in good agreement with the simulation, which demonstrates good reliability of the simulation (Fig. 9).ConclusionsIn the present study, a two-dimension thermal model for nanosecond pulsed laser ablation of Al is developed to investigate the effect of spatial confinement on plasma evolution. The simulation yields numerical information on the spatial and temporal distributions of the plasma affected by cavities with different sizes. It can provide a reference for selecting the appropriate optical signal acquisition time and location in the experiments and a credible interpretation of the experimental data. When a cavity is present, the temperature and density of the plasma are enhanced, and the enhancement degrades as the cavity enlarges. The spatial and temporal distributions of electron temperature and electron number density are also studied for the calculation of signal intensity. Compared with the situation without the cavity, the signal intensity is significantly improved when a proper cavity exists. The maximum signal intensity is obtained at the cavity width of 1.4 cm, and this value is drastically improved compared to the case without the cavity. The variation trend of signal intensity with cavity widths obtained by the experiments matches well with the simulation. Moreover, it is shown that the presence of a cavity does not improve the signal intensity in all cases. A larger cavity width leads to weaker enhancement of plasma temperature and density, and signal acquisition is slightly affected by the presence of the walls. Both the simulation and experimental results suggest that the intensity is lower than that of the situation without a cavity when the cavity width is set to 2.0 cm.
ObjectiveThe random arrangement of dielectrics and nanostructures in disordered photonic crystals produces strong Anderson localization effect and does not require high-precision nanomaterials and structures. In the previous study, we reported photonic crystal organic films with disordered nanoparticles, which were a roll-to-roll expandable material for various applications in aerospace, automotive, construction, and apparel. However, the design parameters of disordered photonic crystals still need to be optimized. This paper aims to investigate the effect of fill factor, particle size distribution, and structural symmetry of nanoparticles on the light-insulation properties by using a finite-difference time-domain (FDTD) method. The discrete nanoparticle system of organic polymer films should be further designed by analyzing the light transport properties in the microstructure.MethodsOrganic film samples of discrete nanoparticles are prepared by using the tape casting method. The microstructure of TiO2 particles is observed by scanning electron microscopy and modeled in the FDTD. The nanostructure is simplified to a two-dimensional (2D) disordered photonic crystal in the non-polarized plane, with the particle size and the fill factor set according to experimental measurements. Electromagnetic field calculation is carried out by the FDTD method to analyze the microscopic electric field spatial distribution and macroscopic optical characteristic curves. Then the effect of different design parameters on the optical transmission characteristics is investigated. On the basis of SEM photographs, models of hierarchical size and agglomerated structures are established, and the electric field distribution of light waves in three typical structures is calculated and compared with the experimental transmittance curves. Floquet periodicity boundary conditions are set to investigate the propagation characteristics of polarized lights at different incident angles, and the wide-angle light-blocking capability is verified.Results and DiscussionsThe effects of the fill factor and particle diameter of TiO2 particles on the film spectra are investigated, and the spatial distribution of the electric field is used to describe the transmission characteristics of light waves in disordered TiO2 photonic crystals. At a fill factor of Mf=10%, the forbidden band width is wider in the range of 200-1500 nm, and the transmittance is higher. However, when Mf is larger than 45%, the forbidden band width is narrower in the wavelength range of 200-1100 nm, and the reflectance is higher at 1000 nm compared with that at a low fill factor. The results suggest that the optimal fill factor for TiO2 particles shall fall in the range of 35%-45%, so as to produce the best spectral forbidden band effect. As the nanoparticle diameter increases, the forbidden band region shifts towards the long wavelength band, and the reflection peaks become redshifted, in contrast to the blue shift observed when the fill factor increases. For a wavelength of 200 nm, the spatial electric field distribution is confined to the upper region of the array for nanoparticle diameter of 100 nm. The light of 800 nm propagates to the bottom surface of the film in the array with three particle sizes, but the phases are not synchronous. For electromagnetic waves with a length of 1600 nm, their propagation is unobstructed in the array of 100 nm, and the phase of the light reaching the bottom surface almost always reaches the wave peak, while the light reaching the bottom surface in the arrays of 200 nm and 300 nm undergoes multiple scattering and results in reduced transmittance. When the light wavelength is 3000 nm, much larger than the nanoparticle diameter, the light propagates through the film without scattering effects, the spatial distribution of the electric field is no longer influenced by the TiO2 particles, and the light transmission properties are consistent with those in a homogeneous polymer matrix. The effects of hierarchical particle size and structural aggregation on the light transmission properties are further investigated and compared with experimental results, which result in a 54% reduction in near-infrared (NIR) light transmission. Finally, the wide-angle light-blocking capability of the films is evaluated. Then the transmittance profiles and electric field spatial distribution at polarized waves are analyzed. For TE- and TM-mode polarized light, efficient band-blocking properties are achieved over a wide incidence angle range of 0°-70° for wavelengths of 200-600 nm. For a wavelength of 300 nm similar to the particle size, the light propagates only to the shallow layers of the film over a wide range of incidence angles. For a wavelength of 2000 nm, which is well beyond the particle size, TiO2 particles have difficulty in blocking light. This study provides theoretical support for the optimal design of parameters for disordered photonic crystals, especially for the preparation of organic films of TiO2 nanoparticles.ConclusionsThe preparation of disordered photonic crystal organic films is the key to achieving mass production of light-insulation materials. In this paper, hierarchically disordered photonic crystal structured organic films are designed by using thermoplastic polyurethane as the film substrate and titanium dioxide particles as the reflective barrier material filling the substrate. Simulations are carried out by using the FDTD method, and the results show that the increase in fill factor causes a blue shift in the reflection peak and spectral forbidden band, while the increase in particle diameter causes a red shift in the spectral forbidden band. Compared with arrays with a uniform distribution and a single diameter, the effects of hierarchical particle size and structural aggregation on NIR waves are analyzed. For both transverse electric and transverse magnetic waves, efficient forbidden band effects are achieved over a wide incidence angle range of 0°-70°. Such organic films containing disordered photonic crystal structures provide a reference for wide-angle light-insulation materials.
ObjectiveThe molten salt reactor is a type of reactor of the fourth-generation advanced nuclear power systems. Solid fuel molten salt reactor uses fuel elements based on tristructural isotropic (TRISO) particles. In a type of fuel element product, TRISO particles are dispersed in the rod carbide material. Due to process reasons, the distribution of fuel particles in the matrix material is often random and non-uniform. However, distribution uniformity affects the performance of the product. Therefore, accurately measuring the spacing between these fuel particles is of great significance for the quantitative analysis and characterization of distribution uniformity and the further process quality evaluation of fuel element products. At present, many spacing measurement methods are available for different workpieces. Nevertheless, measurement methods for the three-dimensional (3D) space are limited, and the internal structure of workpieces cannot be effectively analyzed. In addition, the measurement of spacing between fuel particles in fuel elements is rarely reported.MethodsThis paper investigates an automatic measurement method for the spacing between adjacent fuel particles in the 3D space. Specifically, X-ray micro-computed tomography (micro-CT) is applied to obtain 3D CT images of fuel element products. Then, the 3D CT images are preprocessed in a manner of enhancement by window width/window level adjustment and guided filtering, and an improved spatial intuitionistic fuzzy C-means clustering algorithm, namely, nonlocal spatial intuitionistic fuzzy C-means (NL-SIFCM), is proposed. To solve the problem of insufficient spatial information utilization caused by the use of the equivalent weight mask for spatial functions in traditional SIFCM algorithms, this paper also brings the non-local idea into cluster membership calculation. The relationship between neighboring pixels in noisy images is fully considered by spatial functions to reduce the number of misclassified pixels and improve the accuracy and speed of image segmentation. On this basis, the 3D region growing algorithm is used to segment the fuel particles in the image and thereby obtain the spatial structure of each fuel particle. Finally, the centroid coordinates of the fuel particles are obtained, and the Euclidean distance between adjacent fuel particles is automatically calculated.Results and DiscussionsTo verify the feasibility of the algorithm, this paper builds a random distribution model of fuel particles (Fig. 5). By simulation experiments, the centroid of each fuel particle in the model is obtained, and the nearest centroid and its distance from the current centroid are calculated (Table 2). Running time is measured as well, and the calculation time of 20 spheres is 0.75788 s, indicating that the solution speed is fast and acceptable in practical engineering applications. To further verify the feasibility and accuracy of the proposed method, this paper selects standard spheres of silicon nitride (Fig. 6) to simulate spatial fuel particles. The 3D images of the standard spheres are preprocessed in a manner of enhancement by window width/window level adjustment and guided filtering (Fig. 8). Then, the NL-SIFCM algorithm and the 3D region growing algorithm are employed for the 3D segmentation of the target spheres. Finally, the centroid coordinates of the target spheres are obtained, and the spacing between adjacent spheres is calculated (Table 3). The maximum measurement error is 7 μm. To verify the effectiveness of the proposed method in measuring spacing of fuel particles in actual fuel elements, this paper implements 3D CT scanning reconstruction of a fuel element sample to obtain the reconstructed 3D CT image and the image of fuel particle distribution (Fig. 9). After the centroid coordinates of the target fuel particles are calculated, the spacing between adjacent spheres is calculated to obtain the measured spatial distance among fuel particles.ConclusionsIn this paper, the fuel particles in a fuel element are tested and analyzed by availing the volume data from X-ray micro-CT, and an automatic algorithm based on improved SIFCM clustering and 3D region growing is proposed to achieve the segmentation of independent fuel particles in 3D CT images. Measurement experiments are carried out on simulated fuel particles, standard spheres, and fuel element samples to verify the feasibility and accuracy of the proposed algorithm. The calculation of the centroids, the search for the nearest centroids, and the calculation of the spacing between adjacent spheres are accomplished. In this way, the paper verifies the applicability of the proposed method and lays a foundation for characterizing the distribution uniformity of fuel particles in non-metallic matrix materials.