


Please enter the answer below before you can view the full text.
8+4=
ObjectiveThe characteristics and laws of atmospheric turbulence in the atmospheric boundary layer over the ocean region are studied, which can be employed to guide the parameter setting of the adaptive optical system. Therefore, the influence of turbulence is greatly reduced, and the imaging quality and the performance of the photoelectric system are improved to meet the engineering application. In this method, the effects of temperature, humidity, and wind velocity on the calculation results are fully considered, and the physical phenomena that produce optical turbulence effects are fully captured. Additionally, the ultrasonic anemometer array has the advantages of high spatial and temporal resolution and high automation degree, which greatly improves data continuity and reliability. Finally, continuous all-weather measurement can be carried out for a long time, and the limitation of high labor costs and sensitivity to weather conditions is effectively compensated.MethodsBased on the multi-layer ultrasonic measurement experiment in the tropical South China Sea, the ultrasonic wind velocity in three directions in the air is measured, and the velocity structure constant is obtained. In addition, the refractive index structure constant is calculated by combining the refractive index gradient affected by temperature and humidity. Firstly, according to the fluctuation relations of atmospheric refractive index with temperature, humidity, and pressure, the relationships of refractive index structure constant with potential temperature structure constant, humidity structure constant, and temperature-humidity correlation structure constant are obtained. At the same time, the velocity structure constant obtained from Tatarskii theory and the relationship between the energy dissipation rate and the velocity structure constant are discussed. Secondly, based on the relationship between atmospheric refractive index and density, the major large-scale refractive index gradients are removed to ensure consistency and maintain the basic properties of the gradient origin, i.e., turbulent mixing. The expression of the turbulent refractive index gradient is obtained through the high frequency (small scale) fluctuation in the refractive index gradient which determines the refractive index structure constant.Results and Discussions1) This paper verifies the feasibility and reliability of the method by analyzing and comparing the 144-day raw data (Fig. 3). The correlation analysis between the ultrasonic anemometer array calculation method and the ultrasonic single point virtual temperature estimation method is shown in Fig. 6. The Spearman correlation coefficient (R) reaches 0.96113; a fitting slope of 0.95096 is obtained through the least squares linear fitting, and the intercept is 0.48645. The results of the ultrasonic single point virtual temperature estimation method and the ultrasonic anemometer array calculation method are shown in the horizontal and vertical coordinates respectively. The results indicate that both methods can reflect the daily variation of turbulence in the real atmosphere. The result of the ultrasonic anemometer array estimation method at some time is larger than that of the ultrasonic single point virtual temperature estimation method, and the consistency of the two methods also fluctuates slightly. However, the trend is the same with high correlation, which proves the feasibility of the method to estimate the refractive index structure constant of the ultrasonic anemometer array estimation method. 2) The effects of temperature, humidity, and wind velocity on the calculation results are fully considered, and the physical phenomena that produce the optical turbulence effect are fully captured (Table 3). The correlation coefficients between the estimated temperature and the temperature structure constant are 0.98, 0.8, 0.7, and 0.6, respectively. However, the correlation between the estimated results of the ultrasonic anemometer array and the velocity structure is very low, and the correlation coefficient is close to 0. The correlation coefficients with relative humidity, virtual temperature, temperature gradient, and wind shear are 0.8, 0.8, 0.5, and 0.4, respectively. In conclusion, the all-day virtual temperature exerts a major influence on the calculation results, in which the humidity affects the results by affecting the ultrasonic virtual temperature. In addition, the influence of the dynamic factors on the calculation results cannot be ignored, and it further shows the comprehensiveness and superiority of the estimation method of the ultrasonic anemometer. Notably, the dependence of the refractive index structure constant on temperature-related parameters such as ultrasonic virtual temperature, temperature gradient, and relative humidity is lower at night than during the day and is negatively correlated at night. The correlation with the average wind velocity and wind shear of the dynamic factor parameters increases significantly.Conclusions1) The correlation analysis shows that the average correlation coefficient is 0.85 with the highest value of 0.99 and the lowest value of 0.71, which is compared with the 174-day results of the ultrasonic anemometer array. By error analysis, the average ΔlgCn2 is 0.3. 2) Through the analysis of the influence factors of the two estimation methods at night, the correlation between the refractive index structure constant and the temperature-related parameters decreases by 68% on average, and the correlation between the refractive index structure constant and the wind speed-related parameters increases by 59% on average.
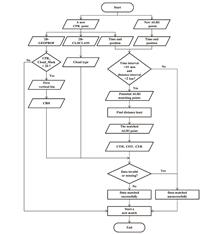
ObjectiveCloud base height (CBH) is a crucial cloud parameter affecting the water cycle and radiation budget of the earth-atmosphere system. Additionally, CBH has a great impact on aviation safety. Low CBH often leads to a decrease in visibility, which poses a great threat to flight safety. Therefore, it is meaningful to acquire accurate CBH for related scientific research and meteorological services. It is valuable but challenging to use satellite passive remote sensing data to retrieve CBH. Some cloud products such as cloud top height (CTH) and cloud optical thickness (COT) are often used in previous research, related to CBH retrieval, from which two ideas to retrieve CBH can be summarized. The first idea employed independent methods to obtain CBH of different types of clouds respectively, and the second one directly retrieves CBH using cloud products of satellites without regarding cloud types. At present, there is no CBH products of FY-4A. Therefore, a CBH retrieval method for FY-4A is introduced in this paper. According to the two ideas mentioned above, two schemes of CBH retrieval are designed, which are compared to find more suitable ideas to retrieve CBH for FY-4A and to provide reference for subsequent development of FY-4A CBH products.MethodsA CBH retrieval method based on ensemble learning is proposed in this paper. CTH, COT, and cloud effective radius (CER) from FY-4A are used. Additionally, CBH and cloud types from CloudSat are employed for their widely recognized data quality. First, data of FY-4A and CloudSat are matched spatiotemporally and are divided into training data, validation data, and test data. Second, CBH retrieval models are built based on two ensemble learning algorithms, random forest (RF), and gradient boosting tree (GBT). Two schemes of CBH retrieval are designed in this paper. In the first scheme, matched data are divided into eight types according to the eight cloud types of CloudSat. For each type of cloud, two retrieval models are built based on RF and GBT using training data and validation data through ten-fold cross validation. The optimal model is selected according to the models' results on test data. In the second scheme, retrieval models are built without regarding cloud types. Training data of the eight cloud types are combined together. Validation data and test data are processed similarly. The three data sets are used to obtain the RF model and GBT model, and to select the optimal retrieval model. Finally, the optimal scheme and model of CBH retrieval for FY-4A are selected according to the models' performance.Results and DiscussionsRoot mean squared error (RMSE), mean absolute error (MAE), correlation coefficient (R), and mean relative error (MRE) are used to evaluate models' performance. In the first scheme, the GBT model is the optimal retrieval model for Cirrus (Ci), Altostratus (As), and Altostratus (Ac). RF model is the optimal retrieval model for Stratus/Stratocumulus (St/Sc), Cumulus (Cu), Nimbostratus (Ns), deep convective cloud (Dc), and multilayer cloud (Multi). In the second scheme, the GBT model is the optimal retrieval model. The models of the two schemes are compared on test data with 129515 samples. Overall, the retrieval model of the first scheme outperforms that of the second scheme. Specifically, RMSE of the model in the first scheme is 1304.7 m. MAE is 898.3 m, R is 0.9214, and MRE is 63.93%. For the eight types of clouds, RMSE, MAE, R, and MRE of the model in the first scheme are also superior to those of the model in the second scheme. Although the first scheme can obtain better results, the retrieval model of the first scheme still needs to be improved in the future. For example, the performance of the retrieval model for Dc is not a patch on that of other types of clouds. Additionally, the paper discusses how to apply the proposed method to practice. First, level 1 data (i.e. reflectance and brightness temperature) and level 2 data (i.e. CTH, COT, and CER) of FY-4A can be used to acquire the eight cloud types according to a cloud type classification model proposed by Yu et al. Second, according to the cloud type classification results, the retrieval models of the first scheme can be adopted to retrieve CBH for the eight types of clouds respectively.ConclusionsCBH is a critical cloud parameter, but there are no CBH products of geostationary meteorological satellites currently. Thus, a CBH retrieval method for FY-4A based on ensemble learning is introduced in this paper. Two schemes of CBH retrieval are designed, and corresponding CBH retrieval models are built based on two ensemble learning algorithms, namely, RF and GBT. Data of CTH, COT, and CER from FY-4A are used in this paper. The first scheme employs eight independent models to retrieve CBH for eight types of clouds (i.e. Ci, As, Ac, St/Sc, Cu, Ns, Dc, and Multi) respectively. Specifically, for Ci, As, and Ac, the GBT model is used to retrieve CBH. For the other five types of cloud, the RF model is used to retrieve CBH. The second scheme uses a GBT model to retrieve CBH without regarding cloud types. CBH from CloudSat is used to evaluate the results of the two schemes, and the retrieval model of the first scheme outperforms that of the second scheme. For the eight types of clouds, the retrieval model of the first scheme also obtains better results.
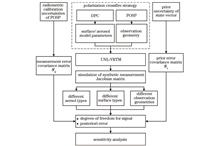
ObjectiveAs one of the spaceborne detection schemes with the strongest comprehensive aerosol capability at this stage, the polarization crossfire (PCF) strategy is developed in China. It is composed of the particulate observing scanning polarimeter (POSP) and the directional polarimetric camera (DPC) and has been carried by China's Gaofen 5-02 and the Chinese Atmospheric Environmental Monitoring Satellite (DQ-1), which are launched in 2021 and 2022, respectively. To explore the detection ability of the POSP based on PCF in the ultraviolet (UV) band for aerosol layer height (ALH), we study the sensitivity of ALH with the synthetic data in the UV and near-UV bands and further assess the impact of different conditions on the information content and posterior error of ALH. It is expected that our findings can be helpful for the retrieval algorithm development of ALH.MethodsOptimal estimation (OE) theory and information content analysis are employed in this study. OE provides statistical indicators such as the averaging kernel matrix and the degree of freedom for signal (DFS), which can represent how much information on the retrieved parameters we can obtain from the satellite measurements. Therefore, combined with the forward modeling of specific satellite sensor observations, information content analysis is used to provide support for satellite sensor design and retrieval algorithm development. The advantage is that the retrieval capability can be quantified without the development of true inversion. Additionally, it provides top-level physics-based guidance on algorithm design. Firstly, the unified linearized vector radiative transfer model (UNL-VRTM) is used as the forward model to calculate the normalized radiance and polarized radiance at the top of the atmosphere (TOA), as well as the Jacobians of TOA results with respect to corresponding parameters. Then, the DFS and posterior error are introduced to quantify the information content of ALH from the aspects of the intensity and polarization measurements, respectively. Under the assumption of different surface types, aerosol models, and different typical observation geometry cases, the sensitivity analysis results for different situations can be finally obtained.Results and DiscussionsWe analyze the sensitivity variation of ALH with the scattering angle at the solar zenith angle of 40°. The results show that a smaller scattering angle (within 90° to 140°) of the satellite observation geometry is accompanied by higher sensitivity of Stokes parameter I to scale height H (Fig. 10). After that, we choose a fixed observation geometry to calculate the DFS under different schemes. The research shows that the DFS of the bare soil is lower than that of the vegetation surface in the band of 380 nm (Table 6). Generally, the surface reflectance has more impact on the information content of H in terms of POSP measurements than aerosol optical properties, which leads to the lowest information content over bare soil. Meanwhile, with the addition of multi-band measurements and constraints of polarization information, the DFS of ALH is significantly improved (Fig. 11). Different cases indicate that the addition of intensity and polarization measurements for the retrieval of ALH at 380 nm and 410 nm can improve the H information effectively, and the posterior error of the ALH retrieval is also reduced by 5-30 percentage points (Fig. 13). It is shown that the polarization measurement in the UV band has a good constraining effect on the posterior error of H. In addition, with the addition of intensity and polarization information in the near-UV band of 410 nm, the posterior error is further reduced by 7-10 percentage points, and the measurements particularly improve the retrieval of ALH when the H value is low (Fig. 14).ConclusionsThe UV and near-UV bands are important sources of information content for ALH in satellite remote sensing. Compared with the case only using intensity observations at 380 nm, the addition of polarization detection in the same band can provide an extra DFS of 0.06-0.26 for the retrieval of ALH. Meanwhile, the posterior error is reduced by 5-30 percentage points. Combined with near-UV detection information at 410 nm, the posterior error for the retrieval of ALH is further reduced by 7-10 percentage points. In particular, the retrieval of ALH at low scale height is improved. In addition, the sensitivity of observation information to ALH decreases gradually with the increase in the corresponding scattering angle ranging from 90° to 140°. Moreover, the bare soil case with aerosols dominated by the coarse mode provides less content information on ALH than the vegetation surface case with aerosols dominated by the fine mode. Although ALH information between the two types of aerosols shows some distinctions because of their different single-scattering optical properties, the dependence of information on surface types and the impact of polarization measurements generally appear similar. The information content analysis shows that the potential capability of the POSP instrument is good over various surface types and aerosol models on the basis of the use of spaceborne PCF strategy.
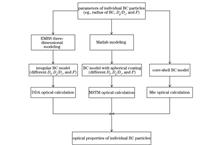
ObjectiveBlack carbon (BC) aerosols strongly absorb solar radiation in the atmosphere and directly or indirectly influence regional and global climate. However, the shape and mixing structures of BC particles are complex, and their optical properties are largely unquantified. Previous studies have used several numerical simulation tools to analyze the optical properties of BC particles, while the mixing structures of BC models in these studies are still quite different from those of the real individual BC particles in the atmosphere. In addition, most studies use only one numerical simulation tool to calculate the optical properties of BC particles. Therefore, the differences in optical results from different numerical simulation tools are still uncertain. In this study, a novel three-dimensional (3D) modeling tool, namely, Electron-Microscope-to-BC-simulation (EMBS), is applied to construct realistic 3D BC models. The EMBS can construct optical models of particles with arbitrary shapes and structures and can be applied in discrete dipole approximation (DDA). Then the influence of complex shapes and mixing structures of atmospheric BC particles on optical characteristics can be estimated. The absorption intensity Eabs, single scattering albedo (SSA), and absorption cross section Cabs of individual BC particles with different fractal dimensions (Df =1.8 and Df =2.6) and mixing structures are calculated by three numerical simulation methods, including DDA, multi-sphere T-matrix (MSTM), and Mie theory. The numerical simulation results obtained by different methods are compared, and the reasons for the difference in the results of different numerical simulation tools are analyzed.MethodsIn this study, the EMBS is used to construct BC particle models with different fractal dimensions (Df =1.8 and Df =2.6) and mixing structures. The BC models from the EMBS are applied by the DDA. The Eabs, SSA, and Cabs of BC particles constructed by the EMBS are calculated by the DDA method and then compared with the results from MSTM and Mie methods (Fig. 1). The parameters of individual BC particles (e.g., the radius of BC, Dp/Dc, F, etc.) are identical for the three methods. Each BC aggregate consists of 100 monomers with a radius of 20 nm. The coating thickness Dp/Dc and embedded fraction F are in the range of 1.5-2.7 and 0.10-1.00, respectively. The wavelength of incident light λ is 550 nm. The complex refractive index of BC is m=1.85+0.71i, and that of the BC coating is m=1.53+0i. This study assumes that particles are randomly oriented in the atmosphere, and 1000 incident light directions are used for each particle. The Mie method corresponds to the core-shell BC model and is conducted by the BHCOAT program.Results and DiscussionsFor BC particles with loose structures (Df =1.8) and compact structures (Df =2.6), the Eabs of MSTM model is more sensitive to embedded fraction, while that of DDA model is more sensitive to the coating thickness (Fig. 4). The SSA of DDA and MSTM methods increases with the increase in the coating thickness, and that of DDA method is smaller than that of MSTM method (Fig. 5). In addition, the SSA of DDA and MSTM methods decreases with the increase in F, but the sensitivity of both models to F is not high (Fig. 5). The optical properties calculated by DDA and MSTM methods are still different when the parameters (such as Dp/Dc, F, and fractal dimension) are consistent. The results of this study prove that there are indeed obvious differences between DDA and MSTM in the simulation of optical properties of individual BC particles. The model shape and mixing structures of BC models for DDA method are more flexible, while MSTM has limitations in constructing models. On the one hand, there is the influence of the shape of BC models. For the bare BC model without coating, the relative deviation caused by different shapes of BC aggregates is large. The relative deviations of Cabs and Qabs are 13% and 9%, respectively (Fig. 6). For the fully embedded BC model, the relative deviations of Eabs, SSA, and Cabs reach 20%, 7%, and 23%, respectively (Fig. 7). On the other hand, the relative position of BC aggregate and coating results in a relative deviation of 2%-4% (Fig. 8). The BC models used by the MSTM method are quite different from the real atmospheric BC particles, so the deviation generated by the simulation may be larger than that of the DDA.ConclusionsIt is found that the Eabs results of MSTM method are more sensitive to the embedded fraction, while those of DDA method are more sensitive to the coating thickness. The difference between the two methods mainly results from: 1) differences in the shape of BC aggregates and coating in DDA and MSTM methods lead to the relative deviation of Eabs and Cabs up to 20% and 23%, respectively; 2) relative position and shape of the coating can produce relative deviation in 2%-4%. Due to the differences in BC model shapes and structures between DDA and MSTM methods, the optical simulation results may differ greatly.
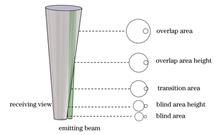
ObjectiveLidar has been widely used in the field of atmospheric detection with the advantages of high spatial-temporal resolution and high detection sensitivity. The overlap factor of a lidar system arises from the incomplete overlap between the laser beam and the field of view of the receiver, which results in the distortion of the received backscattered signal in the near-field range. The accurate observation of aerosol optical parameters near the ground is important for the monitoring of the atmospheric environment, air quality, and atmospheric visibility. The overlap factor at a certain distance is defined as the ratio of the beam energy entering the receiving field of view to the actual backscattering energy. In general, the overlap factor is estimated by either theoretical methods or experimental methods. The theoretical methods are to calculate the overlap factor according to the structural parameters of the lidar system. However, some parameters are often rather difficult to accurately obtain in practice or theory, such as the performance of the optical elements, the beam divergence angle, and the beam direction. The experimental methods are to calculate the overlap factor with the experimental observation data. Some use the deviation between the Raman solution and the Fernald solution of a backscattering coefficient to calculate the overlap factor. The main limitation is that the Fernald method of aerosol backscattering coefficient requires the assumption of lidar ratio or boundary conditions, which will introduce great errors. Besides, the experimental methods strongly depend on the accurate estimation of atmospheric conditions. Thus, it is necessary to propose a stable algorithm for overlap factors to correct signals and aerosol optical parameters in the near-field range.MethodsAn experimental method for the overlap factor of Raman-Mie scattering lidar is proposed in this paper, which is applicable to lidar systems equipped with a Raman scattering channel. The method is based on the Raman inversion method for aerosol optical parameters. By analyzing the inversion characteristics of aerosol optical parameters, it is found that in a transition area, the aerosol backscattering coefficient is not influenced by the overlap factor, while the aerosol extinction coefficient is influenced greatly. In the Raman inversion method, the aerosol extinction coefficient and backscattering coefficient are independently inversed without the assumption of lidar ratios. Thus, the lidar ratio profile can be obtained in a complete overlap area. According to the inversed optical parameters, the overlap area height is determined preliminarily, and then the lidar ratio in the transition area is assumed to be equal to that at the overlap area height. The product of the aerosol backscattering coefficient and the lidar ratio is used to preliminarily correct the missing signal of the aerosol extinction coefficient in the transition area. The Raman scattering signal is derived from the inverse equation of the aerosol extinction coefficient, and then the preliminarily corrected Raman scattering signal is forward modeled. The overlap factor is obtained by dividing the experimental observed Raman signal by the forward modeled Raman signal. The blind area, transition area, and overlap area are distinguished according to the overlap factor profile. The Raman scattering and Mie scattering echo signals and the aerosol optical parameters in the near-field range are corrected, respectively. For the transition area, the definition of the overlap factor is used for signal correction. For the blind area, the slope consistency method is used to supplement the signal, that is, the slope of the standard atmospheric model is used to linearly estimate the signal.Results and DiscussionsThe atmospheric observation experiment is carried out with an independently developed Raman-Mie scattering lidar system. For a single set of experimental observation data, the aerosol extinction coefficient and backscattering coefficient are retrieved, respectively. The overlap factor profile is obtained, and then the echo signals and aerosol optical parameters are corrected, respectively. The estimated extinction coefficient on the ground by lidar is compared with that observed via a visibility meter to verify the correctness of the algorithm. For the observation data from an experiment lasting for 4 hours, the time-height-intensity (THI) diagrams of the aerosol extinction coefficient before and after the correction by an overlap factor are given (Fig. 5). The corrected aerosol extinction coefficient below about 0.6 km can be obtained, which can obviously reflect the stratification structure and spatial-temporal variations of atmospheric aerosols near the ground. The estimated aerosol extinction coefficients of long-term observations on the ground are compared with those simultaneously observed via a visibility meter, and they show good consistency with a regression coefficient R up to 0.993 (Fig. 7). The measured overlap factors are compared with those calculated with the theoretical method, and the relative biases are analyzed separately. The error of overlap factors can be controlled within ±8%.ConclusionsThe error of the proposed method is calculated and analyzed. The results show that the proposed method can accurately calculate the overlap factor profile of the Raman lidar system. After correction by an overlap factor, the signal profile in the transition area and the estimated linear signal in the blind area can be obtained. The improved method is of great significance for the correction and supplement of near-field signals with lidar.
Results and Discussions To validate the retrieved SO2 VCD results, we compare the SO2 VCD from EMI-Ⅱ with that from TROPOMI at the La Palma volcano on 27, 29, and 31 October 2021. The SO2 VCD from EMI-Ⅱ showes similar spatial distributions to those of the SO2 VCD from TROPOMI (Fig. 4) with R of 0.891, 0.901, and 0.915 (Fig. 5), respectively. In addition, the SO2 VCD from EMI-Ⅱ is also compared with that from TROPOMI in the region of the Tonga submarine volcano from 14 to 18 January 2022 (Fig. 6), and the SO2 VCD from EMI-Ⅱ is found to have similar spatial distributions to those of the SO2 VCD from TROPOMI. The SO2 plume transported from Tonga to Australia, which corresponds to the wind field results from a hybrid single-particle Lagrangian integrated trajectory (HYSPLIT) model (Fig. 7). However, the SO2 VCD from EMI-Ⅱ is lower than that from TROPOMI in the grid with a high SO2 SCD, which is mainly because the a priori profile of TROPOMI is different from that of EMI-Ⅱ in the radiative transfer model. According to the calculated SO2 VCD and wind field data, the fluxes of SO2 on 14 and 15 January 2022 in the region of Tonga submarine volcano are 345.83 and 504.85 t/s, respectively.ObjectiveThe SO2 slant column density (SCD) of environmental trace gases monitoring instrument Ⅱ (EMI-Ⅱ) from China is firstly retrieved using differential optical absorption spectroscopy (DOAS). The air mass factor (AMF) look-up table of SO2 is established using the SCIATRAN radiative transfer model. The vertical column density (VCD) is obtained after destriping. With the La Palma volcano at the end of October 2021 as an example, the SO2 VCD obtained by retrieval from EMI-Ⅱ data is consistent with that from TROPOspheric monitoring instrument (TROPOMI) with the correlation coefficients (R) of 0.89, 0.90, and 0.92. In addition, the retrieved SO2 VCD in the region of Tonga submarine volcano is also compared with that from TROPOMI. The EMI?Ⅱ results show similar spatial distributions to those of the TROPOMI results, and the transmission process (from the east to the west) of the SO2 plume is monitored. With the wind field data, this paper calculates the fluxes of SO2 generated from the eruption of the Tonga submarine volcano on 14 and 15 January 2022. The results of the paper show that EMI-Ⅱ can yield reliable SO2 VCD in volcanic regions via retrieval and realize the early warning of global volcanic eruptions.SO2 not only affects human health (e.g., respiratory diseases) but also is closely related to climate and environment (e.g., acid rain). Its oxidation may lead to the formation of aerosols and photochemical smog. SO2 is an important indicator of air quality and is closely associated with volcanic eruptions. The SO2 VCD can provide a data basis for tracing the SO2 pollution caused by industrial emissions and early warning signals for volcanic eruptions around the world. Therefore, it is extremely important to obtain the daily global SO2 VCD. In this study, we report the SO2 VCD results in volcanic regions from EMI-Ⅱ and validate the retrieved results with those from TROPOMI. In addition, the fluxes of SO2 from the eruption of the Tonga submarine volcano are calculated, which may help make clear the dynamics of magma degassing. We hope that our results can contribute to the development and global validation of the EMI-Ⅱ SO2 VCD.MethodsThe SO2 SCD is calculated using the QDOAS software with DOAS method. DOAS retrieves the concentrations of trace gases depending on their characteristic absorption and the measured optical intensity, which is based on the Lambert-Beer's law. Then, the corresponding SO2 AMF of the EMI-Ⅱ is calculated using the established AMF look-up table, which is simulated in the SCIATRAN radiative transfer model. The SO2 VCD is then obtained from SCD and AMF. We use spatial filtering following the Fourier transform method to remove obvious stripes caused by the irradiance calibration error when retrieving the SO2 VCD from EMI?Ⅱ. The fluxes of SO2 from satellite-based measurements can be calculated using the above method. For the Tonga submarine volcano, the effect of distance can be ignored for the long lifetime of the stratospheric SO2 plume.ConclusionsIn this paper, the SO2 VCD is retrieved from EMI-Ⅱ and validated in volcanic regions. With the La Palma volcano and the Tonga submarine volcano as examples, the SO2 VCD from EMI-Ⅱ presents similar spatial distributions to those of the SO2 VCD from TROPOMI. In addition, the transmission process of SO2 plume in a volcanic region can be monitored using the retrieved SO2 VCD from EMI-Ⅱ. The results of this study confirm that EMI-Ⅱ can monitor SO2 in volcanic regions and realize the early warning of global volcanic eruptions. This paper is of great importance for the development and global validation of SO2 VCD from EMI-Ⅱ.
Results and Discussions Shipboard sun-photometer has been successfully developed to meet the performance indexes, and long-term observation has been carried out in Bohai bay. The experimental results show that the daily average aerosol optical thickness in Bohai bay is mostly concentrated in the range of 0.1-0.3. Although human-made pollution is increasing in recent years, the frequency distribution of the daily average ?ngstr?m index in Bohai bay is basically Gaussian, which indicates that the sea area has not caused large pollution with the relatively clean atmosphere (Fig. 7). The aerosol in Bohai bay shows a bimodal spectrum structure, and there are significant differences between August, September, and November. In August and September, the atmosphere is dominated by small particles, while in late autumn, November, is dominated by large particles. The average ?ngstr?m index of the two periods is about 1.1 and 0.5 (Fig. 6).ObjectiveAerosols play an important role in the balance of the earth's atmospheric radiation budget due to their complex composition and increasing particle concentration. Sun-photometer is an effective measurement device for remote sensing atmospheric parameters by measuring solar spectral radiation and is widely employed in ground-based remote sensing of aerosols. However, the sea covers a large area. In the research on the optical characteristics of aerosols on earth and climate change, there is an urgent need for a device that can measure the optical characteristics of aerosols with high accuracy under the shipboard platform to compensate for the lack of atmospheric data at sea.MethodsThe traditional sun-photometer is difficult to track the sun on a moving shipboard platform, which cannot meet the needs of sea aerosol observation. The research group develops a novel shipboard sun-photometer with a new tracking method. The sun can be tracked on a shipboard platform with an accuracy of better than 1'. This new sun-photometer could obtain radiation information in nine spectral bands of 400, 440, 532, 550, 780, 870, 940, 1050, and 1064 nm at once. The aerosol information of the sea area can be obtained by direct solar radiation remote sensing on the mobile platform.The instrument adopts a two-segment image tracking method instead of the traditional four-quadrant tracking method. Firstly, the fish-eye imaging system is employed to obtain the whole sky image, and the coarse tracking of the sun is completed. Then, the precision tracking imaging system is leveraged to improve the resolution of the solar image to improve the tracking accuracy. The development process of the shipboard sun-photometer is introduced in detail, including the instrument's two-dimensional turntable, image tracking system, and measurement optical path. The function and working flow of each main structure of the instrument are described in detail with the two-dimensional turntable of the shipboard sun-photometer as the starting point. After that, the theoretical tracking accuracy of the image tracking system is calculated in detail by image processing technology and can reach 0.744' to meet the tracking accuracy requirements of offshore measurement. Finally, a spectrometric measurement system is introduced based on the integrated design of spectrometric measurement systems. The structure and operation flow of the spectrometric measurement system are analyzed specifically, and the influence of stray light and detector saturation on the measurement results is thoroughly considered with corresponding improvement approaches.ConclusionsThe Langley calibration method and the improved Langley method are adopted to calibrate the bands without atmospheric molecular absorption and water vapor absorption, respectively. The 550 nm aerosol optical thickness and ?ngstr?m index measured by the shipboard platform sun-photometer are compared with the measurement results of the POM-01 MK III marine sun-photometer. The diurnal variation trend of the 550 nm aerosol optical thickness is basically similar, the determination coefficient is 0.968, and the average relative measurement error is 4.83%. The ?ngstr?m index has an average relative measurement error of 2.55%. The reliability and stability of the shipboard sun-photometer are verified, and the optical properties of other atmospheric parameters can be further retrieved via the radiation information of visible and near-infrared bands. This instrument enriches the technical means for measuring the parameters of aerosol optical characteristics at sea and lays a solid experimental technical foundation for the research on space remote sensing, climate change, and atmospheric environment.
ObjectiveMarine aerosol is a significant part of atmospheric aerosols, which has an important impact on the changes in marine meteorology, such as visibility and precipitation. Marine aerosols also play a vital role in Earth's energy budget, atmospheric environment, and climate change as they can directly scatter and absorb solar and Earth's radiance and indirectly modify cloud properties. In studies of the size distribution of marine aerosols, micron aerosols are the object of analysis in most cases. There are few studies based on the aerosol mode, and the research on submicron particles with a particle size of less than 1000 nm is scarcely reported. However, submicron particles in the atmosphere perform a crucial role in aerosol formation processes such as gas-to-particle conversion and the formation of cloud condensation nuclei. It is of great significance to study the temporal and spatial variation characteristics of the number concentration, particle size, and component distribution of submicron aerosols. This can help grasp the evolution of particle size distribution in the air mass from land to sea and improve the understanding of the formation and evolution process of marine aerosols.MethodsA navigation observation lasting 12 days is conducted in the northern South China Sea by a Chinese research vessel "Shenkuo" from June 8 to June 20, 2019. The particle number concentrations of submicron aerosols with a diameter of 14-680 nm are measured by scanning mobility particle sizer (SMPS) placed on the right frontal side of the ship. The conventional meteorological data (temperature, humidity, and atmospheric pressure) on the sea surface mainly comes from the automatic meteorologic station onboard the ship. In addition to the data collected on site, the atmospheric reanalysis dataset (MERRA-2) provides data on the sea surface, such as wind speed, wind direction, and aerosol composition. In this paper, the HYSPLIT model is used to simulate the trajectory of the continental air mass during a cold front. After correcting the discrete data and eliminating the polluted data caused by ship discharge, we analyze the temporal and spatial change in the number concentration and size distribution. The size distribution spectra are fitted on the basis of the nucleation mode, Aitken mode, and accumulation mode with the log-normal function. The influence of a cold front encountered during the voyage on the number concentration, particle size, and component distribution is discussed.Results and DiscussionsThe meteorologic process of a cold front is found through the combination of the data from the shipboard automatic meteorologic station and the meteorological reanalysis dataset. When a cold front is encountered, the wind speed, specific humidity, and temperature all decrease significantly, and the wind direction changes from southwest to northeast (Fig. 5). Therefore, the aerosols before and after the cold front are divided into marine aerosols and continental aerosols polluted by the Taiwan Island. The differences in aerosol number concentration, particle size, and component distribution before and after the cold front are compared. It can be seen from the aerosol particle size distribution (Fig. 8) that the number concentrations of the contaminated continental aerosols (? and ? in Fig. 8) are higher than the marine background level, that is, the level of marine aerosols (? and ? in Fig. 8) before the cold front. On June 15 and June 16, the peak number concentration of aerosols appears in the nucleation mode, which means that there are more new particles in the aerosols at this time, and they are in a polluted state. It can be seen from the changes in aerosol components (Fig. 7) that except for the decrease in the proportion of sea salt (SS), the proportions of other components increase on June 15 and June 16, especially the sulfate component (SO4). The increase in the total number concentration and nucleation-mode number concentration of continent aerosols and the increase in the proportions of SO4 and other components may be due to the air mass, impacted by the Taiwan Island, carrying sulfate, organic carbon, and other components into the observation sea area.ConclusionsFirstly, with the increase in offshore distance, the total number concentration of marine aerosols gradually decreases from the coastal level (6812 cm-3) to the background level (1745 cm-3). Compared with the situation of the offshore sea, the air in the far sea is cleaner, and the proportion of the nucleation-mode number concentration gradually decreases (2.35%), the proportion of the Aitken mode remains stable (52.70%), and the proportion of the accumulation mode increases (44.95%). Secondly, the fitted spectra show that 62.15% of the median size distributions are single-peak, and 36.27% are double-peak, which agrees with the log-normal distribution. The median size distributions show the double-peak mode along the coast with a peak value of about 200 cm-3, but display the single-peak mode with a total number concentration between 60 cm-3 and 100 cm-3 on the open sea. As the offshore distance grows, the average geometric particle size of the main modes of particle size spectra increases, and the peak number concentration decreases. Finally, the aerosol samples obtained before the cold front are only affected by the ocean, and the number concentration of marine aerosols is lower. The SS component is the main component (94.33%), and the particle size distribution presents a single-peak characteristic, with the peak appearing in the accumulation mode, which reflects the characteristics of the background marine aerosol. After the cold front transits, the aerosol is affected by the polluted air mass from the Taiwan Island. The SO4 proportion in continental aerosols is significantly increased (44.73%), and the particle size distribution presents a double-peak characteristic in the nucleation and accumulation modes.
ObjectiveQuantum communication uses the quantum state as an information source to achieve the effective transmission of the information of quantum state carries. It has the advantages of high security, high transmission speed, and large communication capacity and is thus a hotspot in the current communication field. However, when an equivalent optical signal is transmitted underwater, it is inevitably affected by environmental factors, resulting in the degradation of transmission performance. Sea ice is one of the important factors that affect the transmission of optical quantum signals underwater. It is composed of freshwater ice crystals, brine bubbles, and bubbles containing salt. When an optical quantum signal is transmitted underwater, the bubbles, brine bubbles, and other microbial particles in sea ice absorb and scatter the optical signal, seriously interfering with the transmission of the signal and resulting in reduced communication performance. The propagation, reflection, and absorption of optical quantum signals in sea ice are affected by the particles and sol organics condensed in the sea ice. However, the influence of sea ice on the performance of underwater quantum communication channels has rarely been reported. Therefore, it is of great significance to analyze the extinction characteristics of sea ice as a whole according to the absorption and scattering characteristics of each component of sea ice and study the influence of sea ice with different density and salinity on link attenuation, channel utilization, and the bit error rate and bit rate of a quantum key distribution system.MethodsSea ice is composed of bubbles, brine bubbles, and other particles. To study the influence of sea ice on the performance of underwater quantum communication channels, this paper analyzes the absorption and scattering characteristics of each component of sea ice. Subsequently, on the basis of the absorption and scattering characteristics of sea ice with different density and salinity, it explores and simulates the relationships of sea ice parameters with the extinction coefficient. Then, according to the extinction characteristics of sea ice with different density and salinity, a constant incident wavelength is adopted, and the relationships of sea ice parameters with link attenuation and channel utilization are determined and simulated experimentally. Finally, the paper examines the effects of sea ice with different density and salinity on the bit error rate and bit rate of a quantum key distribution system and implements data simulation. The theoretical analysis and simulation results can provide a reference for the design of underwater quantum communication in sea ice environments.Results and DiscussionsUnder the same incident wavelength, the extinction coefficient of sea ice increases with sea ice density and sea ice salinity, and it is more markedly affected by the change in sea ice salinity (Fig. 2). When the transmission distance is short and sea ice salinity is small, the link attenuation caused by sea ice is also small. As the transmission distance of the optical quantum signal and sea ice salinity increase, link attenuation increases rapidly (Fig. 4). As sea ice density rises, the extinction effect on the quantum state of the light becomes more obvious, which leads to a decrease in channel utilization (Fig. 5). Since the scattering of light by sea ice changes the polarization of photons constituting the qubit and causes bit errors, the bit error rate of the underwater quantum system increases with sea ice salinity (Fig. 8). The bit rate of the key distribution system is affected by sea ice salinity and transmission distance. When sea ice salinity is small and transmission distance is short, the system bit rate changes slowly. When sea ice salinity is large and transmission distance is long, the attenuation of the optical quantum signal is serious, and the value of the bit rate decreases rapidly (Fig. 10).ConclusionsAccording to the extinction characteristics of sea ice, this paper determines the relationships of sea ice density and sea ice salinity with link attenuation, channel utilization, and the bit error rate and bit rate of the quantum key distribution system. Furthermore, it comparatively analyzes the influence of sea ice on the performance of underwater quantum communication under different parameters. The simulation results show that the link attenuation and the bit rate of the underwater quantum key distribution system tend to decrease as transmission distance and sea ice salinity or sea ice density increase. Moreover, the utilization rate of the quantum communication channel and the system bit rate decrease to varying degrees. In comparison, the change in sea ice salinity interferes more strongly with communication quality and influences the channel parameters more saliently. Therefore, the effects of sea ice density and sea ice salinity on the quantum state of light, especially the effects of sea ice salinity, must be fully considered when underwater quantum communication is conducted.
Results and Discussions The linear polarization of different oil spills is different, but the general law remains the same. When the incident zenith angle is unchanged and the relative azimuth is 180°, the linear polarization tends to increase first and then decrease with the increase in the observed zenith angle (Fig. 6). When the incident zenith angle is constant, the degree of linear polarization also tends to increase first and then decrease with the increase in the observed zenith angle (Fig. 10). The degree of linear polarization rises before it declines as the relative azimuth grows, and it reaches the maximum at the relative azimuth of 180°. The linear polarization degree is high in the relative azimuth angle range of 120°–240° and low otherwise (Fig. 7). In addition, the improved pBRDF model of oil spills has high confidence accuracy, which is more than 80% (Tables 2-5).The relationships between the linear polarization and the incident zenith angle, observation zenith angle, relative azimuth, and wavelength are studied. The results indicate that the incident zenith angle, observation zenith angle, relative azimuth, and wavelength have an impact on the linear polarization of oil spills. The linear polarization increases slightly with the increase of wavelength in the visible light range, but the linear polarization of the observation zenith angle and relative azimuth barely changes relative to that of the incident zenith angle. The linear polarization tends to increase first and then decrease as the relative azimuth rises, and the peak appears at the relative azimuth of 180°. At this time, the same trend of linear polarization holds as the observation zenith angle and the incident zenith angle grow, and the contrast is high. When the relative azimuth is 0°, the linear polarization registers the smallest when the incident zenith angle is equal to the observed zenith angle. The construction of the pBRDF model for oil spills on the sea surface and the investigation of the influence of the incident zenith angle, observation zenith angle, relative azimuth, and wavelength on linear polarization are conducive to realizing the accurate detection of oil spills on the sea surface and can provide a reference in this regard. The model and experimental scheme will be further optimized to study the influence of temperature on the linear polarization of oil spills and build a more accurate model.ObjectiveOil spill pollution has caused great harm to the marine environment and human society. Accurate identification of marine oil spills can help formulate oil spill treatment strategies and assess disaster losses. Optical characteristics, essential characteristics of marine targets, can reflect the physical and chemical properties, geometric surface, and other characteristic information of marine targets from the aspects of wavelength (frequency), energy, phase angle, polarization state, scattering or radiation characteristics, etc. In addition to the intensity, spectrum, and multi-angle detection methods, there is also polarization information in the reflected radiation of the detected target. When the light wave interacts with the surface of seawater, oil film, and other media, the polarization characteristics of the reflected light wave will change. Polarization detection has fogged permeability to a certain extent, which can weaken the influence of sea fog, significantly improve the contrast between target and background, and weaken or even eliminate the influence of solar flares. However, research on the polarization detection mechanism and the modeling of marine oil spills is still insufficient, which restricts the understanding of polarization characteristics and affects practical applications. Therefore, it is necessary to study the polarization detection mechanism of marine oil spills and build a theoretical model to improve the marine detection ability.MethodsOn the basis of the Priest and Germer (P-G) theory, this study comprehensively considers specular reflection, diffuse reflection, and volume scattering, optimizes the traditional model for oil spills on the sea surface, and proposes a polarized bidirectional reflection distribution function (pBRDF) model for oil spills on the sea surface that includes the scattering part. Then, it tests the polarization characteristics of five different oil spill targets (i.e., engine oil, crude oil, diesel oil, kerosene, and gasoline) in the rough water surface environment. By the comparison of the experimental data with the simulations, the visible light polarization characteristics of different oil spills are obtained, and the correctness of the model is verified.ConclusionsAccording to the micro panel theory, this paper comprehensively considers specular reflection, diffuse reflection, and volume scattering, optimizes the traditional model for oil spills on the sea surface, and proposes a pBRDF model of oil spills on the sea surface that includes the scattering part. The model can reduce the error caused by the case only considering specular reflection. The comparison with the experimental data shows that the fitted curve is in good agreement with the measured data, and the model built in this paper is accurate.
SignificanceWind field is an important parameter characterizing the dynamic characteristics of the earth's atmospheric system, and it serves as basic data necessary for business work and scientific research in fields such as weather forecasting, space weather, and climatology.The wind field measurement based on satellite remote sensing is not limited by geographical conditions. It can determine the intensity and direction information of the atmospheric wind field at different altitudes by monitoring the motion state of ocean waves, clouds, aerosols, and atmospheric components. It can not only obtain the observation data of ocean, desert, and polar regions, which are difficult to be collected by conventional methods, but also obtain the profile information of the wind field along the height distribution.As one of the main techniques in atmospheric wind field measurement, passive optical remote sensing has the characteristics of high accuracy, large altitude coverage, and small resource occupation. Great progress in the past half century has been made, and various wind measurement technologies have been developed such as atmospheric motion vectors, infrared hyperspectral analysis of water vapor, wind imaging interferometer, and Doppler modulated gas correlation, which can realize wind field measurement in an altitude ranging from 1 km near the surface to 300-400 km and form a reliable verification and capability complementation with active wind field measurement technologies such as lidar and microwave.In order to promote the development of spaceborne passive optical remote sensing for measuring atmospheric wind fields, it is necessary to summarize and discuss the existing research progress and future development trends, so as to provide a reference for the development of future passive optical remote sensing detection technology for atmospheric wind field and the task planning in atmospheric wind field detection.ProgressThis review focuses on two types of spaceborne optical passive techniques for wind field measurement based on atmospheric motion vector monitoring and atmospheric spectral Doppler shift detection. The fundamental theories, basic inversion methods, and the progress of research and application of representative payloads of various passive wind field detection technologies are summarized (Table 4).The atmospheric motion vector detection technology relies on cloud map observation to realize wind field detection. It has the characteristics of high spatial resolution and high detection accuracy and can obtain meter-level and precise wind field data at a sub-kilometer scale. However, limited by its detection technology mechanism, its detection altitude and efficiency are also significantly restricted.Infrared hyperspectral wind field measurement technology is based on infrared images of specific water vapor spectral channels and profile data to track the movement of characteristic image targets at specific altitudes to invert atmospheric wind speed, which is used for troposphere wind measurement, with high vertical resolution and profile data, and it is less affected by the cloud. Compared with those of the cloud-derived motion vector (CMV) technology, its measurement accuracy and horizontal spatial resolution of wind speed and direction need to be improved. However, as infrared hyperspectral loading and wind field inversion algorithms develop, infrared hyperspectral wind field measurement technology will become an important technology for troposphere wind.The wind field interferometer obtains the interferogram of the fine atmospheric spectrum from the limb observation, inverts the Doppler frequency shift of the atmospheric spectrum through the intensity position or phase change in the interferogram, and then realizes the measurement of the atmospheric wind field. The spaceborne application of this technology began in the late 1960s, and three technical systems have been developed, namely, Michelson interferometer, Fabry-Pérot interferometer, and Doppler asymmetric spatial heterodyne interferometer. The detection altitude covers most of the atmosphere including the stratosphere, mesosphere, and thermosphere. It features continuous profile detection capability, vertical resolution with an order of kilometers, and horizontal spatial resolution with an order of 100 km, and the highest peak accuracy of wind speed measurement has reached 3 m/s.The Doppler modulated gas correlation technology modulates and filters the incident spectrum through a molecular filter with its composition the same as the target atmospheric composition, so as to realize the frequency shift detection of the atmospheric spectrum and the detection of the wind. Compared with traditional spaceborne wind field measurement technologies, it has the advantages of high horizontal resolution, small size, light weight, and low power consumption and has a good application prospect in the field of small satellite network observation. At present, the technology is still in the stage of technical verification and application testing, and it is expected to further improve the vertical resolution of the limb observation, but the space for improving the effective horizontal resolution is limited.Conclusions and ProspectsThrough the technical research and payload application in the past 20 to 30 years, China's spaceborne passive optical atmospheric wind field detection technology is gradually narrowing the gap with the international leading level. However, in general, the spaceborne atmospheric wind field detection capability based on passive optical remote sensing still has problems such as discontinuous altitude profile coverage, incomplete local coverage of middle and high level wind field data, and limited spatial resolution of high level wind field data. In the future, the accuracy and resolution of profile data products for tropospheric wind field elements should be improved, and the gaps in China's middle and upper level atmospheric wind field observation data in terms of global scale should be filled. In addition, As China's planetary scientific research and deep-space exploration plans develop, the wind field detection for the atmospheres of Mars, Jupiter, and other planets is also an important direction for the development of wind measurement technology based on passive optical remote sensing.
ObjectiveDue to the sub-meter higher spatial resolution of panchromatic satellite images, the imaging process is easily affected by atmospheric scattering and absorption and adjacency effect under low atmospheric visibility, resulting in blurred edges of image objects and reduced image quality, and seriously affects the accuracy of quantitative remote sensing application. Before the application of panchromatic satellite image, atmospheric correction should be carried out to improve image quality. At present, the conventional atmospheric correction software can not correct the panchromatic satellite image, so the digital image processing method is often used to improve the quality of panchromatic satellite image. However, the digital image processing method often brings the problems of noise and excessive enhancement while improving the image quality. Therefore, it is urgent to develop a set of atmospheric correction methods suitable for panchromatic satellite images, eliminate the influence of atmosphere and surrounding environment on the target pixel satellite entry pupil signal, recover the real surface information, and improve image quality in the panchromatic satellite image quantitative remote sensing application.MethodsTaking the panchromatic satellite image of GF-2 as an example, this paper develops a set of atmospheric correction method for panchromatic satellite image by using the atmospheric radiative transfer model and the exponential decay point spread function. This method is simple to calculate, and fully considers the influence of atmospheric parameters (parameters of aerosol, water vapor, ozone, and other absorbing gases), spatial resolution, and adjacency effect between background pixels and target pixels on the entry pupil signal of target pixels, which further improves the image quality on the premise of ensuring the truth of panchromatic satellite image information. As an important evaluation index of an optical satellite imaging system, the modulation transfer function (MTF) can comprehensively and objectively characterize the sharpness of the image edge and the expression degree of spatial details, and its value can directly reflect the quality of imaging. Therefore, in order to comprehensively evaluate the quality of panchromatic satellite images after atmospheric correction, the traditional image quality evaluation indexes (clarity, contrast, edge energy, and detail energy) and MTF are simultaneously adopted in this paper to comprehensively and fully evaluate the atmospheric correction results.Results and DiscussionsThe atmospheric correction method for panchromatic satellite images developed in this paper is used to correct the GF-2 panchromatic satellite images of Baotou calibration site under two atmosphere conditions: clean atmosphere and polluted atmosphere. The results show that whether the atmospheric conditions are polluted or clean, the visual effect of the corrected panchromatic satellite images has been improved, the contours of ground objects become clear, the texture information is more abundant, and the recognition of ground objects has also been significantly improved. For high resolution panchromatic satellite images, the atmospheric correction method ignoring the adjacency effect can only improve the image brightness, but does not improve image clarity much. Especially in the case of air pollution, the edge of ground objects in the corrected image is still relatively fuzzy, which is not conducive to the visual interpretation of the image and the extraction of ground objects contour. This further proves that adjacency effect correction is essential for high resolution panchromatic satellite images. By comparing the quality evaluation parameters of each image before and after correction, it can be seen intuitively that the clarity increases by at least 155%, the contrast increases by at least 115%, the edge energy increases by at least 247%, the detail energy increases by at least 204%, and MTF increases by at least 169%.ConclusionsBased on the 6SV radiative transfer model, the atmospheric correction method developed in this paper combines the atmospheric point spread function based on the exponential decay model, and fully considers the influence of atmospheric parameters (parameters of aerosol, water vapor, ozone and other absorbing gases), spatial resolution, and the spatial distance between background pixels and target pixels on the adjacency effect. It can effectively remove the influence of atmosphere and surrounding environment on the satellite load entry pupil signal in the process of panchromatic satellite image imaging, recover the surface truth information in the imaging area which is covered by atmospheric influence, and fully improve the quality of panchromatic satellite image under low atmospheric visibility. After the evaluation of the corrected panchromatic satellite image quality, it is found that compared with the traditional image quality evaluation index, MTF can better reflect the improvement and promotion of the sub-meter panchromatic satellite image quality by the proximity effect correction, which highlights the indispensability of the adjacency effect correction in the atmospheric correction of the panchromatic satellite image. At the same time, the trend of MTF curve and the level of the value can reflect the spatial acuity of the image and the advantages and advantages of the image quality more comprehensively and objectively. Therefore, MTF index is recommended to be included in the image quality evaluation system when sub-meter satellite images (such as panchromatic satellite images) are evaluated.
ObjectiveVortex beams carry orbital angular momentum and have a phase factor exp( ilθ ), where l is the topological charge number and is direction angle. Theoretically, l can take any integer value, and different orbital angular momentum modes are mutually orthogonal. Therefore, in optical communication, the orbital angular momentum can be used for information transmission and exchange or multiplexed to improve communication capacity. However, vortex beams are affected by turbulence when transmitting in atmospheric turbulence, which results in the distortion of their spiral phase and causes inter-mode crosstalk and reduced communication reliability. Many studies focus on compensating the phase distortion of vortex beams, with adaptive optics systems commonly used. However, such methods require multiple iterations, converge slowly, and easily fall into local minima. In recent years, convolutional neural networks have attracted extensive attention in various fields due to their powerful image processing capabilities. Therefore, in this paper, convolutional neural networks are used to extract atmospheric turbulence information from distorted light intensity distribution and recover its distortion. This deep learning-based compensation method has even more accurate and faster correction capability than adaptive optics systems. In view of this, convolutional neural networks are employed herein for the phase prediction of atmospheric turbulence to achieve the phase compensation of Laguerre-Gaussian (LG) beams and improve modal detection accuracy and communication reliability.MethodsIn this paper, a novel convolutional neural network, i.e., deep phase estimation network, is constructed to achieve the prediction of turbulent phases. With this proposed deep network, a mapping between light intensity and turbulent phase caused by atmospheric turbulence is established. Here two strategies are used for learning and predicting the turbulent phase respectively: one uses a Gaussian beam as the probe beam, and the other makes a direct prediction with an LG beam carrying information without a probe beam. In the target plane, the turbulent phase is predicted by intensity, and the field is corrected by the predicted phase. The inputs of the networks of the two schemes are a Gaussian beam and an LG beam, respectively, and the output is the corresponding predicted phase of atmospheric turbulence. The deep phase estimation network performs feature extraction of the input light intensity profile by under-sampling through the encoder, learns the atmospheric turbulence feature parameters by up-sampling through the decoder to achieve the reconstruction of the equivalent atmospheric turbulence phase screen, and finally outputs the results. By learning and training a large number of samples, the network structure proposed in this paper can achieve good prediction results at a transmission distance of 500 m. In addition, five sets of intensity profiles with different turbulence intensities are set for testing and verifying the network to prove that the network has strong generalization ability. Then, the compensation is achieved by loading the reverse phase of the predicted phase on the distorted beam to exert the correction effect.Results and DiscussionsIn this paper, we construct a deep phase estimation network consisting of 15 convolutional layers, 3 deconvolutional layers, and 3 skip connections (Fig. 6) by using an encoder-decoder architecture, which can achieve phase prediction at long transmission distances. At a transmission distance of 500 m, after the network is trained with the distorted beam at different turbulence intensities, it can predict the turbulence phase screen with a high agreement with the simulation results of tests at five different turbulence intensities (Fig. 7). The prediction results are evaluated by calculating the mean square error between them and the simulation results, and it is found that the network can effectively extract turbulence information and has strong generalization ability (Table 2). The beam phase correction is achieved by loading the predicted phase reverse to the distorted beam, and the intensity profile (Fig. 8) and phase (Fig. 10) are corrected to a large extent. The mode purity of the corrected beam is greatly improved, and the mean square error of the intensity image is significantly reduced (Table 3).ConclusionsThe results show that the deep phase estimation network created in this paper can achieve phase prediction more accurately, and it is trained to automatically learn the mapping relationship between the input sample light intensity distribution and the turbulent phase and output the predicted phase. The phase compensation of the vortex beam is achieved based on the predicted phase. The compensation effects of two schemes using a Gaussian probe beam and not using a probe beam are investigated separately, and both of them are effective in correcting the distorted phase. They can predict the turbulent phase accurately under tests at five different turbulent intensities. After compensation, the mode purity of the beam reaches more than 95%, and the mean square errors of the compensated light intensity image and the source plane are both significantly reduced. Even in the case of Cn2=1×10-13 m-2/3 and transmission distance of 500 m, the mode purity of the two schemes is improved from 20.5% to 95.2% and 96.8%, respectively, after the compensation of the prediction results with the deep phase estimation network, and the mean square error also decreases significantly. In summary, the prediction results of the network model proposed in this paper are reliable, and the compensation performance is good.
ObjectiveThe working environment of aerial cameras is complex. In the process of acquiring aerial remote sensing images, the optical system is defocused due to the influence of external environments such as ground elevation difference, temperature, and air pressure. The obtained aerial remote sensing images are not clear enough. The sharpness detection methods based on image processing complete the sharpness detection through the spectrum analysis of high-frequency information in aerial remote sensing images. Taking advantage of the fast running speed of computers, the sharpness detection of aerial remote sensing images is completed in real time. Therefore, it has become the main method of sharpness detection both in China and abroad. However, the weak characteristic areas such as oceans, grasslands, and deserts, which cover more than half of the earth, have less high-frequency information in aerial remote sensing images. When using conventional image methods for sharpness detection, the error rate is high. According to the characteristics of overlapping areas between the two images, a method of aerial camera image sharpness detection based on a digital elevation model (DEM) is proposed. This method introduces a high-precision DEM, and according to the acquired weak characteristic areas, the two images before and after the aerial remote image sensing feature overlapping areas. The aerial imaging model is modified by minimizing the re-projection error, and the sharpness is detected according to the offset of feature points in the weak characteristic overlapping areas. It makes up for the defect that the sharpness detection methods based on image processing can't detect the sharpness in weak characteristic areas and expands the applicability of the sharpness detection methods based on image processing.MethodsIn this study, an aerial imaging model and feature point matching are used to obtain image sharpness parameters. Firstly, a DEM is used to provide the elevation data of the ground object in the aerial imaging model. The sum of the re-projection error of each pixel in the overlapping areas is regarded as the re-projection error function. By minimizing the re-projection error, relative error coefficients of various influencing factors can be obtained, so as to modify the aerial imaging model. Then, according to the characteristics of the overlapping areas between the two images, the geographical information of sceneries in the overlapping areas is regarded as public knowledge. The modified aerial imaging model is used to realize the feature point matching algorithm. In addition, according to the error between the feature matching points and the scale-invariant feature transformation (SIFT) algorithm matching points, the change in the azimuth elements in the aerial camera is calculated. Finally, the change in the principal distance is used as the sharpness detection result. Through the focal plane driving device of the aerial camera, the focal plane of the aerial camera can be quickly adjusted to an appropriate position, so as to obtain aerial remote sensing images with sufficient sharpness.Results and DiscussionsIn the experiment, aerial remote sensing images of the weak characteristic areas obtained by the aerial camera are transmitted to an image processing computer, and the DEM images with the accuracy of millimeter level processed by the computer in advance are introduced. SIFT algorithm is used to extract the features of the weak characteristic images in the overlapping areas, and the change in principal distance is calculated by the offset of feature points. Finally, the corresponding mechanical structure is adjusted according to the change in the principal distance, and aerial remote sensing images with sufficient sharpness are obtained. In this experiment, we select the second dimension with insufficient sharpness and the previous dimension with enough clear feature points in multiple groups of overlapping areas to verify the sharpness detection effect of the proposed algorithm between images with different sharpness (Fig. 5 and Fig. 6). In areas with abundant ground sceneries, 15 repeated experiments are carried out using different sharpness detection algorithms. The root-mean-square error of the sharpness detection parameters of the algorithm in this paper reaches 15.8 μm (Table 1). After 15 repeated experiments in areas with scarce ground sceneries, the root-mean-square error of the sharpness detection parameters of proposed algorithm can reach 16.3 μm. The classic sharpness detection algorithms such as Robert and proposed algorithm are used for weak characteristic areas, and 15 experiments are repeated. The sharpness detection curves are shown in Fig. 7. The root-mean-square error of sharpness detection parameters in the weak feature areas calculated by proposed algorithm can reach 16.275 μm (Table 2), and it meets the actual engineering accuracy requirements of aerial cameras. It is proved that proposed algorithm has a certain engineering application value.ConclusionsIn order to meet the application requirements of aerial cameras in military reconnaissance and topographic mapping, it is necessary to obtain clear aerial remote sensing images in real time. The key to obtaining a clear image is precise sharpness detection technology. In order to solve the problem of aerial camera imaging sharpness detection in weak characteristic areas, the characteristics of overlapping areas between the two images are analyzed, and a method of image sharpness detection of aerial cameras based on DEM is proposed. Based on DEM data, an aerial imaging model is optimized by minimizing the re-projection error. According to the geographical information of the sceneries in the overlapping areas of the aerial remote sensing images in the front and back formats, the change in the principal distance of the latter format relative to the previous format is calculated, so as to obtain the sharpness detection results. After many experiments, the root-mean-square error of sharpness measurement in areas with few features is 16.275 μm, which is within the range of half focal depth of an aerial camera optical system (19.2 μm). The accuracy meets the actual engineering accuracy requirements of aerial cameras, and the proposed algorithm has a certain engineering application value.
ObjectiveSynthetic aperture radar (SAR) is a kind of sensor to capture microwaves. Its principle is to establish images through the reflection of waveforms, so as to solve the problem that traditional optical remote sensing radars are affected by weather, air impurities, and other environmental factors when collecting images. The most widely used SAR is change detection (CD). CD refers to the dynamic acquisition of image information from a certain target, which includes three steps: image preprocessing, generation of difference maps, and analysis and calculation of difference maps. It is applied to the estimation of natural disasters, management and allocation of resources, and measurement of land topographic characteristics. However, in the process of CD, the inherent speckle noise in SAR images will reduce the performance of CD. Therefore, the image denoising method has become a basic method of preprocessing in CD. How to restore a clean image from a noisy SAR image is an urgent problem to be solved.MethodsTraditional denoising algorithms of SAR images generally use the global denoising idea whose principle is to use the global similar information in images to perform processing and judgment. In the case of the high resolution of images, these algorithms need a series of preprocessing such as smoothing and then complete pixel distinction through the neighborhood processing of each image block. The algorithms usually occupy huge computing resources and have certain spatial and temporal limitations in practical applications. In addition, they cannot efficiently complete the denoising task. In terms of deep learning, some algorithms perform well, but there is still room for improvement in network convergence speed, model redundancy, and accuracy. To solve these problems, this paper proposes a denoising algorithm based on a multi-scale attention cascade convolutional neural network (MALNet). The network mainly uses the idea of multi-scale irregular convolution kernel and attention. Compared with a single convolution kernel, a multi-scale irregular convolution kernel has an excellent image receptive field. In other words, it can collect image information from different scales to extract more detailed image features. Subsequently, the convolution kernels of different scales are concat layers in the network, and an attention mechanism is introduced into a concat feature map to divide the attention of the features so that the whole model has a positive enhancement ability for the main features of the image. In the middle of the network, the dense cascade layer is used to further strengthen the features. Finally, the image restoration and reconstruction are realized by network subtraction.Results and DiscussionsIn this paper, qualitative and quantitative experiments are carried out to evaluate and demonstrate the performance of the proposed MALNet model in denoising. The WNNM, SAR-BM3D, and SAR-CNN algorithms are compared with our proposed method. The clear state and complete signs of the denoised images are visually observed. In order to make a fair comparison, we use the default settings of the three algorithms provided by the authors in the literatures. Peak signal-to-noise ratio (PSNR), structural similarity index measure (SSIM), and image entropy are used as objective evaluation indexes. The PSNR, SSIM, and image entropy are calculated as error metrics.Three denoising algorithms are compared, and airpoirt, mountain, and coast are selected as verification images. The denoising effects of airport images (Fig. 7), coast images (Fig. 8), and mountain images (Fig. 9) are analyzed. It shows the visual effect comparison of denoising results of different algorithms. In Figs. 7-9, 6 figures are successively noise-free image, noise image, denoised image obtained by WNNM, denoised image obtained by SAR-BM3D, denoised image obtained by SAR-CNN and denoised image obtained by MALNet. It is obvious that the WNNM denoised image has many defects that are not removed completely, and the texture loss is quite serious. SAR-BM3D denoised image retains some details, but the aircraft fuselage is very vague, and the tail part has gotten most of the edge information erased. Although the aircraft wing in the SAR-CNN denoised image is recovered, the whole aircraft at the bottom is still far from the reference image, and the recovered small objects are blurred.It can be seen from Table 3 that the average PSNR value of the proposed MALNet is about 9.25 dB higher than that of SAR-BM3D, about 0.75 dB higher than that of SAR-CNN, and about 14.45 dB higher than that of WNNM. Moreover, in terms of the noise level, MALNet is 0.01 dB less than that SAR-CNN. The PSNR value of the proposed MALNet model at each noise level is higher than that of other algorithms. Especially, when the noise parameter is 20, the proposed method is 2.56 dB higher than that of the SAR-CNN algorithm. In terms of structural similarity (Table 4), it can be seen that the SSIM of MALNet is mostly the highest among all methods. Only when the noise parameter is 50, it is slightly lower than that of SAR-CNN, but the average SSIM is still the highest. The average information entropy of the denoised images by the four algorithms is 7.113492 bit/pixel for WNNM, 6.842258 bit/pixel for SAR-BM3D, 7.499375 bit/pixel for SAR-CNN, and 6.6917 bit/pixel for MALNet. The proposed algorithm outperforms WNNM, SAR-BM3D, and SAR-CNN by 0.42179 bit/pixel, 0.15056 bit/pixel, and 0.80768 bit/pixel, respectively. Therefore, in terms of the three objective evaluation indexes of PSNR, SSIM, and image entropy, the proposed network in this paper has better denoising performance than other comparison methods.ConclusionsIn this paper, a new denoising model MALNet is proposed for solving the noise in SAR images. This model uses an end-to-end architecture and does not require separate subnets or manual intervention. The solution includes three modules, i.e., multi-scale irregular convolution module, feature extraction module based on attention mechanism, and feature enhancement module based on dense cascade network. The model also adds batch normalization and global average pooling to improve its adaptability. It can complete convergence without massive data sets. The image data can complete convergence after 150 rounds of training. The training efficiency is outstanding, and the portability is positive. The experimental results show that compared with those of other traditional image denoising algorithms, the PSNR and SSIM of the proposed algorithm are improved by 0.75 dB-14.45 dB and 0.01-0.16, respectively. The proposed algorithm is superior to other algorithms in image entropy and can better recover the details of images.
SignificanceCloud plays a crucial role in the Earth's radiation balance and the water cycle, and its formation and evolution are very closely related to weather change. The results of continuous observation and analysis of cloud parameter data can be used in the fields of solar energy production forecasting and meteorological research for aviation and shipping. Cloud cover is one of the main macroscopic parameters of cloud and one of the important elements of ground-based meteorological observations. Thus, the study of its observation methods and approaches has important application value and wide application prospects.Cloud observation can be divided into air-based observation, space-based observation, and ground-based observation according to the different observation platforms. Among them, ground-based cloud observation has a wide range of fields, low observation cost, and other characteristics, which attracts extensive attention. In the early days, ground-based observation mainly relies on manual observation, which is subjective and has poor continuity. With the continuous development of hardware sensor technology, digital image processing technology, computer technology, and other technologies as well as the increase in the business needs for ground-based cloud observation automation, a series of ground-based cloud observation equipment has been developed.According to the imaging band of the observation equipment, ground-based cloud observation equipment is mainly divided into two categories for visible band (450-650 nm) and infrared band (8-14 μm) observation. The observation equipment for the visible band can be used only in the daytime and is equipped with a solar baffle or a solar tracking device in most cases. As a result, the acquired sky image is partially blocked, which affects the inversion accuracy of cloud parameters. Regarding the observation equipment for the infrared band, the field of view of the sky observed by one imaging is usually small, and acquiring all-sky images needs scanning and stitching. However, scanning takes a long time, and the movement of clouds causes stitching errors. In addition, scanning and stitching increase system complexity. Therefore, it is important to solve the current problems of ground-based cloud observation equipment so that it can meet the needs for operational ground-based cloud observation.ProgressTo realize all-sky cloud cover observation, this paper proposes a dual-band all-sky cloud cover observation system. The visible light imaging unit is based on a fisheye lens and a high-resolution industrial camera and adopts the built-in chopper plate design idea to achieve unobstructed all-sky cloud map acquisition. In addition, through the acquisition of multiple sky images with different exposure values, combined with high dynamic range (HDR) image synthesis technology to synthesize an all-sky image, the impact of overexposure of pixels caused by the sun on imaging can be reduced to a minimum. The infrared imaging unit uses a large array of infrared detectors with a customized infrared wide-angle lens, and a field of view of more than 160°can be observed in a single time. It is faster and easier than the traditional scanning modes which splice images with very limited fields of view and achieves the largest field of view in a single observation among similar equipment. The dual-band all-sky cloud cover observation system works in the way of dual-band observation in the daytime and infrared observation in the nighttime, which thereby realizes all-day cloud observation. To obtain all-sky cloud cover information, the equipment has different built-in cloud cover segmentation algorithms based on the all-sky imaging principle and imaging characteristics of different wavelength bands. For the visible band, a visible cloud image segmentation network, SegCloud, is proposed in light of deep learning technology, while for the infrared band, an infrared cloud segmentation algorithm based on numerical simulation of the infrared raw grayscale image is proposed. To quantitatively analyze the effectiveness of the algorithm, this paper analyzes the consistency and accuracy of the dual-band cloud observation data and verifies the high accuracy of the system in cloud cover observation.Conclusions and ProspectsThe dual-band all-sky cloud cover observation system proposed in this paper effectively solves the problems of the blocking of traditional visible all-sky imaging equipment and the small observation field of view of the infrared equipment, laying the foundation for the accuracy improvement of ground-based cloud observation. In addition, the dual-band all-sky cloud cover observation design not only enables all-day ground-based cloud observation but also provides multi-channel raw data for the inversion of parameters such as cloud optical thickness, cloud base height, and precipitable water.
ObjectiveThe bidirectional reflectance distribution function (BRDF) is commonly used to accurately characterize the scattering property of the surface of opto-mechanical structures in stray light analysis. Software for stray light analysis based on the Monte Carlo method (MCM) can construct probability models for scattered ray tracing on the basis of BRDF models. However, the types of BRDF models allowing surface property setting in the software are limited. Although the inverse transform technique can be used to construct probability models, the BRDF of most scattering models is modulated by multiple variables with complex forms, and the analytical solution of the cumulative distribution function is absent. Consequently, this method becomes invalid, and it also limits the application of BRDF models to some extent. As scattered ray tracing is limited by the difficulty in obtaining an analytical solution, a probability model for scattered ray tracing is constructed by the rejection sampling method. The proposed method circumvents the integral solution process by setting test conditions and then screens out the effective samples to achieve scattered ray tracing, whereby it gains the advantage of wide applicability.MethodsThe rejection sampling method is applied to construct the probability model for MCM-based scattered ray tracing in the present study. Specifically, the BRDF describing the scattering model is converted into a probability density function, and random sampling based on uniform distribution is performed. Then, a reasonable squeezing function is used, and the effective samples are screened out under the test conditions. Finally, the effective samples are taken as the direction of the scattered ray, and scattered ray tracing based on the BRDF model is thus achieved. For the shift-invariant BRDF model, a symmetric sampling scheme is further proposed to sample the half-space after determining the sampling interval. The angular coordinates are converted into direction cosines, and the effective samples are selected by the rejection sampling method. The effective samples in the half-space are then used to obtain those in the full-space by applying mirror symmetry about the axis of symmetry. Simulation programs are prepared in Matlab according to the proposed method, and the simulation results in Matlab are compared with those in LightTools from the aspects of repeatability and accuracy. The same simulation parameters of surface property, incidence angle, and number of traced rays are set to simulate the BRDF models commonly used in engineering for scattered ray tracing. Since scattered energy distribution is the direct reflection of the simulated tracing results, the universal quality index (UQI) is used to quantify the different energy distributions on the analyzed surface at different times of simulation. The repeatability and accuracy of the simulation are described by the UQI.Results and DiscussionsThe ABg model of the oxidatively blackened mechanical component for scattered ray tracing is simulated, and the obtained UQI values of the simulation results based on the proposed method and those of the results in LightTools are all higher than 0.9985 (Fig. 5). The simulation results based on the rejection sampling method are comparable to those in LightTools in terms of repeatability and accuracy. The ABg model is used to model the two scattering surfaces of shiny aluminum alloy and standard lens glass for scattered ray tracing, and the Harvey model is used to model an optical surface for the same purpose. The UQI values of the simulation results based on the proposed method and those of the results in LightTools are all higher than 0.9994 (Fig. 6). The scattered energy distribution based on the simulation programs is highly consistent with the result delivered by LightTools, which verifies the rationality and validity of the proposed method. The Phong model and the K-correlation model that are not included in LightTools are also simulated for scattered ray tracing, the UQI values obtained which are used to describe the repeatability of the simulation are all higher than 0.9970 (Fig. 7). This result further verifies the universality of the proposed method.ConclusionsTo address the limited applicability of the existing scattered ray tracing methods based on probability models, this study proposes the probability model by the rejection sampling method. Specifically, the BRDF is converted into the probability density function, and the probability model is thereby constructed for random sampling. Then, the effective samples that meet test conditions are used as the direction of the scattered ray. Finally, the spatially continuous distribution of scattered energy is converted into the probability distribution of a discrete ray, and scattered ray tracing is thus achieved. For the shift-invariant BRDF model, a symmetric sampling method is further proposed to enhance the sampling rate by halving the sampling area and then mirroring it. In the case of BRDF models with different materials, ray tracing programs are constructed to achieve scattered ray tracing in Matlab. To verify the simulation results based on the proposed method and those delivered by LightTools in terms of repeatability and accuracy, this study sets the same simulation parameters in Matlab and LightTools. The simulation results based on the rejection sampling method in the present study are almost the same as those in LightTools, and scattered ray tracing based on BRDF models that are not included in LightTools is also achieved.
ObjectiveInfrared maritime target recognition plays a significant role in the field of maritime search and maritime rescue. However, complex maritime conditions and illumination interference decrease the quality of maritime infrared images. For example, the backlight maritime condition can result in maritime targets with a negative contrast and make them disappear in the maritime background. How to enhance the contrast of maritime infrared targets and improve the quality of dim targets in the backlight maritime condition is the significant basis of maritime target detection and recognition. Furthermore, studying effective methods for detecting maritime targets in the backlight maritime condition is a significant research direction, and conventional target detection algorithms often lead to a high false alarm rate and low detection rate. We hope that the proposed enhancement algorithm can outstand maritime targets in the backlight maritime condition and the proposed target detection algorithm can detect maritime targets in backlight maritime conditions with a high accuracy rate.MethodsWe have tested the histograms of multiple maritime infrared images in the backlight condition and studied the characteristics of these histograms. Then, we find that the histograms can reflect the characteristic of a local peak, which represents the large background in the backlight maritime condition. We limit the maximum proportion in the histograms and obtain a novel histogram. The novel histogram is equalized, and it can prevent illumination interference and improve image quality. In addition, we quantize and extract the edge information in a backlight maritime image, and the edge information is fused with a suitable proportional parameter in the middle result of novel histogram equalization, which makes the enhancement result have high contrast and more detailed information. Conventional methods for target detection such as the local contrast method (LCM) are used in target detection with positive contrast by a target detection unit with a single scale. In the proposed local contrast method with multiscale for target recognition in backlight condition (LCMMBC) algorithm, we establish the target detection unit with multiple scales and define the local contrast saliency between the local targets and the local background in a negative contrast condition, and some significant procedures such as moving steps, pooling strategy, and threshold selection are discussed. Finally, the pseudocode and the implementation process of the LCMMBC algorithm are described.Results and DiscussionsInfrared maritime images have the characteristics of large background with a low gray value and target region with a negative contrast which can easily disappear in the large background (Fig. 1). The histograms of the maritime infrared images in the backlight condition have a local peak (Fig. 2), and the local peak is the high proportion of pixels in image histograms, which represents the large background in backlight maritime infrared images. The diagram of the original histogram modification includes the maximum proportion's limit and normalization of the novel proportion of pixels (Fig. 4). The result of the novel histogram equalization (Fig. 5) shows that the illumination condition is reasonably adjusted compared with the original image (Fig. 1). However, the middle result misses some details to some degree, and we need to add some edge information. The edge information's structural elements, quantification model, and extraction method are described in this paper (Fig. 6), which can reflect the gray value variation around the central pixel. At last, the result of histogram equalization with plateau limit and edge fusion (HEPLEF) algorithm has high local contrast, and the illumination of the enhancement result is uniform. In particular, dim maritime targets are highlighted by this proposed algorithm (Fig. 9). From the objective image quality assessment, it can be seen that the average gradient of the enhancement result is increased by more than two times than that of the original image (Table 1), and the local contrast gain is increased by more than two times than that of the original image (Table 2). The image assessment standard reflects that the HEPLEF algorithm can enhance the details of infrared maritime images and improve the contrast of infrared maritime images effectively. The support of the maritime target enhancement for target detection is also studied, and a three-dimensional diagram of local contrast saliency is used in the comparison between the enhancement result and the original image. Furthermore, the enhancement result increases the suspected target region's local contrast obviously (Fig. 18). The performance of the proposed LCMMBC algorithm is also tested, and we hope that the proposed algorithm can obtain a higher detection rate and lower false alarm rate. The experimental result shows that the proposed algorithm achieves a detection rate of 99.8% and a false alarm rate of 23.4%, respectively (Table 3), which shows better performance than other algorithms.ConclusionsIn this study, two novel algorithms called HEPLEF and LCMMBC are used for infrared maritime image enhancement and infrared target detection in the backlight condition, respectively. The HEPLEF algorithm can be applied in infrared maritime images with a large maritime background and dim maritime targets, and the enhancement result reflects that the contrast of the entire image is improved, and the target details are highlighted. The HEPLEF algorithm has characteristics of fewer input parameters and chief calculation. LCMMBC algorithm is suitable for maritime targets with a negative local contrast, and the performance of the LCMMBC algorithm is robust. In the principle of the LCMMBC algorithm, the disadvantages are the size of the minimum detection unit relies on the factual target size in the infrared image, and the selection of the minimum target detection size and local contrast saliency threshold of the LCMMBC algorithm is sometimes difficult.
ObjectiveAs s toxic hydrocarbon pollutant, oil spills can become oil slicks on the sea surface, which hinders the material exchange between water and air and poses a serious threat to marine ecological environments as well as the production and life of human beings. Investigation on how to realize early warning and continuous monitoring of pollutants in the early stage of oil spill accidents is of great significance to the protection of marine environments. The marine optical remote sensor is a powerful tool to realize continuous dynamic monitoring of large-area marine environments at different scales and levels. But the solar flare which is the main reason for the saturation and distortion of optical remote sensors brings inherent difficulties in improving information extraction of remote sensing. Some previous studies indicate that the solar flare possesses significant polarization characteristics under specific conditions, and polarization detection is an effective method for oil spill detection. However, under the influence of wind speed and direction, the real sea surface cannot be regarded as a smooth one, and the characteristics and states of oil spills are complex. In the 1950s, Charles Cox and Walter Munk put forward a famous Cox-Munk probabilistic statistical model of rough sea surface after a long-term rigorous investigation, which conforms very well to the real state of the sea surface. In this paper, the Cox-Munk probabilistic statistical model is employed to model the solar flare reflected by rough sea surface affected by wind speed and direction. With the polarization reflection parameter defined by Fresnel's law, this paper quantitatively simulates and studies the spatial distribution and related differences between the degree of linear polarization (DOLP) of solar flare reflected by clean seawater and oil slicks with different refractive indexes under different incident and observation geometries, as well as different wind speed and direction on the sea surface. This paper hopes that the simulation results can facilitate the application of multi-angle polarization remote sensing technology for marine oil spill surveillance.MethodsFirstly, with the polarization reflectance coefficients defined by Fresnel's law, the orthogonal polarization Fresnel reflectance Rp and Rs of the solar flare reflected by calm sea surface are obtained. According to Cox-Munk probabilistic statistical model, the polarization bidirectional reflectance Rglint-p and Rglint-s of the solar flare reflected by rough sea surface are calculated based on Rp and Rs. In the next step, on the basis of Rglint-p and Rglint-s, the spatial distribution of the DOLPof the solar flare reflected by different sea surface media with various refractive indexes on rough sea surface affected by different wind speed and direction is simulated with respect to any incident and observation geometry. Furthermore, the spatial distribution ofDOLP differences between clean seawater and oil slicks is simulated, and the most sensitive polarization observation angle of oil slicks with different refractive indexes is obtained.Results and DiscussionsThe wind speed is set at 5 m/s, with the incident zenith angle set as 15°, 45°, and 56°, and the spatial distribution of theDOLPof the solar flare reflected by clean seawater and oil slicks is simulated (Fig. 2). The contour of theDOLP of the solar flare is approximately a concentric circle, and the minimum of the DOLP is located at the position corresponding to the incident zenith angle within the incident principal plane. As the incident angle gets larger, the distance between theDOLP contour in the direction perpendicular to the incident principal plane is wider than that in the parallel direction, and the contour features an elliptic shape. According to a specific DOLPof the solar flare, within the incident principal plane, the increase in θs is equal to the decrease in θv. By making the solar incident angle θs is 45°, this paper simulates the distribution of theDOLPof the solar flare reflected by oil slicks with three different refractive indexes (Fig. 3). It is shown that the variation rate of the DOLP value with the change in observation geometry is related to the refractive index of sea surface media. When a specific angle is changed in the observation geometry, as the refractive index of sea surface media increases, the variation of theDOLP value becomes slight. In order to improve the oil slick detection sensitivity, the optimum polarization detection area with the largest difference between the DOLP of the solar flare reflected by clean seawater and oil slicks is simulated. When the incident zenith angle θs =45°, and the observation azimuth angle φv equals 0° and 180° or ranges from 90° to 270°, respectively, the DOLP variation curves with the observation zenith angle φv of the solar flare reflected by clean seawater and oil slicks are simulated and compared (Fig. 4). When the incident angle is big enough, as observation zenith angle increases, the DOLPcurves of all media first increase and then decrease. In addition, no matter how θs changes, there is a negative linear correlation between θs and the observation zenith angle θvm corresponding to the most significant DOLP difference between the solar flare reflected by clean seawater and oil slicks. That means the sum of θs and θvm is a fixed value, which is highly related to the refractive index of oil slicks.ConclusionsIn this paper, the spatial distribution of DOLPof the solar flare reflected by clean seawater and oil slicks are simulated under various incident and observation geometries based on Cox-Munk probabilistic statistical model. The optimum polarization detection angle of oil slicks with different refractive indexes is determined. It is shown that the incident and observation geometry as well as the refractive index of sea surface media are the main factors affecting the spatial distribution of the DOLP of the solar flare. Furthermore, a lower refractive index of the medium is often accompanied by a higher rate of variation of the DOLP of the solar flare with specific changes in the observation geometry. When the incident zenith angle reaches a certain value, it is possible to observe a positive-to-negative reversal of the difference between the DOLP of the solar flare reflected by seawater and oil slicks within a specific range of azimuth angles of the forward reflection area. For oil slicks with specific refractive indexes, the sum of the optimum polarization detection angle and the solar incident zenith angle is constant, which is closely related to the refractive index of the oil slicks. According to the simulation results, under specific incident and observation geometry, polarization detection can significantly improve the sensitivity of oil spill detection. Therefore, this paper is expected to provide support for the protection of marine environments.
ObjectiveWith the rapid development of petrochemical and related industries, oil pollution incidents occur frequently. Aromatic hydrocarbons, benzene series, and polycyclic aromatic hydrocarbons are the main components of petroleum, which have effects of teratogenicity, carcinogenicity, and gene mutation. Once they enter the soil, they will accumulate in the soil for a long time and ultimately affect human health through the food chain. The traditional detection techniques of organic pollutants mainly include gas chromatography, gas chromatography-mass spectrometry, liquid chromatography, etc. Although these methods are standard methods with high sensitivity and excellent accuracy, they have the disadvantages of complex sample pretreatment and slow test speed and are not suitable for rapid on-site detection. At present, the existing optical detection techniques mainly detect the components of organic matter, and the measured components have large errors. In addition, the total amount of organic matter cannot be simply summed. Imaging technology provides an alternative way to realize the total detection of soil organic pollutants. In this paper, an ultraviolet-induced fluorescence imaging system is built, and the direct detection method of the total amount of aromatic hydrocarbons in standard soil is studied, which provides feasibility for the rapid determination of the total amount of aromatic hydrocarbons in soil.MethodsThe experimental system is built using a light emitting diode (LED) excitation light source, plano-convex lens, filter, CCD camera, sample holder, control circuit board, and personal computer. After the excitation light from the LED light source is collimated and converged by the lens group, it is irradiated on the surface of the soil sample with a certain size of the light spot, and the aromatic hydrocarbons in the soil are excited to generate fluorescence. After the CCD camera captures the fluorescent image signals, the signals are transmitted to the computer for analysis and processing. A standard soil (GBW07494) is selected to prepare the experimental samples of motor oil (15W-40). The original image captured by the camera is obtained by using the maximum inter-class variance method to obtain the image threshold and converted into a binary image, and the binary image is dot multiplied with original gray image to obtain the gray value data.Results and DiscussionsAiming at the problem of rapid detection of the total amount of aromatic hydrocarbons in soil, methods such as the acquisition of aromatic hydrocarbon fluorescence signals in soil, feature extraction, and total concentration inversion based on fluorescence imaging technology are studied. On the basis of an LED ultraviolet excitation light source, area-scanning CCD camera, lens, and other devices, an experimental system is built. The parameters such as the optimal excitation energy and excitation angle of the light source are obtained, and the detection capability of the experimental system is analyzed. Through this experimental system, a series of fluorescence images of petroleum in standard soil with mass fraction ranging from 0 to 25000×10-6 are obtained. Based on the Gaussian noise reduction and maximum inter-class variance method, the image noise suppression and fluorescence signal extraction methods are studied, and an inversion model of the total amount of aromatic hydrocarbons in standard soil is established. Furthermore, the total amount of aromatic hydrocarbons in the sample to be tested is predicted by using the inversion model. The results show that the coefficient of determination (R2) of the total inversion model reaches 0.9889 (Fig. 10), and the detection limit is 82.18. For 20 samples, the errors are basically within 12%.ConclusionsFluorescence imaging technology breaks through the shortcomings of traditional organic detection methods such as complex sample preprocessing and slow testing speed, and has the characteristics of fast and convenient detection. In this paper, a fluorescence imaging detection experimental system is built, and a rapid and direct measurement method of the total amount of aromatic hydrocarbons in soil is studied. Its precision and accuracy have met the needs of rapid field detection. In the process of system construction, the influence of the excitation energy of the light source and the receiving parameters of the CCD camera on the fluorescence imaging results is analyzed, and the optimal parameters are selected, with the experimental system optimized. Based on the experimental system, a series of aromatic hydrocarbon fluorescence images for petroleum in standard soil are obtained. The image signal processing method is studied, and a calibration model is established. The coefficient of determination between the fluorescence image signal and the mass concentration is 0.9889, and the detection limit is 82.18. This study provides a method basis for the application of fluorescence imaging in situ monitoring technology to the rapid monitoring of organic pollution of aromatic hydrocarbons in soil. In addition, the effects of physical and chemical parameters such as soil moisture, temperature, pH, and organic matter on the fluorescence image signals of aromatic hydrocarbons in soil are being studied in depth.
ObjectiveAs a precise optical instrument, a telescope is subject to changes in its focus position due to atmospheric disturbances, temperature changes, and installation errors. If real-time focusing is not performed, the image may be distorted, which would seriously affect the tracking and measurement effects of the telescope. With the improvement of the intelligence level, automatic focusing technology is applied to the focusing of the telescope system. The algorithm to evaluate the image sharpness is the key to the decision of the focus position of the telescope's automatic focusing technology, whose performance directly determines the accuracy of automatic focusing. The traditional algorithm for evaluating the focusing of a telescope is implemented on the basis of statistical analysis, which can hardly ensure the real-time performance and noise immunity of astronomical images. Most of the existing algorithms have relatively poor performance, and it is difficult for them to extract target features from the captured images of high-speed moving targets. Moreover, it is often impossible to evaluate the engineering level of algorithms and hardware due to insufficient hardware experiments on the system. To solve the above problems, this study proposes a half-flux diameter real-time auto-focusing sharpness evaluation algorithm with improved centering accuracy (HFD-ICA). The algorithm has a low cost, high real-time performance, and good stability and is suitable for the focusing of most telescope systems. It is expected that this method can improve the autofocusing performance of telescopes and provide references for research in related fields.MethodsFirst, the acquired raw image sequence (defocus-focus-defocus) is denoised by the anisotropic diffusion method. Then, the denoised image is binarized by the Qtsu threshold method, and the target star is extracted from the background. Upon binarization, the pixels adjacent to the target are clustered, and the boundary of the target is calculated to obtain the target region of interest (ROI). According to the determined ROI domain, the improved intensity-weighted centroid (improved IWC) method is used to iteratively calculate the centroid of the star image until the centroid reaches the accuracy level of sub-pixels. After the centroid is determined, the half-flux diameter (HFD) value of the star image is measured by the HFD-ICA method, and the hyperbolic fitting method is used to further process these values. The V-shaped curve that guides the focusing of the telescope can be drawn, and the focus position of the telescope can be determined.Results and DiscussionsThe HFD value measured by the proposed algorithm is V-shaped with the focus position, and the V-shaped curve represents the characteristics of the optical system consisting of the focus, telescope, and camera (Fig. 13). The focusing accuracy of the HFD-ICA algorithm is high, and its fixed focus rate is equivalent to that of the high-precision astronomical image processing software IRAF, both reaching 98% (Table 1). The anti-noise performance test of the algorithm shows that after the addition of a small amount of noise, the gray value around the star point changes, which interferes with the processing performance of the algorithm, and the precise fixed focusing rate of the algorithm is affected to a certain extent. In comparison, the anti-noise performance of HFD-ICA is the best (Table 2). Furthermore, compared with other algorithms in terms of operation time, the HFD-ICA algorithm has a faster calculation time and the best real-time performance. Compared with the results of the HFD method, the real-time performance is improved by about four times. The full width at half maximum (FWHM) method takes a lot of time because it requires curve fitting during measurement. The average processing time reaches 32.4 s, which is about 6.89 times that of HFD-ICA. The software IRAF with relatively high processing accuracy has an average processing time as high as 45.7 s, which is nearly 10 times longer than that of the HFD-ICA method (Table 3).ConclusionsThis paper mainly studies the algorithm for evaluating the image sharpness under the automatic focusing of telescopes. The experiments verify that the HFD-ICA method is stable, efficient, and robust and can handle the image frames seriously out of focus when it is used to guide the automatic focusing of the 1.2 m telescope system. Compared with the HFD method without improved centering accuracy, the algorithm has improved performance, and its precise fixed focusing rate is comparable to that of the high-precision astronomical image processing software IRAF, both reaching 98%. The average processing time of the algorithm in the process of guiding focusing is only 4.7 s, 1/10 of that of IRAF, which meets the real-time requirements of the focusing system. Compared with the case of the system's original manual focusing, this study improves the system's average focusing efficiency by roughly 37%. To a certain extent, the research lays the foundation for the fully automated observation of future stations and also provides a reference for the automatic focusing of other telescope systems.
ObjectiveMulti-longitudinal-mode (MLM) high-spectral-resolution lidar (HSRL) is a novel laser remote sensing technique for realizing fine detection of aerosol optical properties. The Mach-Zehnder interferometer (MZI) with a periodic transmittance is selected as the spectral discriminator for directly separating aerosol Mie scattering and molecular Rayleigh scattering spectra excited by the MLM laser. In principle, the design of the MZI for the application of the MLM-HSRL should meet two conditions. One is that the optical path difference of the MZI is twice the laser cavity length, and the other is that the optical path difference of the MZI is an integer multiple of the laser wavelength. The laser elastic echo scattering signal received by the MLM-HSRL has Gaussian transmission characteristics consistent with the laser beam, which makes the incident light beam on the MZI have a divergence angle. The divergence angle of the incident light beam leads to a deviation in the optical path difference of the MZI, which makes the optical path difference of the MZI fail to equal an integer multiple of the laser wavelength and then makes the discrimination capability of the MZI worse. As the divergence angle of the incident light beam cannot be eliminated, a field-widening technique for the MZI with a large optical path difference based on compensated glasses is proposed to reduce the influence of the divergence angle of the incident beam on the discrimination capability of the MZI.MethodsIn this study, a field-widening technique for the MZI with a large optical path difference is studied for the application of the MLM-HSRL for realizing fine detection of aerosol optical characteristics. First, the required design parameters of the MZI with a large optical path difference and an inversion method of aerosol optical properties in the MLM-HSRL system are analyzed. Second, the mathematical relationship between the divergence angle of the incident light beam and the effective transmittance of the MZI with a large optical path difference is established, and the maximum allowed divergence angle for the MZI (OPD=1000 mm) is calculated. Third, a field-widening technique for the MZI with a large optical path difference based on compensated glasses is proposed. The principle of the field-widening technique is explained, and the mathematical model between the optical path difference of the MZI with the field-widening technique and the divergence angle of the incident light beam is established. According to such analysis, compensated glasses are selected, and their length is calculated. Fourth, the theoretical modeling and simulation verification of the proposed field-widening technique are carried out.Results and DiscussionsThe discrimination capability of the MLM-HSRL system is affected by the divergence angle generated by the Gaussian transmission distribution of the laser elastic echo scattering signal. Theoretical analysis shows that the maximum allowed divergence angle of the MZI (OPD=1000 mm) is no more than 0.4 mrad, so as to ensure an excellent discrimination capability of the MZI with a large optical path difference (Fig. 4). A field-widening optical path of the MZI with a large optical path difference based on compensated glasses is shown in Fig. 5. Compensated glasses are chosen to be the HK9LGT glass, whose refractive index (standard state @532.0 nm) is 1.517, and the coefficient of thermal expansion is 7.6×10⁻⁶. The total length of the required compensated glasses is 1165.767 mm. In addition, the transmittance of the compensated glasses decreases as the length increases, and the transmittance decreases by 0.2% when the length increases by 10 mm (Table 1). The theoretical analysis shows that the allowed divergence angle of the MZI with a large optical path difference (OPD=1000 mm) should be less than 25.6 mrad after the field widening (Fig. 6). Zemax simulation results show that the effective transmittance of Taa is lower than 0.7, and positive discrimination effect cannot be achieved when the divergence angle is greater than 0.4 mrad before the field widening. The effective transmittance of Taa is 0.825-0.793, and MZI has excellent discrimination capacity (Fig. 9) when the divergence angle is 0-5 mrad after the field widening.ConclusionsMZI, as a spectral discriminator, is the core device in the MLM-HSRL system. The Gaussian transmission distribution of the laser elastic echo scattering signal makes the incident light beam on the MZI with a large optical path difference inevitably have a divergence angle. In this paper, the influence of the divergence angle on the discrimination capability of the MZI with a large optical path difference is analyzed in detail, and the maximum allowed divergence angle of the MZI (OPD=1000 mm) is 0.4 mrad. In order to reduce the influence of the divergence angle on the transmittance of the MZI, a field-widening technique for the MZI with a large optical path difference based on compensated glasses is proposed. The theoretical analysis results show that the maximum allowed divergence angle of the MZI (OPD=1000 mm) is 25.6 mrad after the field widening. The proposed field-widening technique enlarges the allowed divergence angle range of the system by nearly 50 times. The simulation results show that the effective transmittance of Taa decreases rapidly with the increase in the divergence angle, and the discrimination capability of the MZI becomes worse at a divergence angle greater than 0.4 mrad before the field widening, while Taa decreases slightly with the increase in the divergence angle, and the discrimination capability of the MZI is positive at a divergence angle ranging from 0 to 5 mrad after the field widening. The proposed field-widening technique can extend the received field angle of the MZI with a large optical path difference and improve the discrimination capability of the MZI with a large optical path difference.
ObjectiveClouds cover more than 60% of the Earth's surface and are an important factor in the Earth's radiation budget. However, the spatial and temporal distribution and microphysical parameters of clouds are complex and changeable, and the quantification is complicated. Uncertainties in cloud formation, interactions between cloud and radiation, and cloud parameters pose great challenges to the accuracy of general circulation models. Sensors in the visible and infrared spectral ranges have been developed earlier, and the technology is relatively mature. However, since the scale range of ice cloud particles is large, and the corresponding instrument has a short detection wavelength and is sensitive to small ice cloud particles or thin cirrus clouds, it cannot effectively detect ice clouds of large particles with a large scale range. Terahertz (THz) wavelength is close to the particle size of typical ice clouds, and THz wave has strong interactions, which can be used as an effective supplement to visible and infrared sensors, but the ability of THz wave to detect water clouds is insufficient due to the absorption of water vapor. Aiming at the insufficient coverage of cloud particle detection by existing satellite-borne remote-sensing instruments, this paper proposes an optical system design scheme suitable for multi-channel cloud detection spectral imagers with a wide spectrum from visible to THz bands, which can achieve more comprehensive cloud information detection. Moreover, the integrated observation can also provide more sufficient and convenient observation data for the simultaneous retrieval of cloud information in the visible, infrared, and THz bands.MethodsAccording to the requirements of cloud parameter retrieval, the system channels are set. A total of 10 detection channels are selected, including four visible/near-infrared (VNIR) channels, two short-wave infrared (SWIR) channels, three thermal infrared (TIR) channels, and one THz channel. According to the orbit height (450 km) and pixel size of the detector, the focal length of the system is determined. Through the evaluation of the signal-to-noise ratio, the system aperture is determined. The aperture of the THz band is set as 150 mm, and F number is 3. For visible and infrared bands, the aperture is 42 mm and 68 mm, respectively, and F number is 2. The optical system adopts an off-axis catadioptric structure. In order to separate the THz band from visible and infrared bands, a method of split-field of view is developed. The THz wave is directly imaged by the off-axis three-mirror system, and the visible and infrared bands are imaged again by the rear optical path. The aperture of visible and infrared bands is separately set to solve the problem caused by the large aperture difference relate to the THz band. Finally, tolerance analysis of each subsystem is carried out step by step according to the degree of optical path overlap.Results and DiscussionsThe imager operates in a push-broom imaging mode to acquire 10 channels' spectrum information from visible to THz bands. The swath width is 100 km corresponding to the orbit of 450 km, and the nadir spatial resolution of THz, visible, and infrared bands are 10 km, 75 m, and 100 m, respectively (Table 1). The main optical system adopts a non-re-imaging three-mirror off-axis anastigmat structure [Fig. 2(a)], the root-mean-square radius of point spot of visible and infrared bands is less than 2 μm [Fig. 2(b)], and that of the THz band is less than 7 μm [Fig. 2(c)], which is much smaller than the pixel size. The rear optical path of the VNIR part adopts the off-axis three-mirror structure again [Fig. 3(a)]. The rear optical path of the SWIR adopts a five-piece transmission type [Fig. 4(a)], which is made of silicon or broadband ZnS. The rear optical path of the TIR adopts two materials, namely, germanium and ZnSe, with a total of four lenses [Fig. 5(a)]. The design results show that the modulation transfer function (MTF) of each subsystem is close to the diffraction limit, the spot diagrams are all smaller than the Airy disk, and the image quality is excellent. Finally, all the sub-optical systems are assembled, and the optical paths are folded (Fig. 6). The total length of the entire system is less than 800 mm, and the volume is relatively compact. The tolerance analysis shows that the MTF drop of each channel does not exceed 0.16 at the Nesquit frequency. The tolerance of the entire system is loose, and the allocation is reasonable.ConclusionsIn this paper, an integrated cloud detection optical system with visible, infrared, and THz wide spectrum bands is designed. The THz band adopts the off-axis three-mirror structure, while VNIR, SWIR, and TIR bands use a secondary imaging structure. The aperture is set separately to realize the multi-channel integrated detection imaging with a large optical aperture difference, and the wide band separation is realized by split-field of view. The structure of the whole system is compact, the imaging quality is good, and the allocation of tolerances is reasonable, which meets the design requirements. The system can verify the development of space-borne THz ice cloud detection technology, and the wide spectrum integrated imaging technology is conducive to the realization of channel registration and remote sensing retrieval and application. In addition to cloud detection, this imaging scheme can also provide a certain reference for other broadband imaging systems.
ObjectiveSoil petroleum hydrocarbon pollution is increasingly serious. Petroleum pollutants released into the environment due to oil extraction are as high as 4×10⁷ t per year. Petroleum pollutants are extremely harmful to the soil, destroying the surface structure of the soil. Worse still, the pollutants enter the food chain through soil and water cycles, destroying the ecological environment and threatening human health. To effectively prevent and control petroleum hydrocarbon pollution in soil, it is necessary to conduct on-site rapid detection of petroleum hydrocarbon pollution in soil. However, some traditional detection methods of petroleum hydrocarbon in soil, including infrared spectrophotometry, high-performance liquid chromatography, gas chromatography, gas chromatography-mass spectrometry, Soxhlet extraction, and gravimetric method, have to extract soil samples first, which is complicated to operate. Therefore, these traditional technologies cannot be used as on-site detection of petroleum hydrocarbon pollution in soil. Moreover, it is easy to cause secondary pollution during the collection, transportation, and pretreatment of soil samples contaminated by petroleum hydrocarbons. Some components of pollutants are very easy to volatilize, which leads to deviations in the detection results of petroleum hydrocarbon content. Therefore, a real-time in-situ detection of petroleum hydrocarbon pollutants in the soil is an important prerequisite for improving the detection speed and accuracy, and it is urgent to develop a rapid in-situ detection method of petroleum hydrocarbon pollutants in soil. To further improve the efficiency and accuracy of the rapid in-situ detection of petroleum hydrocarbons in soil, this paper applies deep ultraviolet (UV) light emitting diode (LED) as the excitation light source to detect petroleum pollutants in soil based on UV-induced fluorescence technology, which provides a new method for the rapid in-situ detection of petroleum hydrocarbons in soil.MethodsThree types of soil substrates mixed with three types of oil are selected as test samples, and the samples are detected by constructing a UV-induced fluorescence system. The sensitivity, stability, applicability, and accuracy of the detection system are verified. The detection system adopts a deep UV LED driven by a parallel constant current circuit (central emission wavelength of 280 nm, half-wave width of 10 nm, and rated optical power of 8 mW). A dual-lamp-bead combined symmetrical illumination system is constructed. After the sample passes through a 280 nm bandpass filter, an excitation spot with an area of 1 cm2 is formed on the surface of the soil sample. The excitation light power measured by the UV irradiance meter is 3.78 mW/cm2. The fluorescence detector uses the Hamamatsu H10721-01 photomultiplier tube (PMT) with the detection sensitivity of 200 μA/lm and the PMT voltage of 0.55 V. The sample is loaded into a special circular sample cell, and a flat surface is formed by pressing. The detection system structure is shown in Fig. 4.Results and DiscussionsSince it is difficult to detect petroleum hydrocarbons in the soil in situ, the deep UV LED-induced fluorescence system is built to detect different types of oil in the soil in this study. The detection system has high sensitivity and stability, and its detection effect is significantly better than that of the laser induced fluorescence spectroscopy (LIF) system. The detection system is utilized to detect different types of engine oils (gasoline engine oil, diesel engine oil, air compressor engine oil) on different soil substrates, and the detection results are as follows. The detection limits of three kinds of engine oils on the soil substrate of red soil are 60.38 mg/kg, 29.91 mg/kg, 8.66 mg/kg, respectively. The detection limits of three kinds of engine oils on the soil substrate of yellow soil are 62.37 mg/kg, 31.39 mg/kg, 8.87 mg/kg, respectively. The detection limits of three kinds of engine oils on the soil substrate of black soil are 104.97 mg/kg, 52.01 mg/kg, 16.75 mg/kg, respectively. The relative standard deviation of oil in different types of soil is less than 4.00%, and the average error of measurement is less than 10.00%. The experimental system constructed in this study completes the accurate quantification of different soil types and different oils, and verifies the feasibility of the UV-induced fluorescence in-situ detection technology of petroleum hydrocarbon pollutants in soil. Using deep-UV LED as the light source and PMT as the detector, the detection system is miniaturized, which provides a new method for the in-situ detection of petroleum hydrocarbon pollutants in soil and provides an important technical reference for the detection of petroleum hydrocarbon pollutants in deep soil in the future.ConclusionsThis study uses UV-induced fluorescence technology to achieve quantitative detection of engine oil in soil. The use of deep-UV LED as the light source and PMT as the detector realizes the miniaturization of the detection system and significantly improves the detection sensitivity of the system. Through quantitative detection of different types of engine oil pollution in the soil, it is verified that there is a good linear relationship between the engine oil fluorescence intensity and its mass fraction. The feasibility of UV-induced fluorescence detection of engine oil under different soil substrates is studied, and the applicability of the method under different soil substrates is verified. The experimental results show that the detection method of engine oil based on UV induction technology can be well applied to the detection of engine oil in the soil, which provides a feasible method for the rapid in-situ detection of petroleum hydrocarbons in soil in the future.
ObjectiveSpace-based gravitational-wave observatories (SGOs) promise to measure pico-meter variations in the gigameter separations of a triangular constellation. Telescopes play a crucial role in using transmitting and receiving laser beams measuring the constellation arms with heterodyne laser interferometry. The far-field phase noise induced by the coupling of the wavefront aberrations of optical telescopes with their pointing jitters is one of the major noise sources for the measurement. As phase noise suppression is a critical aspect for achieving the required comprehensive measuring stability, this paper theoretically analyzes the mechanism of the far-field phase noise, proposes an optimization strategy for the design of the optical telescopes in SGOs, and verifies it to pave the way for the comprehensive phase noise control in the design-to-manufacture process.MethodsTo analytically establish the relationship of the coupling coefficient with the aberrations in the form of polynomial expansions, the paper adopts the Fringe Zernike polynomials to represent the aberrations and further construct and describe the wavefront error. Then, the coupling coefficient defined as the modulus of the gradient of the far-field wavefront error is expressed as a polynomial function of the aberration coefficients and the tilt angles and is further simplified on the basis of the symmetry of the telescope. According to this relationship and the aberration characteristics of the telescope design residuals, the paper evaluates the effect of different aberrations on phase noise, revealing that defocus, primary astigmatism, and primary spherical aberration are the keys to controlling the coupling coefficient. Thus, an optimization strategy based on key aberration control is proposed. The performance of this method in far-field phase noise suppression is verified by examples of telescope design.Results and DiscussionsThe wavefront quality of the telescopes before and after optimization (Table 1) by the above strategy is at the λ/20 (λ=1064 nm) level. Before optimization, the far-field wavefront changes significantly within the range of ±100 nrad. Accordingly, the coupling coefficient increases rapidly with the tilt angle to over 1 pm/nrad. After optimization, although the wavefront residuals are slightly worse (Table 2), the range of far-field wavefront error decreases markedly by more than 90% (Fig. 4). The corresponding coupling coefficient is smaller than 0.11 pm/nrad within the range of ±100 nrad. It is only 6% of that before optimization and much smaller than the required value (Fig. 5). These results indicate that the optimization strategy based on aberration control can effectively reduce the coupling coefficient of the far-field phase noise, even in the case of poor wavefront quality.ConclusionsOn the basis of theoretical analysis of the mechanism of the far-field phase noise, this paper determines the relationship of the coupling coefficient with the aberrations, develops an optimization strategy based on key aberration control, and verifies the strategy. The results reveal that suppressing the key aberrations deliberately instead of simply enhancing the demand for wavefront quality in the optimization process can reduce the sensitivity of the far-field phase to jitters more efficiently, improve the far-field phase stability of the telescope significantly, and balance the severe noise budget and the design freedom of the telescope to reserve sufficient margin for the rest optics.
Results and Discussions According to the analysis results, the target surface of the developed free-form surface condenser displays a uniform irradiation distribution, which indicates an ideal improvement in the irradiation uniformity of the optical integrator's incident surface. In the design proposal, the generatrix is rotated to obtain the free-form surface condenser. After multiple parameters of the Bézier curve are optimized, the irradiation uniformity within ?60 mm of the target surface of the free-form surface condenser rises from 52% before optimization to 92% (Fig. 7). By contrast, the irradiation nonuniformity of the solar simulator using the free-form surface condenser is significantly lower than that of the solar simulator using the ellipsoidal condenser. In the case of the free-form surface condenser, the irradiation nonuniformity within ?50 mm of the irradiation surface is better than 0.32%, and the irradiation nonuniformity within ?100 mm of the irradiation surface is better than 0.53% (Table 1). When the surface accuracy of the free-form surface condenser is controlled within ±15 μm (Fig. 12), the axial position deviation is controlled within 0.3 mm (Fig. 13), the vertical-axis position deviation is controlled within 0.3 mm (Fig. 14), and the angle deviation is controlled within 0.4° (Fig. 15), the irradiance within ?100 mm of the irradiation surface of the solar simulator can be greater than S0, and the irradiation nonuniformity is less than 1.5%.ObjectiveThe solar simulator is a device that simulates solar irradiation characteristics indoors. In the design of the solar simulator, the irradiation uniformity is an important indicator, which directly determines the accuracy of the device. Hence, improving irradiation uniformity has become a key research direction. In a solar simulator, the concentrator system is one of the key components, which typically uses an ellipsoidal condenser. By the ellipsoidal condenser, the radiation flux from the light source placed on the first focal plane will be focused on the second focal plane. As a result, a convergent spot is formed on the incident surface of the optical integrator, which is dense at the center, sparse at the edge, and Gaussian in shape. This uneven illuminance distribution is detrimental to the irradiation uniformity of the entire system. To address the poor performance of the solar simulator due to the low irradiation uniformity of the optical integrator's incident surface, this paper proposes and designs a free-form surface condenser as the concentrator system of the solar simulator. On the premise that the focusing efficiency is ensured, the irradiation uniformity on the second focal plane is effectively improved as the irradiation uniformity of the solar simulator is improved through better irradiation distribution on the optical integrator's incident surface.MethodsIn this paper, the free-form surface condenser used in the solar simulation system is studied. First, the mapping relationship between the outgoing angle of the light source and the corresponding point on the target surface is determined. According to Fresnel's law and the mapping relationship, the differential equation is derived, which is solved by the Runge-Kutta method to calculate the discrete point data. After curve fitting of the discrete point data, the bus line of the free-form surface condenser is obtained. Second, the generatrix of the free-form surface is generated by the Bézier curve. A simulated annealing algorithm is employed to conduct feedback-oriented optimization on the free-form surface condenser with an extended light source. Third, the optical system of the solar simulator is modeled by the software LightTools, and the ellipsoidal condenser and the free-form surface condenser are configured in the same optical system of a solar simulator for comparative analysis. Fourth, the irradiance and the irradiation nonuniformity within ?100 mm of the irradiation surface are taken as the evaluation indexes, and error simulation analyses are performed to investigate the influence of surface accuracy, axial position offset, vertical-axis position offset, and angle offset of the free-form surface condenser on the irradiance and the irradiation nonuniformity.ConclusionsIn this paper, a free-form surface condenser is proposed and designed. The point light source model is used to construct a reasonable initial structure according to the law of conservation of energy, the edge light theory, and the mapping method. In the design proposal, the generatrix of the free-form surface condenser is represented by the Bézier curve. The parameters of the Bézier curve are selected as the optimization variables, and the irradiation uniformity on the target surface is selected as the evaluation function. In the meantime, a simulated annealing algorithm is used to optimize the free-form surface with an extended light source. The simulation results of LightTools show that the irradiation uniformity on the irradiation surface of the solar simulator is significantly improved when the free surface condenser is used. The irradiation nonuniformity within ?50 mm of the irradiation surface is better than 0.32%, and that within ?100 mm of the irradiation surface is better than 0.53%. When the surface and pose errors of the free-form surface condenser are taken into account according to the existing processing, assembly, and adjustment level, the irradiance greater than S0 is considered feasible on the irradiation surface, and the irradiation nonuniformity is less than 1.5%. This verifies the feasibility of the processing, detection, assembly, and adjustment of the free-form surface condenser.
ObjectiveTaking fixed stars as a reference frame, star sensors solve the attitude algorithm by exploring fixed stars at different positions of the celestial sphere, through which accurate spatial orientation and datum can be provided for spacecraft. An on-orbit star sensor is usually interfered with by stray light, primarily by sunlight. The illumination of sunlight in a low earth orbit is approximately 1350 W/m2, while that of a sixth-magnitude star is approximately 1.26 × 10⁻¹⁰ W/m2 in the same condition. The ratio of the above two is approximately 1013. Thus, star sensors are extremely demanding for the technology of stray light suppression. In the presence of stray light, the pixel in calculation receives starlight and stray light simultaneously. The energy of stray light affects the gray scale of the pixel, which degrades the accuracy of star sensors or even causes the failure of stellar target acquisition in severe cases. Therefore, the function of stray light suppression is necessary for star sensors.MethodsDuring the stray light suppression by a star sensor, a baffle is employed to effectively eliminate stray light pollution in the working field of view. With suppressing stray light down to the sixth-magnitude stars' level as an example, this paper focuses on the specification demonstration, scheme design, simulation of light beam tracing, and stray light test of the star sensor baffle from perspectives of both theory and engineering application. As a start, depending on the design parameters of the optical lens, the paper specifies the extinction ratio and further clarifies the technical requirement applicable to the extinction ratio of the optical system (Equation 1). Moreover, the paper demonstrates the initial design of a baffle with such information as the effective entrance pupil aperture of the first lens (Fig. 1), the exit pupil aperture of the baffle (Fig. 2), the field of view of the baffle, and the angle of stray light suppression. Finally, the paper explains the detailed design of the baffle structure (Fig. 6), the position of vanes (Fig. 7), the critical scattering surface, and the thickness, the chamfer angle, and the direction of the edge. In the meantime, the design of a secondary or multi-level baffle is suggested for detecting highly sensitive stars so that the impact of stray light from single scattering can be avoided.Results and DiscussionsFirstly, the simulation in the paper shows the influence of edge thickness on stray light suppression (Fig. 11). The finding is only applicable to the baffle mentioned in this paper. For other baffles, edge thickness should be analyzed according to the simulation method herein. Regarding edge thickness, the following situations are discussed: 1) when the edge thickness is zero, single scattering does not occur, and multiple scattering is the main source of stray light; 2) when the edge thickness is 10 μm, the energy of single scattering is less than that of multiple scattering, and thus multiple scattering is still the main source of stray light; 3) when the edge thickness is 30 μm, the energy of single scattering is stronger than that of multiple scattering, and single scattering becomes the main source of stray light.Secondly, the performance of the star sensor in stray light suppression is verified through experimental testing (Fig. 12). Under the conditions of a sunlight suppression angle of 30° and one solar constant, such necessary conditions to distinguish a sixth-magnitude star can be fulfilled as the mean value, maximum value, and standard deviation of gray scale (61, 130, and 21, respectively). When the sixth-magnitude star is in the field interfered with by stray light enormously, the maximum gray scale of the star point is 72. When the threshold offset is 20, the centroid of the star point can be detected according to Equation 2.Finally, the performance of the baffle in stray light suppression is verified through an outfield test. The accuracy of the star sensor without stray light is 2.13″ and 2.34″; that of the star sensor equipped with a regular baffle in the presence of stray light is 8.07″ and 7.66″; that of the star sensor equipped with the proposed baffle under the interference of stray light is 3.89″ and 4.01″. In short, the performance of the designed baffle is better in stray light suppression, which can control the deviation of accuracy within 2″.ConclusionsMechanism research, simulation analysis, and experimental testing verify that the above-mentioned design method for stray light suppression of star sensors is rational and feasible. On the basis of this method, the suppression function of baffles is improved further within limited overall dimensions. This approach enables the design of baffles applicable to different star sensors and extreme magnitudes. This design could be commonly used to obtain baffles with desired extinction ratios for meeting different needs of stray light suppression. Meanwhile, the matching of different adaptability in the optomechanical link is sufficiently considered. As a result, the phenomena of vignetting and stray light in the field of view do not occur. The design method in this paper regarding stray light suppression can provide reference for other designs of photoelectric sensors.
ObjectiveUnderwater wireless optical communication technology has higher speed and better security than underwater acoustic communication technology, and it has become a key tool to realize the communication between underwater environment monitoring, underwater wireless sensor networks, marine exploration, ships, and submarines. Since all vortex modes of vortex beams are orthogonal, the multiplexing of the vortex beams can further improve the communication capacity and spectral efficiency. Underwater vortex optical transmission can provide a new way to realize ultra-wideband and high-speed underwater wireless optical information transmission. In this paper, the transmission characteristics of the Laguerre-Gaussian (LG) vortex beam and its two superposition states in underwater turbulence are studied. The underwater turbulence caused by random diffusion of temperature and salinity is simulated by adding water with different temperature and salinity differences. The effects of turbulence generated by different temperature and salinity differences on the beam drift and scintillation index of the Gaussian beam, LG vortex beam, and the two superposition states are investigated. The research results can provide an important reference for the research on the transmission of vortex beams and their superposition states in underwater channels.MethodsIn marine media, refractive index fluctuations are controlled by temperature and salinity fluctuations. This paper uses a constant flow pump to add water with a certain temperature and salinity differences to simulate underwater turbulence and studies the influence of underwater turbulence on the light spot. In the experiment on underwater turbulence caused by the temperature difference, this paper first adds 20 ℃ clean water into the water tank, sets up four experimental groups with a temperature difference ranging from 0 to 15 ℃ (an interval of 5 ℃), then heats the clean water to the temperature required in the experiment, and finally pours the water with a specific temperature into the water tank through a water pump. In the experiment on underwater turbulence caused by salinity difference, the paper first adds 20 ℃ clear water into the water tank, sets up four experimental groups with a salinity difference ranging from 0 to 3‰ (an interval of 1‰), and then calculates the quality of edible salt used for the experimental salt water in the four groups. In addition, the paper adds edible salt to a certain amount of clear water to prepare salt water with a specific concentration and then pumps it into 20 ℃ clear water. After the hot water or salt water is added to the water tank through the water pump, the paper records the light intensity image data when the light spot received by the CCD begins to change. In order to reduce the experimental error, each group of experiments continuously measures and records 2000 data and is repeated for many times. The light intensity image received by CCD is grayed, and the gray value of each light intensity image is calculated to reflect the light power, so as to calculate the scintillation index.Results and DiscussionsGaussian beam, LG vortex beam with order 0 and topological charge 6, vortex light superposition state 1, and vortex light superposition state 2 all produce different distortions after turbulence caused by temperature and salinity differences. Compared with the other three beams, the LG vortex beam has a slight spot variation (Fig. 3). After the turbulence caused by temperature and salinity differences, the probability of the four beams appearing near the center of the calibration position decreases, while that appearing far away from the center of the calibration position increases. In the same simulated turbulent environment, the distribution degree of the centroid offset of the Gaussian beam from the center of the calibration position is the largest, while that of the LG vortex beam from the center of the calibration position is the smallest, with the centroid offset degree of the two vortex light superposition states falling in the middle (Fig. 4). When the temperature difference or salinity difference is constant, the beam drift variance of Gaussian beam is large, and that of LG vortex beam is small. In addition, the beam drift variance of vortex light superposition state 1 is smaller than that of vortex light superposition state 2 (Fig. 5). When the temperature difference is constant, the scintillation index of the Gaussian beam is larger, and that of the LG vortex beam is smaller. The scintillation index of vortex light superposition state 1 is smaller than that of vortex light superposition state 2. When the temperature difference is 0, 5, and 10 ℃, the scintillation index of the two vortex light superposition states is close to that of the LG vortex beam (Fig. 8). When the salinity difference is constant, the scintillation index of the Gaussian beam is larger, and that of the LG vortex beam is smaller. The scintillation index of vortex light superposition state 1 is smaller than that of vortex light superposition state 2. When the salinity difference is 0 and 1‰, the scintillation index of the two vortex light superposition states is close to that of the LG vortex beam (Fig. 10).ConclusionsIn this paper, the beam drift and scintillation index changes of Gaussian beam, LG vortex beam with order 0 and topological charge 6, vortex light superposition state 1, and vortex light superposition state 2 after underwater turbulence caused by different temperature and salinity differences are experimentally studied. The experimental results show that with the increase in temperature and salinity differences, the turbulence intensity increases, and the beam drift variance and scintillation index of the four beams rise. Compared with those of the other three beams, the beam drift variance and scintillation index of the LG vortex beam are smaller. When the temperature difference or salinity difference is the same, the beam drift variance and scintillation index of vortex light superposition state 1 are smaller than those of vortex light superposition state 2. When the temperature difference is 0 and 5 ℃, the beam drift variance of the two vortex light superposition states is close to that of the LG vortex beam. When the temperature difference is 0, 5, and 10 ℃, the scintillation index of the two vortex light superposition states is close to that of the LG vortex beam. When the salinity difference is 0 and 1‰, the scintillation index of the two vortex light superposition states is close to that of the LG vortex beam. According to the comprehensive analysis, under weak underwater turbulence, the use of vortex optical superposition state communication can improve communication capacity and spectral efficiency. Furthermore, under strong underwater turbulence, the LG vortex beam has better transmission quality.
SignificanceThe unique physical properties of terahertz (THz) waves, such as their low photon energy, characteristic spectra, and penetration, provide THz technology with essential application value in basic science and applied science. In biomedical science, traditional THz imaging techniques have been used to detect neural tissue responses, water content distribution in tissues, and bone tissue defects. However, the traditional THz imaging techniques can not satisfy the requirements of single-cell imaging and molecular-level pathological analysis as their spatial resolution is low. In material research, traditional THz imaging techniques have been employed to study the optoelectronic responses of two-dimensional materials, two-dimensional material devices, and quantum well devices. However, the traditional THz imaging techniques are insufficient in detecting the carrier's distribution and electron transportation since the wavelength range of the THz band is 30-3000 μm. Moreover, due to the diffraction limit, the resolution of the conventional THz imaging is on the millimeter scale (λ1THz=300 μm) and thus cannot meet the requirement of the rapid development of scientific research towards the nano-scale. Therefore, THz microscopy with high spatial and temporal resolutions needs to be developed as soon as possible to explore scientific issues at the micro- and nano-scale.Near-field THz imaging techniques are important methods to improve the spatial and temporal resolutions of THz imaging in experiments. The near-field coupling system that captures the information contained in evanescent waves can be used to create super-resolution images. The high-frequency signals in the evanescent waves can be used to reconstruct surface information, including surface structure, carrier concentration, and phase evaluation.ProgressAperture probes and scattering probes are the common techniques used in near-field THz imaging. The basic principle of near-field THz imaging with aperture probes is to create subwavelength THz radiation sources or subwavelength THz detectors with micropores. Physical apertures, dynamic apertures, and spoof surface plasmon polaritons are mature solutions for the fostering of near-field THz imaging systems with aperture probes (Figs. 2-7). The spatial resolution and the cut-off frequency are both related to the structure of the aperture probe and the diameter of the aperture. As the cut-off frequency and the coupling efficiency reach the limit, the imaging quality and the spatial resolution of the aperture probe cannot be further improved. Scattering probe microscopy requires a scanning tunnel microscope (STM) and an atomic force microscope (AFM) to provide near-field conditions for the tip-sample system (Figs. 8-12). The distance between the tip and the sample is much smaller than the wavelength of the THz signal. When the THz signal is incident on the tip and the sample, the polarization of the tip and the sample generates the near-field scattering signal. Information on the sample surface can be reconstructed as the tip scans the surface of the sample two-dimensionally.Conclusions and ProspectsThis paper summarizes the basic principle of near-field THz imaging and demonstrates the development history and technical routes of various near-field THz imaging techniques. It analyzes the characteristics of those near-field THz imaging techniques and discusses their temporal and spatial resolutions, spectral resolution, imaging quality, signal-to-noise ratio, and application scenarios. Finally, the paper suggests the future development of super-resolution THz imaging.
SignificanceBased on optical imaging and photoelectric detection, optical measurement systems in range, which include optical, mechanical, and electronic components, can be used as integrated equipment to measure and record the flight trajectory, attitude, infrared radiation characteristics, and visible light features of targets. Photoelectric measurement equipment, mainly represented by photoelectric theodolites, is the earliest and one of the most basic facilities applied in range for measurement. With the gradual expansion of the spatial area and the increase in the frequency of space activities in recent years, the contradiction between increasingly frequent missions and limited manpower is becoming more and more prominent. There are urgent requirements for measurement capability improvement of photoelectric measurement equipment in range. Under the premise of ensuring high-precision measurement and high-resolution imaging capability, the new generation of single-station measurement equipment prefers to possess the capabilities to acquire more information on target characteristics, adapt to compatible multiple platforms, and have stronger mobility.As one of the most important teams with a long history and strong capabilities in the development of photoelectric measurement equipment in range in China, the team of Precision Instrument and Equipment R&D Center, Changchun Institute of Optics, Fine Mechanics and Physics, Chinese Academy of Sciences has been committed to improving the comprehensive ability and efficiency of photoelectric equipment. Recently, its main research focuses on a number of key technologies, such as infrared radiation characteristics measurement, lightweight structure design, and integrated optical and radar measurement. The overall ability of photoelectric theodolites has been improved in terms of the expansion of the measurement band, measurement information acquisition, and multi-platform adaptability. This paper summarizes the current status and research progress of technologies related to photoelectric measurement equipment in range.ProgressThis paper summarizes the research progress of a number of key technologies related to photoelectric measurement equipment, such as infrared radiation characteristics measurement, lightweight structure design, and integrated optical and radar measurement, based on the relevant work of Precision Instrument and Equipment R&D Center, Changchun Institute of Optics, Fine Mechanics and Physics, Chinese Academy of Sciences. Firstly, an infrared radiation characteristics measurement technique is introduced that is different from the traditional image feature recognition. It includes five infrared radiometric calibration techniques (Fig. 2), atmospheric transmission correction, self-developed atmospheric parameter calculation software, and a new process to measure target infrared characteristics (Fig. 3). The current status of related research and the challenges faced by future development are summarized. Secondly, the lightweight structure design technology of photoelectric measurement equipment in range is described. Three lightweight structure design methods are introduced which are suitable for photoelectric measurement equipment in range, including the main reflector, namely the main component of the optical imaging system (Figs. 5 and 6), and mechanical structures such as support components (Figs. 7-13). In addition to considering the conventional mechanical properties of the equipment, it is also necessary to ensure minimal surface aberration from the optical design point of view. The dynamic properties of the equipment should be considered for the purpose of transportation. Finally, integrated optical and radar measurement techniques are discussed. Two optical and radar integration schemes of building block architecture (Fig. 15) and common aperture (Fig. 16) are summarized. The optical-radar integrated detection mechanism can obtain new data outputs, enhance the observation capability of ground-based photoelectric equipment, and achieve multiple sources of target information via fusion detection.Conclusions and ProspectsThe photoelectric measurement equipment in range uses optical imaging information to obtain flight information of the target. The target parameters can be further analyzed after error correction, space-time alignment, intersection calculation, and corresponding data processing. These are important procedures for the measurement and control systems of spacecraft launch and recovery and the detection of multiple types of military targets. The main development trends of current photoelectric measurement equipment include simplifying usage, enhancing flexibility, lowering the price-quality ratio of single-station equipment, and improving the techniques of infrared radiation characteristic measurement, lightweight structure design, and integrated optical and radar measurement.To meet the challenges of the complexity of measurement conditions and the diversity of measured targets, photoelectric measurement equipment needs to be able to achieve the diversification of information acquisition, the expansion of the measurement band, and multi-platform mobile station deployment while ensuring high-precision measurement and high-resolution imaging capability. Based on the existing demand for range measurement, boosting the development of the aforementioned technologies can promote the integrity, convenient operation, and reliable use of photoelectric measurement equipment in range. These factors are of great significance for enhancing the capability of photoelectric measurement equipment in range.
ObjectiveThe treatment of organic pollutants in surface water, drinking water, and wastewater is one of the urgent social problems to be solved in the development of human society. Three-dimensional excitation-emission matrix (3D-EEM) fluorescence spectroscopy technology has been widely used to detect fluorescence components in surface water, sewage, and other samples. There are a lot of interference noises and fluorescence overlap information in the original 3D-EEM data, so there is an urgent need for a fast and accurate method to extract and analyze the useful information in 3D-EEM spectra. At present, parallel factor analysis (PARAFAC) is commonly used to decompose the overlapping fluorescence signals in 3D-EEM, but the analysis process of this method is complex, and the data set is strict, which greatly limits the on-line monitoring and analysis of samples. In this study, according to the results of PARAFAC, we propose a convolutional fast classification and recognition network model, which can quickly obtain water sample types, mass concentration grades, and fluorescent component maps by using only two convolutional neural network (CNN) models. As a result, it provides effective technical means for rapid detection of scenes such as surface water, drinking water, wastewater monitoring, and so on.MethodsIn this study, a method of water sample classification and fluorescence component fitting based on MobileNetV2, VGG11 component fitting (CF-VGG11) CNN, and PARAFAC is proposed. The 3D-EEM data of four types of water samples including surface water (DB), treated industrial wastewater (FS), sewage treatment plant inlet and outlet water (WS), and rural drinking water (XCYY) are collected, and the multi-output classification model of different water samples and the prediction and fitting model of fluorescence component maps are established with the results of PARAFAC as labels. The prediction of types and components is completed in two steps. In the first step, the MobileNetV2 algorithm is used to predict and classify different water samples. The second step is to use the CF-VGG11 network to fit the fluorescence component map.Results and DiscussionsThe data sets of all kinds of water samples are analyzed by PARAFAC, and four fluorescence components are shown (Fig. 6). Then, the PARAFAC results are uploaded to the OpenFluor database to obtain possible substances of various types of fluorescence components in water samples (Table 2). The similarity comparison scores of all components are more than 95%. Combined with the PARAFAC results as network labels, the MobileNetV2 classification network and CF-VGG11 component fitting network obtain a classification accuracy of 95.83% and a component fitting accuracy of 98.11%, respectively (Table 3). In order to show that the trained model has good classification and fitting performance, a part of untrained 3D-EEM data is selected for the test, and the results show that MobileNetV2 and CF-VGG11 can classify and fit the 3D-EEM of water samples very well (Fig. 7), and MobileNetV2 and CF-VGG11 network models have certain advantages compared with PARAFAC in terms of time cost, data requirement, and analysis process (Table 4).ConclusionsIn this study, a fast CNN classification and recognition algorithm based on fluorescence spectrum is proposed to predict the types and mass concentrations of different water samples, as well as the overlapping fluorescence components in 3D-EEM. This study relies on PARAFAC for preliminary data preparation and MobileNetV2 network for classification of water sample types and mass concentration grades, which can achieve water pollution traceability and exceedance warning, and the CF-VGG11 network is used to fit the fluorescence component map of water samples. The results show that the fast classification and identification network model based on the results of PARAFAC can quickly predict the types and mass concentration grades of water samples and fit their specific fluorescence components by inputting 3D-EEM data of a single water sample, and there is no need to repeat the complex PARAFAC. Therefore, this study provides certain theoretical support for detecting water pollution by three-dimensional fluorescence spectrometry and is of a certain practical significance.