


Please enter the answer below before you can view the full text.
6+4=

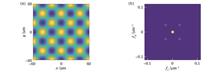
ObjectiveThe Talbot effect has been studied intensively in optics, acoustics, electron microscopy, X-ray, and Bose-Einstein condensates. There are numerous important applications of the Talbot self-imaging phenomenon in modern optics, such as in optical measurement, array illumination, lithography, color digital holography, and X-ray imaging technology. Uniaxial crystal is a typical kind of anisotropic media which has been widely used in different optical devices, so the propagation of light beams in uniaxial crystals is also an important topic in the field of optics and optoelectronics. However, no research has studied the behavior of periodic light fields in uniaxial crystals, especially the Talbot effect in uniaxial crystals. Therefore, in this work, we theoretically investigate the Talbot effect in uniaxial crystals orthogonal to the optical axis to prove that the Talbot self-imaging phenomenon can also be observed in anisotropic media. Our results can extend the studies of the Talbot effect to the field of anisotropic media and may improve our understanding of the transmission properties of periodic light fields.MethodsBased on the beam transmission theory in uniaxial crystals, we successfully derive theoretical formulas to investigate the Talbot effect due to the propagation of the two-dimensional (2D) orthogonal periodic light field along the direction perpendicular to the optical axis of the uniaxial crystal (z-axis) when the optical axis of the uniaxial crystal is along the x-axis. When a 2D periodic object is illuminated by an x-polarized coherent uniform beam, the propagation is described by anisotropic diffraction. With the help of the Fourier transform and angular spectrum representation, we can derive the self-imaging conditions of the Talbot effect and the expression of the conventional Talbot distances. We have also performed numerical simulations to observe the anisotropic propagation of two special 2D orthogonal periodic optical fields (2D sinusoidal grating and 2D checker grating) in the rutile crystal. In virtue of the structures of these periodic optical fields, the Talbot self-imaging phenomenon can be observed in shorter propagation distances. The Talbot images obtained by these two kinds of light fields in the rutile crystal are presented and analyzed.Results and DiscussionsWe find the self-imaging conditions of the Talbot effect. The expression of the conventional Talbot distances depends on the ratio of the ordinary refractive index to the extraordinary refractive index in the uniaxial crystal (no/ne) and the ratio of the period of the x direction to the period of the y direction in the 2D periodic object (px/py), as expressed by Eqs. (13) and (14). We have performed numerical simulations to observe the Talbot effect of the 2D sinusoidal grating and the 2D checker grating due to the anisotropic diffraction in the uniaxial crystal. In both cases, the Talbot images which are the same as their original gratings can be generated at reduced Talbot distances [Fig. 2 (a) and Fig. 5 (a)], and the complementary images of their original gratings can be generated at the reduced half-Talbot distance [Fig. 2(b) and Fig. 5(b)]. The Talbot sub-images with a half shift in space, whose intensity periods are halved from that of their original gratings and phase periods are the same as the period of the original gratings, are generated at the reduced quarter-Talbot distance and the reduced three-quarter-Talbot distance, as shown in Figs. 2(c)-(f) and Figs. 5(c)-(f). For the case of the 2D sinusoidal grating propagating along the z-axis (perpendicular to the optical axis of the uniaxial crystal), we have plotted the contrast variation of the intensity pattern and the phase contrast in a reduced Talbot distance (Fig. 3). The light intensity reaches its maximum value at the reduced Talbot distance and the reduced half-Talbot distance. At the reduced quarter-Talbot distance and the reduced three-quarter-Talbot distance, the light intensity reaches its minimum value. For the phase contrast, the maximum values are found at the reduced quarter-Talbot distance and the reduced three-quarter-Talbot distance.ConclusionsBased on the paraxial theory of light propagation in uniaxial crystals, we suppose that the optical axis is along the x-axis, and the propagation is along the z-axis. Furthermore, we have theoretically investigated the Talbot self-imaging phenomenon. When a 2D orthogonal periodic object is illuminated by the x-polarized coherent uniform beam, the anisotropic diffraction leads to the self-imaging conditions of the Talbot effect depending on no/ne and px/py. If the 2D orthogonal periodic optical object meets certain conditions, the Talbot images can be generated in shorter propagation distances, which means that the Talbot effect can be observed at reduced Talbot distances. Finally, for an incident light field linearly polarized at an arbitrary direction, the Talbot distance of the x-polarized component caused by the anisotropic diffraction does not equal that of the y-polarized component caused by the isotropic diffraction. Therefore, the repetition of the periodic light field can only occur at positions corresponding to the common multiples of these two distances. In other words, the Talbot distance corresponding to the arbitrarily linearly polarized case should be increased.
Results and Discussions By comparing accuracy, precision, recall, and other parameters of test set (Figs. 9-11), it is found that the convolution operator and LSTM have significantly improved the performance of ANN. In specific event recognition, LSTM-CNN is always in the best state. According to the comparison of the validation set (Table 2, Fig. 12, and Fig. 13), the generalization and classification accuracy of LSTM-CNN are proved. For instance, in the recognition of excavation and walking signals, LSTM-CNN shows significant advantages, and the precision and recall rates exceed CNN by 10% to 15%. By comparing LSTM-CNN with four machine learning algorithms including SVM, KNN, decision tree, and random forest (Table 3, Fig. 14, and Fig. 15), it is proved that deep learning is effective in multi-classification problems with large batches of samples and with great superiority in generalization and classification accuracy. However, in the recognition of noise, SVM, decision tree, and random forest all achieve precision and recall of 100%. Therefore, the machine learning algorithms can be designed as a front-end procession mechanism of the neural network, and the non-threatening signals can be eliminated by taking advantage of its short response time and small data processing volume, so as to improve the efficiency of pattern recognition.ObjectiveWith the advantages of long monitoring range, excellent anti-interference ability, accurate event location, and mature measurement principle, phase sensitive optical time domain reflectometer (φ-OTDR) has become a non-destructive detection method that has emerged in recent years and is widely used in pipeline safety maintenance, pig positioning and tracking, intrusion warning, and other fields. Threat warning and pattern recognition are the two main tasks of optical fiber sensing. On the one hand, it needs to quickly respond to possible threat events. On the other hand, countermeasures for different types of threats should be different. Therefore, it is necessary to identify event types. To simulate common threat events in engineering, we apply a self-developed φ-OTDR integrated chassis to collect four types of excitation signals including background noise, excavation, motor vibration, and walking. The established goal of pattern recognition is accomplished by using neural networks and machine learning classifiers, respectively. In addition, deep learning and machine learning have different characteristics in pattern recognition. Deep learning requires multiple rounds of iterative learning on a large batch of samples and converges to an optimal state through error back-propagation and parameter update. In contrast, machine learning has the advantages of fewer training samples, fast response time, and short training period, but it is highly dependent on the effectiveness of feature extraction. Therefore, the performance difference between the two kinds of classifiers is also one of the focuses for comparison in this paper.MethodsWe employed a short-time Fourier transform (STFT) to extract the time-frequency domain features of the signal while utilizing the long short-term memory network (LSTM) to extract the time-series features. On this basis, a one-dimensional convolution operator was employed to extract contour features, and a two-dimensional convolution operator was used to extract spatial features. Usually, the training period of a recurrent neural network (RNN) is long, so the LSTM needed to be trained separately to determine the optimal model parameters, and thus the LSTM parameters were directly called in the subsequent classifier training. With the comparison of the accuracy, precision, recall, and other evaluation indicators among an artificial neural network (ANN), traditional convolutional neural network (CNN), and LSTM-CNN (Table 1), the positive improvement of LSTM and CNN for classification performance was illustrated. The same training set and validation set were used to compare LSTM-CNN with four machine learning algorithms (Table 3), including support vector machine (SVM), K-nearest neighbor (KNN), decision tree, and random forest, and the superiority of deep learning compared with machine learning was analyzed in terms of generalization and classification accuracy. The time domain features were extracted by empirical mode decomposition (EMD), and the frequency domain energy features of the signal were extracted by discrete wavelet transform (DWT). The energy of decomposition curves of each layer of EMD and DWT was summed and normalized to construct eigenvectors, in which EMD and DWT were decomposed into six layers, respectively, and thus the eigenvectors contained 12 dimensions in total.ConclusionsAiming at the problem of φ-OTDR pattern recognition, we propose a neural network with LSTM and CNN as the main framework in this paper. With the time domain curve as the network input, we extract its time-series features through LSTM and then its contour and energy features via CNN and STFT, respectively. LSTM-CNN shows different degrees of superiority compared with ANN and traditional CNN. The accuracy of LSTM-CNN on the training set and validation set is 97.8% and 94.6%, respectively, and the accuracy of the validation sample set is 94.43%, which accomplishes the established goal of φ-OTDR pattern recognition. To make up for the drawback of the RNN in data processing speed, we utilize TensorFlow2.4GPU and CUDA11.1 to improve the data processing capability of LSTM-CNN, which provides a proof of concept and demonstration examples for actual engineering product development.
ObjectiveOptical fiber sensor technology has been extensively applied in gas pressure sensing in the field of industrial and environmental safety monitoring on account of its high sensitivity, compact structure, and immunity to electromagnetic interference. Compared with long-period fiber gratings and anti-resonance waveguides, optical fiber sensors based on the vernier effect generally have greater advantages in terms of sensitivity. The vernier effect is an effective method for amplifying interferometer sensitivity, which is well-known in optical fiber sensing. However, as the harmonic order j increases, vernier spectra deteriorate, namely that the contrast of the external envelope decreases, and the inner envelope disappears. The objective of this work is to generalize the higher-order vernier effect and obtain high sensitivity through experimental exploration and theoretical analysis. In addition, we intend to explore the reasons for the decrease in external envelope contrast and the loss of internal envelopes that affect spectral contrast. We expect to contribute to the extensive application of the high-order harmonic vernier effect and high-sensitivity sensor design.MethodsFirstly, we theoretically simulate the higher-order vernier spectrum for j=1, 2, 3, 4. Then, we fabricate four parallel structures of the Fabry-Pérot interferometers experimentally and study the corresponding vernier spectra. After that, we investigate the effect of the difference in light intensity between the sensing cavity and the reference cavity on the vernier spectrum by changing the light intensity difference between the two cavities. In addition, we analyze various parameters that affect the vernier magnification factor and design a highly sensitive fiber-based gas pressure sensor.Results and DiscussionsOn the basis of a parallel Fabry-Pérot interferometer, this paper compares the theoretical simulations (Fig. 2) and the experimental results (Fig. 3) of vernier spectra for j=1, 2, 3, 4. The comparison shows that they are consistent, which indicates the vernier effect is valid in the experiment. After that, we simulate the spectra corresponding to different light intensities of the sensing cavity and the reference cavity. It is found that with the increase in the light intensity difference between the two cavities, the contrast of the external envelope decreases, and the internal envelope disappears (Fig. 5). Then, we fundamentally explain the deterioration of the vernier spectrum when the higher-order harmonic vernier effect is applied in the experiment (Fig. 6). In addition, the factors affecting the vernier magnification are discussed from the aspects of a higher value of j and a lower detuning ratio. After that, we put forward reasonable suggestions for obtaining higher magnification when applying the vernier effect in gas pressure sensing. Furthermore, a sample corresponding to the first-order harmonic vernier effect is produced for the gas pressure test. At room temperature, it enjoys gas pressure sensitivity of 152 pm/kPa, a corresponding magnification factor of 35.3, and linearity of 99% in the range of 10-190 kPa (Fig. 4).ConclusionsThis paper studies the higher-order harmonic vernier effect and proposes a method to improve the interference fringe contrast for the external vernier envelope, which is verified by experiments. The reason for the reduction in the vernier spectrum contrast is the reduction in the imbalance of light intensity between the sensing and the reference cavities. The application demonstrates that with the increase in the light intensity difference between the two cavities, the vernier spectrum becomes more susceptible to the quality or noise of the light source. This leads to weaker visibility of the envelope for higher harmonic orders. In addition, we analyze various experimental parameters so as to obtain high sensitivity and demonstrate a parallel Fabry-Pérot interferometer with gas pressure sensitivity of 152 pm/kPa, linearity of 99%, and a magnification factor of 35.3 in the range of 10-190 kPa.
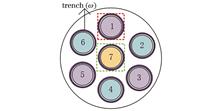
ObjectiveIn recent years, the rapid increase in network traffic requires more network transmission capacity. Therefore, an elastic optical network based on orthogonal frequency division multiplexing technology is proposed. Its characteristic is to allocate spectrum resources according to the connection requests. By improving the utilization efficiency of spectrum resources in the frequency domain, the network transmission capacity can be expanded. However, restricted by the Shannon limit, the traditional single-core single-mode fiber is difficult to further expand the transmission capacity in the network. Therefore, on the basis of the proposed multi-core optical fiber (MCF), space division multiplexing elastic optical networks (SDM-EONs) are considered as one of the most potential solutions to break through the network capacity bottleneck. At the same time, the applications in the network have diversified demand characteristics, but it is difficult for physical facility providers to flexibly configure the network according to the specific needs of the applications. In recent years, the increasingly developed network virtualization technology has solved the problem of network rigidity and formed a diversified network structure. The combination of network virtualization technology and SDM-EONs can improve the utilization rate of the underlying physical resources, but it will make the virtual network mapping more complex. Furthermore, virtual network mapping inevitably needs to meet more constraints. There are also physical layer constraints of inter-core crosstalk (XT) in SDM-EONs. When the overlapping spectral segments of adjacent cores are occupied by different optical paths at the same time, the transmission quality of optical paths will be degraded, and high-quality transmission of normal signals cannot be realized. Therefore, this paper focuses on SDM-EONs based on MCF to solve the virtual network mapping problem of crosstalk perception.MethodsIn this paper, the crosstalk impact of the occupied spectrum resources on the adjacent core spectrum is considered, and a crosstalk impact assessment method is designed. Then a virtual network mapping algorithm for crosstalk awareness (CA-VNM) in SDM-EONs is proposed. The virtual network mapping method adopted by the algorithm is two-stage mapping. The first stage is virtual node mapping. In order to enhance the correlation between virtual nodes and virtual links, virtual nodes adopt the virtual node proximity ranking method, and physical nodes adopt the node degree classification method, so as to improve the virtual network acceptance rate and provide the underlying physical resources for the subsequent virtual services with greater demand. The priority evaluation method of physical nodes considers the XT on the adjacent links of nodes to improve the utilization rate of the underlying physical resources and balance the XT. The second stage is virtual link mapping, and the virtual link bandwidth is prioritized. Based on the prioritization, the K-shortest path method is used to find the K optical paths with the least hops, and the physical link priority method is used to rank the candidate physical links. Then the core load balancing and spectrum partition allocation methods are designed to balance the traffic of each core and reduce the XT.Results and DiscussionsThe algorithm proposed in this paper optimizes the network performance. The request acceptance rate of CA-CVM achieves the best effect in the comparison algorithms, and the highest request acceptance rate of the virtual network is increased by 11% (Fig. 6). CA-CVM obtains the best spectrum utilization performance in the NSFNET network, and the spectrum utilization is increased by 17.1% (Fig. 7). The XT improvement rate gradually decreases with the increase in the load because the idle resources in the network gradually decrease, and other methods cannot reduce the XT. The XT improvement rate of CA-CVM is the best. At 100, 200, 300, 400, 500, 600, 700, 800, and 900 Erlang, the XT improvement rates are 67.7%, 54.6%, 46.3%, 39.3%, 32.8%, 20.5%, 11.8%, 9.1%, and 7.0%, respectively (Fig. 8).ConclusionsIn this paper, a virtual network mapping algorithm for crosstalk awareness in SDM-EONs is proposed, and the constraints of virtual network mapping in SDM-EONs are considered. When the priority of virtual nodes is evaluated, the proximity between virtual nodes is considered, and a virtual node proximity ranking method is proposed. When candidate physical nodes are selected, the physical node degree is considered so that more underlying physical resources can be provided to the virtual request service with greater demand. A crosstalk impact assessment method is proposed to evaluate the weight of physical nodes and balance the crosstalk between cores. In addition, the core is selected according to the bandwidth required by the virtual link to balance the core load. Finally, the spectrum is divided into several regions, and the first hit and the last hit are used alternately when the spectrum is allocated to reduce the influence of XT. The simulation results show that when the network load is small, the acceptance rate of the virtual network is optimized by 11%, the spectrum utilization rate is increased by 17.1%, and the XT improvement rate can reach 67.7%. In view of this, the proposed algorithm can effectively improve the acceptance rate of the virtual network and the XT in the SDM-EONs and optimize the mapping performance of the virtual network.
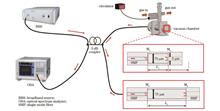
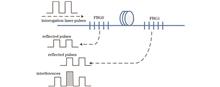
ObjectiveThe in-line interferometric fiber Bragg grating (FGB) hydrophone array contains only FBGs at the wet end. The dramatically reduced number of undersea components and fusion points leads to high reliability, lightweight, and miniaturization, which makes the FBG hydrophone a promising candidate for future large-scale and highly-integrated applications. However, the special undersea structure brings technical challenges in solving the problems of polarization-induced signal fading and random phase fading, and the bidirectional reflections of the FBG may increase the channel crosstalk. Although the in-line interferometric FGB hydrophone array is considered to be the most promising next-generation hydrophone, the above-mentioned technical challenges must be solved before its application in harsh marine environments. Hence, this paper presents an in-line interferometric FGB hydrophone array to fully explore the system performance, providing experimental results before practical applications.MethodsThe presented in-line interferometric FGB hydrophone array contains 64 sensing channels. A simple undersea design structure with only 80 FBGs is adopted to form 8SDM (space division multiplexing)×2WDM (wavelength division multiplexing)×8TDM (time division multiplexing) multiplexing hydrophone channels. FBGs with reflectivity less than 1% are fabricated to suppress the multi-reflection-induced channel crosstalk. The undersea hydrophone unit has a mandrel structure with dimension of ?18 mm×50 mm, and the array has a diameter of 32 mm. A hybrid processing method of the phase generated carrier (PGC) and polarization switching (PS) is used to solve the polarization-induced signal fading and random phase fading problems simultaneously, and the PGC modulation frequency and PS modulation frequency are 12.5 kHz and 80 kHz, respectively.Results and DiscussionsThe measured acoustic sensitivity is about (-131.15±1.15) dB, and the frequency response from 20 Hz to 2 kHz is presented with a fluctuation of less than ±1.5 dB. The background phase noise is -95 dB/Hz@1 kHz, which indicates a low equivalent noise level of 36 dB@1 kHz. The SDM, WDM, and TDM channel crosstalks are less than -50 dB, -40 dB, and -40 dB, respectively.ConclusionsWe present an in-line interferometric FGB hydrophone array that contains only 80 FBGs at the wet end. The effectiveness of the PGC-PS hybrid processing method and low reflectivity design is validated, and they can achieve satisfactory system performance. The research results show that the in-line interferometric FGB hydrophone array is suitable for practical applications.
ObjectiveMid-span optical phase conjugation (OPC) is a viable option for nonlinearity compensation in high-speed fiber-optic transmission systems. However, propagation symmetry is a key factor in the good performance of OPC. In other words, nonlinearity compensation is effective when the transmission link is symmetric with respect to OPC in terms of optical power and accumulated dispersion, which is the metric of OPC effectiveness, called the power versus accumulated dispersion diagram (PADD). Due to fiber loss, symmetric PADD cannot be obtained in common transmission systems based on the erbium-doped fiber amplifier (EDFA). Recently, a novel approach to satisfying the nonlinearity compensation criteria has been proposed, where symmetric PADD is obtained through optimized dispersion management with the inverse dispersion fiber (IDF). However, the approach relies on the availability of IDF which does exist, and IDF is not mass-produced. This paper numerically investigates the possibility of using the dispersion-compensating fiber (DCF) instead of IDF for link construction, which allows for a relatively simple modification and upgrades of installed fiber-optic links.MethodsNumerical simulations are performed by the use of the split-step Fourier method, and pulse evolution in the fibers is described by the generalized nonlinear Schr?dinger equation, which includes intrachannel nonlinearities such as self-phase modulation (SPM), intrachannel cross-phase modulation (IXPM), and intrachannel four-wave mixing (IFWM). The performance of two links (for simplicity, called IDF-managed link and DCF-managed link, as shown in Fig. 1) is compared with respect to the IFWM-induced peak intensity fluctuation at the "1" bits and ghost pulse generation at the "0" bits. The links are made of three types of fibers with parameters near 1.55 μm, as listed in Table 1. In the IDF-managed link, the standard single-mode fiber (SSMF) and the IDF have the same length, same loss, and same nonlinearity except for the reversed group velocity dispersion (GVD). Whereas in the DCF-managed link, the loss and nonlinearity of the DCF are three times as large as those of the SSMF, and the GVD of the DCF is eight times as large as that of the SSMF. The span length (amplifier spacing) is fixed at 80 km for each link. Fiber loss is compensated by EDFA, and GVD is compensated by the IDF or DCF. The input is assumed to be 4 bit with a bit pattern of 1110. The "1" bits have the same initial width and initial amplitude. The "0" bit has much smaller amplitude than that of the "1" bits. All bits have the same initial width TFWHM=3 ps, with a bit separation of 12.5 ps, representing a bit rate of 80 Gbit/s. The OPC is modeled by ideal conjugation of the complex envelope of the pulse as u(ξ,τ)→u*(ξ,τ), without any penalties associated with the process.Results and DiscussionsDifferent transmission distances, i.e., two-span (N=1), six-span (N=3), and ten-span (N=5) are considered, and the compensation results of the two links are compared for each distance. In all cases, the same input is assumed. Figs. 2(a)-(c) compare the output pulse shapes, and Figs. 2(d)-(f) compare the spectra. It can be seen that in all cases, the IDF-managed link outperforms the DCF-managed link. As the transmission distance increases, the residual nonlinearity of the latter accumulates, and the nonlinear distortion is enlarged. For a quantitative comparison, two parameters of the output pulses are defined and calculated, i.e., the average peak intensity fluctuation (ΔPaver) of the "1" bits and the relative peak intensity of the ghost pulse that is defined as the ratio of the peak intensity of the output ghost pulse to that of the input "0" bit. The results are compared in Fig. 3, where input energy is used, which is the total energy of the input 4 bit. In all cases, the input pulse width and bit slot are identical to those of the simulation in Fig. 2 except that the input energy varies with the amplitude of the input. For two-span transmission, there is little difference between the two links when the input energy is small. The difference is more and more significant as the input energy or the span number grows, and the performance of the DCF-managed link deteriorates rapidly relative to that of the IDF-managed link. The performance of the DCF-managed link could be improved by launching different energies into the spans before and after the OPC. The energy into the SSMF before OPC should be higher than that into the DCF after OPC because SSMF is less nonlinear than DCF. A variable gain amplifier (VGA) is inserted at the input end of the spans before OPC while a variable optical attenuator (VOA) is inserted at the input end of the spans after OPC, as shown in Fig. 4, where the magnification of the VGA equals the attenuation of the VOA. The energy into the spans before and after the OPC is denoted as E1 and E2, respectively, where E1 or E2 is calculated by the summation of the intensity values of the pulse shape. For a fixed value of E1+E2, the ratio E1/E2 is optimized to minimize the parameter ΔPaver, which results in an optimum E1/E2 for optimum nonlinearity compensation. The results are shown in Fig. 5 for the three values of E1+E2, where all calculations are obtained through six-span transmission (N=3). It can be seen that when E1/E2 increases to a certain value, a minimum ΔPaver is obtained for a given value of E1+E2, which indicates that an optimum counterbalance is achieved. Moreover, the optimum E1/E2 increases with E1+E2. Further simulations reveal that for a fixed value of E1+E2, the optimum E1/E2 is independent of the span number N. For example, Fig. 6 gives a comparison of the transmission results with and without nonlinearity counterbalance. The DCF-managed output is significantly improved by optimum nonlinearity counterbalance. Compared with the IDF-managed output, the DCF-managed output with optimum counterbalance is even closer to the input. This is reasonable since the pulse shapes depicted here are instantaneous power curves, and IFWM-induced pulse distortion occurs in the spans before the OPC while the bit-by-bit symmetry in the pulse shape about the OPC is not fulfilled. Thus, without a nonlinearity counterbalance, the OPC effectiveness would be decreased even with a perfect PADD as in the case of the IDF-managed link.ConclusionsWe have numerically investigated intrachannel nonlinearity compensation in dispersion-managed links with mid-span OPC. The compensation effectiveness of two different links is compared with respect to IFWM-induced intensity fluctuation of the "1" bits and the generation of the ghost pulse. Results show that by asymmetric energy transmission, the nonlinearity mismatch of the DCF-managed link can be counterbalanced, and the performance can be significantly improved. For a given input energy, there exists an optimum ratio of the energies into the spans before and after the OPC, at which the compensation effectiveness of the DCF-managed link is very close to that of the IDF-managed link. The optimum energy ratio increases with the input energy but is independent of the span number of the link.
ObjectiveIn the field of fiber-optic communication, further optical transmission and better communication quality presuppose the modulation of the optical signal, that is, to load the information to be transmitted into the optical signal by modulation for long-distance transmission. Therefore, a variety of modulation methods have been developed, such as differential phase-shift keying (DPSK) and on-off keying (OOK). With lower requirements on the optical signal-to-noise ratio, DPSK modulation shows superb performance in fiber-optic communication systems and has also become a research hotspot for fiber-optic communication technologies in recent years. DPSK signals are generally demodulated by a Mach-Zehnder interferometer. However, demodulation systems based on the traditional Mach-Zehnder interferometer are strict with the light source, modulation code rate, and arm length difference. Such a system requires a narrow-linewidth light source and is easily affected by temperature. To solve the above problems, this paper proposes a DPSK demodulation system based on a novel Mach-Zehnder interference structure. Compared with the traditional demodulation system, the novel demodulation system has higher robustness to arm length difference mismatch, better temperature stability, and lower requirements on the coherence properties of the light source, enabling wide-linewidth light sources to be applicable to DPSK demodulation systems as well.MethodsThis paper adopts the research method of combining simulation with experiment. Specifically, the transmission process of an optical signal in the system is derived mathematically, and the demodulation principle of the novel Mach-Zehnder interference structure is thereby described in detail. Then, a demodulation system based on the novel Mach-Zehnder interference structure is built in simulation software to verify whether the simulation results are consistent with the theoretical derivation results and prove the correctness of the system principle. Furthermore, the Q value of the system is calculated, and the novel demodulation system is compared with the demodulation system based on the traditional interferometer in terms of the light source, arm length difference mismatch, and temperature. The simulation results show that the novel demodulation system provides better performance. Finally, the feasibility of the proposed system is verified by building an experimental system to determine whether the system can achieve DPSK modulation and demodulation, and the temperature stability of the system is tested.Results and DiscussionsThe novel demodulation system shows excellent performance in temperature, and its temperature stability is better than that of the traditional demodulation system (Fig. 5). In terms of arm length difference mismatch and the code rate, the mismatch ratio the novel demodulation system allows is higher than 20%, while that of the traditional demodulation system is required to be within 10%. This result proves that the novel demodulation system is more robust (Fig. 4). The novel demodulation system can use a wide-linewidth light source (Fig. 8), while the traditional counterpart can only use a narrow-linewidth light source. This contrast represents a significant advantage of the novel demodulation system. It is also the main purpose of the novel demodulation system proposed in this paper and is used to reduce the system's requirements on the coherence properties of the light source. The experimental results show that the system can achieve DPSK demodulation of optical signals with a wide-linewidth light source (Fig. 9). Moreover, the Q value of the proposed system is above 10 (Table 1) when the ambient temperature is within 0-70 ℃, indicating that the system is feasible.ConclusionsThis paper proposes a DPSK demodulation system based on a novel Mach-Zehnder interference structure and presents a mathematical model of optical signal transmission in the system. To prove the correctness of the system principle and the mathematical model, the paper combines simulation with experiments. The simulation results show that the bit error rate of the system is smaller than 2.38×10-154 and thus meets the requirement that the bit error rate of a communication system should be smaller than 10-12. In addition, the DPSK modulation and demodulation experiment proves that the proposed system is feasible, and the experimental results show that the system successfully modulates and demodulates the m sequence. The temperature experiment proves that the Q value of the system is above 10 when the ambient temperature is within 0-70 ℃, indicating reliable temperature stability of the system. Finally, the light source used in the experiment is a wide-linewidth light source, and its coherence length is smaller than the arm length difference, which proves that the novel demodulation system can reduce the system's requirement on light source linewidth. In summary, the novel demodulation system has higher mismatch robustness, better temperature stability, and lower requirements on the coherence properties of the light source.
ObjectiveFringe projection profilometry is a representative method for optical three-dimensional measurement and is widely applied in intelligent manufacturing, virtual reality, cultural heritage protection, biomedicine, and industrial inspection. Fringe projection profilometry mainly includes Moiré profilometry, Fourier transform profilometry, and phase measurement profilometry. Fourier transform profilometry can recover the three-dimensional surface information of the measured object through phase calculation, phase unwrapping, and phase-height mapping. It has the advantages of less data processing and a fast measurement speed, thus being widely used in three-dimensional reconstruction. The phase value obtained by phase calculation will be wrapped at (-π, π]. It is necessary to convert the wrapped phase into a continuous phase through phase unwrapping, and then the height distribution of the measured object can be determined by phase-height mapping. Therefore, the quality of phase unwrapping directly influences the reconstructed accuracy of the measured object. Among many phase unwrapping algorithms, Goldstein branch-cut algorithm is widely used because of its noise-immune ability and high efficiency. After identifying all residues in the wrapped phase map, the Goldstein branch-cut algorithm generates branch cuts by connecting the residues to optimize the phase unwrapping path. The shorter the total length of the branch cuts is, the better the result of phase unwrapping will be. However, the branch cuts constructed by Goldstein branch-cut algorithm cannot ensure the shortest total length and are easy to close, which causes incorrect phase unwrapping in some regions and finally affects the reconstructed accuracy. Therefore, Fourier transform profilometry based on an improved Goldstein branch-cut algorithm is proposed to ensure the accuracy of three-dimensional measurement.MethodsThe computer-generated grating fringes are projected onto the surface of the measured object by digital light processing, and the grating fringes are modulated by the height of the measured object. The deformed fringes containing the height information of the measured object are collected by a charge-coupled device, and the wrapped phase map is obtained through the operations of Fourier transform, fundamental frequency filtering, and inverse Fourier transform. First, all positive and negative residues are identified in the wrapped phase map. Then, the problem of constructing branch cuts with the shortest total length is transformed to a maximum weighted matching problem by constructing a weighted bipartite graph. The Kuhn-Munkres algorithm is applied to solve the maximum weighted matching problem, and the branch cuts with the shortest total length are obtained. Finally, the path that avoids branch cuts is selected for phase unwrapping. Pixels on the branch cuts can be unwrapped according to the unwrapped pixels around the branch cuts. The surface information of the measured object is recovered by phase-height mapping. This paper compares the total length of the branch cuts, the root mean square error, and the execution time of generating branch cuts between the proposed method and the Goldstein branch-cut algorithm. The root mean square error of the proposed method under different noises is studied to evaluate its noise-immune ability. In addition, three-dimensional reconstruction experiments are carried out on complex objects, and the reconstruction results show that the proposed method is suitable for the three-dimensional measurement of complex objects.Results and DiscussionsThe Goldstein branch-cut algorithm is a powerful anti-noise method, and the quality of phase unwrapping depends on the generated branch cuts. Shorter branch cuts result in a better phase unwrapping result. The simulation results show that the proposed method constructs branch cuts with a shorter total length and takes less time for generating branch cuts than the Goldstein branch-cut algorithm, bringing a lower root mean square error (Table 1). In addition, the research on the root mean square errors of the proposed method and the Goldstein branch-cut algorithm under different noises shows that the former has a stronger anti-noise ability (Table 2). In the reconstruction experiment of complex objects, the results reconstructed by the Goldstein branch-cut algorithm are poor in some areas, while the proposed method can ensure the reconstructed accuracy of complex objects (Fig. 13).ConclusionsThis paper expounds the basic principles of Fourier transform profilometry and the Goldstein branch-cut algorithm. The Goldstein branch-cut algorithm is a local nearest neighbor algorithm that may not generate the shortest branch cuts. Moreover, branch cuts are easy to close, which makes phase unwrapping incorrect in some regions and increases the reconstructed error. To ensure the reconstructed accuracy of the measured object, this paper proposes Fourier transform profilometry based on an improved Goldstein branch-cut algorithm. The simulation results show that compared with the Goldstein branch-cut algorithm, the proposed method reduces the total length of branch cuts, has a stronger noise-immune ability, and can effectively improve reconstructed accuracy. Experimental results indicate that the proposed method is suitable for the three-dimensional measurement of complex objects.
ObjectiveThe microfluidic chip is composed of a micro-nano-scale channel network. The microfluidic effect of biological, chemical, medical, and other samples is generated by the microchannel which carries the function of the "container" in the reaction. The dimensional accuracy such as the structure, shape, and size of the microchannel will directly impact the sample type, sample throughput, and sample injection rate in the microfluidic system. Therefore, it is of great significance to detect the three-dimensional topography of microfluidic chip channels. In recent years, scholars have continuously introduced new imaging detection methods for microfluidic chips, but most of the research focuses on the surface morphology of the reaction solution in the microchannel of the microfluidic chip or samples to be tested. There is little literature introduction on the measurement of microchannels. In this paper, digital holographic microscopic detection technology is combined with microfluidic technology. It provides a new imaging detection method for the microfluidic channel and has important application value for improving the quality of the chip.MethodsThis paper proposes a method for measuring the microchannels of microfluidic chips based on dual-wavelength image-plane digital holographic microscopy to meet the requirements of three-dimensional topography visualization of microfluidic chip channels. A reflective off-axis dual-wavelength image-plane digital holographic microscopic measurement system is built. Firstly, the lateral and vertical resolution and the magnification of the system are calibrated by the resolution target and standard sample. The results show that the dual-wavelength holographic microscope system has good accuracy and feasibility in the measurement of lateral and vertical depth. Then the straight channel of the polydimethylsiloxane (PDMS) microfluidic chip, the circular liquid phase chamber with vertical height transition, and the microchannel of the silicon-based microfluidic chip are measured. The phase distribution of the measurement surface is quantitatively recovered by combining the two-step phase division method and the 2π compensation method.Results and DiscussionsFirstly, a reflective off-axis dual-wavelength image-plane digital holographic microscopy experimental system is built (Fig. 1). To analyze and verify the accuracy and feasibility of the measurement system, this study adopts the 1951USAF resolution target, one-dimensional grid standard template, and segment difference standard film to calibrate the system respectively. The lateral resolution of this digital holographic microscope system can reach 2.2 μm (Fig. 4), and the actual magnification of the system is 13.5 times (Fig. 2). At the same time, the 20.79 μm segment difference standard film is measured, and the longitudinal depth is 19.9 μm with a relative error of 4.2% (Fig. 5). In addition, the three-dimensional morphology of the straight channel of the PDMS microfluidic chip, the circular liquid phase chamber with vertical height transition, and the microchannel of the silicon-based microfluidic chip are reproduced. Microchannels with different structures are obtained. The depth and the width of the straight channel and the circular chamber microchannel are 48.6 μm & 75.8 μm (Fig.9) and 48.5 μm & 76.6 μm (Fig. 10), respectively; the channel depth of silicon-based microfluidic chip is 61.6 μm (Fig. 11). Finally, the experimental results are well consistent with the white-light interferometry results (Table 1 & Table 2), which illustrates the reliability and accuracy of the dual-wavelength holographic microscope system, providing a new imaging detection method for the microchannel detection of microfluidic chips.ConclusionsIn this paper, a reflective off-axis dual-wavelength image-plane digital holographic microscopy measuring device is constructed based on digital holographic microscopy. The research on the three-dimensional topography measurement of microfluidic chip channels is carried out. The experimental results show that the lateral resolution of the system can reach 2.2 μm. The error range of the channel width and depth measurement is less than 4%, and the phase and plane distributions of the microchannel are accurately reproduced, indicating that the system has certain accuracy and feasibility. This research greatly expands the application field of digital holographic microscopic measurement, especially for closed microfluidic channels, meeting the needs of non-contact and label-free detection. In addition to the research on the structure of the chip channel itself, digital holographic microscopy can be extended to study the characteristics of the reaction solution, biological cells, and biological slice samples in the channel of the microfluidic chip. This study broadens the application scope of digital holographic microscopy and lays a foundation for the research on microfluidic-related technologies.
ObjectiveAs a virtual 3D space parallel to reality, metaverse can greatly enrich human life and work and has received extensive attention. Augmented reality (AR) and virtual reality (VR) are considered the gateway to the metaverse. True 3D display without visual fatigue caused to human eyes is the key to AR and VR displays. Among the 3D displays such as light field 3D display, the holographic 3D display is the only way to completely reconstruct the phase and amplitude information of 3D scenes.The phase-only hologram is more attractive for its higher diffraction efficiency. The spatial light modulator (SLM), especially the phase-only liquid crystal on silicon (LCoS), is an ideal display panel for dynamic holographic 3D displays with phase-only holograms. However, due to the pixel structure of the LCoS, there are zero-order and high-order lights, which are inevitable and very annoying for holographic near-eye 3D displays and are always filtered with 4f optical systems. The enlarged virtual 3D image is viewed with an eyepiece and the presence of 4f optical systems increases the size of the display system. Since the complex amplitude distribution of diffracted 3D scenes is difficult to be fully described by phase-only data, the computation of phase-only holograms is a big challenge. Different optimization algorithms including Gerchberg-Saxton (GS) algorithm, patterned phase-only hologram, double phase method, gradient descent algorithm and deep learning algorithm have been proposed for the phase-only hologram calculation. The above algorithms have their advantages and disadvantages. Most of the algorithms are not related to the display systems and cannot be employed to reduce the volume of the display system.MethodsThis paper demonstrates a compact holographic near-eye 3D display only with one projection lens and one eyepiece after the SLM, thereby avoiding the utilization of 4f optical systems and reducing the display system. In the hologram calculation, an interactive method by considering the parameters of holographic near-eye display systems is designed and implemented. The quadratic phases related to the focal length of the projection lens and the depth of each layer of the 3D model are adopted as compensation phase factors, and only the Fourier transform and inverse Fourier transform are leveraged in the iterations to obtain the 3D phase-only hologram. Finally, the 3D image with multiple layers can be projected near the focus plane of the projection lens and the enlarged virtual image can be watched with the eyepiece for VR near-eye 3D display and an extra beam splitter for AR near-eye 3D display.Results and DiscussionsFour layers with a resolution of 1080 pixel×1080 pixel non-overlapped 3D model are designed, and the phase-only holograms with random phase and quadratic phase as initial phase are calculated and reconstructed. The peak signal-to-noise ratio (PSNR) and correlation coefficient (CC) are employed to evaluate the proposed calculation method and point out that when the initial phase is random, the speckle noise of the reproduced image is worse but the 3D effect of out-of-focus focusing is more obvious. However, when the quadratic phase is used as the initial phase, the speckle noise can be suppressed under certain circumstances, but the out-of-focus change is not obvious for the 3D display. In addition, a simulation study is conducted on the multi-depth images with front and back occlusion, which proves that the proposed algorithm is also effective in this case. The optical reconstructions of the phase-only holograms are implemented and the holographic near-eye VR and AR 3D display results are verified with experiments in the proposed compact display system.ConclusionsIn this paper, a compact holographic near-eye display is proposed for holographic near-eye VR and AR 3D displays. The proposed iterative algorithm is a display system-related algorithm, which is conducive to reducing the volume of the holographic near-eye display system. The effectiveness of the proposed method is proved by simulations and optical experiments. The combination of the proposed method and the optical waveguide has the potential to be applied to the waveguide-type holographic AR 3D display to promote the early arrival of the metaverse.
ObjectiveDue to the influence of the processing error of optical elements, system assembly error, and ambient temperature, the optical system usually has static aberrations, which reduce the imaging quality and significantly affects the optical performance. The stochastic parallel gradient descent (SPGD) algorithm is widely used to correct static aberrations. For the SPGD algorithm, the performance metrics, usually including the Strehl ratio (SR), encircled energy (EE), and mean radius (MR), have a great influence on the correction accuracy. In practical applications, SR is seldom chosen as it is difficult to achieve. In terms of EE, the convergence speed and correction accuracy depend closely on the selected encircled area, and hence, EE can only represent the total energy distribution of the surrounding area but cannot effectively reflect the entire intensity distribution. In contrast, the performance metric MR takes the whole intensity distribution into consideration, and higher correction accuracy is thus obtained. However, it is sensitive to small disturbance voltage, which makes the correction unstable. Therefore, to achieve high-precision and stable correction of static aberrations, we propose a combination method of performance metrics, which can not only concentrate the spot energy but also make the energy distribution uniform.MethodsThe proposed method combines the performance metrics EE and MR to correct the static aberrations. EE is first chosen as the performance metric and is computed with the acquired image. The control voltage is calculated and applied on the deformable mirror to correct the distorted wavefront. When most of the energy is concentrated in the encircled area, the performance metric is switched from EE to MR. Afterward, the energy distribution is further unified, which can also reduce the MR of the light spot. Thus, with the combination method, the energy can be better concentrated, and the intensity distribution can be more uniform. Meanwhile, the static aberrations can be corrected with higher accuracy.Results and DiscussionsFirst, to concentrate the energy at the center of the image plane, we use EE for correction. After the energy is concentrated, it is then corrected with MR so that the energy distribution can be more uniform (Fig. 3). EE, MR, and the combination method of performance metrics are simulated and compared to verify the effectiveness of the proposed method (Fig. 12), and the root-mean-square values of residual aberrations are 0.22λ, 0.43λ, and 0.01λ, respectively. Compared with the EE and MR methods, the combination method can achieve better spot image quality and dramatically increased peak intensity. In addition, the corresponding SRs are computed to be 0.53, 0.78, and 1.00, respectively. Moreover, the simulations of the correction results based on the three methods under different noises (Fig. 14), different encircled diameters (Fig. 15), and multiple random static aberrations (Fig. 16) are compared and analyzed. For the combination method, SR remains stable at 1.00 after correction. Finally, an experiment is performed to further validate the proposed method. As a result, the corrected resolutions are improved to be 2.15, 1.40, and 1.05 times the diffraction limit for the three methods, respectively, and in particular, the diffraction limit of the optical system is almost achieved with the combination method (Fig. 18). The research reveals that the proposed method can realize higher correction accuracy and stability.ConclusionsThe combination method of performance metrics proposed in this paper can effectively improve the correction accuracy and stability of static aberrations. Simulations show that the SR corrected by the combination method can keep stable at 1.00 under different encircled diameters, different noises, and multiple static aberrations. As further demonstrated by experiments, with the combination method, the light spot is the most focused, and the resolution is improved to be 1.05 times the diffraction limit. Both the experimental results and simulations confirm the effectiveness of the proposed method in static aberration correction. The method provides a facile and effective way for the correction and elimination of static aberrations in optical systems with optical performance close to the diffraction limit.
ObjectiveThe measurement of ocular optical biological parameters is a key part of the ophthalmic examination, and it is very important for the diagnosis and treatment of ophthalmic diseases such as myopia and cataract. For the existing ophthalmic measuring instruments, operators mainly use the joystick to manually control the movement of the instruments, so as to realize focus and alignment of the subject's eyes. The evaluation criteria of this process are subjective, and the process is slow and involves complicated operations. In recent years, many scholars have carried out research on human eye autofocus and pupil center positioning methods and have proposed some solutions. However, there are still problems such as poor real-time performance of the algorithm, relatively insufficient positioning accuracy, and poor generality. Therefore, the application of autofocus and auto-alignment technology reflects a development direction and practical demand of automatic ophthalmic measuring instruments.MethodsA human eye autofocus and pupil center auto-alignment system for ophthalmic measuring instruments is built. The system is mainly composed of a fixed vision module, an LED lamp bead plate, an imaging module, a three-axis electric displacement stage, and a head holder. By analyzing the characteristics of human eye images, an autofocus algorithm based on a four-neighborhood-multi-directional and two-level gradient function (FMTG algorithm) was proposed. The algorithm replaces the center pixel with the mean value of the center pixel and the four-neighborhood pixel for calculation, calculates the two-level gradient in the horizontal direction, vertical direction, and direction with an oblique of 45° at the same time, and takes the product of the two-level gradient operators as the sharpness evaluation value. A pupil center positioning algorithm (LPC algorithm) based on the intelligent region of interest (ROI) window of a convolutional neural network was proposed. The algorithm extracts the image coordinates of the pupil center and optical axis for alignment through steps including the extraction of the pupil region of interest, histogram-based binarization segmentation, and high-precision ellipse recognition and fitting. The performance of the proposed FMTG algorithm was verified by the system built in this paper and by actually shooting four groups of human eye-defocused image sequences. Six commonly used evaluation functions were selected for comparison, and their normalized sharpness evaluation curves were drawn. Three quantitative indicators, namely, single-frame processing time, sharpness ratio, and sensitivity, as well as two important properties such as unimodality and accuracy, were selected to comprehensively evaluate the performance of the functions. The performance of the proposed LPC algorithm and other algorithms for comparison was evaluated in terms of the average computation time, accuracy, and average error through the test set of real-shot human eye images. In addition, the proposed LPC algorithm was tested under complex conditions with different illumination and partial pupil occlusion to evaluate the universality of the algorithm.Results and DiscussionsThe FMTG algorithm proposed in this paper has a sharper evaluation curve shape and a stronger ability to distinguish on-focus images from out-of-focus images (Fig. 10). Its average calculation time is about 13 ms, with a sharpness ratio of 93.531, and the sensitivity is 0.329, which are all better than that of other six traditional evaluation algorithms and reflect good unimodality and accuracy (Table 1). The error curve of the LPC algorithm proposed in this paper has small fluctuation and good stability, and the algorithm can adapt to certain environmental changes (Fig. 12). The average calculation time of the LPC algorithm is 10.2 ms, with an accuracy of 97.14%, and the average error is 1.4 pixel, which indicate that the LPC algorithm has been greatly improved compared with the Hough method and the improved Hough method (Table 2). In addition, the proposed LPC algorithm can adapt to lighting environments with different brightness and darkness and situations where the pupil is partially occluded, and thus it shows good universality (Fig. 13).ConclusionsThis paper proposed a human eye autofocus and pupil center auto-alignment system applied to ophthalmic measuring instruments. The system realized the autofocus of the human eye region through an autofocus algorithm based on the FMTG algorithm and then delimited the ROI window through a convolutional neural network. In addition, it adopted an ellipse recognition and fitting algorithm to accurately locate the pupil center and optical axis and finally used the mechanical movement of the three-axis high-precision displacement stage to achieve the alignment of the human eye pupil center and optical axis. The experimental results show that the average calculation time of the FMTG algorithm proposed in this paper is about 13 ms, and the evaluation indicators such as sharpness ratio and sensitivity are higher than those of the traditional algorithms, and the FMTG algorithm has good unimodality and accuracy. The proposed LPC algorithm has an average calculation time of 10.2 ms and an accuracy of 97.14%. It can adapt to complex environments with different lighting and partially occluded pupils and has great accuracy and universality. The experimental results show that the system built in this paper can meet the requirements of accuracy, timeliness, and robustness of ocular biological parameter measurement, improve the automation level of the instruments, and contribute to the intelligent development of ophthalmic measurement instruments.
ObjectiveA measurement system for geometric parameters of the catenary on rolling stocks is investigated with the multi-view stereo vision technology and then used to measure geometric parameters, such as stagger and contact wire height. The geometric parameters of the catenary are the basic detection content of China's power supply safety inspection and monitoring system for high-speed railways (the 6C system). They are also important parameters to ensure the safe operation of electrified railways. The current measurement methods include the laser scanning methods, such as the one based on structured-light stereo vision and the one based on binocular stereo vision. These methods are weakened by several limitations in the on-board measurement of the geometric parameters of the catenary, such as the low scanning frequency and measurement resolution, the influence of sunlight, and the difficulty in matching homonymous points. Therefore, this paper attempts to propose a multi-view stereo vision technology with line-scan cameras to perform the on-board measurement of the geometric parameters of the catenary. A new kind of high-speed synchronized stroboscopic lighting technology for stereo vision-based measurement is developed to improve the resistance to sunlight interference, enhance image quality, and reduce the power consumption of the measurement system. A measurement model and a matching method for stereo vision with line-scan cameras are proposed. A method of compensating vehicle vibration with two-dimensional laser sensors and the corresponding model for vehicle vibration compensation are constructed.MethodsThe measurement system is composed of two parts, i.e., a stereo vision-based measurement module on the train roof and a measurement module for vehicle vibration compensation at the bottom of the train. The stereo vision-based measurement module consists of four line-scan cameras. A line-scan camera model is developed by Euclidean space transformation and perspective projection transformation. A measurement model for geometric parameters, including stagger and contact wire height, relative to the train roof coordinate system is developed by applying the triangulation principle of stereo vision. A matching method based on the spatial location features of targets is proposed. Specifically, the targets' imaging coordinates in the third line-scan camera are used to check the matching between the image from the first line-scan camera and that from the second line-scan camera, thereby quickly eliminating the uncertainty caused by binocular image matching. The measurement module for vehicle vibration compensation includes two two-dimensional laser sensors and measures the three spatial attitude parameters of the train body relative to the rail surface coordinate system, including the roll angle, the lateral relative displacement, and the vertical relative displacement. The geometric parameters (stagger and contact wire height) of the contact wire relative to the rail surface coordinate system are calculated by synthesizing the measurement data of both the stereo vision-based measurement module and the measurement module for vehicle vibration compensation. A light-emitting diode (LED) lamp based on stroboscopic lighting technology is proposed as an alternative light source. The high-speed synchronization of lighting and camera exposure is achieved by sharing the same trigger pulse produced by an encoder mounted on the train wheel. A blue LED lamp with a narrow-bandpass optical filter is proposed to minimize the influence of sunlight on imaging. The image signal-to-noise ratio (SNR) in a complex environment is significantly improved, and the power consumption of the measurement system is greatly reduced.Results and DiscussionsSpecifically, a calibration tool with a horizontally arranged calibration target array is designed to achieve high positioning accuracy of calibration targets (Fig. 8). The horizontally arranged calibration target array includes 11 targets equally spaced at 100 mm apart. At a certain height, the images of the 11 calibration points with different horizontal coordinates in the global coordinate system are captured. The calibration target array can be moved up and down to obtain calibration points with different vertical coordinates in the global coordinate system. The values of the parameters in the implicit parameter matrix of the line-scan cameras are calculated by Eq. (2) (listed in Table 1). The average deviations of the calibration point' reprojection obtained with the four line-scan cameras are 0.79 pixel, 0.95 pixel, 0.97 pixel, and 0.84 pixel, respectively. The proposed measurement system is installed on a dedicated inspection vehicle. The field test is performed on a high-speed railway line. The contact wire and the background can be well distinguished by first-order difference processing of the image (Fig. 10). The pixel coordinate of the midpoint of the contact wire's bottom surface is determined by locating the edges on both sides of the contact wire's bottom surface. The position of the contact wire relative to the train-roof coordinate system is calculated with the proposed stereo vision-based measurement model. Then, the position of the contact wire relative to the rail surface coordinate system is calculated by the vehicle vibration compensation method. The values of roll angle and lateral relative displacement of the train body both increase from near zero when the inspection vehicle travels from the straight-line section to the curved-line section. In contrast, the deviation of the vertical relative displacement of the train body is small (listed in Table 2). The comparison between dynamic test results and ground measurement results indicates that the measurement errors in stagger and contact wire height are both smaller than 10 mm (listed in Table 3). The test demonstrates that the proposed measurement system can be used both in the low-speed static inspection of a newly built catenary system and in the cyclic dynamic inspection of an operating catenary system.ConclusionsThis paper proposes a measurement system for the geometric parameters of the catenary on rolling stocks based on multi-view stereo vision technology. The proposed system can measure geometric parameters, including stagger and contact wire height. The blue LED lamp based on stroboscopic lighting technology is investigated. Compared with the traditional measurement device using the high-intensity discharge (HID) lamp, the proposed device significantly improves the image signal-to-noise ratio in a complex environment and greatly reduces the power consumption of the measurement system. A measurement model for the geometric parameters of the catenary is developed, and it is composed of a stereo vision-based measurement model and a model for vehicle vibration compensation. A matching method for stereo vision with line-scan cameras is proposed. It uses the third line-scan camera to compare the reprojected points of each space point with the actual extracted points from image processing to quickly remove the pseudo-objects. The dynamic test results indicate that the measurement errors in stagger and contact wire height are both smaller than 10 mm. The test demonstrates that the proposed measurement system satisfies the application requirement of the 6C system.
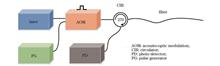
Results and Discussions First, the relationship between the intensity of the diffraction signal and the light intensity ratio of the two interference beams is measured (Fig. 4). The highest diffraction efficiency is established, which obtains a better interference signal. PDV100 and the proposed system are placed in a mutually vertical structure relative to the measured object, and the out-of-plane vibration measured by PDV100 is the in-plane vibration measured by the proposed system. When the measured object is driven by sinusoidal voltage with the same frequency and different voltage (1 kHz, 80-200 V), the measurement results of the proposed system demonstrate a highly linear relationship with those of PDV100 (Fig. 6). When the measured object is driven by sinusoidal signals with the same voltage and different frequencies (200 V, 500 Hz-5 kHz), the time domain signal measurement results of both measurement systems are consistent, which verifies the feasibility of the proposed system (Fig. 7). According to the relevant calibration of the PDV100 and the conversion relationship between amplitude and vibration velocity, the amplitude is 0.11 μm when the vibration frequency is 5 kHz. In addition, as the upper measurement limit of the PDV100 vibrometer is 20 kHz, the in-plane vibration of 20-240 kHz is also measured. The frequency domain signals are obtained by the spectrometer (Fig. 8), and the measurement results are consistent with the signal frequency loaded on the shear piezoelectric ceramics.ObjectiveThe measurement of high frequency and micro-vibration plays a critical role in multiple fields, such as nondestructive testing, micro machinery, materials science, biomedicine, and aerospace. Optical measurement methods with high accuracy, non-contact, and other advantages are widely applied to avoid device interference and damage. Compared with out-of-plane vibration measurement, in-plane vibration measurement is difficult because the measured light cannot be incident parallel to the in-plane vibration direction. Speckle interferometry is the most commonly used method for in-plane displacement measurement. However, owing to the high-speed performance limitation of the charge-coupled device (CCD) in the imaging process, its measurement frequency cannot be increased. In addition, the measured vibration surface is typically rough, leading to low measurement sensitivity for traditional laser interferometry. The dynamic holographic vibration measurement method based on a photorefractive crystal has attracted increasing attention due to advantages such as wavefront matching and low-frequency cutoff. In this study, a dynamic holographic in-plane vibration measurement system based on bismuth silicate (BSO) crystal is examined, which measures high frequency and small in-plane vibration in real time. It has strong anti-interference ability and is suitable for rough surfaces.MethodsThe laser beam emitted from the source is split into a reference beam and a signal beam. The signal beam carrying in-plane vibration information passes through a scatterer driven by shear piezoelectric ceramics. Both beams interfere in a BSO crystal. According to the photorefractive properties of BSO crystal, a refractive index grating is formed on the crystal which is equivalent to the interference recording in holography. The grating automatically meets the Bragg condition, and the reference beam generates Bragg diffracted beam in real time, which is equivalent to the diffraction reproduction in holography. The diffracted beam of the reference beam passing through the grating interferes with the transmitted beam of the signal beam. Vibration information can be obtained by receiving the interference signal and demodulating it through the detector. The relationship between the intensity of the diffraction signal and the light intensity ratio of the two interference beams is measured to obtain a better interference signal. A commercial out-of-plane laser vibrometer PDV100 (Polytec, Germany) is used for comparison, and the feasibility of the proposed system for measuring in-plane micro-vibration is verified. The capability of the proposed system to measure high-frequency vibration is also verified by demodulating the loading frequency beyond the measurement upper limit of PDV100. To this end, the demodulation frequency is obtained directly by the spectrum analyzer.ConclusionsIn contrast to out-of-plane vibration which is straightforward to measure, this paper proposes a dynamic holographic measurement system for in-plane vibration. The signal beam is modulated by the in-plane vibration of a scatterer after passing through it. The signal and reference beams form dynamic holography in a BSO crystal. Interference between the transmitted scattered beam and the diffraction beam of the reference beam occurs, and the in-plane vibration signal is obtained by demodulation of the interference signal. Photorefractive properties of the BSO crystal enable it to record dynamic holography and diffract in real time. As a result, the automatic wavefront match of the two interference beams can be achieved, which is suitable for measuring the vibration of rough surfaces. Combined with the low-frequency cutoff of BSO crystals, higher measurement sensitivity can be obtained and it is more suitable for high-frequency vibration measurement with small amplitude. The feasibility of the proposed system is verified by the comparison with the measurement results of a commercial vibrometer. With the scatterer as the object, the submicron in-plane vibration with a frequency of 240 kHz can be measured.
ObjectiveTransparent objects have been broadly applied in optical lenses, liquid crystal displays, airplane windshields, etc. During production and transportation, various defects may appear on the surfaces of transparent components, such as pits, scratches, and scuffs. In general, surface defects change the surface topography and transform the optical characteristics, thereby seriously degrading the structural stability and functional optimality of transparent components. Consequently, surface defect detection is essential for the quality evaluation of transparent-component-based systems. However, in principle, the parasitic reflection caused by the refracted light reflected by the back surface will inevitably induce extra detection errors or even false detection. To eliminate the parasitic reflection, we propose a single-view surface defect detection method with digital fringe projection, and an optical detection system is built to prove the feasibility of the proposed method. Comparative experimental results verify that the proposed method can accurately classify and locate surface defects of transparent components under the interference of parasitic reflection.MethodsIn our work, we propose a single-view surface imaging method based on reflection to eliminate parasitic reflection with digital fringe projection. A fringe-projection-based optical model is first built under the effect of fringe modulation by analyzing the difference between incident luminous flux and captured luminous flux. The model indicates that the topography variation of double surfaces can be reflected by two topography parameters, which constitute the average and contrast amplitudes of a cosine distribution. Subsequently, a multi-frequency temporal iterative technique is presented to precisely fit the cosine distribution during practical single-view surface imaging. In the practical iterative process, multiple fringe patterns with different frequencies are projected onto a transparent object. Then, the cosine distribution composed of intensity and frequency values is precisely fitted. Moreover, an iterative initial value acquisition algorithm is developed to achieve convergence in a short time. Finally, the average and contrast amplitudes can be applied to extract the topography parameters, thereby further identifying whole-field surface defects of transparent components and eliminating parasitic reflection.Results and DiscussionsThe comparative experimental results of surface defect detection for the front surface (Figs. 6-8) verify that the proposed method avoids the ghost image and the low average intensity, thereby performing better. Since our method separates the topography information of different surfaces, it can effectively eliminate interference from the back surface. Only the topography information of the front surface remains, and thereby the ghost image is removed. Moreover, the contrast between defect regions and entire areas is increased under the proposed method, which improves detection performance. The comparative experimental results of parasitic reflection separation (Figs. 9 and 10) verify that the proposed method can reliably separate the topography information of front and back surfaces and avoid false detection. Besides, the detection results of the proposed method can show the defects clearly, and the contrast between defect regions and entire areas is increased under the proposed method, improving detection performance. Overall, the advantages of the proposed method are summarized as follows. 1) Simple detection system setup. The detection system is established based on the traditional reflection-guided detection method: only a camera, a light source, and a black background are needed. In addition, the proposed method is independent of assumptions on the surface shape or positional relations between equipment. 2) High-precision defect detection. In light of geometrical optics, photometry theory, and the optical characteristics of defects, a hybrid reflective-refractive model is built to analyze the incident luminous flux affected by double-sided transparent objects. Moreover, a multi-frequency iterative separation algorithm is designed to separate the topography information of different surfaces. A specific initial value acquisition algorithm is developed to acquire precise convergence results speedily. 3) In-situ detection of double surfaces. In our method, the equipment is fixed during detection, and only a single viewpoint is needed, making the proposed method suitable for in-situ defect detection. Experimentally, our method successfully utilizes the extra topography information contained in the mutual interference of double surfaces and eliminates parasitic reflection.ConclusionsIn this paper, a novel single-view surface defect detection method for transparent objects is proposed that can eliminate parasitic reflection with digital fringe projection. A mathematical model of hybrid light paths for transparent objects is built in light of geometrical optics, photometry theory, and the optical characteristics of defects. This model reveals that the topography parameters of double surfaces together constitute the average and contrast amplitudes of a cosine distribution. Moreover, a temporal iterative technique is presented to fit the cosine distribution. In the practical iterative process, multi-frequency fringe patterns are projected onto a transparent object. Then, the cosine distribution composed of intensity and frequency values can be precisely fitted. Finally, the topography parameters can be extracted from the average and contrast amplitudes, thereby further identifying whole-field surface defects of transparent components and eliminating parasitic reflection. To prove the feasibility of the proposed method, we build an optical detection system and conduct comparative experiments between the proposed method and other advanced methods. Experimental results verify that the proposed method can accurately classify and locate surface defects of transparent components under the interference of parasitic reflection.
ObjectiveWhispering-gallery-mode optical micro-cavities have been extensively researched in narrow linewidth filters, biosensors, and nonlinear optics due to their small mode volume and ultra-high Q factor. Data acquisition and identification of mode spectral lines in real time are critical for experimental process control and index detection in research on optical micro-cavities. There are two typical detection strategies for spectral signals of optical micro-cavities. The first scheme uses a broadband light source to excite the whispering gallery modes of the optical micro-cavities, and the spectral signals are detected and evaluated by a spectrometer. It is costly, however, and thus this approach is only suitable for optical micro-cavities with a Q factor of less than 106. The other method for detecting spectral signals is to stimulate the whispering gallery modes by scanning the optical micro-cavity with a narrow linewidth laser. The stimulated spectral signal is then transformed by a photoelectric detector and sent to an oscilloscope for analysis. This approach is appropriate for ultra-high-Q optical micro-cavities, but it is incapable of analyzing the spectral signal in real time. In addition, there is an urgent need for an acquisition system with a high sampling rate, a rapid reaction time, and the capacity to monitor and analyze spectral data in real time for applications in high-sensitivity sensing of micro-cavities. Hence, a spectral signal acquisition system for optical micro-cavities is explored and constructed in this study to solve these issues. The system consists of an acquisition module, a data storage module, a data analysis module, and a data display module, which can show and analyze the spectral signals of optical micro-cavities in real time and has the benefit of quick acquisition. Moreover, it can set an arbitrary sampling interval and sampling time according to the requirements of different sensing systems, which solves the problems of capturing, analyzing, and displaying spectral signals in optical micro-cavities.MethodsThis signal acquisition system is separated into acquisition and software modules (Fig. 1). The analog signal is amplified and filtered by the conditioning circuit in the acquisition module (Fig. 2) before being transformed into a digital signal by the analog-to-digital converter (ADC). The transformed data stream is then transmitted to the processor for signal processing before the peripheral component interface (PCI) communicates with the upper computer software for data transmission, and the display operation is finished in the upper computer software. The acquisition system's software module is separated into five sections: trigger edge setting, system configuration, acquisition configuration, main menu, and data display. The trigger acquisition operation can be specified as a rising or trailing edge of the waveform in the trigger edge setting, and the rising edge trigger is valid at the positive edge. The time interval, sampling frequency, trigger frequency, and reference voltage can all be adjusted flexibly in the system configuration. After the parameters are set, they could be locked by the parameter lock feature in the system configuration to ensure the smooth execution of the acquisition procedure. The function of the acquisition configuration section is primarily to finish the setup of arbitrary parameters necessary for the number of acquisitions and the average number of acquisition experiments and control the acquisition process. The procedure of initiating and terminating the acquisition is completed via the main menu. The data display section shows the real-time waveform that is delivered to the upper computer software via NI Measurement Studio control. The development and design of the upper computer software for the acquisition system make use of Visual Studio software, which is equipped with the NI Measurement Studio integrated suite and is written in the C# programming language. The integrated suite provides a set of tightly integrated. NET controls for the Microsoft Visual Studio.NET environment, which allows the user to build virtual instrumentation systems.Results and DiscussionsFirst, the fundamental function of the spectral signal acquisition system is validated (Fig. 5), and the system's feasible basic acquisition function is proven. Then, the stability of the acquisition system is examined (Fig. 6), and the experimental findings reveal that the acquisition system fully fulfills the stability criteria of optical micro-acquisition cavities. After that, a fiber microsphere cavity created by arc discharge (Fig. 8) and a silica crystalline micro-disk cavity prepared by ultra-precision polishing (Fig. 9) are examined separately. The transmission spectra of the fiber microsphere cavity and the silica crystal micro-disk cavity are measured and traced, with the Q factor of the former being 2.26×10⁶ and that of the latter being 109. The acquisition system can excellently suppress noise and maintain steady mode spectral lines over extended periods. The optical micro-cavity system with an ultra-high Q factor has high reliability and could be utilized to create future micro-cavity sensing applications.ConclusionsA spectral signal acquisition system is designed for experimental systems of optical micro-cavities with an ultra-high Q factor. First, the triangle wave signal generated by the arbitrary function generator is acquired to evaluate the performance of this spectral acquisition system. It is demonstrated that this acquisition system can perform the fundamental acquisition function and has long-term stability. Second, this system is used to examine the spectral signal of a high-Q fiber microsphere cavity. The results indicate that this system is capable of realizing the flexible configuration of sampling of the micro-cavity system. Finally, the denoising feature of the ultra-high-Q silica crystal micro-disk cavity is shown by this system. The results show that the developed spectral signal acquisition system has the advantages of high reliability, a high sampling rate, and fast response, and it can acquire the spectral signals of ultra-high-Q micro-cavities and analyze the modes in real time. It provides great convenience for spectrum acquisition in micro-cavity research and can greatly broaden the potential applications of optical micro-cavity devices.
ObjectiveWith the continuous development of scientific and technological information, people's demand for communication system capacity and speed is increasing, and wavelength division multiplexing technology plays an important role in improving system capacity. As a key component of wavelength division multiplexing systems, the demultiplexer has become a research hotspot in this field. At present, a large-bandwidth filter with a high rectangular degree is mainly used to realize the function of demultiplexing. High-bandwidth and ultra-high-bandwidth filter schemes are frequently proposed and implemented, involving photonic crystals, Mach-Zehnder interferometers, and waveguide Bragg gratings. Although traditional schemes based on photonic crystals and waveguide Bragg gratings can achieve large bandwidths, additional magneto-optical devices such as optical circulators need to be added to separate the reflected signals due to their working in the reflection mode, which undoubtedly increases the complexity of the system. In addition, the difficulty in the large-scale integration of magneto-optical materials with silicon-based devices also affects the application range of the above schemes. The Mach-Zehnder interferometer scheme is also difficult to integrate on a large scale due to its large structure size. Therefore, to realize a compact ultra-high-bandwidth filter, this paper proposes a filtering scheme based on a grating-assisted contra-directional coupler structure. The filter has the advantages of a high rectangular degree, an ultra-high bandwidth, and a low loss and can meet the needs of demultiplexing in coarse wavelength division multiplexing systems.MethodsTo reduce the use of magneto-optical devices such as optical circulators and improve integration, this paper uses a grating-assisted contra-directional coupler structure to realize the filter function. According to the coupled mode theory, the bandwidth of the contra-directional coupler is inversely proportional to the sum of the effective refractive indices of the two waveguides and proportional to the coupling coefficient. Therefore, it is necessary to reduce the effective refractive indices of the two waveguides and increase the coupling coefficient for enhancing the bandwidth of the filter. This paper first compares the effective refractive indices of sub-wavelength grating and conventional waveguide grating and finds that the former has a lower refractive index. Considering that a smaller waveguide width corresponds to a lower effective refractive index, the paper proposes to gradually change the input waveguide into a narrow waveguide through a taper so that the effective refractive index can be further reduced. When the width of the waveguide is reduced to a certain extent, the effective refractive index is lower than that of the current common scheme. Moreover, the narrow waveguide has a more dispersed electric field, which is beneficial to improve the coupling coefficient and achieve an ultra-high bandwidth. Therefore, in this paper, the narrow waveguide structure and the grating-assisted contra-directional coupler structure are used to address the low bandwidth, and the problem of a large structure size is also solved by continuing to optimize parameters.Results and DiscussionsThe width of the proposed narrow waveguide is 180 nm; the widths of the conventional grating and the sub-wavelength grating are both 500 nm; the duty cycle is 0.5. The effective refractive index of the narrow waveguide in the wavelength range of 1530-1570 nm is 1.441-1.447, which is smaller than those of the conventional grating and the sub-wavelength grating (Fig. 2). To further verify that the filter can achieve higher bandwidth, the transmission matrix method is used to calculate its spectral characteristics. At this time, the 3 dB bandwidth at the drop end is 70 nm (Fig. 3), which is in line with the above theoretical derivation. The grating comb and the waveguide are apodized at the same time to further improve the side-lobe suppression ratio (Fig. 5). In such a case, the 3 dB bandwidth of the filter is 92.9 nm; the side-lobe suppression ratio is greater than 11.1 dB; the shape factor is 0.99; the insertion loss is less than 0.38 dB; the in-band ripple is less than 0.28 dB (Fig. 6). This paper also designs a filtering scheme with a more compact structure and a higher side-lobe suppression ratio. After re-optimization, the 3 dB bandwidth is 87 nm; the side-lobe suppression ratio is 25.6 dB; the device length is 96 μm; the insertion loss is 0.16 dB; the in-band ripple is 0.08 dB (Fig. 7).ConclusionsThis paper proposes an ultra-high-bandwidth filter based on a grating-assisted contra-directional coupler. Firstly, in light of the coupled mode theory, the expression of the filter bandwidth is deduced, and the factors influencing the bandwidth are analyzed. Secondly, the paper develops a method of changing one waveguide in the contra-directional coupler to a narrow waveguide. After design and optimization, an ultra-high-bandwidth silicon-based photonic filter is finally realized with a 3 dB bandwidth of 92.9 nm, a side-lobe suppression ratio of 11.1 dB, a shape factor of 0.99, an insertion loss of 0.38 dB, and an in-band ripple of 0.28 dB. In addition, this paper also designs a filtering scheme with a more compact structure and a higher side-lobe suppression ratio. After re-optimization, the 3 dB bandwidth is 87 nm; the side-lobe suppression ratio is 25.6 dB; the device length is 96 μm; the insertion loss is 0.16 dB; the in-band ripple is 0.08 dB. The two filter schemes proposed in this paper adopt the contra-directional coupling method. The filter bandwidth in scheme 1 is larger than the largest bandwidth of similar structures, and the scheme greatly reduces the size of the filter. Scheme 2 improves the side-lobe suppression ratio and reduces the length of the device, which is suitable for application scenarios that are more sensitive to side-lobe suppression ratio and size. In addition, this paper also focuses on analyzing the filter performance changes when there are process errors in the apodization coefficient and comb width of the grating. A method of increasing the design value of the gap G between the narrow waveguide and the grating and fine-tuning the grating period is proposed to reduce the influence of process errors on filter performance.
ObjectiveIn laser-driven inertial confinement fusion (ICF) facilities, the illumination uniformity of the laser beam is critical to the success of implosion. Varieties of beam smoothing schemes have been developed to improve illumination uniformity on the target. Typical temporal and spatial smoothing schemes, such as the combination of smoothing by spectral dispersion (SSD) and continuous phase plate (CPP), cannot suppress laser plasma instabilities (LPIs) on picosecond timescales. As rapid temporal smoothing schemes, our previous radial smoothing (RS) and azimuthal smoothing (AS) schemes can reduce the smoothing time to the picosecond level. However, RS has strict requirements on the pump laser, while AS demands precise wavelength differences between the sub-beams. Many studies have shown that broadband laser is helpful to break the wave vector matching in LPIs. To achieve the suppression of LPIs with broadband light and fast beam smoothing, we propose an instantaneous beam smoothing scheme based on the beat frequency of broadband laser.MethodsTaking the National Ignition Facility (NIF) as a typical example, we build a physical model of the instantaneous beam smoothing scheme based on the beat frequency of broadband laser. In this scheme, four sub-beams successively propagate through a CPP array, a spiral phase plate (SPP) array, and a polarization control plate (PCP) array, and eventually focus on the target plane. It is noteworthy that four sub-beams are broadband laser. After passing through the SPP array and PCP array, four sub-beams are divided into two groups with orthogonal polarization. Meanwhile, every two sub-beams in a group have a conjugate spiral phase. Owing to the beat frequency of the rich frequency components of broadband laser and the conjugate spiral wavefront distributions, the speckles located at different positions on the target plane can rotate rapidly with different periods. In addition, the key factors of the proposed technique including bandwidth and spectrum type are analyzed in detail.Results and DiscussionsThe results show that both the proposed scheme and the previous scheme based on the beat frequency of dual-frequency monochromatic laser have the same intensity envelopes of focal spots. However, the proposed scheme exhibits a faster smoothing rate (on a sub-picosecond timescale), fewer hot spots, and better illumination uniformity (Fig. 3). The reason for this phenomenon is the beat frequency of different frequency components of broadband laser. It means that the hot spots have different displacements with each other. In other words, the peak power of the hot spots decreases, and the illumination uniformity of the focal spots increases. In addition, with the increase in the bandwidth of the broadband laser, the smoothing rate can be significantly enhanced, while the illumination uniformity cannot be improved dramatically (Fig. 4). For instance, the focal spot is smoothed in a few picoseconds when Δλ=0.35 nm but in sub-picosecond at Δλ=3.50 nm. However, both of them have close Co. By means of shaping the spectrum type of broadband laser, the focal spot with Gaussian spectrum is smoothed more quickly than that with flat top spectrum (Fig. 5).ConclusionsTo meet the requirements of illumination uniformity in laser-driven ICF facilities, we propose an instantaneous beam smoothing scheme based on the beat frequency of broadband laser. In this technique with broadband laser as sub-beams, speckles at different positions on the focal plane rotate rapidly with different periods. The proposed technique can shorten the smoothing time to picosecond and even the sub-picosecond timescale by choosing appropriate parameters of the broadband laser. Compared with the technique based on the beat frequency of dual-frequency monochromatic laser, the proposed technique has more advantages attributed to the beat frequency of rich frequency components of broadband laser. The speckles on the target plane rotate more quickly, which leads to instantaneous smoothing of the focal spot and better illumination uniformity. On this basis, the effects of the key factors including bandwidth and spectrum type are analyzed. The results show that the smoothing performance of the proposed technique can be further improved by increasing the bandwidth of the laser and adopting the Gaussian spectrum of the broadband laser.
ObjectiveLaser at 2.15 μm band has important applications in many fields. For example, it is located in the transmission window of the atmosphere and has remarkable transmittance in smoke, which makes it more reliable for data transmission in some special contexts. It has also realized the measurement of factors in the atmospheric environment, such as wind velocity, carbon dioxide, and water vapor. Lasers around 2.15 μm band are ideal pump sources for generating mid-infrared laser through nonlinear frequency conversion. Fiber lasers have great advantages in beam quality, stability, and portability. At present, most fiber laser at 2 μm band is generated by holmium-doped or thulium-doped fiber lasers. However, on one hand, due to the enormous decreases in the absorption and emission cross sections of Ho3+ and Tm3+ beyond 2.1 μm, the wavelength is difficult to expand to over 2.1 μm, and the power scaling is also restricted by insufficient gain. On the other hand, various nonlinear effects, such as self-phase modulation and stimulated Raman scattering (SRS), will lead to spectral broadening under high pump power, which restricts the applications of the lasers. Gas SRS in hollow-core fibers (HCFs) has been proved to be an effective method for expanding laser wavelengths. HCFs can provide an ideal environment for the interaction between the gas and the pump laser. Gas SRS in HCFs combines the advantages of traditional fiber lasers and gas lasers, such as high beam quality, high damage thresholds, narrow linewidths, and convenient heat management. In this paper, we report an all-fiber gas Raman laser at 2.15 μm band through fusion splicing between a solid-core fiber and an HCF. This paper provides a novel method to generate fiber lasers beyond 2.1 μm.MethodsThe 2.15 μm fiber gas Raman laser is realized based on the pure rotational SRS of deuterium filled in a 25.8 m long HCF. The 1971 nm pump laser is directly coupled into the HCF through the splicing between the solid-core fiber and the HCF. The output end of the HCF is sealed in a gas cell when it is filled with deuterium. After the internal gas pressure becomes balanced, the HCF is quickly withdrawn and spliced to the solid-core fiber, which forms an all-fiber gas cell. The Raman laser caused by the Fresnel reflection of the splice is well prevented from inducing damage to the pump source by introducing a self-written long-period fiber grating (LPG) in the solid-core fiber.Results and DiscussionsThe self-written LPG functions well as an isolator of the Raman laser caused by Fresnel reflection, and the depth at 2147.1 nm is around -8 dBm [Fig. 1(c)]. This means most part of Fresnel reflection is attenuated, and thus the pump source can be protected from being damaged by the Raman laser. The splice loss at the input end and the output end is ~1.42 dB and ~1.00 dB, respectively. The gas pressure in the all-fiber gas cell is calculated to be around 1.4 GPa. Two first-order Raman lines are obtained in the experiment (Fig. 3). The 2147.1 nm Raman line is first generated because its threshold is lower than that of the 2043.6 nm Raman line. As the coupled pump power increases, part of the pump power is converted to 2043.6 nm Raman laser. With the increase in the pump repetition frequency, the pump laser has lower peak power (inversely proportional to the repetition frequency). Therefore, higher average pump power is necessary to exceed the Raman threshold, and more pump power is needed to generate Raman laser with the repetition frequency increasing [Fig. 4(a)]. Although the peak power is lower at the repetition frequency of 1.5 MHz and 2.0 MHz, the available pump power is much higher than that at 0.5 MHz and 1.0 MHz. Thus, the Raman power at these two repetition frequencies (1.5 MHz and 2.0 MHz) is much higher than that at the other two repetition frequencies. The power characteristics under different pumping pulse widths are also studied in detail (Fig. 5). Finally, a maximum Raman power of ~0.87 W at 2.15 μm is obtained [Fig. 4(a)] with a corresponding optical-to-optical conversion efficiency of 19% restricted by a high Raman threshold. The Raman power and conversion efficiency can be enhanced by optimizing the splice loss and fiber length of the HCF.ConclusionsIn this paper, we report a 2.15 μm all-fiber gas Raman laser. The all-fiber gas cell is obtained through the fusion between a single-mode solid-core fiber and a hollow-core photonic crystal fiber, and the Raman laser caused by the Fresnel reflection of the splice is well prevented from inducing damage to the pump source by introducing a self-written LPG in the solid-core fiber. Pumped by a 1971 nm pulse fiber amplifier, a maximum Raman power of ~0.87 W at 2147.1 nm is obtained with a corresponding optical-to-optical conversion efficiency of 19% restricted by a high Raman threshold. This paper provides a novel method to realize a fiber laser source beyond 2.1 μm.
ObjectiveUp to now, high-power fiber lasers have been widely used in industrial processing, national defense, scientific research, and other fields. However, stimulated Raman scattering (SRS) is one of the main factors limiting the power scaling of such fiber lasers. In recent years, chirped and tilted fiber Bragg gratings (CTFBGs) have been demonstrated to suppress the SRS in high-power lasers by filtering the Raman light. CTFBGs are traditionally fabricated by the ultraviolet laser phase mask method, which requires the fibers to be hydrogen-loaded and thermal-annealed before and after grating inscription, respectively. This process is time-consuming and costly, especially when CTFBGs are fabricated with large-core fibers since the time for hydrogen loading and thermal annealing increases as the fiber core expands. The development of the femtosecond (fs) laser inscription method provides an alternative to the fabrication of CTFBGs. As it has no requirement on fiber photosensitivity, hydrogen loading and thermal annealing are no longer necessary, which greatly shortens the fabrication period of CTFBGs. However, although chirped FBGs and tilted FBGs have been fabricated by fs-lasers, fs-laser-inscribed CTFBGs have not been reported yet, and this paper is expected to fill this research gap.MethodThe inscription system for CTFBGs is shown in Fig. 1. The fs-laser emitted from the laser source is reflected by a reflecting mirror and is then focused on a fiber after passing through a chirped phase mask and a cylindrical lens successively. The fiber is fixed on a piezoelectric platform by a pair of fiber holders, and the reflecting mirror and the cylindrical lens are fixed on a one-dimension translation stage. Because the waist width of focal spot is smaller than the diameter of the fiber core, a tilted grating structure can be obtained by the oblique scanning of the fiber with the piezoelectric platform. Moreover, a larger chirp and a longer grating length can be achieved by moving the translation stage along the fiber axis.Results and DiscussionsFour CTFBGs with different tilt angles are fabricated, with their micrographs shown in Figs. 2(b) and 2(c). The tilted grating structure is clear and completely covers the fiber core. Fig. 3 presents the measured spectra of the CTFBGs. The transmission spectra suggest that as the tilt angle increases, the center wavelength moves towards a short wavelength. In addition, the depth decreases while the width increases. However, the Bragg wavelength of the CTFBGs does not change as the tilt angle increases according to the reflection spectra of the CTFBGs.ConclusionsThis paper takes the lead in inscribing CTFBGs with different tilt angles in large-mode-area double-cladding fibers with core/cladding diameter of 20/400 μm by fs-lasers, with a maximum filtering depth and bandwidth of ca. 15 dB and ca. 8.9 nm, respectively. This paper is of great significance to the research and development of CTFBGs.
ObjectiveFourier ptychography (FP) is a recently developed phase retrieval approach, which simultaneously realizes image restoration with super-resolution and a large field of view. This approach is also a novel super-resolution optical imaging technique that can be efficiently applied to microscopy and macroscopy respectively. However, one limitation of FP is the long acquisition and reconstruction time due to the numerous low-resolution (LR) images that are needed. Especially when the LR image is acquired under large angle illumination (dark field imaging), the low illumination intensity leads to the long exposure time of the imaging sensors. The situation becomes more time-consuming when a new sample is imaged, and thus a larger number of images with different exposure time for each LR image should be tested to obtain the corresponding best exposure time. Losing low gray value pixels exists in the FP algorithm preprocessing, which ultimately leads to the loss of image information due to the weak local image intensity in the recovery result. With the development of optical integration and micro/nano fabrication technology, the circular lens is no longer necessary. On the contrary, the square lens can fill the entire aperture of the miniaturized imaging system (cuboid) and collect more light fields. This paper introduces the square aperture lens into the FP approach which is conducive to collecting the complete aperture light field for further miniaturized imaging devices. The introduced square lens is expected to improve the image intensity and resolution of the FP approach, reduce the data acquisition time, and be more in line with the optical integration development.MethodsAccording to the Rayleigh criterion, the low resolution of the optical imaging system is caused by the lens aperture. The FP approach achieves super-resolution and large-field imaging by combining multiple LR images. Different from the FP microscopy, the macroscopic FP technique requires moving the imaging camera or using array imaging cameras to obtain a series of LR images of the object. Each LR image is obtained by locating the aperture on the spatial spectrum plane with different positions set in horizontal and vertical directions. After the LR image is acquired at the current position, the aperture is moved to the next position according to the required step size until the spatial spectrum is fully collected. To overcome the position offset of each LR image, the template matching method based on cross-correlation is applied for image registration. This paper studies the macroscopic FP imaging technology based on square aperture. Using the imaging sensor and its natural rectangular structure in the spatial Fourier domain is more effective to use the synthesis of square aperture to improve the imaging resolution and reduce the time consumption. The macroscopic FP technology based on circular aperture is also tested to make a better comparison. In the simulation, the ptychographical iterative engine (PIE) algorithm on the MATLAB platform is adopted to iteratively recover the phase to obtain a high-resolution image. In the experiment, a macroscopic FP optical setup is built. A square aperture, a lens, and a CCD are mounted on an optical bench as a comment imaging system. The system translated in the x-y direction to collect different spatial spectra and obtain a series of LR images. The PIE algorithm used in the simulation can recover the super-resolution image from the LR images.Results and DiscussionsWhen the circular aperture is used in the FP method, the image intensity is too weak as luminous flux lacks. The low gray value pixels would be missed during the FP algorithm preprocessing, which ultimately leads to image information loss due to the weak local image intensity in the recovery result. Compared to the circular aperture, the square aperture has a greater luminous flux and can obtain higher image intensity when collecting image information in the spatial spectrum plane. In theory, it is well known that when the side length of the square aperture is the same as the diameter of the circular aperture, the coherence transfer function of the former is greater than that of the circular aperture. This means that the square aperture can collect more spatial frequency information in the spatial spectrum domain for each LR image. The experimental results show that the square aperture still has a good contrast of 0.4 in the case of groups (4,1) in the USAF target (Fig. 6). The high luminous flux of the square aperture is utilized to reduce the dynamic range of the data set, therefore reducing the image acquisition time. The small dynamic range recovery results are shown in Fig. 8, and the image still has good contrast.ConclusionsThis study demonstrates the macroscopic FP technique based on square aperture. The macroscopic FP technique has a better performance by replacing the conventional circular aperture scanning on the spatial spectrum plane with a square aperture. The numerical simulation and experimental verification show that when the square side length and circular diameter are the same, the square aperture has the advantages of high luminous flux and wide optical transfer function compared with the circular aperture. The wider spectrum of each LR image can increase the overlapping information between two adjacent images. The increase in luminous flux can reduce the dynamic range of image acquisition, thereby reducing the image acquisition time. As a result, the FP technique with the square aperture can achieve higher imaging resolution, speed, and signal-to-noise ratio. With the development of optical integration and micro/nano optical fabrication, the fabrication and integration of square aperture lens will be more convenient and can make full use of the aperture of the optical integrated devices. Considering the imaging sensor and its natural rectangular structure both in spatial and Fourier domains, the square aperture is more matched than the circular aperture. Square aperture lenses are promising to be integrated into various imaging systems and will appear in future miniaturized optical devices.
ObjectiveIn traditional optical microscopes, large field of view and high resolution cannot be achieved at the same time. Large numerical aperture objective lens is necessary to obtain high-resolution images, which will inevitably lead to the reduced imaging field of view. Similarly, a small numerical aperture objective lens should be employed to obtain a large imaging field of view, and the corresponding imaging resolution will inevitably decrease. Therefore, when the traditional optical microscope is adopted, a trade-off is needed between imaging resolution and imaging field of view, and it is impossible to obtain large field of view and high-resolution microscopic images simultaneously. With the rapid development of deep learning technology, different algorithm models are designed based on deep learning, and the corresponding pathological cell models are diagnosed in combination with the evaluation and guidance of professional doctors to yield computer-aided calculation and detection effects. Therefore, this paper proposes a method to generate matching high-resolution virtual stained images from low-resolution stained images with large field of view using cycle generative adversarial networks (Cycle-GANs), without changing the optical systems and detector devices. Only ordinary microscopes are employed to obtain staining images with large field of view, and it is unnecessary to convert the multiple objectives to obtain high-resolution images. Virtual high-resolution staining images at any position of the large field of view can be predicted through network model calculation, and the high resolution and large field of view can be realized at the same time.MethodsIn this paper, Cycle-GANs are employed to complete the experiment. Firstly, the data set preparation is carried out, and the unpaired and paired data sets of images under multiple objectives are collected respectively to constitute the training and testing parts of the network model. Secondly, a theoretical pre-experiment is conducted. The resolution of the same stained onion epidermal cell images is scaled to simulate the reduction of image resolution. The resolution of the input images is verified to have a lower limit, and the field of view of the microscope cannot be infinite in actual observation. Then, through imaging and testing the resolution testing board, the experiment of generating 25 times high-resolution virtual images from 10 times low-resolution images is carried out, which proves that Cycle-GANs networks can improve the image resolution. Finally, experiments are carried out to generate 25 times high-resolution virtual staining images corresponding to 10 times and 4 times low-resolution real staining images using stained onion epidermal cells. The corresponding values and results are obtained through subjective vision and objective evaluation indicators.Results and DiscussionsIn the experiment of grading and scaling the resolution of the same stained onion epidermal cell images (Fig. 4), the fitting curves of structural similarity index (SSIM) and peak signal-to-noise ratio (PSNR) decrease with the reducing image resolution, while those of normalized root mean square error (NRMSE) increase with the decreasing image resolution (Fig. 5). With the resolution reduced by 32 times, the SSIM value lower than 0.5, and the PSNR value lower than 20, the images can no longer be correctly resolved by human eyes, which proves that the image resolution cannot be infinitely reduced. Then, in the experiment of generating 25 times high-resolution virtual images from 10 times low-resolution images on a resolution testing board (Fig. 6), low-resolution images under 10 times objective in the second row in Fig. 6 are generated by the algorithm as shown in the third row in Fig. 6. The sets of the fourth column and fifth column of the resolution testing board can be well resolved by human eyes, which shows the improvement of image resolution. Finally, in the experiment of generating 25 times high-resolution virtual stained images corresponding to 10 times low-resolution real stained images of onion epidermal cells (Fig. 7), the maximum SSIM, the maximum PSNR, and the minimum NRMSE are 0.684, 23.523 dB, and 0.131, respectively. In the experiment of generating 25 times high-resolution virtual images from 4 times low-resolution images (Fig. 8), the SSIM and PSNR can be as high as 0.597 and 22.322 dB, and the NRMSE is as low as 0.180. Under the analysis of subjective vision or objective evaluation indicators, the results of virtual stained images generated based on Cycle-GANs are close to those of real bright-field stained images under the measurement of various indicators.ConclusionsTraditional optical microscopes cannot combine large field of view with high resolution. Therefore, this paper proposes a method to generate matching high-resolution virtual stained images from low-resolution stained images with large field of view by Cycle-GANs. This can transform low-resolution stained images with low-power bright field into matching high-power virtual stained high-resolution images. Experimental results show that the characteristic information, such as organelle structures in the bright-field stained images of onion epidermis cells, can be extracted effectively by Cycle-GANs. Finally, virtual cell staining is realized, and staining damage to the tissues is reduced. Additionally, the large field of view and high resolution of the traditional optical microscope can be considered at the same time by inputting low-resolution stained images with a large field of view and outputting high-resolution virtual stained images with a high similarity to high-resolution real stained images with a small field of view. Finally, the differences between the generated virtual stained images and real bright-field stained images are evaluated by subjective vision and objective evaluation indicators. The results show that the virtual stained images generated by Cycle-GANs and real stained images are highly similar under the measurement of various indicators. Therefore, this method can meet the large field of view and high resolution of traditional microscopes. When applied to real life, it can reduce the costs and the burden of doctors and is of great significance in biomedical cell research.
ObjectiveTerahertz wave refers to the electromagnetic wave whose frequency and wavelength are in the ranges of 0.1-10.0 THz and 30-3000 μm, respectively. Throughout the entire electromagnetic spectrum, the terahertz band is located between electronics and optical bands, so it is also called the "terahertz gap". Terahertz wave has some special properties due to its special band, such as low energy, high penetration, and transient. With the development of research and the maturity of technology, terahertz wave has shown bright application prospects in material science, biomedicine, imaging, and communication in recent years. Broadband terahertz radiation source is an important basis for spectral technology in the terahertz band. Therefore, it is of great significance to develop broadband terahertz radiation sources. Since GaSe crystal has a high light transmission and a small absorption coefficient, it has a good application in the generation and detection of broadband terahertz radiation. In this study, GaSe crystal is used to generate tunable broadband terahertz pulses through the optical rectification effect, which provides new ideas for the generation of tunable broadband terahertz pulse radiation.MethodsIn light of nonlinear optics, this paper studies the tunable broadband terahertz radiation generated through the optical rectification effect of shaped ultrashort laser pulses interacting with GaSe crystal, and the process is simulated by numerical calculations. It is found that by adjusting the laser spectrum component with a 4F shaping system, some components whose wavelengths are greater than λ1 in the frequency domain are blocked and truncated. Different shaped ultrashort laser pulses are obtained by varying the value of λ1. The adjustable shaped pulses and the optical rectification effect of GaSe crystal can be utilized to produce tunable broadband terahertz radiation. This scheme makes the center frequency of the terahertz pulse modulated from the high frequency to the low frequency, and the bandwidth is also changed.Results and DiscussionsThe terahertz radiation from GaSe crystal with different pulse durations is given by numerical methods (Fig. 2). Tunable terahertz pulses pumped by the shaped ultrashort laser pulses with a duration of 50 fs and a center wavelength of 800 nm are obtained, and their properties are given in detail. When the cutoff wavelength λ1 is changed, the center frequency and bandwidth (full width at half maximum) of the generated terahertz pulses are also changed accordingly (Fig. 3 and Fig. 4). In the shaping process, some energy of the laser pulse is lost. More energy of the pump pulse is lost at a smaller cutoff wavelength (Fig. 5). When half of the energy is blocked, the lost energy accounts for half of the total energy. Such energy loss also results in the energy loss of the resulting terahertz pulses (Fig. 6). The smaller the cutoff wavelength is, the smaller the terahertz pulse energy is. The proposed method is simple and feasible, and can change the envelope of the high-peak-power laser pulse without requiring any light modulator, thus avoiding the damage of the high-peak-power laser pulse to the modulator. Such pulse shaping methods provide a good theoretical reference for future experimental studies.ConclusionsIn summary, this paper presents a simple way to generate tunable terahertz pulse radiation by using the optical rectification effect of shaped ultrashort laser pulses on the GaSe crystal. The pump laser spectrum component in the 4F shaping system is shielded by an opaque baffle so that the high-peak-power laser pulse can be shaped, and the envelope of the laser pulse and the terahertz spectrum distribution generated by it can be changed. It is found that the center frequency and bandwidth of the generated terahertz pulse can be adjusted by changing the cutoff wavelength. This idea might offer new methods to generate tunable broadband terahertz pulses based on the optical rectification effect of GaSe crystal, which provides a good reference for related experiments.
ObjectiveAs the low diffraction efficiency of the single-layer diffractive element in the visible broadband results in blurred images and poor contrast, an optical-digital joint design method is proposed to solve this problem. Diffractive optical elements have special dispersion characteristics and temperature characteristics. When they are applied to the traditional refraction imaging system, the structure of the system can be simplified, and the weight of the system can be reduced. The performance index that is difficult to achieve in the traditional system can be achieved. The single-layer diffractive optical element features a simple structure, easy processing, and low costs. However, when the incident wavelength is far away from the central wavelength, the diffraction efficiency of the single-layer diffraction optical element will be significantly reduced, and the imaging quality will be severely affected by the low diffraction efficiency. Therefore, the single-layer diffractive optical element can only be applied to an optical system with a narrow wavelength range. As a result, multi-layer diffractive optical technology has emerged to improve the diffraction efficiency in the broadband. Despite the high diffraction efficiency of the multi-layer diffractive element in the broadband, its structure is complex, and the diffraction efficiency is easily affected by factors such as processing errors and ambient temperature compared with the single-layer diffractive element. Therefore, we hope to propose a design method combined with computational imaging to improve the visible broadband imaging quality of the single-layer diffractive element and expand the applicable band of the single-layer diffractive element.MethodsThe imaging process of the optical system is the process of image degradation. After a clear image passes through the optical system, convolves with the point spread function (PSF) of the optical system, and is added with noise, a new image is obtained. Therefore, the PSF can be used as a restoration function to perform a deconvolution operation on the obtained image to produce a clear image. Since the PSF obtained in the optical design software does not consider diffraction efficiency, the diffraction efficiency of each order is assumed to be 100%, and hence, it is necessary to reconstruct a PSF affected by diffraction efficiency. In this paper, the PSF model of the visible broadband affected by diffraction efficiency is constructed in three steps. Firstly, the energy distribution of a certain characteristic wavelength in a certain analysis level needs to be constructed. Secondly, the energy distribution of the wavelength in all analysis levels needs to be calculated and superimposed. Thirdly, the energy distribution of all characteristic wavelengths is obtained according to the method of the first two steps. The obtained energy distribution is superimposed with the quantum efficiency of the detector by weight and then normalized, and thus, the PSFs of the R, G, and B channels are obtained. After the PSF model is deconvolved with the grayscale images of the three channels of the blurred image, the three grayscale images obtained are recombined to obtain a clear color image free from the influence of diffraction efficiency.Results and DiscussionsFirstly, the existing patent optical system (Table 2) is optimized and adjusted, and a single-layer diffractive element is introduced. Without considering the diffraction efficiency, the image quality remains unchanged (Fig. 5 and Fig. 7), while the band range is expanded from 486.1-656.3 nm to 400.0-800.0 nm, and the number of lenses is reduced from six to four (Fig. 6). Then, the R, G, and B three-channel PSF model of the optimized system affected by diffraction efficiency is constructed according to the previous method (Figs. 8-10). The Richardson-Lucy algorithm and the constructed PSF model are used to deconvolute the three-channel grayscale images of the simulated image. After that, the restored grayscale images (Fig. 12) are combined to obtain a restored color image (Fig. 11). The grayscale mean gradient (GMG) function and the blind image quality index (BIQI) function are employed to evaluate the images before and after restoration (Table 3). The BIQI value of the R-channel grayscale image decreases by 5.00%, and the GMG value increases by 51.61% after restoration. The BIQI value of the G-channel grayscale image decreases by 5.44%, and the GMG value increases by 24.28% after restoration. The BIQI value of the B-channel grayscale image decreases by 1.23%, and the GMG value increases by 48.79% after restoration. The effectiveness of this method is proven by the evaluation results.ConclusionsThe design method in this paper can effectively improve the visible broadband imaging quality of the optical system with a single-layer diffractive optical element. The image obtained by restoration with the PSF model and the unrestored image are evaluated, and the evaluation results are as follows. Subjectively, the image quality after restoration is significantly improved as the image is clearer and has higher contrast. Objectively, the GMG function and the BIQI function are used for evaluation. The GMG evaluation value of the restored image increases by 40.33%, and the BIQI evaluation value decreases by 4.30%, which all indicate that the image quality after restoration is better. The simulations show that this method can be used in the design of a system with a single-layer diffractive element in the visible broadband.
ObjectiveThe rapid development of micro-nano fabrication technologies enables the synthesis of various optical metamaterials with complex microstructures. The size or component ratio of optical metamaterials can be tuned to control the dielectric properties of optical metamaterials in a wide range. Therefore, analyzing the effective optical parameters of metamaterials has always been a core issue in electromagnetic computing. It is known that the traditional analysis methods for effective optical parameters of composite materials include Maxwell-Garnet effective medium theory and Bruggeman effective medium theory. However, they can only analyze the cases with a small difference between the dielectric constants of the doped and background crystals. When such a difference is large, the error of effective permittivity given by the effective medium theory becomes large as well. This work uses the transfer-matrix method to analyze the effective permittivity of optical metamaterials and discusses the application scope of the effective medium theory.MethodsFor convenience, we assume that the nanocrystals are periodically doped into the background crystal to form a composite system and the nanocrystals and background crystal are isotropic. These allow us to use the transfer-matrix method to calculate the transmission spectrum of the composite system, and then obtain the effective dielectric constant of the composite system by comparing the transmission spectrum of the original structure with that of the equivalent crystal. The matching degree between equivalent transmission spectrum and original transmission spectrum is measured by the coefficient of determination R2. A larger value of R2 means the effective dielectric constant is more accurate.Results and DiscussionsThis work analyzes the dependence of the effective dielectric constant of composite crystals on the dielectric constant of each component, the geometry parameters of composite crystals, and the light wavelength. The comparison of the effective dielectric constants obtained from the transfer-matrix method and the Bruggeman effective medium theory separately indicates that the Bruggeman effective medium theory is indeed only applicable to the case with a small difference between the dielectric constants of the doped and background crystals (Fig. 3). The effective permittivity given by Bruggeman effective medium theory only relates to the volume fraction of nanocrystals and is independent of the light wavelength (Fig. 2 and Fig. 4). However, it is found that the effective dielectric constants rely on the light wavelength after the comparison of the equivalent transmission spectrum and the original transmission spectrum by the transfer-matrix method (Fig. 5). In particular, there is no effective dielectric constant at the optical band gap of the composite system due to the scattering of optical lattices.ConclusionsWhen the difference between the dielectric constants of nanocrystals and background crystal is small, the effective dielectric constant of the composite system is consistent with the result of Bruggeman effective medium theory. However, when the wavelength dependence of the effective dielectric constant is considered, the effective medium theory can be extended to the case with a large difference. This can broaden the application scope of the effective medium theory. It is also found that there is no effective dielectric constant at the optical band gap of the composite system as a homogeneous material has no band gap. These conclusions can provide theoretical guidance for research on the optical properties of composite materials and help determine whether the effective medium theory is applicable.
ObjectiveIn recent years, with the rapid development of e-commerce and computer, online shopping is more and more popular. In the meantime, the development of quantum algorithms makes the traditional e-payment protocols based on difficult mathematical problems more and more insecure, so the e-payment protocols based on quantum algorithms come into being. At present, most of the proposed quantum e-payment protocols use entangled states for quantum electronic signature protocols. However, the preparation and measurement of entangled states are very difficult, so in the case of ensuring the security of the protocols, using quantum states featuring more convenient preparation and measurement, instead of entangled states, has become a research direction of e-payment. Quantum walk is a technology that can produce the necessary entanglement resources spontaneously only by using the single-particle states without preparing entanglement resources in advance. This technology has been widely used in quantum computing and quantum simulation and is of certain practical value. At the same time, as people pay more attention to personal privacy, only users' shopping lists being confidential to banks have been unable to meet people's privacy needs. Therefore, in order to solve the above problems, we modify a classic e-payment agreement model and make the hidden users' identity information not affect the normal delivery and merchants. Furthermore, we combine the quantum walk with quantum e-payment and propose a quantum e-payment protocol to ensure that entanglement resources can be obtained without preparing entangled states in advance and guarantee that the buyers' bank accounts and real identity information can be kept confidential to merchants.MethodsQuantum walk is an extension of random walk in the quantum field. It takes the quantum as the carrier to simulate the chaotic nonlinear dynamic walk behavior. According to the characteristics of the quantum walk, the encrypted quantum communication channels are established accordingly. The quantum walk mainly contains the complex Hilbert space of two main quantum spaces, namely, coin space and position space. The protocol is based on the one-dimensional quantum walk teleportation, and through the two-step quantum walk, the shift operator can make the position space and coin space entangle with each other, so as to construct quantum channels for information transmission. The biggest advantage of quantum walk technology is that it can obtain the entanglement resources through the single photon operation. The measurement and preparation of the protocol are simpler compared with directly operating entangled states, and the randomness of the quantum walk makes the transmission more secure. In addition, by dividing the shopping information of buyers into the identity information accessible to the banks and making the shopping list open to the merchants, the banks and the merchants in the protocol will not know the information obtained by the other party so that the privacy of the buyers is greatly protected.Results and DiscussionsFirstly, in order to further protect the users' privacy, we modify a classic electronic payment agreement model (Fig. 1). In this model, we reduce the workload of buyers and give the processing and distribution of information to third-party platforms. While keeping the buyers' shopping lists confidential to the banks, the buyers' identity information is also unavailable to the merchants. So this protocol makes the merchants and the banks only have the information that they need and know nothing of the information obtained by the other party. Secondly, quantum walk technology is applied to various stages of the protocol including the trading purchase phase, trading payment phase, and verifying phase (Fig. 2). By applying quantum walk technology, the complexity of quantum resource preparation and measurement in the protocol is reduced. Finally, the security analysis of this protocol is conducted (Fig. 3), and the result shows that neither the internal nor external attackers of this protocol can obtain the secret information in the protocol, and this protocol can resist both internal and external attacks.ConclusionsThis protocol, compared with the existing quantum e-payment protocols, not only retains the third-party platforms and the inter-bank payment function but also combines the quantum walk and electronic payment. It makes the participants of the protocol in the initial stage free from preparing particles in entangled states and makes them only prepare the single-particle states which can get the required entanglement resources. This move reduces the complexity of quantum state preparation and measurement. At the same time, the shopping information of the buyers is divided, with the information of the purchased goods confidential to the banks and the buyers' private information unavailable to the merchants. In addition, when the merchants really need this part of the information of the buyers, they can apply to third-party platforms for the information. Being reviewed by the platforms and approved by the buyers, the merchants can know the information they want, so as to complete the corresponding operation. Finally, security analysis shows that this protocol can resist internal and external attacks and is safe and feasible under current technology.
ObjectiveFiber optic hydrophones are a kind of underwater acoustic information sensor built on optical fiber and optoelectronic technology platform. They mainly use optical coherence detection technology to convert an underwater acoustic signal into an optical signal and transmit it to the signal processing system through optical fiber so that useful sound data can be obtained. They have the advantages of high sensitivity, wide dynamic range, resistance to electromagnetic dry radiation, flexible structure, being ready to form large-scale arrays, and being suitable for extremely harsh conditions. Thus, since their advent, they have developed rapidly under the impetus of huge military strategy and civilian value and become an important development direction of modern optical sensing technology and underwater acoustic sensing technology. In recent years, with the increase in the frequency of maritime shipping and seabed mining activities, there are higher requirements for the detection ability of underwater targets, and the research focus of fiber optic hydrophones has gradually moved closer to the array multiplexing technology. However, as one of the key technologies of the underwater acoustic detection system, the hydrophone unit technology cannot be ignored, and the probe technology is particularly important. Fiber optic hydrophone probes will be deformed by the hydrostatic pressure in a deep-sea environment, which affects the detection performance of underwater acoustic signals and even makes the probe unstable and cannot continue to operate in the deep-sea environment. For the sake of ensuring that the hydrophones can work stably and effectively, a high-precision shape measurement method is urgently needed to provide an accurate and reliable approach to detecting the structural deformation of the fiber optic hydrophone probe. Traditional electrical sensors are difficult to be used for the deformation monitoring of hydrophone probes due to factors such as size and electromagnetic interference. Fiber Bragg grating cannot perform the fully distributed monitoring of small fiber optic hydrophone probes due to low spatial resolution. In response, this paper proposes a method with high spatial resolution and high precision based on optical frequency domain reflectometry to monitor the deformation of the hydrophone probe.MethodsIn the experiment, two protection methods are adopted to improve the pressure resistance of the probe, namely covering probe 1 with soft rubber and encapsulating probe 2 by a metal skeleton. The optical fiber is tightly wound on the surface of the hydrophone probes. To make the probes pressurized as evenly as possible, we use a special metal pressure tank, which can be filled with water to simulate an actual water pressure environment. After setting the system parameters, we gently place the two hydrophone probes protected by different methods in the pressure tank and fix them at the same position. Then, we gradually increase the pressure distribution in the tank to 0.5, 1.0, 2.0, 3.0, 4.0, 5.0, and 6.0 MPa. The self-developed distributed optical fiber shape monitoring analyzer is used to measure the wavelength shift of the optical fiber Rayleigh scattering spectrum due to the deformation of the probes in two different protection modes.Results and DiscussionsAffected by external pressure, the deformation of the hydrophone probes by extrusion will cause the optical fiber wound on the thin-walled cylinders of the probes to shrink inward, which induces the optical fiber to strain and results in a "blue shift" of the Rayleigh backscattering spectrum in the optical fiber (Fig. 6). Then, the two-dimensional shape reconstruction of the probes is realized using the relationship of the spectral wavelength shift, strain, and the radius of the probe cylinder by the method of inverse integration (Fig. 9). The results show that the diameters of the hydrophone probes gradually decrease with hydrostatic pressure increasing, and there is an approximately linear relationship (Fig. 7), with periodic depressions appearing in the circumferential direction. When the hydrostatic pressure reaches 6 MPa, the depth of three periodic depressions is up to 124 μm (Fig. 10). It is further verified that the performance of the probe encapsulated by a metal skeleton is slightly better than that of the probe covered with soft rubber. The experimental results are consistent with the simulation results of pressure resistance based on ANSYS (Fig. 5).ConclusionsIn the present study, we propose a method for measuring the deformation of fiber optic hydrophone probes based on optical frequency domain reflectometry. The pressure analysis of the probe with ANSYS indicates that there are three periodic depressions in the circumferential direction of the probes under static pressure. In terms of theoretical research, we establish a hydrophone probe deformation reconstruction method based on the wavelength shift in the optical fiber Rayleigh scattering spectrum. In terms of experiments, the optical fiber is tightly wound on the surface of the fiber optic hydrophone probes to sense the strain generated by the probe deformation. The high-precision distributed optical fiber shape measuring instrument independently developed by the laboratory is used to measure the wavelength shift of the optical fiber Rayleigh scattering spectrum with static pressure, and the deformation of the hydrophone probes under static pressure is further reconstructed. The experimental results show that when the static pressure reaches 6.0 MPa, the circumferential depression depth of the hydrophone probes is up to 124 μm. This research provides powerful support for the development and optimization of the material and structure of fiber optic hydrophone probes, which can thereby reduce the cost and cycle of developing hydrophone probes.
ObjectiveOrganic light-emitting diode (OLED) technology has attracted extensive attention due to its increasing demand in the fields of full-color flat-panel display and lighting. In general, the primary colors, i.e., red, green, and blue, are required for full-color display or white OLED (including solid-state lighting). In particular, the material that can emit blue light plays an important role in color temperature management and the color rendering index. Therefore, many studies on new blue light materials have been conducted for higher efficiency and better performance. In recent years, a new class of imidazolyl materials, hydroxyl-substituted tetraphenylimidazole (HPI) and its analogs, have attracted more and more attention because they can be used not only as a blue light material but also as a probe to detect hydrogen sulfide, arsenite ions, and fluoride ions. In this paper, the electron donor substituents, 9,9-dimethyl-9,10-dihydroacridine (DMAC), triphenylamine (TPA), 10H-phenothiazine (PTZ), 10H-phenoxazine (PXZ), phenyl carbazole (PCz), and 5H-indole [3,2,1-de] phenazine (InPz) are used to disubstitute the 3,5 positions of N-phenyl of hydroxy-tetraphenylimidazole. As a result, six hydroxy-tetraphenylimidazole derivatives are obtained. After that, their electronic structures and photophysical properties are studied with density-functional theory (DFT) and time-dependent density-functional theory (TDDFT). In addition, as the compounds containing electron-rich groups, such as triphenylamine and carbazole, are often used as hole transport materials, we also investigate the possibility of the six derivatives as hole and electron transport materials.MethodsThe first step is to verify the accuracy of functionals. Specifically, B3LYP, PBE0, and CAM-B3LYP functionals combined with the 6-31G(d, p) basis set are used to optimize the ground-state and the first single-excited-state geometries of experimentally synthesized HPI-TPA and HPI-PCz. The absorption and emission spectra are calculated. For HPI-TPA and HPI-PCz, the calculated results obtained by B3LYP and CAM-B3LYP functionals are significantly different from the experimental values, while those obtained by PBE0 are close to the experimental values. The same trends are reflected in emission spectra. Therefore, the PBE0 functional is used in the subsequent calculations. Then, the PBE0 functional combined with the 6-31G(d, p) basis set is used to optimize the geometries of the six hydroxy-tetraphenylimidazole derivatives. Given the optimized geometry, the ionization potentials (IP), electron affinity potentials (EA), hole extraction potentials (HEP), electron extraction potentials (EEP), hole reorganization energy λhole, and electron reorganization energy λelectron can be calculated. Finally, the excited-state geometries of the six derivatives are optimized by the TD PBE0/6-31G(d, p) method, and the absorption and emission spectra of the studied molecules are calculated by the same method.Results and DiscussionsAccording to the Kohn-Sham frontier orbitals and the contribution of electron density for HPI-TPA, HPI-PTZ, HPI-PXZ, and HPI-InPz, the electron clouds of the highest occupied molecular orbits (HOMOs) are mainly located on the R-down group, and the HPI and R-up groups almost do not contribute to HOMOs. For HPI-PCz, the contribution of the HPI group to HOMOs is 99.3%, while the contributions of the R-up and R-down groups are almost zero. For HPI-DMAC, the contribution of the R-up group to HOMOs is 100.0%, while the contributions of the HPI and R-down groups are zero. In contrast, for HPI-TPA, HPI-PTZ, HPI-PXZ, and HPI-InPz, the contributions of the R-down group decrease from 98.8%, 100.0%, 99.9%, and 100.0% in HOMOs to 42.7%, 22.1%, 23.0%, and 23.4% in lowest unoccupied molecular orbits (LUMOs), respectively. For HPI-PCz, the contribution of HPI decreases from 99.3% in HOMO to 53.4% in LUMO. For HPI-DMAC, the contribution of the R-up group decreases from 100.0% in HOMO to 24.5% in LUMO. This shows that there is a lot of electron transfer from HOMO to LUMO. In addition, the results of HOMO energies, LUMO energies, HOMO-LUMO gaps, ionization potentials, and electron affinities demonstrate that HPI-TPA, HPI-DMAC, HPI-PTZ, HPI-PXZ, and HPI-InPz show good hole transport ability, and HPI-PTZ, HPI-PXZ, and HPI-InPz also show good electron injection ability. Moreover, it is found that the HOMO-LUMO energy gaps of the studied compounds gradually narrow along the order of TPA, PCz, DMAC, PTZ, PXZ, and InPz. This indicates that the electronic transition ability of hydroxy-tetraphenylimidazole derivatives can be regulated by substituents. The absorption and emission spectra show that for HPI-DMAC, HPI-PTZ, HPI-PXZ, and HPI-InPz, the S1→S0 electronic transition is forbidden because the oscillator strengths are almost zero. HPI-TPA and HPI-PCz can emit bright blue light.ConclusionsIn this paper, the photophysical properties of six disubstituted hydroxy-tetraphenylimidazole derivatives are studied by the TD PBE0/6-31G(d, p) method. The results show that there is a lot of electron transfer in all molecules during the transition from HOMO to LUMO. HPI-PTZ, HPI-PXZ, and HPI-InPZ have strong hole and electron injection abilities. The HOMO-LUMO energy gaps gradually narrow along the order of TPA, PCz, DMAC, PTZ, PXZ, and InPz. This indicates that the electronic transition capacity of hydroxy-tetraphenylimidazole derivatives can be regulated by substituents.
ObjectiveThe framing camera is a two-dimensional (2D) ultrafast diagnostic device with high spatio-temporal resolution. In inertial confinement fusion (ICF) experiments, it can effectively acquire the duration and dynamic images at the stage of implosion compression. The pulse dilation framing camera is a new ultrafast diagnostic device with temporal resolution better than 10 ps. Firstly, this paper loads the dilating pulse between the photocathode (PC) and grid to achieve greater acceleration energy of the front edge of electron beams. Then, the temporal width of the electron beam is dilated through long-distance transmission. Finally, the dilated electron beam signal is measured by the microchannel plate (MCP) framing camera, and the temporal resolution is exponentially improved. However, in the pulse-dilation framing camera, with the transmission of dilating pulse along the PC, the voltage at different positions on the PC is changed, which results in temporal non-uniformity. This is one of the main factors restricting the development of framing cameras with large detection areas. To improve the restriction of temporal non-uniformity of the pulse-dilation framing camera, the gating pulse with picoseconds is designed, and the improvement of the temporal uniformity is studied by simultaneously loading the falling edge of the gating pulse and dilating pulse on the PC, which is based on the variational phenomenon of voltage during the transmission of dilating pulse along the PC.MethodsThis paper first deduces the computational equation of the dynamic dilating ratio of the electron beam along the PC by analyzing the causes of temporal non-uniformity and combines the principle of temporal dilation and the transmission characteristics of the electric pulse along the PC. Then, the high-voltage gating pulse with picoseconds is designed by the three-stage Marx pulse generator and the pulse shaping circuit. The Marx pulse generator is realized by the series and parallel of avalanche triodes, and the pulse shaping circuit is made up of the avalanche diode and the two-stage high pass filter with LC. In addition, based on the electric pulse superposition technology and the voltage variation characteristics of dilating pulse transmission along the PC, the improvement of temporal non-uniformity is studied with the optimization of the PC voltage distribution by simultaneously loading the falling edge of the gating pulse and the dilating pulse on the PC. Finally, when the falling edge of the gating pulse is loaded or not loaded on the PC, the temporal uniformity is numerically compared by calculating the dilating ratio of electron beams along the PC, and the temporal uniformity improvement is quantized via the difference percentage between the sampling points.Results and DiscussionsThe picosecond pulse generator [Fig. 2(a)] is designed by the series and parallel of avalanche triodes, the series of avalanche diodes, and the two-stage high pass filter with LC. The gating pulse with an amplitude of -2.59 kV and full width at half maximum of 236 ps is obtained, and its rising and falling edges are 217 ps and 204 ps respectively [Fig. 2 (b)]. Temporal uniformity improvement is analyzed when the falling edge of the gating pulse is loaded or not loaded on the PC and then quantized by the difference percentage between the sampling points [Fig. 4 (d)]. While the falling edge of the gating pulse is not loaded on the PC, the dilating ratio of the electron beam along the PC increases from 11.74 to 39.04, and the difference percentage is 232.5%. When the falling edge is loaded, the dilating ratio rises from 11.28 to 14.23, and the difference percentage is descended to 40.21%. The temporal uniformity of the pulse-dilation framing camera is improved by loading the falling edge of the gating pulse.ConclusionsThe Marx pulse generator is designed by series and parallel of avalanche triodes. The high-voltage picosecond circuit is designed with avalanche diodes and high pass filters, and the high-voltage picosecond gating pulse is generated. Based on the pulse superposition technology, the temporal uniformity of the pulse dilation framing camera is improved by the falling edge of the gating pulse. The results show that when the PC voltage is -2 kV, the initial width of the electron beam is 5 ps, and the gradient of dilating pulse is 11.9 V/ps, with the transmission of the dilating pulse along the PC, the voltage is changed from -4.48 kV to -2.47 kV, and the dilating ratio of the electron beam grows from 11.74 to 39.04 with the difference percentage of 232.5%. When the falling edge of the gating pulse with the gradient of 12.7 V/ps is simultaneously loaded on the PC, the voltage along the PC is changed from -4.62 kV to -4.97 kV, and the dilating ratio of the electron beam rises from 11.28 to 14.23. The difference percentage is descended to 40.21%, and the temporal uniformity is improved. This study can provide an effective method for improving the temporal non-uniformity of pulse-dilation framing cameras, and a theoretical reference for the development of 10 ps framing cameras with large detection areas.