


Please enter the answer below before you can view the full text.
8+6=

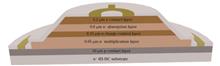
Results and Discussions During the operation of APDs, the uniform distribution of the electric field in the depletion region is a key factor affecting the stability and reliability of the APDs. Therefore, the regulation of electric field distribution by the structure of APDs needs to be considered during APD fabrication. The electric field distribution of the APD at avalanche state is simulated by Silvaco to verify the suppression effect of the SiC SACM APD with a beveled partial mesa structure on the edge electric field (Fig. 2). The results show that partial mesa etching can effectively suppress the peak edge electric field of SiC SACM APDs, and the SACM APD fabricated in this study is a reach-through SACM APD as a high electric field punches through all the active layers. The SACM APD with a partial mesa structure achieves a fill factor of about 58%, which is 1.6 times that of the conventional SACM APD. The current-voltage curves of the reach-through SiC SACM APD and the SiC positive-intrinsic-negative (PIN) APD (Fig. 3) show that the avalanche current of the reach-through SiC SACM APD increases slower than that of the SiC PIN APD. The reverse bias voltage applied to the device does not completely act on the multiplication layer. A small change rate of the electric field intensity at the multiplication layer results in a slow increase in the avalanche current with the voltage, which is beneficial to improving the voltage withstanding performance of the device. In addition, the dark count rate of the reach-through SiC SACM APD is only 0.5 Hz/μm2 when the over-bias voltage is 4 V, and the single-photon detection efficiency of the device reaches 8.4% when the dark count rate is 1 Hz/μm2 (Fig. 5). The low carrier tunneling probability and high photon avalanche probability of the device lead to the low dark count rate and high single-photon detection efficiency of the punch-through SiC SACM APD, and they all contribute to the extension of the electric field to the absorption layer.ObjectiveAs a weak ultraviolet (UV) detector with unique advantages, SiC avalanche photodiodes (APDs) are imperative in many key fields, such as environmental monitoring, corona detection, missile plume detection, deep space detection, and ultraviolet communication. A SiC APD is highly susceptible to irreversible thermal breakdown as its current is extremely sensitive to the bias voltage when it works under the condition of a critical electric field. Therefore, the overbias voltage withstanding capability of a SiC APD is a key issue affecting the working stability of the APD. In addition, the dark count rate is an important parameter that determines the detection sensitivity of the APD in weak UV detection. However, the reported SiC APDs exhibit low overbias voltage withstanding capabilities and high dark count rates. SiC APDs with high overbias voltage withstanding capabilities and low dark count rate have been designed and fabricated in this study.MethodsIn this study, SiC separated-absorption-charge-multiplication (SACM) APDs have been designed and fabricated. The SiC APDs are fabricated on n+ type 4H-SiC substrates (Fig. 1). The epitaxial structure of the SiC APDs consists of a 10-μm p type contact layer, a 0.65-μm n- type multiplication layer, a 0.15-μm n type charge control layer, a 0.6-μm n- type absorption layer, and a 0.2-μm n type contact layer from bottom to top. The fabrication process starts with mesa etching down to the multiplication layer (to an etching depth of 1.05 μm) by inductively coupled plasma etching. The photoresist reflow technique is employed to obtain a positive beveled mesa (with a small slope angle of about 5°) and thereby prevent mesa edge breakdown. Then, the epitaxial wafer is etched to the bottom contact layer. Subsequently, the APD surface is passivated by a thermal oxidation layer and then by a SiO2 layer deposited by plasma-enhanced chemical vapor deposition. Both the n-type and p-type Ohmic contact electrodes adopt Ni/Ti/Al/Au (35 nm/50 nm/100 nm/100 nm) layers deposited by e-beam evaporation. Finally, the epitaxial structure is annealed by rapid thermal annealing at 850 ℃ for 3 min in N2 atmosphere.ConclusionsIn this study, a reach-through SiC SACM APD is designed and fabricated. When the device undergoes avalanche breakdown, the electric field extends from the multiplication layer to the absorption layer and the charge control layer. The change rate of the electric field at the multiplication layer decreases, and the avalanche current exhibits a smaller slope accordingly, which is conducive to improving the over-bias voltage withstanding capability of APDs. Moreover, APDs with a small-slope avalanche current can alleviate the breakdown voltage fluctuation among the pixels in the UV imaging array, which is of great significance for high-quality weak UV imaging. In addition, partial mesa etching adopted for the SiC SACM APD designed in this study not only ensures the reliable operation of the device but also increases the fill factor of the device to about 60%, which is beneficial for improving the integration level of imaging array chips.
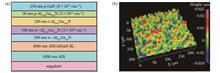
Results and Discussions The dark current and photocurrent of the SB-PIN device are both smaller than that of the PIN device under a UV light (275 nm) with a power density of 100.9 μW/cm2. Under a bias voltage of -10 V, the maximum responsivity is 0.12 A/W, and the external quantum efficiency is more than 50%. Different from the PIN device, in a positive bias voltage (+2.5 V-+10 V), the photocurrent of the SB-PIN device is larger than the dark current, and as the bias voltage increases, the change is more and more obvious. Under a bias voltage of +10 V, the photocurrent to dark current ratio is up to 15 times, and the maximum responsivity is 10 A/W.The external quantum efficiency is over 4500%, and the detectivity reaches up to 5×1010 cm·Hz1/2·W-1. Due to the existence of the Schottky barrier on the surface, the SB-PIN device also responds to a UV light of 365 nm.Under a 365 nm LED with a power density of 100.9 μW/cm2 and a bias voltage of +10 V, the maximum responsivity is 14.4 A/W, and the external quantum efficiency is more than 4800%. The detectivity reaches 8×1010 cm·Hz1/2·W-1 (Fig. 2). By exploring the relationship between the responsivity and bias voltage and the incident optical power (Fig. 3), it is explained that the operating mechanism of the SB-PIN device is photoconductive under a positive bias voltage (≥5 V) and a UV light of 275 nm and 365 nm, respectively. The response speed τrise equals 2.0 ms (275 nm) and 2.3 ms (365 nm), respectively (Fig. 4). Under a UV light of 275 nm and a negative bias voltage, the operating mechanism is photovoltaic, and the response speed τrise equals 190 μs (Fig. 4).ObjectiveSolar blind ultraviolet (UV) detectors based on AlGaN ternary compound semiconductors have attracted much attention due to their great application potential in fields such as precision guidance, missile warning, spacecraft tracking, open flame monitoring, bioimaging, and UV secure communication. In increasingly complex target environments and short-range non-line-of-sight optical communication systems, UV detectors with high sensitivity and wide working bandwidth are required. At the same time, new material structure designs and device structure research make the UV detectors have higher performance and wider application. In this work, metal Pt with a work function of 5.36 eV is deposited on the surface of a p-GaN layer with a work function of 7.5 eV on the upper surface of GaN/AlGaN material without annealing. The Schottky contact is formed to replace the Ohmic contact formed by the traditional deposition of Ni/Au, Ti/Pt/Au, and other multilayer metals in an AlGaN-based PIN device and annealed at a high temperature. The p-GaN material forms a Schottky barrier with an energy band bending downward on the side contacting with Pt and combined with the PIN structure of the AlGaN material itself. An SB-PIN heterojunction structure is formed in the device, which changes the energy band, the built-in electric field, and the carrier transport mechanism of the device compared with PIN and SBD devices and results in a new operating mechanism and photoelectric characteristics of the device. The device has a high responsivity under a positive bias voltage and realizes dual-band detection (275 nm and 365 nm).Methods The fabrication process of the device proposed in this work is as followsAfter the wafer cleaning, a device mesa with a diameter of 700 μm is defined by reactive ion etching (RIE). Ti/Al/Ni/Au metal layers are deposited on the n+-AlGaN layer by an e-beam evaporator, and the sample is then annealed at 550 ℃ to form an ohmic contact. Then, SiO2/SiNx composite dielectric film is grown to passivate the side wall of the device and the n+-AlGaN surface of the lower mesa surface to reduce surface leakage. After the window in the upper mesa surface is opened by lithography and etching process, Pt is deposited on the surface of the p-GaN layer to form a device with an SB-PIN structure. In order to compare the differences between the device prepared in this work and the traditional PIN device, a traditional PIN device is simultaneously fabricated with the same AlGaN material. The PIN device is prepared by depositing multiple layers of Ni/Au/Ni/Au metal on the p-GaN surface of the upper mesa surface after a lower electrode is prepared, and then an Ohmic contact upper electrode is developed after rapid annealing at 850 ℃ in O2 atmosphere. Finally, the device is prepared after passivation film growth and electrode opening.ConclusionsThe UV photodetector based on Pt/p-GAN/AlGaN heterojunction proposed in this paper can realize dual-band (solar blind UV and visible blind UV) detection, and the device can be switched between photovoltaic and photoconductive modes by adjusting the bias voltage. In negative bias voltage, the PIN barrier becomes stronger, and the external voltage drop mainly acts on the PIN depletion region. The surface Schottky junction is smaller. As the direction of the external electric field and the Schottky junction electric field is opposite, the Schottky junction which reduces the resistance of photon-generated carriers under a light of 275 nm is weakened. The device has a responsivity and detectivity that are slightly smaller than those of the PIN structure detector, which can be used as a high-speed solar blind UV photovoltaic detector. Under a high positive bias voltage, the direction of the Schottky junction built-in electric field and the external electric field is the same, and the band bending of p-GaN contacting with Pt is stronger.At the same time, the PIN depletion region is narrowed, which makes the overall built-in electric field of the device smaller andlets transmission and collection of photon-generated carriers controlled by the external electric field. As a result, the device operating mechanism is changed to the photoconductive mode, and the detector operates as a high-sensitivity, high-gain, solar-blind, and vision-blind UV photoconductive detector, which makes the proposed UV photodetector more promising for dual-band, high-speed, and high-gain applications.
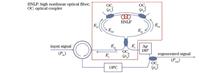
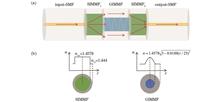
Results and Discussions According to the PTF and amplitude-to-phase conversion characteristics, the phase-preserving mechanism of the OPC-NOLM regenerator is analyzed from the two aspects of amplitude and phase. The results show that the proportion of nonlinear components in the OPC-NOLM regenerator has been kept as small as possible to achieve intact PPAR. The OPC compensates for the phase perturbation at the transmission end by using the phase of the reflecting end to reduce the phase perturbation of the final output to almost zero. The structural parameters of the OPC-NOLM regenerator are optimized, including those of the MZI-nested NOLM, the gain of the OPC, and the coupling ratios of the transmission and reflecting ends of the NOLM. The detailed steps are summarized in the paper. The optimized results show that the OPC-NOLM regenerator introduces a phase perturbation of 0.002° (Fig. 3), which is smaller than that of the NOLM structure (at least 4.4°) and the references (at least 3.8°). Regarding the OPC-NOLM regenerator, the intact phase preservation can be attributed to the suppression of the amplitude noise and the compensation for phase perturbation.Then, a 16QAM coherent communication system is built to simulate and verify the PPAR performance of the OPC-NOLM regenerator. The parameter of noise reduction ratio (NRR) is defined as the ratio of the input error vector magnitude (EVM) of the OPC-NOLM regenerator to the output EVM of the regenerator. The variation in the NRR with the input SNR indicates that when the input SNR is 15 dB, the NRR of the OPC-NOLM regenerator is 3.8 dB higher than that of the NOLM structure (Fig. 6).Finally, some relevant regeneration structures are listed in Table 1 for a comparison of their numbers of voltage levels available for amplitude regeneration related to the PTF and their phase-preserving performance. This table reveals that the OPC-NOLM structure proposed in the paper not only supports multi-level amplitude regeneration but also gains an advantage over other structures in phase preservation.ObjectiveAmid the rapid development of modern communication networks, high-order modulation formats, such as quadrature phase shift keying (QPSK) and quadrature amplitude modulation (QAM), have been used widely for large capacity and high-speed data transmission. However, compared with binary signals, high-order modulated signals are easily degraded by channel crosstalk noise and amplified spontaneous emission (ASE) noise. In this case, all-optical regeneration technology can help improve the optical signal-to-noise ratio (OSNR) directly in the optical domain. All-optical amplitude or phase regeneration can usually be achieved by some optical structures with nonlinear effects, such as the nonlinear optical loop mirror (NOLM), the Mach-Zehnder interferometer (MZI), the phase-sensitive amplifier (PSA), and the semiconductor optical amplifier (SOA). In the process of all-optical amplitude regeneration, the conversion of amplitude noise to phase perturbation is always adopted to a certain extent. Therefore, phase-preserving amplitude regeneration (PPAR) schemes have been put forward for QPSK and QAM signals. Nevertheless, phase perturbation (larger than 3.8°) remains. The objective of the paper is to present an intact PPAR scheme without phase perturbation.MethodsThis paper proposes an optical phase conjugator (OPC)-assisted NOLM (OPC-NOLM) PPAR scheme, in which the reflected signal from the NOLM unit is used to achieve a stepwise power transfer function (PTF) and the OPC is utilized to compensate for the phase perturbation. The optical field output from the OPC-NOLM regenerator is derived and used to analyze the phase-preserving mechanism of the regenerator from the two aspects of amplitude and phase. The structural parameters of the OPC-NOLM regenerator are optimized by the PTF and phase perturbation curves. Then, an OPC-NOLM regenerator simulation platform for optical 16QAM signals is built to verify the intact PPAR performance of the proposed scheme by comparison with the NOLM scheme.ConclusionsTo further eliminate the residual phase perturbation of the currently available PPAR schemes, this paper proposes a novel OPC-NOLM scheme capable of intact phase preservation for input signals. The optical field output from the OPC-NOLM regenerator is derived and then used to explain the phase-preserving mechanism of the regenerator from the two aspects of amplitude and phase. According to the PTF and phase transfer curves of the OPC-NOLM regenerator, this paper optimizes the structural parameters of the regenerator and calculates its phase perturbation (0.002°). With 16QAM signals as an example, the NRR performance of the OPC-NOLM regeneration scheme is simulated. According to the simulation results, the proposed scheme achieves an NRR 3.8 dB higher than that of the NOLM structure without the OPC under an input SNR of 15 dB.
Results and Discussions The experimental results show that the intensity of the interference peak in the transmission spectrum of the designed sandwich multimode fiber interferometer is very sensitive to micro-bending (Fig. 4). For sensors with different GIMMF lengths, the bending response of the characteristic peaks is different, but mainly shows the intensity change. When the GIMMF length is 2 mm within the curvature range of 0-2.36 m-1, the characteristic peak intensity changes by 25 dB, with the most obviously changed overall intensity, largest linear region range, and maximum sensitivity up to 18.23 dB/m-1. Therefore, a sandwich multimode fiber interferometer with the GIMMF length of 2 mm is selected for subsequent respiratory experiments. The study of respiratory signal noise reduction by low-pass filtering shows that this method can filter out most noise in respiratory signals (Fig. 6). Experimental studies for respiratory sensing indicate that the sensor can distinguish different types of respiratory conditions with universal applicability (Figs. 7-9). For steady-state respiratory signals with periodic regularity, it is accurate and effective to evaluate respiratory frequency by the dominant frequency in the fast Fourier transform (FFT) results of original respiratory signals (Fig. 7). For non-steady-state respiratory signals, the volunteers' respiratory rates can be displayed in real time using the STFT (Fig. 10). Finally, the performance comparison among the proposed sensor and other optical fiber respiratory sensors shows that the proposed sensor is characterized by extremely compact structure, high sensitivity, good stability, long service life, and anti-electromagnetic interference (Table 1).ObjectiveClinical data have demonstrated that respiratory rate (RR) is an important predictor of serious diseases including heart defects, heart failure, metabolic acidosis, and sleep apnea syndrome. Much important information related to physical conditions can be obtained by analyzing respiratory data. Flexible wearable devices can meet the needs of clinical medicine and health monitoring, which have attracted extensive attention. The most popular respiratory monitoring devices are based on electronic sensors, and cannot be employed in electromagnetic interference environments such as magnetic resonance imaging and computed tomography. In this regard, fiber optic sensors featuring high sensitivity, electromagnetic interference resistance, and corrosion resistance can overcome these challenges. Wearable respiratory sensing devices based on fiber sensors are mainly divided into curvature sensing and humidity sensing according to the principles. For the respiratory monitoring devices based on the humidity sensing principle, the optical fiber sensors have to be coated with moisture-sensitive materials, which have disadvantages such as time-consuming functionalization processes, uneven coating, and poor long-term stability in different degrees. In contrast, the respiratory monitoring system based on the curvature sensing principle is simpler and more stable. However, the compactness and sensitivity of the sensor still have great room for improvement. An optical fiber curvature sensor with ultra-high sensitivity and more compact size using two types of multimode fibers with mismatched core diameters is designed in this paper. Then, the proposed sandwich multimode fiber interferometer is integrated into an elastic waistband for respiratory sensing. The respiratory monitoring device is expected to be widely applied, with great potential in strong electromagnetic fields, radioactive examination environments (such as magnetic resonance imaging system and computed tomography), and sleep quality monitoring.MethodsFirst, the proposed sandwich multimode fiber Mach-Zehnder interferometer is made by sandwiching the graded-index multimode fiber (GIMMF) between two pieces of very short stepped-index multimode fibers (SIMMFs) spliced with input-single mode fiber (SMF) and output-SMF, thus forming a SIMMF-GIMMF-SIMMF sensor structure. The core diameters of the SIMMFs and GIMMF are 105 μm and 50 μm respectively, and their cladding diameters are both 125 μm. Then, the effect of interference lengths on the curvature response of the SIMMF-GIMMF-SIMMF sensor is studied, and the optimal sensor parameters are selected according to the experimental results. After that, the designed interferometer is integrated into an elastic waistband with ultraviolet (UV) glue and fixed on the human abdomen. The respiratory signals of the volunteers are acquired in real time by monitoring the intensity changes of characteristic peaks in the transmission spectra of the sensor. The signals are denoised by low-pass filter, and the respiratory frequency is obtained by short-time Fourier transform (STFT). Finally, a series of respiratory sensing experiments (such as fast breathing, slow breathing, shallow breathing, and respiratory arrest) are conducted on multiple volunteers to verify the feasibility of the wearable respiratory sensor.ConclusionsIn this paper, a wearable respiratory sensor based on sandwich multimode fiber interferometer is proposed. The sensor unit is made by splicing a GIMMF with length of 1-3 mm between two SIMMFs with lengths of 1 mm. Due to the mismatching core diameters of GIMMF and SIMMF, the fiber Mach-Zehnder interference optical path is achieved. The interference peak intensity of the sensor is very sensitive to micro-bending, with a maximum sensitivity of -74.03 dB/m-1 at the curvature range of 0-2.36 m-1. Then, the sandwich multimode fiber optic interferometer is integrated into the elastic waistband and fixed on the human abdomen, and the respiratory signals can be obtained in real time accurately by monitoring the intensity change of the characteristic peaks in the transmission spectrum of the sensor. Experimental results show that the sensor can distinguish different respiratory conditions with universal applicability. The respiratory sensor is characterized by extremely compact structure, baseline drift without signals, high sensitivity, simple fabrication, low cost, easy integration, and electromagnetic interference resistance. It can be employed in strong electromagnetic fields or radioactive examination environments, such as magnetic resonance imaging systems and computed tomography.
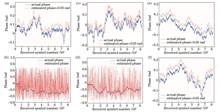
Results and Discussions In the dual-carrier PDM-16QAM FTN system, the Δf·Ts is set to 1×10⁻⁴. With the decrease of accelerating factor named α, the artificially introduced ISI will become more serious. The PA-Viterbi-ML algorithm can overcome the effect of ISI introduced by FTN when α does not exceed the Mazo limit, and effectively estimate the phase noise caused by the laser line-width (Fig. 7). Finally, the performance of the proposed algorithm and the traditional PA-CPR is compared. When the Δf·Ts is small, the OSNR penalties of both algorithms are almost the same. As the Δf·Ts increases, the OSNR penalty of the traditional PA-CPR is relatively higher (Fig. 9). This means that the linewidth tolerance of the proposed PA-Viterbi-ML algorithm is larger for the same OSNR penalty, and the OSNR penalty of the proposed algorithm is less for the same Δf·Ts. In addition, with the decrease of α, the performance advantage of the PA-Viterbi-ML algorithm is more significant. When α=0.850, Δf·Ts is 1×10⁻⁴, the OSNR penalty of the PA-Viterbi-ML algorithm is 0.02 dB lower than that of the PA-CPR algorithm. When α=0.833, Δf·Ts is 1×10⁻⁴, the OSNR penalty of the PA-Viterbi-ML algorithm is 0.28 dB lower than that of the PA-CPR algorithm. Compared with the traditional algorithm, the performance advantage of the PA-Viterbi-ML algorithm will become larger when the smaller value of α and the larger value of Δf·Ts are taken (Table 1).ObjectiveThe large-scale commercialization of 5G networks promotes the development of fiber optical communication, cloud computing, and Internet of Things technologies. To realize the optical communication systems with high capacity and high spectrum efficiency, higher-order modulation formats are required. However, the higher-order modulation formats require high signal-to-noise ratios (SNR) to ensure communication quality, which will limit the transmission distance. Within the same amount of time, the faster-than-Nyquist (FTN) technology can transmit more signals than the Nyquist system with the same modulation format. Thus, this technology becomes a key technology for the next-generation optical communication networks with the advantages of high spectral efficiency and large capacity. The inter-symbol interference is artificially introduced into the FTN system to make the symbol interval between two adjacent pulses much smaller than the corresponding Nyquist symbol period. Thus, high-speed digital signal processing (DSP) unit, which can equalize and compensate the signal impairments efficiently in electrical domain, is a key module in FTN systems. It can improve the signal quality and support the optical fiber communication systems with ultra-high capacity. Pilot-aided carrier phase recovery (PA-CPR) is an important DSP algorithm for optical receiver, which is used to compensate the frequency deviation between the lasers on both sides of the transceiver and the phase noise generated by the laser linewidth. In present study, we report a two-stage electric-domain pilot-aided carrier phase estimation algorithm, named PA-Viterbi-ML, in which the PA-CPR algorithm is combined with the Viterbi-based maximum likelihood (ML) estimation algorithm. The simulation results verify that the proposed two-stage PA-Viterbi-ML algorithm can effectively track the phase noise when the Mazo limit is not exceeded in the FTN-16QAM system.MethodsThe proposed PA-Viterbi-ML, which combines the PA-CPR algorithm with the Viterbi-based maximum likelihood estimation algorithm, can effectively overcome the intersymbol interference (ISI) introduced by FTN technology. The first stage of the algorithm can estimate and compensate most of the phase noise in FTN-16QAM system. In order to compensate the residual phase deviation, the ML phase estimation is used as the second stage of the phase recovery algorithm to obtain a more refined phase estimate value. However, the ML phase estimation will also fail under the influence of the ISI introduced by FTN system, so the Viterbi algorithm is cascaded with it to remove the influence of ISI, and the estimated value of the phase noise close to the real value is obtained. During the simulation, the pilot-signal-ratio (PSR) and the bandwidth of the low-pass filter (BLPF), two important parameters of the PA-Viterbi-ML algorithm, are optimized first to achieve the optimal system performance. Then, the performance of the proposed algorithm for tracking system phase noise within the Mazo limit is shown. Finally, the maximum linewidth tolerance of the algorithm is determined at the threshold of the bit error rate.ConclusionsIn the present study, a two-stage electric-domain pilot-aided carrier phase estimation algorithm, named PA-Viterbi-ML, is proposed, in which the PA-CPR algorithm is combined with the Viterbi-based maximum likelihood estimation algorithm. The PA-Viterbi-ML algorithm will occupy about 1.7% of the bandwidth, which can effectively overcome the ISI introduced by the FTN technology. The simulation is taken to verify that the proposed two-stage PA-Viterbi-ML algorithm can effectively track the phase noise when the Mazo limit is not exceeded in the FTN-16QAM system. The simulation results show that the OSNR penalty requirements of the proposed algorithm are smaller than those of the traditional PA-CPR when the linewidth tolerance values are the same, which means the performance of the linewidth tolerance of the proposed algorithm is better. The maximum linewidth tolerance value is defined when the BER and the OSNR penalty are equal to 2×10⁻² and 1 dB, respectively. When the accelerating factor α is as low as 0.833, the maximum linewidth tolerance value is about 5×10⁻⁴ for the PA-Viterbi-ML algorithm, and the corresponding value for the traditional PA-CPR algorithm is about 1×10⁻⁴.
Results and Discussions Compared with the traditional AdaBoost algorithm (Fig. 5), the proposed improved AdaBoost ensemble learning framework reduces the maximum compensation error by 9.28 pm and the standard deviation by 2.2 in the cooling-heating experiment. Compared with the common traditional machine learning-based algorithms, the improved AdaBoost ensemble learning framework also offers great advantages (Table 2). The results show that the improved AdaBoost model overcomes the low accuracy and instability of the traditional AdaBoost model in temperature compensation. In the iteration process of the improved AdaBoost, the weight coefficient of the current weak learner is reasonably redistributed according to the error rate difference between the current weak learner and the one generated by the last round of iteration by comparing the error rates of the two weak learners, so that a close correlation between each two adjacent weak learners can be achieved. In this case, the weight of a weak learner is no longer determined by its error rate alone. Instead, it is generated by the iteration rule of the traditional AdaBoost and then optimized according to the performance difference between the two adjacent weak learners. The performance of the final strong learner is thereby improved compared with that of the traditional AdaBoost. This point is also reflected in the wide-range temperature drift experiment (Fig. 9). The maximum error and the standard deviation of the basic AdaBoost are 15.83 pm and 4.83, respectively, while those of the improved AdaBoost are 4.99 pm and 1.40, respectively.ObjectiveThe random fluctuation of the fiber Fabry-Perot tunable filter (FFP-TF) is easily intensified by the variation of ambient temperature, ultimately reducing the accuracy of the fiber Bragg grating (FBG) demodulation system. At present, the common solutions are the demodulation method combining the Fabry-Perot (F-P) etalon with reference grating, the demodulation method based on composite wavelength reference with acetylene gas cell, and so on. Although these methods can improve the demodulation accuracy of the system to a certain extent, the added hardware greatly increases the cost of the demodulation system. In addition, these methods are susceptible to ambient temperature. This study proposes a novel software-supported FBG demodulation method based on an improved AdaBoost algorithm. Specifically, the AdaBoost ensemble learning framework is used to construct a temperature drift model of the tunable filter. In the iteration process of the traditional AdaBoost, the weight of the generated weak learner is directly determined by its error rate, with no direct correlation between each two adjacent weak learners. In other words, the performance of the current generated weak learner is not directly affected by the weak learner generated by the previous round of iteration, and it cannot directly affect the results of the next round of iteration either. Consequently, the performance of the generated weak learners is likely to be random, which is unfavorable for the performance of the ensemble model. To solve this problem, this study proposes a dynamic weight update strategy for weak learners based on their error rate differences to accurately compensate the F-P tunable filter.MethodsIn this study, the AdaBoost ensemble learning framework is utilized to compensate the demodulation system. Specifically, data on the temperature drift characteristics of the tunable filter in a variable temperature environment are obtained, and the characteristics and labels of the data are determined. Subsequently, the AdaBoost algorithm is used to model the data. The AdaBoost algorithm framework is improved, and weight update steps are added to the AdaBoost iteration process. After the weight update coefficient is calculated with the difference between the error rates of two adjacent weak learners, it is utilized to update the weight coefficient of the current weak learner and ultimately to obtain a close correlation between each two adjacent weak learners. Then, the temperature drift data are modeled in the improved AdaBoost algorithm framework, and the accuracy and stability of the improved model are verified in different variable temperature environments. Finally, the proposed improved algorithm is compared with the common machine learning-based algorithms in the same environment to verify the effectiveness of the proposed algorithm.ConclusionsBy modeling the temperature drift characteristics of the tunable F-P filter and improving the traditional AdaBoost ensemble learning framework, this study proposes a new dynamic weight update strategy based on the error rate differences among weak learners. Furthermore, experiments of temperature drift compensation are carried out in two environments: cooling-heating and cooling. The wavelength shift of the tunable F-P filter is accurately compensated in variable temperature environments. Experimental verification reveals that the improved ensemble model offers the advantages of high accuracy and favorable stability, and it significantly outperforms the traditional AdaBoost algorithm and other traditional machine learning-based algorithms in variable temperature environments. In addition, compared with the traditional temperature drift compensation method for tunable filters based on the etalon and gas cell, the proposed temperature drift compensation method, with no need to add additional hardware to the existing demodulation system, is readily portable and boasts high economic practicability.
Results and Discussions According to the results, the uniformity coefficient of the sensitivity matrix is directly related to the reconstruction performance. When the uniformity coefficient is low, the reconstruction error is small. When the uniformity coefficient is large, the reconstruction error is large. Hence, the uniformity coefficient is considered as a predictor of the reconstruction performance (Fig. 3). In the iteration process of GA, it can be found that the uniformity coefficient decreases continuously with the process of iteration. At the beginning, the coefficient declines significantly. While between the 200th and 808th generations, the uniformity coefficient decreases slowly from 0.296 to 0.288 (Fig. 5). The uniformity coefficient reaches minimum of 0.288 at the 808th iteration. The optimized configuration has much low uniformity coefficient than the random configuration (0.437) and regular configuration (0.305). Reconstruction results with five specific distributions indicate the superiority of the optimized configuration over the other two configurations (Fig. 8). For the first three distributions with circular phantoms, the errors of the random configuration are 15.54%, 22.36% and 16.09%, which are the largest among the three configurations. The regular configuration has errors of 14.66%, 20.80% and 16.68%. The optimized one has the lowest errors, which are 11.57%, 18.39% and 13.07%. For the fourth distribution with a 'cross' phantom, the reconstruction errors of the three configurations are 19.59%, 22.83% 18.60%, respectively. For the fifth distribution, the errors have been increased intensively due to the complex phantom, which are 33.74%, 27.68% and 25.15%. For all the five distributions, the optimized configuration has much lower error than the random and regular ones. In the research work, we also introduce local error to evaluate the reconstruction performance. The local error of the random configuration fluctuates obviously among the whole region, and the maximum local error is up to 84%. The local error of the regular configuration is neglectable outside the boundary of the phantom to be reconstructed. However, within this range, its local error maintains high level with maximum of 81%. The local error of the optimized configuration is nearly zero outside the range, and inside the range, the maximum of the local error is only 50% (Fig. 9).ObjectiveOptical tomography aims to reconstruct the cross-sectional distribution from numerous projections along various orientations. Due to its 'hard-field', high spatial and temporal resolution, this technique has been widely used in multi-phase flow monitoring, temperature and species concentration measurement and functional tissue imaging. Optical tomography adopts light emitters to emit laser beams, which are attenuated by the medium. The outgoing light is then detected by photosensitive receivers. Reconstruction algorithms are used to reconstruct the absorption distribution of the medium. Intrusively, increasing light beams and receivers will improve the reconstruction performance. However, this approach is not appropriate when the light access or installation space is limited. Meanwhile, the reported tomography sensors usually have regular arrangement, which forms a non-uniform sensitivity matrix and the region of interest (ROI) is detected unevenly. In this work, we propose an optimization method based on uniformity coefficient and genetic algorithm (GA). We hope our method can provide an optimized sensor configuration that has a uniform sensitivity matrix and improved reconstruction performance.MethodsSensitivity matrix relates the practical distribution to the numerous projections, which is important for image reconstruction. It is well recognized that uniform sensitivity matrix promises improved reconstruction performance. While the reconstructed images have large error when the matrix has low uniformity. In this work, uniformity coefficient is introduced to represent the uniformity of the matrix. Meanwhile, we assume that the uniformity coefficient is directly related to the quality of image reconstruction, namely, lower uniformity coefficient leads to improved reconstruction performance, and larger value leads to deteriorated performance. The optimization procedure mainly includes the following steps. Firstly, reconstruction with 60 configurations and 10 distributions are implemented to verify the effectiveness of the uniformity coefficient as a predictor. The number of the light emitters and receivers are both 25. Secondly, we adopt GA to optimize the arrangement of the emitters and receivers. The fitness function is set as the uniformity coefficient. Finally, we analyze the optimized configuration and compare its reconstruction performance with the random and regular configurations.ConclusionsThis paper presents an optimization method for optical tomography sensor configuration based on GA. The following conclusions can be concluded. Firstly, simulation experiments of randomly generated configurations and distributions verify that the uniformity coefficient is an effective predictor for reconstruction performance. Configuration with low uniformity coefficient has uniform sensitivity matrix and beam arrangement, and improved reconstruction performance. On the contrary, configuration with large uniformity coefficient has uneven beam arrangement, and its reconstruction performance is deteriorated. Secondly, GA is used to implement the optimization, and we take the uniformity coefficient as the fitness function. The optimized configuration provided by GA has a uniformity coefficient of 0.288. Different distributions have been considered and the reconstruction results indicate the superiority of the optimized configuration over the random and regular configurations. The optimization method has been proven to be effective. Thirdly, reconstruction results display that the practical distribution has significant influence on the performance of the configurations. Since the uniformity coefficient is only related to the configuration, the optimization results are independent to the practical distribution and this optimization method can be used in the applications where the priori information of the distributions is difficult to obtain.
Results and Discussions The proposed single-camera system using an optical axis movable liquid crystal lens is proved to have a stereo vision effect. The images in this paper are acquired by using the horizontal movement of the optical axis of the liquid crystal lens while the single camera is fixed. The images have consistent direction of pixel movement and variation in the amount of pixel shift depending on the object distance. At this point, the disparity is the same magnitude as the optical flow. Therefore, the difference in the amount of pixel movement by using the optical flow algorithm is calculated, and dense disparity information is obtained [Fig. 9(b)]. It indicates that the system can capture disparity information about the scene (Fig. 10). Depth of objects is inferred back from the disparity in the close-range experiment (Table 3). The baseline distance in this system is small, and conventional stereo vision algorithms such as semi-global matching (SGM) and sum of absolute differences (SAD) are unable to acquire dramatic disparity information on the images acquired by the system (Fig. 12). According to the binocular distance measuring principle, as the baseline distance becomes greater, higher accuracy and longer distance that can be measured. It has been proven that the designed system works well, and it can acquire dense disparity information through the optical flow algorithm and allow the depth measurement of objects at close range with some accuracy.ObjectiveStereo images are usually acquired by changing the position of a single camera in the scene or by using two or even more cameras fixed at the same platform. Multi-camera systems are large and costly, and due to slight differences between each camera in terms of focal length, zoom level, camera gain, and so on, there are inevitable intensity differences between the matching points of the stereo images. Researchers have adopted methods combining a single camera and several optics devices to achieve stereo vision, so as to avoid this problem. The core function of the optics devices is to develop a single camera system with different imaging views. Various optical components have been reported in studies, for example, by rotating a flat glass plate or some plane mirrors placed in front of a single camera, or using a single camera pointing at a biprism or some multiple parabolic mirrors. However, optics rotation systems need to address the accuracy of mechanical movement, and biprism systems need to solve the problem of how to get the same image size. Parabolic mirror systems using multiple curvatures involve complex mirroring mechanisms, and the mirrors with multiple curvatures make the system difficult to be compact. Therefore, it is of research value and significance to seek more direct methods to realize a single-camera stereo vision system with a simpler and more compact structure. In this study, a single-camera stereo image acquisition system using an optical axis movable liquid crystal lens is presented. The optical axis position of the liquid crystal lens can be controlled by adjusting the voltage, and thus the stereo vision in a single camera can be achieved. Although it is consistent with the purpose of multi-view imaging through rotation, mirror reflection, biprism, etc., the mechanism of the designed system is simple. It allows the system to be used without mechanical movement during image acquisition, so as to reduce the complexity of the system. The liquid crystal lens is thin and light, and fits closely to the camera lens, which makes the system compact and enables a low cost.MethodsThe system consists of a fixed camera module and a liquid crystal lens with a polarizer attached. First, the structure of the liquid crystal lens is described, and a polarized interference optical path is built to analyze optical axis movement properties, including the magnitude of the motion at the corresponding drive voltage as well as the aberration and optical power. Then, the effect of the optical axis position change of the liquid crystal lens on the overall system is analyzed, and the relationship between disparity and depth is derived through the pinhole camera model. Finally, the system is used to acquire stereo images, and the disparity is calculated by the optical flow algorithm. The depth information of the scene is inferred from the disparity information in the close-range experiment, and error analysis is performed. In addition, the problems of other disparity acquisition algorithms in the designed system are illustrated.ConclusionsIn this study, a stereo image acquisition system is proposed. The system consists of a fixed camera module and a liquid crystal lens with a polarizer attached. We adjust the voltage to move the optical axis of the liquid crystal lens, capture images, and use optical flow algorithm to obtain disparity information. In addition, we analyze the effect of the optical axis movement of the liquid crystal lens on the overall optical axis of the system, and derive the relationship between the disparity and the depth. In the experiment, the feasibility of the system is demonstrated by verifying the existence of the disparity in the acquired images, and depth acquisition of close-range objects is performed. Experimental results show that the optical axis movement function of the liquid crystal lens can be used to move the overall optical axis of the system to achieve stereo vision. The designed system does not require any mechanical movement, and features a simple and compact structure and a low cost. Therefore, it provides a new method for the acquisition of stereo images.
Results and Discussions In the contour extraction method for reference holes, this paper proposes saliency detection as an image preprocessing method to avoid the poor image quality caused by objective factors. Such factors pose great difficulty to the accurate extraction of the contour of the reference hole by the traditional threshold segmentation and Canny edge detection algorithms and improving the robustness of reference hole identification and detection. In terms of the accuracy of reference hole positioning, this paper proposes the method of performing double-threshold segmentation and principal component analysis to coarsely position the contour of the reference hole. Then, the Bazen method is used to extract the sub-pixel contour and further accurately position the contour of the reference hole. Finally, the RANSAC method is adopted to fit the contour data and thereby improve the accuracy of ellipse fitting. According to experimental verification, the positioning error of the noisy image is 0.202 pixel, and that of the real reference hole is 0.027 mm. Clearly, the detection performance is excellent, and the proposed method is still robust in reference hole detection under the conditions of reflection, cutting tool traces, uneven light, threaded holes with chamfers, embedded contours, occlusion, and so on.ObjectiveThe complex environment and poor image acquisition quality of aerospace assembly sites pose great difficulty to the detection and identification of assembly reference holes due to reflection, cutting tool traces, uneven light, threaded holes with chamfers, embedded contours, occlusion, and other conditions. To address the above problems, this paper proposes a technique of reference hole detection based on saliency detection. In the process of aerospace assembly, the traditional assembly methods relying on manual operations or special fixtures are transformed into digital and flexible assembly to improve assembly efficiency and ensure assembly accuracy. The references on components need to be measured before assembly. Although contact measurement offers high accuracy, it is slow and inefficient. Therefore, non-contact measurement is often chosen, and assembly components are measured by machine vision systems, namely that the positioning references on the components are measured by vision. The above methods are based on the acquisition of the edge points of the reference holes. Nevertheless, Canny edge detection, threshold segmentation, and other image preprocessing methods can hardly accurately extract the actual edge points of reference holes in actual working conditions due to reflection, cutting tool traces, uneven light, threaded holes with chamfers, embedded contours, occlusion, and other conditions. For the above reason, this paper assumes that the image can be transformed into a saliency map before detection and accurate contour positioning can be achieved by principal component analysis and sub-pixel extraction.MethodsThe traditional process of reference hole detection mainly consists of image preprocessing, contour extraction, and contour recognition. Among them, image preprocessing is to reduce noise and highlight the reference hole in the image. Contour extraction is to obtain all the contours in the preprocessed image, although a lot of them are not the contour of the reference hole. Contour recognition is to eliminate all such contours from all the contours to be detected to retain the contour of the reference hole and ultimately achieve accurate detection of the reference hole. Images taken at the actual assembly site indicate that the traditional detection methods can hardly accurately extract the contour of the reference hole, resulting in the false-positive and false-negative detection of the reference hole. To overcome the above problem, this paper preprocesses the image by saliency detection to transform the image into a saliency map, highlights the saliency of the reference hole in the image, and extracts the region of interest regarding the reference hole from the saliency map with the Hough circle detection algorithm. Subsequently, double-threshold contour segmentation is performed, and principal component analysis is conducted to extract the pixel-level contour of the reference hole. Then, the Bazen method is employed to extract the sub-pixel contour of the reference hole. Finally, the reference hole is positioned with high precision according to the principle of random sample consensus (RANSAC).ConclusionsThe proposed method of reference hole detection based on saliency detection can be applied to detect reference holes under reflection, cutting tool traces, uneven light, threaded holes with chamfers, embedded contours, occlusion, and other conditions, in which it still ensures the robustness of detection. Experimental verification shows that the positioning error of the noisy image is 0.202 pixel, and that of the real reference hole is 0.027 mm. The method has a bright application prospect in industrial assembly reference, processing, and the positioning hole of a task. Compared with existing methods, this method can detect reference holes that are difficult to detect for most of the traditional methods. On the basis of a known size of a reference hole to be detected, the minimum and maximum radius thresholds can be set for the Hough circle detection algorithm to guarantee the robustness of the proposed detection method.
Results and Discussions A ±200 V, 100 kHz square wave with a duty cycle of 0.5 is used in the experiments. The maximum update rate of a single measurement is up to 200 kHz, and the detectable range is 351 μm. The measurement accuracy reaches 16.7 nm after 4100 times of averaging (Fig. 4), and the system has been proven to have good accuracy and stability. At an update rate of 200 kHz and a static distance of 41 μm, the standard deviation of 10000 consecutive measurements is 938 nm. The standard deviation can be reduced to 100 nm after moving average of 100 points (Fig. 3). Therefore, the system has been proven to have good repeatability. In addition, multiple measurements at the same location at different Δfr show a standard deviation of 417.2 nm after 2050 times of averaging (Fig. 5), which reflects that the system has good reproducibility. Then, the target object is moved with each step of 10 μm, and after 2050 times of averaging, the measured values are compared with the true values. The measurement accuracy of the system is within a few hundred nanometers, and the residual is within ±528 nm (Fig. 6), which indicates that the system has good accuracy. To prove the capability of the system to detect surface traces, a silicon-based micromechanical device [Fig. 7(b)] is measured. In the measurement, a ±200 V, 50 kHz square wave modulation with a duty cycle of 0.5 is applied to the EOM. The update rate is 100 kHz at this time, and the detectable range is 702 μm. Ten positions are measured with a lateral spacing of 30 μm between every two positions. The original ranging data of each position is averaged by 2050 times, and then the trench depth is calculated to be about 67.6 μm [Fig. 7(a)]. The proposed absolute distance measurement system has high accuracy and update rate, and can be applied in the 3D surface profile measurement of micromechanical structures. This system is also suitable for high-frequency mechanical vibration monitoring.ObjectiveTime-of-flight distance measurement based on a dual-comb approach is widely applied in the fields of laser radar, topography scanning, and vibration measurement by using two femtosecond lasers with a small repetition frequency difference for asynchronous optical sampling (ASOPS). In this manner, the high temporal resolution, comb-shaped spectrum, and ultra-low noise performance of femtosecond lasers can be fully utilized. However, the update rate of a dual-comb ranging system based on ASOPS is limited to a few kilohertz (determined by the repetition frequency difference) so as to avoid insufficient optical sampling. Given the extremely small duty cycle determined by the ratio of the femtosecond pulse width to the millisecond sampling period, most of the sampling time during a full sampling cycle is wasted in the process of pulse walk-off. To solve this problem, an electro-optical modulator (EOM) is added to the ASOPS system to modulate the repetition frequency periodically in this work. The so-called electronically controlled optical sampling (ECOPS) approach breaks the update rate limitation in the ASOPS system and can increase the update rate to hundreds of kilohertz, further enriching the application fields of dual-comb distance measurement technology.MethodsECOPS uses two lasers with tightly phase-locked repetition frequency (fr) as the light source. One is called a local laser with an EOM inserted in the cavity, and the other is called a signal laser. The EOM in the cavity is used to modulate the repetition frequency of the local laser. As a square wave is imposed on the EOM, the repetition frequency is switched between fr-Δfr and fr+Δfr, and the modulation period is determined by the square wave modulation frequency fm. Therefore, the repetition frequency difference between the two lasers switches between -Δfr and Δfr at the modulation frequency fm. Different from ASOPS with only a fixed Δfr, the rapid switching of ±Δfr effectively drives the output pulse of the local laser to scan back and forth on both sides of the output pulse of the signal laser, resulting in a controlled, bounded optical sampling and avoiding the unwanted pulse walk-off. The update rate is determined by the modulation frequency fm, which breaks the limitation of the ASOPS-based measurement system where the update rate is determined by the repetition frequency difference Δfr. In the experiment, a pair of nonlinear polarization rotation (NPR) mode-locked fiber lasers with a repetition frequency of ~158 MHz are selected as the signal laser and the local laser. In the local laser, the pulse duration is 140 fs, the spectral width is 21 nm, the central wavelength is 1569 nm and the average power is 20 mW. As for the signal laser, the pulse duration is 92 fs, the spectral width is 51 nm, the central wavelength is 1557 nm and the average power is 50 mW. Part of the output of the two lasers is combined and directed to a balanced optical cross-correlator (BOC), which detects the relative timing error between the two lasers with sub-femtosecond resolution. The error signal is fed back to the end mirror mounted on a fast piezo-actuator such that the repetition frequencies of the two fiber lasers are tightly phase-locked, and the residual timing jitter is lower than a few femtoseconds. After the phase locking of repetition frequencies is established, the main parts of the laser output are directed to the distance measurement module. A mechanical delay line is used to adjust the optical path from the output of one laser so as to make sure that the pulses from the two lasers overlap in time. As square wave modulation is applied to the EOM, the signal pulses naturally scan back and forth on both sides of the local pulses, which enables ECOPS-based distance measurement.ConclusionsThis paper proposes a dual-comb absolute distance measurement system based on ECOPS and selects two NPR mode-locked lasers with a repetition frequency of ~158 MHz. In the experiment, their repetition frequencies are locked by the synchronization module. After the two femtosecond pulse trains are aligned through the spatial delay line, the sampling pulse is moved back and forth on both sides of the signal pulse by adding a square wave to the EOM in the local laser, which overcomes the problem in the ASOPS approach where the update rate is limited by the repetition frequency difference. The update rate of the experimental setup can be up to 200 kHz, and the measurement accuracy can reach 16.7 nm with an average time of 20.5 ms in the measurement of an absolute distance of 41 μm. In theory, when the update rate is reduced to 40 kHz, the detectable range can reach 1.75 mm, which meets the detection requirements of trenches in most micromechanical structures, semiconductor devices, and other micro-nano devices. The experiments show that the system has good repeatability, reproducibility, stability, and accuracy. The trench depth in a micromechanical structure is measured with the designed system. The dual-comb system based on ECOPS can be widely used in micro-distance measurement, and also has potential application prospects in the fields of 3D topography scanning, such as surface profilometry and flatness analysis.
Results and Discussions In the case of no FRM, the extinction ratio of the spun fibers with different helical pitches is greater than that of the unspun fibers (Fig. 3). It is shown that the circular birefringence introduced by the spun fiber can suppress the partial random linear birefringence in the spun fiber, and its extinction ratio increases as the pitch decreases. When the FRM is applied, the measured extinction ratios of the spun fibers with different pitches are relatively stable. The introduction of FRM can significantly offset the random linear birefringence effect in the spun fibers, thereby improving the stability of the extinction ratio test. When the light source is 1310 nm, the Verdet constant of the spun fibers without FRM is larger than that of the unspun fibers, and a shorter pitch of the spun fiber is accompanied by a larger Verdet constant. In particular, when the pitch of the spun fiber is 1.0 mm, the Verdet constant is 0.8304 rad·(T?m)-1, which is about 3.43% higher than that of the unspun fiber [0.8029 rad·(T?m)-1]. When the FRM is added to the testing system, the measured Verdet constants of different fibers are improved to a certain extent compared to those of the fibers without FRM (Fig. 5). For the spun fiber with a pitch of 1.0 mm, it is improved by 7.50%. In addition, the mean square deviations of the measured Verdet constants of different fibers without and with FRM are 0.99% and 0.61%, respectively. This indicates that the introduction of FRM improves the measurement accuracy and stability of the Verdet constants of spun fibers.ObjectiveDue to the advantages of high sensitivity and electromagnetic interference resistance, the fiber-optic current sensor based on the Faraday effect has received extensive attention and is one of the research focuses in current measurement. However, there is high random linear birefringence inside the sensing coil, which seriously affects the sensitivity of the sensor. The spun fiber is widely used in the field of current sensing to overcome the influence of random linear birefringence on sensitivity. Moreover, the method of adding a Faraday rotator mirror (FRM) to the end of the sensor's induction coil can also be used to analyze the effect of random linear birefringence. An FRM induces light reflection and polarization rotation of 90° so that the outgoing light is orthogonally polarized to the incoming light. Polarization modulation can be eliminated when orthogonally polarized light undergoes reciprocal birefringence. To remove the influence of random linear birefringence on the measurement of fibers' magneto-optical properties, we prepare spun fibers with four helical pitches and unspun fibers and build an FRM-based testing system for magneto-optical properties of fibers.MethodsThe optical fiber samples used are homemade low-birefringence spun fibers. During the fiber drawing process, the fiber preforms are rotated at 1000 r·min-1, 667 r·min-1, 500 r·min-1, and 333 r·min-1, and spun fibers with a pitch of 1.0 mm, 1.5 mm, 2.0 mm, and 3.0 mm are obtained, respectively. The wavelength of the light source used in the experiment is 1310 nm. A magneto-optical property testing system based on FRM is built to accurately measure the extinction ratio and Verdet constant of fiber samples. Specifically, the extinction ratio characteristics of spun fibers with different helical pitches and unspun fibers without and with the FRM are measured. Afterward, the Faraday rotation angles and Verdet constants of spun fibers with different helical pitches and unspun fibers without and with the FRM are tested and compared with the theoretical values.ConclusionsIn the case of a light source of 1310 nm and no FRM, the Verdet constant of the spun fiber is larger as its helical pitch decreases. In particular, when the pitch is 1.0 mm, its Verdet constant [0.8304 rad·(T?m)-1] is about 3.43% higher than that of the unspun fiber [0.8029 rad·(T?m)-1]. When an FRM is applied, the measured Verdet constants of different fiber samples are improved to a certain extent, especially for the spun fiber with a pitch of 1.0 mm, whose Verdet constant is improved by 7.50%. In addition, the mean square deviation of the measured Verdet constants of different fibers with FRM is 0.61%, which is less than 0.99% in the case of no FRM. It is indicated that the introduction of FRM can cancel the random linear birefringence in the fiber and improve the measurement stability of the Verdet constant of fibers with different helical pitches. The FRM measurements of the Verdet constant for spun fibers with pitches of 1.0 mm, 1.5 mm, 2.0 mm, and 3.0 mm are improved by 3.94%, 4.72%, 4.24%, and 5.63%, respectively. The addition of FRM can reduce the influence of random linear birefringence on the measurement of the magneto-optical properties of doped fibers and further increase the measurement accuracy of the Verdet constant of doped fibers.
Results and Discussions The experimental results show that the maximum phase modulation value of the LC-SLM at the standard light wavelength of 633 nm is 6.185 rad, which is close to the pre-calibrated phase modulation value of 2π. The relative error is 1.56%, less than the maximum phase fluctuation of 5% given by the manufacturer, indicating that the measurement accuracy of digital holography is high (Fig. 4). The repeatability error of digital holography is 1.34%, which is lower than 2.44% of Twyman-Green interferometry (Fig. 6). Compared with Twyman-Green interferometry, digital holography can measure the phase modulation characteristics through one digital image-plane hologram. Moreover, the measurement process will not be easily affected by the time fluctuation characteristics of the LC-SLM caused by external environmental change and unstable driving voltage. Therefore, digital holography has the advantages of high measurement accuracy and good real-time performance. Then, the inverse interpolation method is used to establish the look-up table (LUT) of the input gray level and the driving gray level, which effectively reduces the nonlinear error of the phase modulation characteristics from 6.5% to 2.45% (Fig. 7). Finally, the phase modulation characteristics of the LC-SLM at a non-standard light wavelength of 670 nm are recalibrated, and the maximum phase modulation value is 5.641 rad (Fig. 8). With the phase correction coefficient model built in this work, the actual correction coefficient of 670 nm relative to 633 nm is calculated to be 0.9121. The relative error between the actual correction coefficient and the theoretical correction coefficient is 3.46%, which is mainly caused by the phase modulation fluctuation error of the LC-SLM.ObjectiveAs a new type of phase modulator, the liquid-crystal spatial light modulator (LC-SLM) has been widely used in adaptive optics, optical communication, optical tweezers, and digital holography. However, the phase modulation characteristics of LC-SLMs are different generally, and the accuracy of phase modulation will be affected by their transportation processes and application environments. Therefore, it is essential to measure and calibrate the phase modulation characteristics of an LC-SLM before using the device for phase modulation and compensation. Nevertheless, the currently used measurement methods still suffer from limitations. Traditional radial shearing interferometry and Twyman-Green interferometry are usually inefficient and difficult to meet the requirements for rapid detection. Commercial Fizeau interferometers can only measure the phase modulation characteristics of the LC-SLM at a fixed light wavelength. In addition, these methods ignore the influence of light wavelength on phase modulation characteristics. In this study, a fast measurement and calibration method based on digital holography is proposed, and the phase modulation characteristics of the LC-SLM at different light wavelengths are systematically evaluated. Digital holography exhibits excellent measurement accuracy and efficiency. We expect that our method can be helpful in improving the accuracy of LC-SLMs in phase modulation and compensation.MethodsDigital holography is used to measure and calibrate an LC-SLM in this study. First, an experiment setup of a digital holography system is developed, in which the LC-SLM is used as an object. Then, a driving image with gray levels of 0-255 is loaded on the LC-SLM, and a digital hologram is recorded on the image plane. The phase distribution of the object wave can be obtained by using the reconstruction algorithm, and the relationship between the phase and the gray level of the LC-SLM at the specific wavelength can be determined. Next, without changing the structure of the setup, a comparative experiment is carried out using Twyman-Green interferometry, which requires 52 interference images to obtain the phase modulation characteristics. Afterwards, the inverse interpolation method is used to linearly correct the phase modulation curve and improve the driving accuracy of the LC-SLM. Finally, the formula of the phase correction coefficient at the specific wavelength is theoretically derived and experimentally verified by recalibrating the phase modulation characteristics at a non-standard light wavelength.ConclusionsIn this study, a fast measurement method based on digital holography is proposed to calibrate LC-SLMs. With this method, the phase modulation characteristics at a specific wavelength can be measured in real time by using only one digital image-plane hologram. This method improves the measurement efficiency thanks to the simple system structure and no need for diffraction propagation calculation. Without changing the structure of the setup, a comparative experiment which uses Twyman-Green interferometry is carried out to verify that digital holography has higher measurement accuracy. The experimental results show that the phase modulation range of the LC-SLM is 0-6.185 rad at the standard light wavelength of 633 nm, and the nonlinear error of the phase modulation characteristics is reduced to 2.45% by the inverse interpolation method, which effectively improves the linear driving accuracy of the device. Depending on the wavelength response characteristics of the LC-SLM, a phase correction coefficient model at the specific wavelength is built, and the actual phase modulation range of the LC-SLM at a non-standard light wavelength of 670 nm is corrected. This study verifies the feasibility of using an LC-SLM for phase correction in dual-wavelength interference measurement systems.
Results and Discussions The method can effectively remove the noise of the spot array image and adapt to the change in light intensity. It does not need to dynamically adjust the parameters of the localization algorithm or train the centroid extraction model of the low-SNR sub-spot in advance according to the fluctuation characteristics of light intensity, which has the advantages of simple implementation, strong adaptability, and good robustness. The centroid localization accuracies and wavefront restoration errors of multiple sub-spot images in a single frame of sub-spot images and different near-field fluctuations (Figs. 5-10) are compared, and experiments confirm that the centroid detection error of the method in this paper is improved by more than 2 times, and the wavefront restoration residual is controlled below 0.045λ (Figs. 14-16).ObjectiveThe Shack-Hartmann wavefront sensor is widely used due to its advantages of simple structure, high utilization rate of light energy, and fast detection speed. In practical application scenarios, affected by factors such as skylight background, atmospheric turbulence intensity, return characteristics of beacon light, detector noise, etc., the spot array images collected by the Shack-Hartmann wavefront sensor often have uneven sub-aperture spot intensity distributions, with low signal-to-noise ratios (SNR). In this case, it is difficult to accurately extract the centroid of a light spot, and the detection accuracy of the wavefront decreases. To solve the localization problem of the sub-spots of spot array images with a low SNR, researchers have proposed several improved methods, such as the thresholding centroid method, weighted centroid method, intensity weighted centroid method, cross-correlation algorithm, frequency domain method, local adaptive threshold method, windowed thresholding centroid method, and windowed thresholding weighted centroid method. However, when the near-field light intensity of the beam to be measured fluctuates dynamically, and the detector noise, image background noise, and other interfering noise signals change dynamically, the effective optical signal and noise signal of a spot array image fluctuate in time and space. When the spot centroid is selected, the algorithm parameters need to be dynamically adjusted to ensure the centroid extraction accuracy of the sub-spot. This algorithm mechanism significantly increases the complexity of the centroid extraction algorithm, and there are also problems with optimal parameter selection and dynamic setting, which will eventually lead to a decrease in the wavefront restoration accuracy of the sensor.The efficient centroid extraction of the sub-spot when the near-field intensity of the incident beam dynamically fluctuates requires a centroid localization method for the low-SNR sub-spot image collected by the Shack-Hartmann wavefront sensor with high adaptability.MethodsWhen the wavefront sensor collects the sub-spot image, the detector introduces signal photon noise, background photon noise and readout noise, etc., due to factors such as the environment and the quantum characteristics of the photodetector. According to the characteristics of detection noise, photodetector noise is generally represented by a Poisson-Gaussian model. In this model, the signal-related noise introduced by the quantum characteristics of the sensor is modeled by Poisson distribution, and the signal-independent noise is modeled by Gaussian distribution. According to the signal characteristics and noise characteristics of the photodetector, this paper proposes a method to extract the centroid of a sub-spot based on variance-stabilizing transformation (VST). It converts the Poisson-Gaussian noise that varies with the signal into Gaussian noise with a fixed variance. An improved block-matching and 3D filtering (BM3D) method, i.e., noise feedback block-matching and 3D collaborative filtering (NFBM3D), is used to remove the noise of the spot array image, and then sub-spot centroid extraction and wavefront restoration are performed.ConclusionsThrough simulation and experiments, it is confirmed that the method proposed in this paper can effectively extract the light spot signal data in the low-SNR spot array image collected by the Shack-Hartmann wavefront sensor. It can avoid noise interference in the image and fully improve the centroid localization accuracy and stability of the sub-aperture spot. Compared with the traditional adaptive threshold and other methods, this method can improve the centroid extraction and wavefront restoration accuracy by more than 2 times when the peak SNR of the sub-spot image is lower than 6. This algorithm is expected to meet the real-time requirements of the centroid extraction of the adaptive optics system after the accelerated processing of similar and fast search and matching.
Results and Discussions When the inner surface of holes is qualified for calibration, the distortion correction of six kinds of endoscope images with different apertures is carried out with the regular pentagram of known size as the experimental object. The average measurement error of six groups of experiments is 1.95%, and the measurement accuracy is high. In the experimental group, the average standard deviation of the side length of the pentagram after correction is 9.07, which indicates that there is still a large difference in the correction effect in different directions. The main reason is that the accuracy of image center detection is not high enough. It shows that the proposed correction method has good universality. When the inner surface of the hole does not meet the calibration conditions, the simulated defects of the slot hole, the threaded hole, and the inner surface are taken as experimental objects, and the images are corrected. The average measurement error of the experiment is about 6.75%, which is higher than that of the hole with calibration conditions, but it still has great application value for the actual needs of the industrial field.ObjectiveHoles are the most common form of parts in machining and manufacturing. Enterprises have been long suffered from the inner surface defect detection of holes, especially the measurement of inner surface size. With the development of image processing technology and miniaturization of imaging elements, inner surface defect detection based on endoscopic images has been widely used in mechanical manufacturing, aerospace, and other fields. When endoscopes are applied to detect the inner surface defects, the real inner surface is parallel to the main optical axis of the lens and exhibits a circular scattering distribution on the imaging plane, which is not conducive to identifying the contour and size of the defects. Aiming at the difficulty in measuring the inner surface defect size of the hole, this paper proposes an endoscope image correction method to realize the inner surface size measurement.MethodsAccording to the mapping relationship between spatial coordinates and phase plane coordinates in the endoscopic imaging system, the endoscopic image distortion is divided into circumferential distortion and axial distortion. In the case of adding geometric constraints in the application scene, the parameters in the correction model are simplified to a central coordinate and a nonlinear parameter, which improves the correction accuracy of the edge region of the endoscope image. The Hough transform and difference expansion are adopted to process the endoscopic image to realize the circumferential correction, and the axial correction is performed by pixel calibration and nonlinear stretching of the circumferential corrected image. The paper utilizes the neural network algorithm to fit the axial correction function including the relative positions of pixels and apertures based on the calibration experiments of different apertures, thus overcoming the dependence of the axial correction on the calibration results. Additionally, the measurement of inner surface defects of holes without calibration conditions is obtained.ConclusionsIn this paper, a method for distortion correction and measurement of in-hole images based on the endoscopic imaging principle is proposed. The method of circumferential correction and axial correction is adopted to restore the endoscopic image to an orthographic image that conforms to the visual habit and measure the size. The feasibility of the method is verified by experiments and the factors affecting the detection accuracy are discussed. The specific conclusions are as follows. 1) The method based on image processing can effectively realize the endoscopic image correction and the defect measurement, and the accuracy is high. 2) The measurement method is not sensitive to the aperture, and the measurement accuracy is not affected by the test object, so the method has good applicability. 3) The coordinates of the image center and the axial distance growth function are the key parameters that affect the accuracy of image correction and defect measurement. For further improvement of detection accuracy, a textured calibration paper can be placed on the inner surface of the hole during the detection to improve the accuracy of circle center detection and axial distance growth function fitting. As the proposed correction method has good versatility and high accuracy, it can be used for automatic detection and intelligent detection of holes and pipelines.
optical elements in soft X-ray monochromators. As the resolution of beamlines in synchrotron radiation sources continuously increases, diffraction grating has become a key optical element affecting the resolution. Therefore, VLS grating needs to be accurately tested before being installed in beamlines. To achieve high energy resolution for some beamlines in new generation of synchrotron light sources, not only high precision VLS grating is required, but also more accurate methods of measuring the corresponding line density distributions are necessary.For the positions of the grating overlapping with those of the grating in the first step, it is assumed that the line densities of the overlapping positions are equal to each other. In this way, the incidence angle for the overlapping positions can be calculated, which is the same as that of the un-overlapping positions of the second segment. Using the inverted incidence angle, the improved line density of the un-overlapping positions can be obtained. Repeating the above two steps, the linear density of the entire grating can be calculated with improved precision.Results and Discussions The key point of the method is to calculate the mean value of the incident angle using all sampling points in the overlapping area. This not only eliminates positioning errors in the deflector, but also suppresses random and drift errors, reduces the transfer of measurement errors from a single sampling point to adjacent segments and improves the accuracy of the test results. The effect of positioning errors in the rotary table can be eliminated. During the measurement process, the position offset of the measurement spot is corrected in time and the environmental stability is improved to further reduce the error. In this paper, by using a data processing method that accurately inverts the incident angle of each segment, the repeatability of the measurement of the line density of the VLS grating can be compared between the two methods, with a repeatability of 9.55×10⁻⁷ (RMS), which is much better than that of the previous method [2.12×10⁻⁵ (RMS)]. This paper also conducted four groups of comparison experiments with overlapping rates of 2.4%, 26.8%, 51.2%, and 75.6%. The consistency of the coefficients N1 and N2 in the fitted equations of the line density for the four groups were ΔN1/N1≤8.49×10-5 and ΔN2/N2≤1.67×10-3, respectively, The beamline requires an accuracy of around 0.5% and 5% for N1 and N2 of the grating. The accuracy of the test at different overlapping rates meets the test requirements. This result demonstrates the high repeatability and consistency of this method for measuring the linear density of VLS grating.ObjectiveSince its development in the last century, the performance of synchrotron light sources has been-increasingly improved, providing a new and efficient platform for research in many fundamental disciplines such as physics, chemistry, materials science, and life sciences, and helping to achieve many cutting-edge results. In synchrotron light sources and X-ray free electron laser devices, grating monochromators and spectrometers are crucial for both beamlines and experimental stations. Monochromators variable-line-spacing (VLS) grating is simple and easily achieve high spectral resolution and transmission efficiency. Thus, VLS gratings have become the dominantMethodsThe main methods for measuring grating line densities include interferometry, diffraction, and long trace profiler (LTP) methods. These methods have their advantages and disadvantages. To meet the need of measuring line density of VLS grating, LTP with stitched data is used. In order to complete the Hefei Light Source photoelectron spectral beam line maintenance project, the Hefei Light Source independently developed a VLS grating. In order to characterize the line density more precisely, this paper proposes an improved stitching measurement method using LTP. In particular, the incident angle of each segment is inverted to improve based on the proposed stitching measurement method of LTP. In fact, for previous stitching methods, the angle of incidence at the central of each segment was determined from the angle of the deflector and the relative diffraction angle within each segment, which was based on the angle value given by the LTP detector. However, the angular error of the deflector is not negligible. In this method, first, taking the midpoint of the VLS grating as a reference point, the line density and incidence angle of the reference point is determined. Moreover, with the data of the reference point, the line densities of other positions of this segment are measured. Second, it is to measure the line density distribution of the next segment.ConclusionsThe LTP stitching measurement method is used to test VLS grating parameters using a segmented overlapping data processing method, which avoids angular errors in the deflector and provides a significant improvement in repeatability. The consistency of the test results is better than 1.13×10⁻⁶ (RMS) for the same VLS grating using different overlapping rates, and the PV value of the repeatability deviation of the test data decreases significantly with increasing overlapping rate. Therefore, a reasonable selection of step length and the overlapping ratio of two adjacent segments can improve measurement accuracy while suppressing splicing errors and ensuring a certain level of measurement efficiency. However, due to the relative accuracy of the turntable, the deviation of the absolute value of the central density is about 0.1 lp/mm, which needs to be improved by using the relative calibration method. This will be followed by an experimental approach to investigate the effect of central line density error measurements on variable-line-spacing grating parameters and experimental verification.
Results and Discussions In this study, ICCAD 2012 benchmark suite is used for model training and model tests. The ICCAD 2012 benchmark suite contains five subsets. According to the data-balance method, non-hotspot data are randomly sampled in the training data of the ICCAD 2012 benchmark suite. The randomly sampled non-hotspot data and all hotspot data constitute a complete training dataset, and the number of training data in the training dataset is 5054. The model test data are the five test datasets in the ICCAD 2012 benchmark suite. With the pre-trained VGG13, VGG16, and VGG19 models as references, VGG model comparison experiments are conducted. As shown in Fig. 5 and Table 2, the comparison results indicate that the comprehensive performance of the model obtained by the proposed method is better, and the average accuracy, recall, precision, and F1 score of the model reach 98.9%, 98.2%, 89.5%, and 93.3%, respectively. In addition, the hotspot detection method based on the pre-trained VGG11 model requires a shorter model training time of only 279 s. The improvement of the model performance and model training time helps to improve the efficiency of hotspot detection. Compared with the hotspot detection method based on the pre-trained GoogLeNet model and the pre-trained VGG16 model, the results show that the proposed method has better comprehensive model performance. As shown in Fig. 6 and Table 4, on the premise that the hotspot detection has a considerable recall, the proposed method can significantly improve the precision and F1 score. Tests are carried out to release convolutional layers with different numbers for model training, and the results show that the release of the convolution layers has a slight effect on the model performance of the proposed method.ObjectiveLithographic tool is an important device for large-scale IC manufacturing. Its function is to transfer mask patterns into photoresists on wafers. Nowadays, the designed feature size of IC is below 10 nm, and the number of transistors of an IC is as high as tens of billions. With the demand for high integration and good performance, the physical design of IC continues to shrink, and lithographic printability has become one of the critical issues in IC design and manufacturing. Affected by the layout design and lithography process, the lithography results of some patterns in the layout are quite different from that of the target patterns, which results in short-circuit or open-circuit problems. These problems will cause lithography hotspots. In order to reduce lithography hotspots, hotspot detection and layout correction are carried out in turn in the layout design phase. The performance of the hotspot detection affects the period and yield of IC manufacturing. Hotspot detection is one of the important techniques for IC design and manufacturing. For available hotspot detection methods, the hotspot detection method based on lithography simulation is time-consuming, and the hotspot detection method based on pattern matching is invalid for unknown hotspot patterns. The hotspot detection method based on machine learning has good performance in speed and accuracy and has been widely studied. Transfer learning has been applied in the hotspot detection method based on machine learning and achieved positive model performance. Model performance and model training time affect the application of the hotspot detection method based on transfer learning. In this study, a lithography hotspot detection method based on a pre-trained VGG11 model is proposed. The proposed method helps to improve the model performance and model training time.MethodsIn this study, we adopt a transfer learning strategy for model training of hotspot detection. First, the ImageNet dataset is used to pre-train the VGG11 model, and the pre-trained VGG11 model is used as the model to be trained for hotspot detection. Then, the network architecture of the pre-trained VGG11 model is fine-tuned to make it suitable for hotspot detection. In the data preparation phase, pattern down-sampling and data balance are employed to prepare data for model training. In the model training phase, the strategy of preserving pre-trained model weights and freezing convolutional layers is adopted for model training. The trained model is suitable for hotspot detection.ConclusionsA lithography hotspot detection method based on a pre-trained VGG11 model is proposed in this study. A transfer learning strategy is adopted for model training. The proposed method uses a VGG11 network trained by the ImageNet dataset as the pre-trained model, and the network architecture of the pre-trained VGG11 model is fine-tuned to make it suitable for hotspot detection. Model training is performed by using a strategy of preserving pre-trained model weights and freezing convolutional layers. ICCAD 2012 benchmark suite is used for model training and model tests. Compared with that of available methods, the results show that the model of the proposed method has better comprehensive performance and requires less model training time. The average accuracy, recall, precision, and F1 score of the model reach 98.9%, 98.2%, 89.5%, and 93.3%. In addition, the model training time of the proposed method is only 279 s. The proposed method helps to improve the efficiency of hotspot detection and shortens the period of integrated circuit manufacturing.
At present, approaches to 8-12 μm LWIR laser mainly include direct radiation from gain media represented by carbon dioxide (CO2) lasers and semiconductor quantum cascade lasers (QCLs) and nonlinear optical techniques represented by second-order nonlinear frequency conversion. CO2 lasers have been one of the most mature coherent radiation sources for the LWIR band since the invention of the first CO2 laser in 1964. However, their output wavelengths are limited to the spectral lines of 9.2-9.8 μm and 10.1-11 μm. In addition, since CO2 lasers usually need to be supported by a large cooling system, the overall size of the device is huge, which greatly limits the application range of CO2 lasers. QCLs feature a broad emission spectrum (3.5-160 μm) with a relatively narrow linewidth and favorable wavelength tunability. However, due to the limited depth of their quantum wells, QCLs offer low efficiency in the 8-12 μm band and consequently fail to achieve high-power and high-pulse energy operation. Besides, they are difficult to design and entail a relatively high manufacturing cost.Although 8-12 μm LWIR lasing has already been achieved with gas and semiconductor as gain media, no mature method of LWIR lasing by directly pumping crystalline gain media is obtained so far due to the restriction of the intrinsic emission spectra of the currently available crystals. As the most mature and most widely used method, nonlinear frequency conversion is an effective approach to 8-12 μm lasing. Notably, solid-state lasers based on second-order nonlinear frequency conversion techniques break through the predicament that crystalline gain media cannot directly achieve LWIR lasing. Furthermore, compared with CO2 lasers and QCLs, all-solid-state lasers based on nonlinear frequency conversion techniques have the characteristics of excellent wavelength tunability and power scalability. The diversities of the available pump parameters (wavelength, width, energy, power, etc.) and emerging nonlinear optical crystals provide LWIR lasers based on nonlinear frequency conversion with a broader development space towards but not limited to ultrashort pulse width, high repetition rate, wide wavelength tuning range, high energy, and high power. This paper reviews the working mechanisms and research progress of LWIR lasers based on second-order nonlinear frequency conversion to provide a reference for the personnel engaged in the research and development of lasers.SignificanceThe 8-12 μm long-wave infrared (LWIR) laser, which is within the atmospheric transmission window and the eye-safe range and demonstrates a higher transmittance in atmospheric media (Fig. 1), has critical applications in various fields, such as directed infrared countermeasures, environmental monitoring, lidar, and surgery. For example, the laser in this LWIR band plays an important role in environmental monitoring and differential absorption lidar because this band covers the fundamental absorption bands of many gas molecules, such as H2O, CO2, NH3, and O3. In terms of medical treatment, the 8-12 μm LWIR laser, with a large absorption coefficient and a shallow penetration depth in water and other components of biological tissues, serves as a unique and effective tool in biological tissue treatment. In addition, high-energy 8-12 μm LWIR lasers are in high demand in the field of defense.ProgressSpecifically, the working principles and characteristics of the second-order nonlinear frequency conversion techniques, including optical parametric generation (OPG), optical parametric oscillation (OPO), difference frequency generation (DFG), and optical parametric amplification (OPA), are described (Fig. 3). Subsequently, the physical and nonlinear optical properties, including nonlinear coefficient, transparency range, thermal conductivity, and damage threshold, of commonly used nonlinear crystals, such as ZnGeP2, BaGa4Se7, CdSe, GaSe, LiGaS2, orientation-patterned GaAs, and orientation-patterned GaP, are summarized (Table 1). Then, the detailed properties of different crystals and the output characteristics of the corresponding LWIR laser based on the crystals are analyzed. The research progress analysis shows that LWIR lasers based on second-order nonlinear frequency conversion have achieved femtosecond, picosecond, and nanosecond output in pulse width and repetition rates ranging from several hertz to megahertz. However, due to the low inherent quantum conversion efficiency of nonlinear frequency conversion towards the LWIR band (pumped by 1-3 μm near- and mid-infrared lasers), the output energy of the LWIR lasers is mainly at the microjoule and millijoule levels at present (Fig. 10). Finally, the opportunities and challenges for LWIR lasers based on second-order frequency conversion techniques are discussed, and the potential method of LWIR lasing via Raman conversion based on the third-order nonlinear effect and its prospect are presented.Conclusions and ProspectsCrystalline LWIR lasers based on second-order nonlinear frequency conversion techniques have made outstanding achievements in ultrashort pulse width, high repetition rate, wide wavelength tuning range, and high peak power. The improvement of crystal growth technique, the emergence of new types of nonlinear optical crystals, and the development of currently available crystals with higher optical quality and larger volume crystals pave the way for the further improvement of the power and conversion efficiencies of LWIR lasers. In addition to the above reviewed second-order nonlinear frequency conversion techniques, diamond Raman lasers (based on the third-order nonlinear optical effect) with an extremely wide spectral transmission range and an extremely high thermal conductivity are considered a promising way of wavelength conversion from short-wave to long-wave.
Results and Discussions Regarding the SL-EUDOI-PMOF proposed in this paper, the external optical feedback cavity for the slave laser contains a phase modulator driven by pseudo-random signals, and this would conceal the time-delay eigenpeaks and the TDS generated by the time-delay information of the injected laser and the feedback laser. Thus, the TDS is effectively suppressed. The numerical results show that the TDS of the chaotic laser output from the system is effectively suppressed by optimizing parameter values in the selected parameter value ranges, namely, the time-delay eigenvalue β is smaller than 0.2 [Fig. 2(b) and Figs. 3-7]. Besides, the minimum value of β is close to 0.06 (Fig. 4 and Figs. 6-7). In the proposed SL-EUDOI-PMOF, an external optical feedback cavity is equipped for the master laser, and chaotic laser can thus be output and further injected into the slave laser through two paths. The interference between the injected chaotic laser in the two paths enlarges the intensity of the laser injected into the slave laser, ultimately broadening the BW of the chaotic laser output from the slave laser. The numerical results reveal that the BW is effectively widened under the parameters enabling effective suppression of the TDS, and the maximum value of the 3-dB BW of the chaotic laser obtained is about 20 GHz [Fig. 9(c2) and Fig. 10].ObjectiveAs class-B lasers, distributed feedback semiconductor lasers (DFB-SLs) can output chaotic laser under external disturbances, such as external optical injection and optoelectronic feedback, and the bandwidth is up to GHz. Therefore, DFB-SLs are widely applied in many fields, such as secure communication and physical entropy sources for generating random physical numbers. However, the chaotic laser output from DFB-SLs has weak periodicity and time-delay signature (TDS) due to optical feedback and optical injection. This would reduce the quality of the random numbers generated with chaotic laser sources and restrict the applications of chaotic laser. In addition, the bandwidth (BW) of the chaotic laser determines the transmission rate of secure communication. For the above reasons, the TDS and BW are two important parameters that affect chaotic laser's applications and are often used to characterize the chaotic characteristics of chaotic laser. This paper presents a semiconductor laser system with external unidirectional dual-path optical injection and phase-modulated optical feedback (SL-EUDOI-PMOF) and investigates its effectiveness in suppressing the TDS and broadening the BW of chaotic laser. The results of this paper are significant for achieving information confidentiality and high-speed transmission in chaotic laser-based secure communication.MethodsThis paper presents a scheme of semiconductor lasers. Specifically, a DFB-SL with an external-cavity optical feedback is used as the master laser, while a DFB-SL with the PMOF is taken as the slave laser. Subsequently, the chaotic laser output from the master laser is injected into the slave laser through two paths. The SL-EUDOI-PMOF is thereby obtained. Then, the influences of parameters, including the external optical injection coefficients and the feedback coefficients, on the TDS of the chaotic laser output from the SL-EUDOI-PMOF are numerically investigated. The time-delay eigenvalue β is defined as the maximum value of the time-delay eigenpeaks in the autocorrelation function curve of the chaotic laser. When βConclusionsThis paper proposes the SL-EUDOI-PMOF system for suppressing the TDS and broadening the BW of chaotic laser. For this purpose, the influences of the system's parameters on the TDS are numerically investigated, and the results are physically analyzed. The results show that in the selected parameter value ranges, the time-delay eigenvalue β decreases first and then increases as the feedback coefficient Km or the pumping factor of the master laser increases. The value of β decreases as the feedback coefficient Ks or the two injection coefficients increase. Moreover, the value of β increases first and then decreases with an increasing frequency detuning, and it decreases first, then varies in a gentle manner, and rises slightly higher afterwards with the increase in the pumping factor of the slave laser. The optimal parameter value ranges for suppressing the TDS effectively are obtained accordingly. Then, the BW is investigated under the parameters enabling effective suppression of the TDS, and the result is physically analyzed. The analysis results show that the value of the BW increases rapidly first and then decreases slowly as the feedback coefficient Km or the pumping factor of the slave laser increases. It increases with an increasing injection coefficient K2 or an increasing feedback coefficient Ks. The value of the BW increases first and then varies gently as the pumping factor of the master laser rises, and it increases gradually first and then decreases rapidly with an increasing frequency detuning. The maximum value of the 3-dB BW of the chaotic laser obtained is about 20 GHz.
Results and Discussions To verify the feasibility and accuracy of the proposed method, this paper establishes a monocular laser speckle projection system (Fig. 5). Firstly, the extrinsic parameters of the monocular laser speckle projection system are calibrated according to the aforementioned process. Then, the corresponding speckle points in the camera images are projected to the virtual imaging plane of the projector, and the offset error of corresponding points is calculated. The average offset errors mainly vary from 0.10 pixel to 0.18 pixel. The projection points of corresponding speckle points on the virtual imaging plane tend to be one point. The result shows that the calibration accuracy of the rotation matrix and the translation vector is high. Next, fourteen displacement experiments are further conducted in the range of 2-9 mm. The measured curve is basically consistent with the ideal curve (Fig. 7). The measurement errors of displacement are less than 0.16 mm. Furthermore, we conduct the 3D reconstruction experiment of standard spheres with known geometric parameters. The radius measurement errors of the two standard spheres are 0.0916 mm and 0.1274 mm, respectively. Their root-mean-square (RMS) errors are less than 0.1346 mm (Table 1). Finally, the ORBBEC's Astra-Pro is selected to demonstrate the depth measurement accuracy of the proposed method. Regardless of the average offset error or the depth distribution range, the plane reconstruction results of the proposed method are significantly better than those of Astra-Pro (Table 2). Simultaneously, the depth variation of the target model reconstructed by the method is smoother, and its density of point cloud is larger (Fig. 11). Hence, it can be easily concluded that the proposed method is able to calibrate the monocular laser speckle projection system effectively and achieve high-precision depth measurement.ObjectiveLaser speckle projection systems have been widely used in various fields, including but not limited to three-dimensional (3D) reconstruction, industrial detection, and gesture recognition. According to the number of infrared cameras, laser speckle projection systems are generally divided into two categories: the binocular mode and the monocular mode. A binocular laser speckle projection system consists of a laser speckle projector and two infrared cameras. The feature information provided by random speckle patterns is sufficient to match images in textureless areas, which significantly improves the accuracy and stability of binocular stereo vision systems. Moreover, speckle patterns in the infrared spectrum minimize the impact of the ambient light. However, the cost of binocular laser speckle projection systems is typically high, and the calibration process is complex. Compared with their binocular counterparts, monocular laser speckle projection systems are more compact and cost-effective. Due to the lack of reference speckle patterns, monocular laser speckle projection systems generally use a precise range finder to capture speckle images at different standard distances in advance. The measurement process is complex, and the deviation of the optical axis cannot be corrected online. To solve the aforementioned problems, this paper proposes a calibration method for the extrinsic parameters of monocular laser speckle projection systems. The virtual speckle image of the projector is generated by calculating the pose relationship between the infrared camera and the laser speckle projector. Only a calibration board with corner features is required in the proposed calibration process, rather than the precise range finder. With this method, a monocular laser speckle projection system becomes equivalent to a binocular stereo vision system with speckle images.MethodsFirst, a simple calibration board with corner features is designed. These features only occupy a small part of the calibration board, which leaves sufficient area for the speckle pattern. The plane equation of the calibration board in the camera coordinate system is calculated by extracting the coordinates of corner features in the image. Then, the laser speckle projector projects a random speckle pattern to the calibration board in different poses, and the infrared camera captures speckle images. Next, the digital image correlation (DIC) method is utilized to determine the corresponding speckle points in different speckle images. According to the plane equations of the calibration board, those speckle points are projected to corresponding planes, whose 3D coordinates can be obtained in the camera coordinate system. The straight lines fitted by corresponding speckle points pass through the center of the laser transmitter in the projector, which is regarded as the optical center of the projector. Therefore, the optical center and axis of the projector in the camera coordinate system are estimated by fitting corresponding lines. Finally, the pose relationship between the camera and the projector is solved and optimized. The virtual speckle image of the projector is generated by constructing the equation of planar homography. Through the aforementioned process, a monocular laser speckle projection system can be equivalent to a binocular stereo vision system with speckle images.ConclusionsIn this paper, a simple and efficient calibration method for the extrinsic parameters of monocular laser speckle projection systems is proposed. The 3D coordinates of the corresponding speckle points are calculated by adjusting the pose of the calibration board. Then, the relationship between the infrared camera and the laser speckle projector is solved and optimized to generate the virtual speckle image of the projector. The pose relationship of the monocular laser speckle projection system can be easily calibrated with the help of a calibration board with corner features, which improves calibration efficiency and reduces calibration costs. Generating the virtual speckle images of the projector enables the monocular laser speckle projection system to be equivalent to a binocular stereo vision system with speckle images, which significantly improves depth measurement accuracy. Simultaneously, the deviation of the optical axis can be corrected online. The experimental results show that the measurement errors of displacement and sphere radii are less than 0.16 mm and 0.13 mm, respectively. Within a certain depth range, the reconstruction results of the proposed method are significantly better than those of Astra-Pro. The proposed method can well improve the calibration efficiency and depth measurement accuracy of monocular laser speckle projection systems.
Results and Discussions Specifically, the prediction precision in the four cases is discussed. As training epochs increase, network weights are gradually optimized, and the prediction error of the deep convolutional neural network is gradually reduced. After training for 10000 rounds, the normalized errors on the testing sets in the four cases are all smaller than 1×10⁻⁷ (Fig. 4 and Fig. 6). Even in the most complex case (different initial pulse power, width, and chirp), excellent visual agreement is achieved between the predicted pulse propagations and the real ones where all the temporal distributions include details. The prediction error is mainly concentrated in the propagation range after 350 m and is distributed in the range of the pulse peak, with a maximum value smaller than 10 mW (Fig. 7). In conclusion, the normalized root-mean-square errors of the 500 testing samples are smaller than 0.0584. The results show that the proposed network can predict the process of ultrashort CPA under complex initial pulse conditions with high precision. Furthermore, the computation efficiency of the proposed DL method is investigated and compared with that of the traditional split-step Fourier method. The computation time of the proposed DL method for 500 independent samples is less than 1/10 that of the traditional split-step Fourier method, demonstrating that the DL method has clear advantages over the conventional approach in computation efficiency.ObjectiveFiber optical parametric chirped pulse amplification (FOPCPA) is a widely studied ultrashort pulse amplification technique. The FOPCPA can provide excellent gain bandwidth and achieve ultrashort pulse amplification with a more compact and stable system design. The basic principle of the operation relies on a degenerate phase-matched four-wave mixing process involving one strong narrow-bandwidth pump wave, a weak stretched signal, and a generated idler wave. The FOPCPA process can be described by the nonlinear Schrodinger equation. However, the FOPCPA system is highly sensitive to the initial parameters and fiber parameters. Consequently, the traditional numerical methods (i.e., split-step Fourier method and finite-difference method) of analyzing the ultrashort CPA in an FOPCPA system require a huge amount of computation and become less efficient. Nowadays, deep learning (DL) methods have been developed to model and predict nonlinear pulse dynamics and thereby reap the benefits of purely data-driven methods without any underlying governing equations. This study focuses on modeling the ultrashort CPA in fiber by a DL method. The proposed method is expected to broaden the application of DL methods in the prediction of laser behavior and provide an alternative for studying the characteristics of ultrashort pulses in fiber.MethodsA deep convolutional neural network is constructed in the present study. This network contains three parts: five convolutional blocks, a reshaping layer, and three fully connected layers (Fig. 3). Each convolutional block contains a one-dimensional (1d) convolutional layer, a batch normalization layer, a rectified linear unit activation function, and a 1d max pooling layer. The intensity distribution of the initial chirped pulse is used as the input of the neural network. After five convolutional blocks and three fully connected layers, the predicted ultrashort pulse propagation is obtained. For better feature extraction, the real and imaginary parts of the initial pulse are simultaneously used as the input of the deep convolutional neural network. The weights and biases of the proposed network are updated by the back-propagation of the root-mean-square error between the predicted pulse propagation intensity and the ground truth. In the training phase, this study uses the Adam optimizer and sets the learning rate of the network to 0.0001. The whole program is implemented in the Pytorch framework with a 2080Ti GPU. Four cases are considered to test the performance of the proposed network (Table 2). In all these cases, the training sets and testing sets are independent of each other, namely that no duplicate samples are used.ConclusionsIn this study, a DL method is employed to model ultrashort CPA in fiber. A deep convolutional neural network that consists of convolutional blocks and fully connected layers is designed to predict ultrashort pulse propagation under different initial parameters with high precision. Specifically, the paper analyzes the propagation characteristics of the chirped ultrashort pulse and the influence of initial chirp on pulse evolution. The prediction precision and computation efficiency of the proposed method are further studied under different initial pulse parameters. Without compromising generality, the study selects the case of different initial pulse power, width, and chirp to present the testing results. The results show that the neural network constructed performs well in both prediction precision and computation efficiency. On 500 independent testing samples, the proposed deep convolutional neural network achieves normalized root-mean-square errors smaller than 0.0584 and takes less than 1/10 the computation time of the traditional split-step Fourier method. The proposed method extends the application of DL methods in laser technologies and ultrafast optics and provides an alternative for modeling ultrashort pulse propagation in fiber.
Results and Discussions The metamaterial absorber has a reflectivity less than -10 dB in the frequency range of 11.0-18.0 GHz, a thickness of 1.6 mm, and a much higher figure of merit (FOM) than most reported absorbers. Three different FSSs are designed for comparison, and the dipole square ring cross element structure possesses a larger bandwidth and a stronger absorption effect. Surface current and electromagnetic power loss density are analyzed (Fig. 10). Because the current cannot flow due to the gaps, positive and negative electrons gather on the two sides of the gaps respectively to form dipoles which can generate a strong electric field. In the electric field enhancement region, the energy loss of the incident electromagnetic wave increases significantly. Therefore, the dipole square ring cross element structure is used to design an absorber with an increased bandwidth and a reduced thickness. The effects of the thickness of the dielectric substrate and the surface resistance of the absorber on the reflectivity are investigated (Fig. 5). After the electromagnetic wave enters the alumina coating, its consumption becomes more difficult as the thickness decreases, so the absorption of the metamaterial absorber becomes less effective. The simulation results show that the optimal surface resistance results in the largest absorption coefficient and the widest absorption band of the metamaterial absorber.ObjectiveWith the development of information technology, electronic devices are widely used while leading to many electromagnetic interference problems. In addition, useless electromagnetic waves may pose a potential threat to human health. Therefore, electromagnetic absorbing materials have been developed to eliminate electromagnetic interference and provide information security. Conventional coated absorbing materials usually have a narrow and fixed absorbing band and are susceptible to external environmental influences. Compared with traditional absorbers, metamaterial absorbers have a larger absorbing bandwidth, a stronger absorbing capacity, and a lower thickness. To solve the problem that common absorbing materials have a high thickness and a narrow absorption band, a new dipole square ring crossed element structure with a large bandwidth and a low thickness is designed in this paper. This new structure shows good stability and high-frequency characteristics.MethodsIn this paper, the relationship between the electromagnetic parameters and the reflectivity of the absorber is calculated by the finite-difference time-domain method through simulation with CST software. The equivalent electromagnetic parameters of the absorber are obtained by inversion according to the equivalent medium theory. The cell size and circuit parameters of the dipole square ring crossed element structure are optimized by the equivalent circuit model of the absorber. The influence of two main parameters on reflectivity is studied. The surface current, electric energy density, and magnetic energy density of a unit cell at the operating frequency are simulated to analyze the working mechanism. A high-impedance surface comprising a lossy frequency selective surface (FSS) is employed to design a broadband microwave metamaterial absorber. The dipole square ring cross element structure is designed. Conductive paste and alumina ceramic are selected as the FSS raw material and the dielectric layer, respectively. Firstly, the alumina ceramic is used to make the dielectric substrate so that the limit thickness can be reduced. Secondly, the conductive paste is applied to the dielectric layer by the screen printing method, and the surface square resistance of the conductive paste is 60 Ω/sp. Finally, the reflection coefficient of the sample is measured by the free-space method in a microwave darkroom with a double-ridged horn antenna and a network analyzer.ConclusionsIn this paper, a thin wideband metamaterial absorber is designed and fabricated with a dipole square ring cross element structure. The reflectivities of three metamaterial absorbers based on cross element structures are solved using CST software through time-domain finite integration, and the effect of the metasurface structure on the reflectivity is investigated. According to the analysis of the surface current distribution and electromagnetic loss density at the resonance frequency, the absorbing loss mechanism is made clear, namely that the existence of the gaps makes the current fail to flow, and positive and negative electrons gather on the two sides of the gaps respectively to form dipoles able to generate a strong electric field. The energy of the incident electromagnetic wave is rapidly lost in the electric field enhancement region. The equivalent dielectric constant, equivalent permeability, and equivalent impedance of the absorber are obtained by inversion in light of the equivalent medium theory, and it is found that the loss mechanism of the metamaterial absorber is the excitation of magnetic resonance. The simulation and experimental results are in good agreement. The experimental results have a small deviation from the simulation results because the simulation model is an infinite one and has ideal boundary conditions. The metamaterial absorber has a reflectivity less than -10 dB in the 11.0-18.0 GHz band with a thickness of 1.6 mm, and the microwave absorption peaks at 12.7 GHz. The simplicity of the raw materials produced in this study and the feasibility of the metamaterial absorber fabrication make the large-scale application of the designed absorber possible.
Results and Discussions Several important results are obtained as follows.1) Within the pre-trained range, the trained BP neural network is applied to predict the corresponding DOE phase coefficients. The randomly selected 20 sets of DOE system coefficients are taken as the test samples. The prediction accuracies of the DOE phase coefficients are all above 99.9% (Fig. 6). The uniformity of the laser irradiance generated by the 4 sets of DOEs which are designed by machine learning and energy mapping method respectively is almost the same (Fig. 7 and Fig. 8).2) The influences of system parameters on the prediction accuracy are studied while the system parameters are beyond the training range. Also, the influence of each parameter on the prediction accuracy is analyzed. When all the parameters are expanded by 80% and 55% based on the pre-trained range, the accuracy of prediction is above 99.5% and 97.5%, respectively (Fig. 10). It is shown that the size of the target plane has the most obvious influence on the prediction accuracy when the size of the target plane is smaller than the predetermined size (Fig. 11).ObjectiveDiffractive optical elements (DOEs) are widely applied in light distribution control such as laser beam shaping, structured light illumination, and beam splitter. Various methods can be utilized to design DOEs, such as Gerchberg-Saxton (GS) algorithm, simulated annealing algorithm (SAA), and Genetic algorithm (GA). These traditional methods can design DOE effectively for a group of initial parameters, such as beam waist radius, wavelength, size of target plane, and distance between DOE and target plane. However, when any parameter is changed, the new phase profile needs to be recalculated, which is time-consuming, especially by global optimization algorithms such as SAA and GA. To overcome the disadvantages, this paper employs a machine learning algorithm to design the DOEs with continuous phase distribution. The mapping relationship of system parameters such as waist radius, size of target plane, and distance between DOE and target plane with DOE phase coefficients is constructed by the neural network. With this relationship, the DOE phase coefficients can be predicted automatically when a set of system parameters are given. It overcomes the limitation of the traditional design methods which need to recalculate the phase distribution when the parameters are changed.MethodsMachine learning algorithm is employed to design the DOE with continuous phase distribution, which can be used for laser shaping. Firstly, the gird energy mapping method is applied to calculate the phase distribution data of the DOEs with a set of initial parameters including waist radius, size of target plane, and distance between DOE and target plane. The DOE enables the laser to generate uniform laser irradiance distribution. Secondly, the phase distribution data of DOE elements are fitted into a polynomial. Then 10000 sets of initial parameters are generated. With the 10000 sets of initial parameters, the phase distribution data of 10000 sets of DOEs are calculated by grid energy mapping. The initial parameters of the DOE and DOE phase coefficients are taken as input and output data to train the neural network, respectively. The trained network constructs a mapping relationship between system parameters and phase coefficients. With this relationship, the DOE phase coefficients can be predicted automatically when a set of system parameters are given.ConclusionsThe machine learning algorithm is employed to design DOEs with continuous phase distribution. The parameters of the DOE and DOE phase coefficients are acquired automatically as input and output data respectively to train the neural network. The trained network constructs a mapping relationship between system parameters and phase coefficients. With the relationship, the DOE phase coefficients can be predicted automatically when a set of system parameters are given. The results show that the prediction accuracy of the phase coefficient is above 99.9% within the trained range of the system parameters. When all parameters are expanded by 80% and 55% in both forward and reverse directions based on the pre-trained range, the prediction accuracy remains above 99.5% and 97.5%, respectively. It is also shown that the size of the target plane has the most obvious influence on the prediction accuracy when the size of the target plane is smaller than the predetermined size. In future work, the method may be extended to design the DOE with discontinuous phase distribution.
Results and Discussions Two kinds of micron-level double-layer composite structures fabricated by one-step photolithographic preparation technology are presented (Fig. 3 and Fig. 4). The experimental results show that the depth of the concave notch can be effectively controlled by adjusting the exposure energy. The basic rule is that as the exposure energy becomes larger, the depth of the concave notch will be greater. When the exposure energy is large enough, there is no residual photoresist at the central concave notch after development. At this time, the micron-level double-layer composite structure disappears, and two micron-size discrete structures are obtained on the substrate (Fig. 3). The influence of exposure energy on the depth of the concave notch is studied with identical development time (Fig. 4). For 8 μm thick AZ9260 photoresist film, the exposure energy not higher than 160 mJ/cm2 is the key to preparing the micron-level double-layer composite structures (Fig. 4). Schematic diagram of yz plane of the simulation model is demonstrated (Fig. 5). The light field distribution behind the mask during lithography exposure is analyzed by the finite-difference time-domain method (Fig. 6). The simulation results show that the exposure efficiency of the photoresist under 4 μm narrow slit is lower than that under 40 μm wide slit, which is the fundamental reason why the micron-level double-layer composite structures can be prepared by one-step lithography technology.ObjectiveIn bionics research, micron-level double-layer composite structures can usually show better mechanical, optical, and chemical properties than single-layer structures. Designing and constructing these unique biomimetic microstructure surfaces for human use is a hot research topic in recent years. The traditional photolithography technology is very convenient and has the advantage of simple process when it is applied to prepare the micron-level single-layer structures. However, when the traditional photolithography technology is adopted to prepare the micron-level double-layer composite structures, it needs to use the overlay lithography process for many times, which will greatly increase the manufacturing difficulty and processing cost of the microstructure. To overcome the above difficulties, researchers have developed a variety of microstructure processing methods, such as dry/wet etching, nanoimprinting, 3D printing, self-assembly, laser processing, photolithography, replication molding, and electrospinning. A variety of single-layer microstructure surfaces can be prepared by using these technology combinations, and even multi-scale micron-level composite structure surfaces can be prepared. However, the combinations often lead to more cumbersome processing procedures and higher costs of micron-level composite structures. To solve these problems, a method to adjust the exposure efficiency of photoresist by changing the width of the light transmitting part on the mask is proposed. By this method, the micron-level double-layer composite structures can be obtained on the positive photoresist with only one exposure and one development, which greatly reduces the processing difficulty and manufacturing costs of such structures and provides a new strategy for fabricating multi-scale micron-level composite structures.MethodsTwo lithographic masks with different parameters are designed and purchased from the 55th Research Institute of China Electronics Technology Group Corporation. The pattern of the mask and the schematic diagram of the photolithography process are shown in Fig. 1 and Fig. 2, respectively. The specific experimental process is detailed as follows. The K9 glass substrate is cleaned by an ultrasonic cleaner in acetone, ethanol, and deionized water for 5 min each and then dried with nitrogen flow. The AZ9260 photoresist film with a thickness of 8 μm is spin-coated on a 5.08-cm K9 substrate at 2500 r/min for 40 s using Laurell WS-650Mz spin coater. After standing at room temperature for 10 min, the substrate is placed on a 65 ℃ hot plate for 5 min, a 95 °C hot plate for 10 min and a 110 °C hot plate for 5 min, and finally cooled to room temperature. The ultraviolet (UV) lithographic exposure process is performed on Midas MDA-400M. The exposure energy of different samples is set between 125 mJ/cm2 and 240 mJ/cm2. The photoresist development is carried out with AZ400K developer (the volume ratio of AZ400K developer to deionised water is 1∶3) after UV exposure. Leica Microsystems DM8000M optical microscope is used to characterize the obtained samples. In addition, the light field distribution during mask exposure is analyzed by the finite-difference time-domain method to find out the formation mechanism of the micron-level double-layer composite structures.ConclusionsThe application of the one-step photolithographic preparation technique proposed in this paper can effectively reduce the difficulty in fabricating micron-level double-layer composite structures. The experimental results show that the fabrication process of the micron-level double-layer composite structures using the proposed method is very simple compared with that using overlay lithography technology, and only one exposure and one development process are needed. The maximum exposure energy of 8 μm thick AZ9260 photoresist should not be higher than 160 mJ/cm2 to obtain micro-level double-layer composite structures. The light field distribution behind the mask during lithography exposure is analyzed by the finite-difference time-domain method. The simulation results show that the exposure efficiency of the photoresist under 4 μm narrow slit is lower than that under 40 μm wide slit, which is also the fundamental reason why the micron-level double-layer composite structures can be prepared by one-step lithography technology. The developer renewal speed in the 4 μm narrow slit is less than that in the 40 μm wide slit, further promoting the formation of the micron-level double-layer composite structures. During the mask lithography, the photoresist under the wide light transmitting area on the mask will be developed to the substrate faster than that under the narrow light transmitting area. According to this rule, various masks can be designed, and it is expected to prepare a variety of micron-level double-layer composite structures or even micron-level multi-layer composite structures by this method. The masks shown in this paper have reference significance for preparing various micron-level multi-layer composite structures.
Results and Discussions When the rotation angle φrot of the unit cell is 0°, 30°, 70°, 120°, and 180°, the variations of the simulated phase and normalized amplitude of the cross-polarized transmission coefficient TRL with frequency under LCP incident waves show that the 3 dB bandwidth of TRL of the dielectric unit cell is 0.1 THz, and the working frequency band is about 0.25-0.35 THz (with a relative bandwidth of 33.3%). In addition, as the rotation angle of the unit cell changes from 0° to 180°, the unit cell can cover the phase change of 0°-360° (Fig. 2). Therefore, the metasurface can be realized on the basis of the PB phase principle and the designed dielectric unit cell. When LCP plane waves with the frequency f1 and angle θi(f1) are incident on the metasurface in ±x and ±y directions separately, simulated far-field amplitude and phase patterns of RCP transmission waves show that four-channel beams are generated in the direction perpendicular to the metasurface. At the same time, according to the characteristics of OAM beam energy and phase distribution, the amplitude of one of the transmitted waves is in a solid distribution, with the phase unchanged, and thus, the topological charge l1 equals 0. For the other three-channel beams, the amplitude and phases are distributed in circular and spiral shapes, respectively, and when observed along the -z-axis, the phase changes by +4π, -4π, and +8π in a clockwise direction. In other words, the three-channel OAM beams with topological charges of l2=-2, l3=+2, and l4=-4 are generated. It can be seen that four-channel topologically orthogonal coaxial beams with frequency f1 are generated in the direction perpendicular to the metasurface (Fig. 5). Similarly, for four-channel LCP plane waves with f2 and θi(f1), or f3 and θi(f3) incident on the metasurface along the ±x and ±y axes, four topologically orthogonal coaxial beams with frequency f2 or f3 in the direction perpendicular to the metasurface are generated (Figs. 6 and 7).ObjectiveIn recent years, the terahertz (THz) band has attracted extensive attention from researchers due to its potential of realizing high-speed and high-capacity wireless communication systems. The multiplexing technology has great research prospects in improving the communication rate and system capacity. The electromagnetic wave (EMW) carrying the orbital angular momentum (OAM) is called the OAM wave. OAM can be used as a new information carrier to provide an additional dimension for spatial multiplexing. The metasurface can effectively control the amplitude, phase, and polarization of EMW, and according to the main types of materials used, it can be divided into the metal and dielectric metasurfaces. Compared with the metal metasurface, the dielectric metasurface has the advantages of smaller ohmic loss, lower costs, easier processing and manufacturing, and higher transmission efficiency. Most previous research focused on generating an OAM beam or realizing OAM beam multiplexing by the metal metasurface, and hence, generating OAM beams and further realizing OAM beam multiplexing based on the dielectric metasurface have become the research hotspots. The methods of OAM beam multiplexing based on the dielectric metasurface have the disadvantages of OAM waves carrying the same information, the limited number of multiplexing channels, and the complexity and high cost of the communication system. Although the above problems can be effectively solved on the basis of the angle-multiplexed dielectric metasurface by converting multiple incident waves with different angles into orthogonal OAM coaxial beams, the current angle-multiplexed dielectric metasurface only works at a single frequency. Once the incident wave frequency changes, the generated OAM waves will deviate from the axis. In addition, the existing research focuses on the optical frequency band, and few studies combine two or more physical dimensions to achieve multiplexing. We need to study the realization of dual-dimensional or multi-dimensional multi-channel multiplexing in the terahertz band based on the dielectric metasurface and the expansion of the working bandwidth of the dielectric metasurface. Therefore, this paper proposes a dielectric metasurface, on the basis of which the dual-dimensional multi-channel multiplexing can be realized by the combination of OAM and frequency dimensions. Theoretically, the simultaneous transmission of 4×N-channel (N is any positive integer) orthogonal coaxial beams can be realized. The proposed dielectric metasurface has potential application value in the field of high-speed and high-capacity terahertz communication.MethodsFirst, the designed dielectric unit cells of the metasurface are composed of silicon pillars and substrates, and unit cells with different rotation angles are simulated on CST Microwave Studio. Periodic boundaries are set in the x-axis and y-axis directions; two Floquet ports are set in the z-axis direction, and the excitation is set as the left circularly polarized (LCP) wave in the negative direction of the z-axis. Then, for topological charges l1=0, l2=-2, l3=+2, and l4=-4, according to the theoretical formula, the required phase distribution of the proposed metasurface is calculated. After that, the metasurface is designed on the basis of the Pancharatnam-Berry (PB) phase principle and the dielectric unit cell. Then, to verify the designed metasurface, we take frequencies f1=0.35 THz, f2=0.3 THz, and f3=0.25 THz to calculate the corresponding incident angle simultaneously. Finally, far-field amplitude and phase patterns of right circularly polarized (RCP) transmission waves are simulated on CST Microwave Studio when three-channel circularly polarized (CP) plane waves with different frequencies and incident angles are obliquely incident on the metasurface in four directions.ConclusionsIn this paper, a dielectric metasurface working at 0.25-0.35 THz is proposed. When N-channel CP plane waves with different frequencies and incident angles are obliquely incident on the metasurface in four directions, in the direction perpendicular to the metasurface, 4×N-channel cross-polarized transmission waves are converted into coaxial beams that are orthogonal to each other in topology or frequency, namely that the 4×N channel multiplexing is realized. For simulation verification, we assume f1=0.35 THz, f2=0.3 THz, and f3=0.25 THz. The simulations show that when four-channel LCP plane waves with frequency f1, f2, or f3 are obliquely incident on the metasurface along the ±x and ±y axes, four topologically orthogonal coaxial beams with frequency f1, f2, or f3 in the direction perpendicular to the metasurface are generated. At the same time, the generated three groups of beams are orthogonal to each other in frequency. It can be seen that on the basis of the designed dielectric metasurface, 12-channel incident waves are successfully converted into coaxial beams with topology or frequency orthogonality. In other words, 12-channel multiplexing is realized by the combination of OAM and frequency dimensions. The designed dielectric metasurface has potential application value in the field of high-speed high-capacity terahertz communication.
Results and Discussions The designed fiber SPR sensor with silver film and high-purity indium film structures has an excellent performance in salinity detection. Fig. 8 shows the resonance spectrum of the structure coated with only a single silver film. As the refractive index of the external environment increases, the resonance peak shifts to the long wavelength direction, and the sensor shows a small amount of wavelength shift. After calculation, the SPR sensor with a single silver film structure has a refractive index sensitivity of 3450.74 nm/RIU. For the SPR sensor with a silver film structure in Fig. 9, its resonance peak shifts significantly to the long wavelength direction as the refractive index of the solution increases. The linear relationship between the resonance wavelength and the refractive index of the solution is positive, and the sensitivity of the sensor is as high as 4989.34 nm/RIU, which is converted into a mass fraction sensitivity of 9.1 nm/% by Eq. 7. This is because high-purity indium has a higher refractive index, and the presence of high-refractive-index materials can increase the penetration depth of evanescent waves, and the evanescent field is enhanced, which results in an increase in the interaction between evanescent waves and surface plasmon waves. The plasmonic effect of the silver film is enhanced, which in turn causes an increase in wavelength drift and improves the sensitivity of the sensor. Compared with that of the SPR sensor coated with only a single silver film structure, the sensitivity is improved by about 44%. Compared with that of the traditional fiber SPR sensor, the sensitivity is improved by about 126%.ObjectiveAs people tend to pay much attention to the ecological environment, the detection of liquid salinity in hydrological environments has gradually become an indispensable part of research fields such as agricultural planting, aquaculture, and monitoring of the marine environment. Surface plasmon resonance (SPR) technology has unique advantages in liquid salinity detection due to its fast response speed and high precision. The optical fiber SPR sensor combines optical fiber and plasma technology to overcome the limitations of prism-type SPR sensors. It not only has the advantages of simple structure and water resistance of optical fiber sensors but also has a wide detection range and high detection sensitivity of surface plasmon technology and convenient operation. However, traditional optical fiber SPR sensors based on multi-mode or single-mode single metal film structures generally face many problems. Specifically, the metal film is easy to fall off, and the detection sensitivity is low. In addition, the stability is poor. Indium has excellent electrical properties and positive flexibility. Therefore, it is an important optoelectronic material and is easy to form a firm coated on a metal surface. Furthermore, it is not easy to react with alkaline solutions and has good corrosion resistance. Therefore, this paper uses the strong coupling characteristics of a three-core fiber and the principle of SPR to design a tapered fiber SPR sensor based on a silver film and a high-purity indium film, which can improve the sensitivity and corrosion resistance of the sensor.MethodsThis thesis is based on the theory of an optical fiber SPR sensor, and the propagation law of light in a tapered fiber is studied. The total reflection coefficient of the sensor is obtained by using the Fresnel formula, and the influence of the diameter of the cone waist region, the length of the sensing region, and the thickness of the metal film on the sensor is analyzed by numerical calculation, and the optimal parameters are determined. The sensor is fabricated according to the numerical values determined by the simulation, and the optical fiber is tapered by a hydrogen flame fusion taper. The silver film and the high-purity indium film are prepared by magnetron sputtering and molecular vapor deposition, respectively. First, the optical fiber SPR sensor with a single silver film structure is studied, and the change in its resonance peak is observed by dropping salt solutions of different mass fractions. Then, under the same experimental conditions, the sensing performance of the optical fiber SPR sensor with silver film and high-purity indium film structures is studied. After comparing the two sets of experimental data, a conclusion is drawn.ConclusionsIn this paper, an Ag/In structure SPR sensor based on a three-core fiber is designed. The multi-core fiber SPR sensing mechanism is theoretically analyzed, and the system structure parameters are determined. In addition, two fiber SPR sensors with only a single silver film structure and a silver film plus high-purity indium structure are experimentally studied. By comparing the experimental results, the resonance peak of the Ag/In structure SPR sensor shows a larger wavelength shift, and its refractive index sensitivity is about 44% higher than that of the Ag structure fiber SPR sensor in a mass fraction measurement range of 1.4%-3.6%, which can realize salinity measurement in a full depth range of 0--5000 m. Therefore, the introduction of high-purity indium outside the silver film can improve the sensitivity and stability of the sensor, and the sensor can be applied in fields such as environmental monitoring, biomolecular measurement, and climate prediction.
Results and Discussions The measured absorption spectra of the used target acetylene line pair at different content and different temperatures are shown in the paper (Fig. 5). The average bias between the measured temperatures and thermocouple readings is about 23.1 K. The measured acetylene content for each level is averaged and plotted against the known content [Fig. 6(a)]. The measured values from the tunable diode laser absorption spectroscopy sensor agree well with the known values. The linear relationship between the counterparts is about 0.995, and the average relative standard deviation of the acetylene measurement is 2.65%. Additionally, we compare the temperatures obtained depending on the thermometry of the sensor and the averages of the three thermocouple readings [Fig. 6(b)]. The temperatures determined by the sensor agree well with the thermocouple readings in the tested temperature range of 500-1000 K. The correlation of those measured points R2 is about 0.998, and the average relative standard deviation is 3.05%.ObjectiveIn the past 40 years, tunable diode laser absorption spectroscopy has developed into a remarkable optical diagnostic technique because it can provide a reliable, fast, time-resolved, sensitive, non-intrusive in situ measurement for various gas parameters, such as concentration, temperature, pressure, velocity, mass flux, and density. Hence, it has been widely used in many fields including environmental monitoring, combustion diagnosis, industrial process control, and biomedical sensing. In some special applications, there is not only gas but also some particles and liquid droplets in the measurement area, such as the soot in the flow field of combustion and fine particles (PM2.5 and PM10) in the atmospheric air. Then the variation in the intensity of the tunable diode laser is induced by both the absorption of the target gas molecule and the extinction/scattering caused by particles and liquid droplets. Thus, how to extract the absorption spectrum of the target absorption line of the measured gas molecule from the mixed signal is significant for the development of gas sensors based on tunable diode laser absorption spectroscopy. Here we design a gas-solid two-phase optical sample cell and apply it to simulate a gas detection environment in the presence of both particulate matter and gas. Temperature and acetylene content are measured in the gas-solid two-phase optical sample cell, which can demonstrate how to detect gas in a particulate environment.MethodsThe gas-solid two-phase optical sample cell used in the experiment is made of stainless steel and located in a ceramic fiber furnace whose temperature is controlled by a custom-made temperature control system. The heated static cell has a height of 290 mm and a diameter of 120 mm. The JGS3 quartz rods with a length of 90 mm and a diameter of 52 mm are inserted into the cell, and each quartz rod has an inclination of 1.5o against the vertical direction to further reduce interference fringe noise. The temperature in the sample cell is measured by three K-type thermocouples with accuracies of ±1% and precision of 0.1 K. In the experiment, the C2H2-N2 mixtures which are controlled by a mass flowmeter carry the quartz sand particles with a diameter of 125 μm into the gas-solid two-phase optical sample cell. A distributed feedback (DFB) laser with a central wavelength of 1540 nm is used to detect the absorption spectra of the target acetylene lines at 6489.07 cm-1 and 6490.02 cm-1. A multi-pass absorption technique is combined in the system to enhance performance. The temperature is inferred from the integrated absorption ratio of the two lines, and the acetylene content is determined from the integrated absorption of the line at 6490.02 cm-1 due to its high absorption intensity.ConclusionsIn this work, temperature and acetylene content are simultaneously measured by means of a DFB laser with a central wavelength of 1540 nm in a particulate environment which is simulated by a gas-solid two-phase optical sample cell. Two target acetylene lines at 6489.07 cm-1 and 6490.02 cm-1 are chosen as the optimum line pair for the tunable diode laser absorption spectroscopy sensor to detect temperatures in the target range of 500-1000 K at atmospheric pressure. The comparison of the values measured by the sensor with the well-controlled gas temperature and acetylene content confirm the accuracy and reliability of the sensor. At present, the optical path length is only 0.36 m. The short path length limits the detection sensitivity of the sensor. In the future, the detection sensitivity will be decreased due to the increase in the reflection time of multi-pass absorption. Then the system can be used to detect the gas volume fraction and temperature in the flow fields of real flames or internal combustion engines, where both gas and particles coexist.
Results and Discussions To begin with, a cubic dataset with no noise is utilized and reconstructed using the MC algorithm and the approach proposed in this study, as shown in Fig. 7. Sharp features including angles are lost by the MC algorithm [Fig. 7(a)]. The approach in this article not only generates the cube's edges but also a smaller triangular mesh to represent sharper features such as angles [Fig. 7(b)]. Next, in order to demonstrate the algorithm's simplification effect in this paper, an experiment is performed utilizing a set of real scanned gear CT sequence image data. This study's algorithm generates an unsimplified mesh model [Fig. 8(a)], which is then processed using vertex clustering and edge-shrinking algorithms. The vertex clustering approach results in the loss of the model's detailed features after simplification [Fig. 8(b)], whereas the edge-shrinking algorithm saves the details but generates a large number of long-narrow triangles with poor mesh quality [Fig. 8(c)]. The method used in this study efficiently prevents the formation of long-narrow triangles while preserving the model's detailed features and guaranteeing the quality of the model [Fig. 8(d)]. Besides, in order to further validate the effectiveness of the algorithm presented in this study, a set of engine CT sequence image data with a complicated internal cavity structure is applied. The mesh models shown in Fig. 9 are reconstructed by varying the simplified parameters. Different simplification effects can be obtained by changing the simplified parameters (Fig. 9). The method used in this study can adaptively extract the isosurface in voxels of different sizes according to the local characteristics of the object and achieve the reconstruction of an adaptive 3D mesh model under the given simplified parameters. The experimental results demonstrate that the method presented in this study can preserve object sharpness while simplifying the mesh, reducing the number of long-narrow triangles, and improving the quality of the triangular mesh model reconstructed from industrial CT images. In this study, the simplification rate of the triangular mesh model generated by the algorithm can achieve 90%, with an average proportion of mesh quality greater than 0.3 after simplification of 99% (Table 2).ObjectiveAs a typical numerical representation of geometric models, the triangular mesh is widely used in additive manufacturing, inverse design, and finite element analysis. The triangular mesh model is directly reconstructed based on industrial CT images, which allows for the reconstruction of 3D representations of parts with complicated internal cavity structures. However, current algorithms for reconstructing triangular mesh models based on industrial CT images, for example, marching cube (MC) algorithm, have problems such as loss of sharp features, many long-narrow triangles, and a large number of triangular surfaces. In this paper, we propose an adaptive 3D mesh model reconstruction method to simultaneously address these issues while improving the quality of the reconstructed triangular mesh model from industrial CT images.MethodsFirst, a bilateral filter and an OTSU algorithm are utilized to preprocess industrial CT images, so as to denoise and determine the value of the isosurface. Second, an octree structure is used to confirm the voxels; the octree is created top-down recursively, while non-boundary voxels are deleted to save storage space. The quadratic error function (QEF) is then applied to each boundary voxel of the octree to produce a feature point, and the octree is simplified by merging the feature points from the bottom up. Third, a quadrilateral formed by four adjacent feature points is divided into two triangular meshes. In order to validate the performance of the proposed algorithm, experiments are performed using a cubic dataset and two groups of real industrial CT images.ConclusionsThis paper proposes an adaptive 3D mesh model reconstruction algorithm to deal with the problems of sharp feature loss, many long-narrow triangles, and a large number of triangular surfaces in the reconstructed triangular mesh model of industrial CT images obtained from X-rays. Firstly, the image is denoised by the bilateral filter, and the value of the isosurface is determined using the OTSU algorithm. Then, voxels are organized by an octree structure, and the octree is generated top-down; feature points are generated by minimizing a quadratic error function (QEF), and an adaptive octree is constructed by merging feature points bottom-up. Finally, triangular meshes are generated by dividing the quadrilateral formed by four adjacent feature points. The algorithm in this paper checks its ability to keep sharp features compared with the MC algorithm. Compared with vertex clustering and edge-shrinking mesh simplification algorithms, the algorithm in the present paper can keep features and guarantee the quality of simplified meshes. Under the given simplified parameters, the method used in this research can adaptively extract the isosurface in voxels of different sizes based on the local characteristics of the object and achieve the reconstruction of an adaptive 3D mesh model. From the experimental results, it is found that the simplification rate of the triangular mesh model generated by the algorithm in this paper can be as high as 90%, and the average proportion of mesh quality higher than 0.3 after simplification reaches 99%. Compared with the conventional mesh method, the proposed method can maintain the sharp features of the model while simplifying the mesh, reducing the number of long-narrow triangles, and improving the quality of the reconstructed triangular mesh model from industrial CT images.
ObjectiveIn laser inertial confinement fusion, high-precision X-ray imaging diagnostic instrument has become the key to observing the implosion process and quantitatively inverting the implosion parameters. It plays an important role in the research on irradiation uniformity, implosion compression symmetry, hydrodynamic instability, and fuel mixing. Rayleigh-Taylor (RT) instability during implosion is a non-linear high-gain transient process, which requires high spatial resolution, large effective field of view, and high temporal resolution of the diagnostic system. RT instability experiments are typically performed using plan-modulated samples with low amplitude and high spatial frequency sine periods. Higher spatial resolution helps reveal early phenomena of hydrodynamic instability. Currently, diagnostic X-ray imaging equipment widely used in diagnostic science mainly includes pinhole camera, Kirkpatrick-Baez (KB) microscope, Wolter microscope, and spherically bent crystal. Affected by initial configuration and optical processing capabilities, the optimum spatial resolution is 3-5 μm, and the effective field of view is limited to the order of hundreds of microns to millimeters. Improving the spatial resolution of diagnostic equipment at the submicron level is favorable for revealing the phenomena and detailed features that are difficult to observe in implosion diagnostics. In particular, it may enhance the ability to observe low amplitude and high spatial frequency sine samples in the study of RT instability. Wolter microscope is an ideal optical configuration for high-precision X-ray imaging diagnostics due to its high spatial resolution and high optical collection efficiency. However, it is difficult to directly apply the Wolter configuration to laser fusion research. Most of the previous development experience focused on the development of full-aperture Wolter mirrors and imaging systems. It is difficult to obtain the theoretically designed ultra-high spatial resolution since small aperture and closed quadric mirror are hard to be processed. Errors in the form and roughness of the mirror surface directly influence the performance of the Wolter configuration.MethodsA submicron resolution X-ray microscope is designed for high-precision RT instability diagnostics. By improving the Wolter configuration, this paper transforms the closed inner surface that could not be directly processed and tested into an open outer surface that could be directly processed and tested by using part of the sector. The improved Wolter configuration is a double mirror structure based on a rotating hyperboloid mirror and a rotating ellipsoid mirror. It still has the technical features of the original Wolter configuration and can meet the technological requirements of high-precision optical treatment, inspection, and coating. A Wolter microscope system with large grazing angle and high magnification is designed. The main structural parameters of the system, such as object distance, grazing angle, magnification, and mirror size, are optimized by theoretical derivation and ray-tracing simulation. A large grazing angle and high reflectivity at the specific energy point can be achieved by coating periodic Cr/C multilayer films on the mirror surface. The ray-tracing simulation verifies the optical structural parameters and evaluates the imaging performance of the system.Results and DiscussionsThe design and verification of a 2.5 keV submicron resolution modified Wolter microscope has been completed. The system working energy point is designed as 2.5 keV with a grazing angle of 2.0°, and the system magnification factor is 35×. Limited by the angular bandwidth of the multilayer films, the effective field of view is about ±0.35 mm. At the current technical levels, the mirror slope error is 1 μrad, surface shape accuracy is λ/43,and the roughness is 0.3 nm. In this condition, the resolution of the central field of view is about 0.63 μm, and the spatial resolution over the full field of view is better than 1 μm, which satisfies the designed submicron resolution. At the same time, if the accuracy of the surface shape increases to λ/85, the system can achieve imaging ability near the diffraction limit. The system is characterized by high collection efficiency and the geometric solid angle is 3.73×10⁻⁵ sr, without considering the reflectivity of multilayer films. While considering it, the response efficiency of the system reaches a peak of 1.52×10⁻⁵ sr and is greater than 7.55×10⁻⁶ sr in the field of ±0.28 mm.ConclusionsThe design of a submicron resolution X-ray microscope based on an open Wolter configuration is systematically described. The optical structure, design methodology, and performance characteristics of the microscope are presented in detail. A set of 2.5 keV submicron X-ray microscope parameters for RT instability diagnostics is provided. At the same time, it is pointed out that since the open configuration uses a portion of the mirror for imaging, the solid angle is smaller than that of the original configuration, but it is still larger than that of the pinhole camera and KB microscope commonly used in diagnostics. With the improvement in the super smooth rotary quadric mirror processing technology and a further increase in the effective mirror width, the geometric solid angle of the microscope can be greatly raised. This study extends the application of the Wolter configuration to high-precision radiographic imaging diagnostics. An X-ray optical configuration with a large field of view, high spatial resolution, and high collection efficiency is provided, which can effectively compensate for the shortcomings of existing diagnostic equipment. In the future, it is expected to play an important role in studying the growth of disturbance in low amplitude and high spatial frequency planetary modulated targets driven by long laser pulses.