


Please enter the answer below before you can view the full text.
7-6=

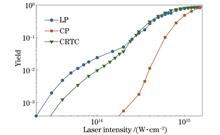
ObjectiveThe interaction of atoms, molecules, and laser fields can generate many interesting nonlinear phenomena in the research on strong field physics. Among them, non-sequential double ionization (NSDI) has become a research hotspot. In the past, people mainly studied phenomena related to NSDI in the monochromatic laser field. With the continuous development of laser technology, a combined electric field has been applied to the study of NSDI for atoms and molecules. The electric field is composed of two circularly polarized (CP) laser fields with fixed frequency and is also called two-color CP laser field. At present, the counter-rotating two-color circularly polarized (CRTC) laser field is widely applied in research on enhancing the NSDI yield due to its special electric field structure. In recent years, studies have shown that the CRTC laser field is beneficial to increase the NSDI yield for O2. However, for triatomic molecules with more nuclei, whether the CRTC laser field can still increase the NSDI yield is an unexplored question. The dynamics of linear triatomic molecules (CO2) in the linearly polarized (LP) laser field and CP laser field have been studied, but there are few studies on the CO2 dynamics in CRTC laser fields. Therefore, we compare and analyze the NSDI yield for CO2 driven by intense laser fields, and further complement the research on the electron dynamics process in NSDI of linear triatomic molecules.MethodsThe method we adopt is based on the classical ensemble method for solving the time-dependent Newton equation. This method has been widely employed in the study of strong laser fields and atomic-molecular interactions. The NSDI electron dynamics of atomic molecules are simulated through the classical ensemble method in the following three steps. First, a stable initial ensemble is obtained. Second, the laser field components are added to the time-dependent Newton equation, and the initial ensemble is substituted to obtain the final coordinates and momentum distribution of the electrons. Third, the data with double ionization is screened. The initial ensemble is mainly obtained by the following ways. At first, the spatial positions of two electrons are given by the Gaussian random matrix, the total potential energy of two electrons is calculated, and the coordinates of the potential energy less than the total energy are filtered. Then the total kinetic energy is obtained by subtracting the total potential energy from the total energy, and the total kinetic energy is randomly assigned to the electrons to obtain their momentum and coordinates. Finally, the coordinates and momentum of two electrons are substituted into the time-dependent Newton equation without the laser field for a period of time, and then a stable initial system synthesis is obtained. The LP laser field we leverage has a wavelength of 1200 nm, the CP laser field has a wavelength of 1200 nm, and the CRTC laser field is a combination of two circularly polarized laser beams with wavelengths of 1200 nm and 600 nm.Results and DiscussionsFirst, we calculate the NSDI yield for CO2 in LP, CP, and CRTC laser fields for various laser field intensities (Fig. 1). The results show that the yield of CO2 molecules under the CRTC laser field is higher than that under the LP laser field when the laser field is higher. However, the opposite results are obtained when the laser field intensity is lower. Since the knee structure doesn't occur in the yield curve under the action of the CP laser field, it is not discussed in our paper. Then, we calculate the electron return energy diagram based on the main time distribution of the recollision (Fig. 3). The return energy diagram can help us derive the reason for the intersection of the CO2 yield curves. Second, we investigate the factors affecting the CO2 NSDI under the action of intense laser fields. By comparing the single ionization rate and double ionization rate of CO2 in the LP laser field and CRTC laser field (Fig. 4), we can conclude that the main factors affecting the CO2 NSDI are the laser intensity and laser field type. Third, we explore the electron dynamics process for CO2NSDI in the areas with lower laser intensity and higher laser intensity respectively. The results show that under lower laser intensity, the NSDI yield driven by the LP laser field is higher than that driven by the CRTC laser field because of the lower suppression barrier (Fig. 5). However, when the laser intensity is higher, the suppression barrier will be distorted and then the main factor affecting the NSDI yield is the structure of the laser field in this case. As the CRTC has a three-lobed structure (Fig. 7) which helps to increase the number of electrons undergoing recollision, the NSDI yield in the CRTC laser field is higher than that in the LP laser field.ConclusionsOur paper investigates the NSDI yield for linear triatomic molecular (CO2) driven by LP, CP, and CRTC laser fields. The results indicate that the NSDI yield in the CRTC laser field is lower than that in the LP laser field under lower laser intensity. This is because the interaction between the laser field and the molecular coulomb potential forms a suppression barrier, and the suppression potential in the CRTC laser field is higher than that in the LP laser field. As a result, the ionization of the second electron in the CRTC laser field is limited. However, when the laser intensity is higher, the yield in the CRTC laser field is higher than that in the LP laser field. This is because with the increasing laser intensity, the molecular coulomb potential is distorted, and then the molecular structure almost no longer exerts an effect on the ionization rate, which is largely influenced by the laser field structure. The CRTC laser field is characterized by a special three-lobed structure, and it can help to increase the number of returning electrons and the electron recollision possibility. Therefore, the CO2 yield is higher under the action of the CRTC laser field. We further complement the study of the NSDI electron dynamics process of linear triatomic molecules driven by intense laser fields, and our results also provide references to improve the NSDI yield of molecules in experiments.
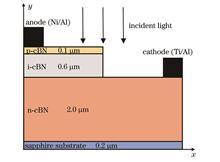
ObjectiveIn recent years, there have been many studies on the preparation of high-quality hexagonal boron nitride (hBN) materials and the application of hBN ultraviolet (UV) photodetectors. Cubic boron nitride (cBN) has a higher band gap compared with hBN [cBN: (6.4±0.5) eV, hBN: (5.9±1.0) eV], and a higher hardness and melting point, which makes cBN-based UV photodetectors more advantageous. However, on one hand, due to a large number of spontaneous defects inside cBN and the non-uniform process, which result in poor doping efficiency of the prepared devices; on the other hand, different doped impurities exhibit different optical and electrical properties, both making the poor performance of the detectors. Additionally, different photodetector structures such as pin, APD, and heterostructure can also bring about performance differences. Silvaco TCAD software is based on a series of physical models and physical equations that rely on well-established solid-state and semiconductor physics theories or on some empirical formulas to accurately predict the electrical, thermal, and optical results of semiconductor devices. Meanwhile, mesa pin photodetectors feature low dark current and high internal quantum efficiency. Therefore, a numerical model of cBN-based mesa structured pin photodetector is built by Silvaco TCAD software, and the effects of different doping concentrations and thicknesses of the cBN layer on photocurrent, dark current, and internal quantum efficiency of this model are calculated.MethodsThe numerical calculation model of cBN-based mesa-structured pin is built by Silvaco TCAD software (Fig. 2). As the intrinsic layer is n-type by default in the undoped case, it is replaced by a n-type cBN with a doping concentration of 1×1015 cm-3 and a thickness of 0.6 μm, and p-type and n-type background carrier concentrations are set as 1×1014 cm-3 and 1×1019 cm-3 with thicknesses of 0.1 μm and 2.0 μm respectively. Based on the constant low-field mobility model (conmob), parallel electric field-dependent mobility model (fldmob), Auger recombination, Shockley-Reed-Hall (SRH) recombination, and basic semiconductor equations of Poisson's equation, carrier transport equations, and carrier continuity equations, the effects of doping concentrations of each layer and thicknesses of each layer on the photocurrent, dark current and internal quantum efficiency are simulated and calculated by the "control variate" method. Firstly, the spectral response of the initial structure is obtained in the deep UV band (Fig. 3), which indicates that the device has a strong response to deep ultraviolet. Secondly, on this basis, the doping concentrations of p-type, i-type, and n-type layers are varied to analyze the changes in performance parameters and select the better doping concentration values with sound device performance. Finally, the thicknesses of p-type, n-type, and intrinsic layers are changed to analyze the performance and select better values.Results and DiscussionsThe doping concentration of p-type rises, and the photocurrent, dark current, and internal quantum efficiency firstly increase and then decrease (Figs. 4-6). This is because the concentration of holes in the p-type region is higher and the probability of recombination increases, resulting in fewer electron-hole pairs generated by photoexcitation. The photocurrent and dark current decrease with the increasing doping concentration of the i-type layer, while internal quantum efficiency is hardly affected (Figs. 7-9). The possible reason is that the intrinsic layer is replaced by a n-type layer and the rising electron concentration increases the recombination probability, leading to the decreased photocurrent. The dark current decreases with the rising doping concentration which enhances the built-in electric field. The dark current increases with the increasing doping concentration of the n-type layer (Fig. 11), but the photocurrent and internal quantum efficiency decrease with it (Figs. 10 and 12). The possible reason is that the heavy doping concentration of the n-type layer increases the diffusion current inside the region, which causes decreased photocurrent and internal quantum efficiency and increased dark current. The photocurrent and internal quantum efficiency decrease while the dark current increases with the rising thickness of the p-type layer (Figs. 13-15). Many photogenerated carriers will be absorbed by the p-type layer, which is too thick to allow carriers to diffuse into the electric field region and form photocurrent. The dark current increases with the thickness of the intrinsic layer while the internal quantum efficiency decreases with it (Figs. 17 and 18). Differently, the thicker intrinsic layer thickness leads to a smaller photocurrent at low bias,but the photocurrent is positively correlated with thickness at high bias(Fig. 16). Thus, the effect of bias voltage on photocurrent should be considered. An increase in the n-type layer thickness increases the photocurrent but causes a little decrease in the internal quantum efficiency, without clear regularity of thickness and dark current (Figs. 19-21). The increasing thickness of the n-type layer means rising light absorption area, and the rising volume/area ratio decreases the recombination. Those could be the possible factors for the photocurrent increase, which causes the current crowding phenomenon, then local heat concentration, and higher thermal energy obtained by electrons. Finally, Auger recombination is enhanced to reduce the internal quantum efficiency.ConclusionsThe increase in the doping concentration of the p-type layer makes all the parameters increase first and then decrease, but the overall change has little effect. The increasing doping concentration of the i-type layer decreases the photocurrent and dark current and has little effect on the internal quantum efficiency. The rising doping concentration of the n-type layer makes the photocurrent and internal quantum efficiency increase, and the dark current greatly decreases to around 10-20 A. Increasing the thickness of the p-type layer exerts almost no effect on the dark current, but decreases the photocurrent and internal quantum efficiency. The rise in intrinsic layer thickness will increase the dark current and decrease the internal quantum efficiency. The photocurrent change with the thickness of the intrinsic layer may also be controlled by the bias voltage. The larger thickness of the n-type layer leads to larger photocurrent, but it has little effect on the dark current and internal quantum efficiency. Since there are no defects in the material during the simulation and the impurities are uniformly distributed, the calculation results are ideal. However, the actual experimental preparation of the device is influenced by the process factors, and the various defects introduced in the material and the non-uniform distribution of impurities make the actual value worse than the simulated calculation value. Finally, the doping concentrations of p-type, i-type, and n-type layers are set as 1×1017 cm-3, 1×1015 cm-3, and 1×1015 cm-3, and the thicknesses of p-type layer, i-type layer, and n-type layer are 0.1 μm, 0.8 μm, and 2.2 μm respectively, the performance obtains the photocurrent is 3. 910×10-8 A, with a maximum dark current of 8.177×10⁻²⁰ A and internal quantum efficiency of 98.565%.
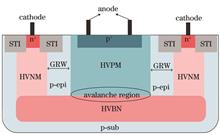
ObjectiveOwing to outstanding advantages such as small size, low power consumption, and high time resolution, direct time of flight (dTOF) detectors have attracted great interest in numerous fields, including automotive driving, facial recognition, augmented and virtual reality (AR/VR), and 3D imaging. Such systems exploit a fast on-chip time-to-digital converter (TDC) in conjunction with single-photon avalanche diode (SPAD) to measure the TOF value, which can achieve high interference immunity and wide dynamic range. Currently, they are rapidly developing towards the direction of low-cost and high integration density compatible with the silicon-based process. However, some problems still exist in practical applications, such as the low safety threshold of human eyes and mutual restriction between resolution and dynamic range. To this end, we implement a near-infrared single-photon dTOF detector with high sensitivity, high time resolution, and wide dynamic range based on 0.18 μm Bipolar-CMOS-DMOS (BCD) technology.MethodsThe detector is mainly composed of a TDC circuit, 16 SPADs, and an analog front-end (AFE) circuit that is coupled with each SPAD (Fig. 3). The integrated SPAD device (Fig. 1) adopts a new structure with a deep high-voltage p well (HVPW)/buried n+ junction as avalanche multiplication region to significantly improve the near-infrared photon detection probability (PDP). A certain distance is set aside between the high-voltage n well (HVNW) and HVPW, and is the guard ring width (dGRW). The virtual guard ring formed by the low doping p-type epitaxial layer helps lower the dark count noise. The proposed SPAD devices with dGRW is 0.5, 1.5, 2.5, and 3.5 μm respectively are simulated by technology computer-aided design (TCAD) based on 0.18 μm BCD technology to study the influence of dGRW on device performance (Fig. 2). The simulation results show that the device can work normally at dGRW=2.5 μm, and the high avalanche field can be obtained to ensure a higher detection probability for near-infrared photons. Meanwhile, the low field in the guard ring region can avoid the dark count noise caused by the carriers generated at the shallow trench isolation (STI) interface. In the readout circuit, the AFE circuits are directly connected with the SPADs to cut off avalanche current and generate narrow pulses. These narrow avalanche pulses are combined by OR tree into one signal which is fed into TDC as a stop signal. Furthermore, a three-step hybrid TDC consisting of the coarse counter, fine counter, interpolator, and phase-locked loop (PLL) is designed to obtain high time resolution and wide dynamic range (Fig. 4). The PLL is a third-order type-Ⅱ loop and the voltage-controlled oscillator (VCO) is composed of a four-stage ring oscillator to offer four-channel multi-phase clocks (P1, P2, P3, and P4) with low jitter, low phase noise, and uniform phase distribution. The fine counter adopting an asynchronous counter can not only count the clock number of P1 but also generate a lower frequency clock to drive the coarse counter. The coarse counter driven by a lower frequency clock adopts a synchronous counter with a linear feedback shift register structure, which can easily expand the dynamic range by increasing the number of counter bits. The start/stop interpolator employs D flip-flop and transmission gate (TG) to latch the state of four-channel multi-phase clocks when the rising edge of the start and stop signal arrives, achieving a high resolution which is 1/8 period of the clock P1.Results and DiscussionsThe proposed dTOF detector is fabricated in the 0.18 μm BCD technology and its electrical and optical properties are verified. The I?V characteristic of the SPAD is firstly measured with avalanche breakdown voltage of around 42.5 V, which matches well the TCAD simulation results (Fig. 7). DCR measurement results (Fig. 8) show that the DCR variation with temperature is not obvious and the overall level is lower than 1 kHz when the temperature is below 60 ℃. More importantly, the data demonstrates excellent performance of 200 Hz at 24 ℃ and 5 V excess bias voltage (Vex). The PDP measurements (Fig. 9) reveal that the PDP reaches a peak of 43.3% (600 nm) at Vex=5 V. Additionally, due to the deep avalanche region, there is a higher response sensitivity for near-infrared photons (780-940 nm), and a PDP of 7.6% is obtained at 905 nm. The measurement is performed by the external triggering to evaluate the dTOF readout circuit performance. Driven by a 30 MHz clock, the dTOF readout circuit can achieve a high resolution of 130 ps and a dynamic range of 258 ns (Fig. 11), with a differential nonlinearity (DNL) and integral nonlinearity (INL) less than ±1 LSB (1 LSB=130 ps) respectively (Fig. 12). In addition, the precision of the proposed detector has also been evaluated by carrying out almost 1000 consecutive single-shot measurement for different fixed TOF values. The measured results show that the statistic histogram of the fixed TOF (80 ns) presents Gaussian distribution and the peak histogram data matches well with the actual TOF (Fig. 13).ConclusionsA near-infrared single-photon dTOF detector with high sensitivity, high time resolution, and wide dynamic range is implemented by the 0.18 μm BCD technology. The test results show that at Vex=5 V, the PDP peak of the SPAD reaches 45%, the near-infrared PDP at the 905 nm wavelength is larger than 7.6 %, and the dark count rate (DCR) is as low as 200 Hz. Furthermore, the TDC circuit driven by multi-phase clocks with low jitter, low phase noise, and uniform phase distribution achieves a high resolution of 130 ps and a dynamic range of 258 ns with excellent linearity. The proposed dTOF detector features a high safety threshold for human eyes, high sensitivity, low noise, and high linearity, which is suitable for the application of low-cost and high-precision lidar systems.
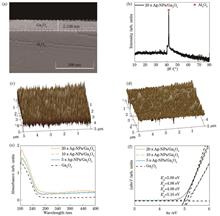
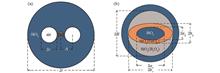
ObjectiveThanks to the low false alarm rate and high signal-to-noise ratio, deep ultraviolet (DUV) photodetector (PD) shows great application potential in ozone hole detection, high-voltage electric fire alarm, stealth bomber, and missile alarm. Gallium oxide (Ga2O3) is one of the most ideal materials for DUV PDs due to its suitable and tunable bandgap (4.5-5.3 eV), simple preparation process, and high stability. Nowadays, many studies focused on crystalline Ga2O3 film DUV PDs, but the lattice mismatch and strict growth parameters during the preparation put forward higher requirements for substrate materials and growth equipment. Compared with crystalline Ga2O3, amorphous Ga2O3 films have low preparation requirements and are easier to generate larger photocurrents due to the promotion of carrier separation by intrinsic defects. However, amorphous Ga2O3 is prone to higher dark current due to more defects. It is necessary to introduce noble metal Ag nanoparticles (Ag-NPs) to improve the photodetection performance of amorphous Ga2O3. On one hand, the formation of Schottky barriers between Ag-NPs and Ga2O3 films helps reduce the dark current of amorphous Ga2O3. On the other hand, the surface plasmon vibration of Ag-NPs can enhance the absorption of Ga2O3to UV light. Additionally, Ag-NPs can generate a large number of hot carriers under UV light to allow hot electrons with sufficient energy to overcome the Schottky barriers. We provide a feasible approach to realize DUV PDs with low dark current and high photo-to-dark current ratio (PDCR).MethodsAmorphous Ga2O3 films are grown on sapphire substrates by the facile radio frequency (RF) magnetron sputtering technology. The sputtering is carried out at room temperature for 70 min with chamber pressure and Argon flow rate of 1 Pa and 20 sccm respectively. The obtained Ga2O3 films are cut into four parts, and three of them are continuously sputtered with Ag-NPs on the Ga2O3surface by direct-current (DC) magnetron sputtering. The sputtering time is 5, 10, and 20 s respectively. The obtained samples are labeled as 5 s Ag-NPs/Ga2O3, 10 s Ag-NPs/Ga2O3, and 20 s Ag-NPs/Ga2O3. Finally, the four samples obtained previously are annealed in a tube furnace for 2 h at an annealing temperature of 200 °C. The crystal structure of the sample is characterized by X-ray diffractometer (XRD), the cross-section morphology of the sample is by scanning electron microscope (SEM), and the surface morphology of the sample is by atomic force microscope (AFM). Additionally, the absorption spectrum features Q6 ultraviolet-visible (UV-Vis) spectrophotometer, and the low-pressure mercury lamps with wavelengths of 254 nm and 365 nm are employed as the ultraviolet light source. A pair of cylindrical metal indium (In) with a diameter of 1 mm and a spacing of 1 mm is pressed on the surface of samples as electrodes, and the current-voltage (I-V) characteristics and transient response curve (I-t) of the PDs are measured by a B1505A power device analyzer.Results and DiscussionsAFM results confirm the introduction of Ag-NPs on the surface of amorphous Ga2O3 films, and the surface mean square root (RMS) roughness of the Ag-NPs/Ga2O3 film after sputtering Ag nanoparticles for 20 s is significantly increased from 0.218 to 6.390 nm [Figs. 1 (c) and 1(d)]. Meanwhile, the absorption of Ga2O3 to UV light also increases obviously after sputtering Ag-NPs [Fig. 1 (e)]. 20 s Ag-NPs/Ga2O3 presents a lower dark current than amorphous Ga2O3 due to the Schottky junction formed between Ag-NPs and Ga2O3 films, which further forms a potential barrier and reduces the dark current [Fig. 2 (a)]. Under the irradiation of 254 nm UV light, Ag-NPs/Ga2O3 films exhibit a higher photocurrent than amorphous Ga2O3. In particular, the photocurrent of 20 s Ag-NPs/Ga2O3 at 5 V is 18.8 times higher than that of amorphous Ga2O3[Fig. 2 (b)]. This may be due to the enhanced scattering of UV light by the plasmonic vibrations of the Ag-NPs on the surface of Ga2O3 films, thus leading to enhanced absorption of UV light by Ga2O3 and an increase in the photocurrent of the Ag-NPs/Ga2O3 PD. Additionally, the Ag-NPs vibration may generate a large number of hot carriers to have enough energy to cross the Schottky barriers between Ag-NPs and Ga2O3 films, which leads to an increase in the photocurrent of the PD. At this point, the PDCR is as high as 5.9×10⁵, the rejection ratio (254 nm/365 nm) is 1.6×10⁴[Fig. 2 (c)], and the responsivity is 36.1 mA/W [Fig. 3 (c)], with the detectivity of 2×10¹⁴ Jones and external quantum efficiency of 17.7% [Fig. 3 (d)]. Meanwhile, both the amorphous Ga2O3 detector and the Ag-NPs/Ga2O3 detector have short response time (Fig. 4).ConclusionsIn summary, the Ag-NP composite amorphous Ga2O3 film DUV PD is prepared by a room temperature magnetron sputtering technology. The PD exhibits an excellent photodetection performance. Under 5 V voltage, the dark current of the detector is as low as 94 fA and the PDCR is as high as 5.9×10⁵, and the rejection ratio (254 nm/365 nm) is 1.6×10⁴, with the responsivity of 36.1 mA/W, detectivity of 2×10¹⁴ Jones, and external quantum efficiency of 17.7%. This is not only attributed to the plasmonic vibration of Ag-NPs under UV light, which scatters more incident light into the Ga2O3 film layer to enhance the UV light absorption of the Ga2O3 films, but also to the generation of a large number of hot carriers by Ag-NPs under UV light. These hot carriers enable the hot electrons to overcome the Schottky barriers formed by Ag-NPs and Ga2O3 films, which brings about a significant increase in the PD photocurrent. In addition, the formation of the Schottky barriers between Ag-NPs and Ga2O3 films helps reduce the dark current in the amorphous Ga2O3. This study implies that the introduction of noble metal nanoparticles provides a viable solution to DUV PDs with low cost, dark current, and high PDCR.
ObjectiveThe emergence of new data services and the rapid development of cloud computing have put forward urgent demands for improving transmission capacity in optical interconnection networks. The capacity of traditional single-mode fibers is difficult to enhance due to the nonlinear Shannon limit. Space division multiplexing (SDM) technology has caught extensive attention for its ability to reach maximum capacity. Few-mode fibers are a typical design using SDM, and the mode crosstalk that occurs during the few-mode fiber transmission is a major problem. The multiple-input multiple-output (MIMO) digital signal processing technology is usually introduced at the receiver to solve this problem. However, as the number of guided modes increases, the system complexity will grow nonlinearly, resulting in significant power consumption. Therefore, the communication system should be simplified by suppressing the mode coupling from the root, which is separating the adjacent eigenmodes to the maximum extent. The polarization-maintaining few-mode fibers with special structures can improve the capacity and ensure a higher mode separation degree. However, the previous fiber designs ignore the contradiction between the lower-order mode separation and the higher-order mode separation. Thus, we take this as a breakthrough point to introduce concentric-circular stress-applying region, improving this contradiction relationship and increasing the effective refractive index difference between adjacent modes. Meanwhile, the polarization characteristics, mode effective area, wavelength dependence, mode dispersion, bending resistance, and other indicators are considered to yield better transmission performance and reliability.MethodsTo adapt to the development of optical interconnection networks with short-distance and large-capacity transmission, we propose a concentric-circular stress-applying region-assisted panda polarization-maintaining few-mode fiber. The prominent feature of this fiber is that this concentric-circular region is set around the elliptical-ring core. Since the core mainly determines the guided mode number, parameter optimization is first performed on the semi-major axis (bx) and semi-minor axis (by) of the elliptical-ring core. Subsequently, the concentric-circular stress region with a lower refractive index is introduced between the core and the cladding to improve the effective refractive index difference between the higher-order modes and ensure the separation of fundamental modes. Comparison conducted on optical fibers with the same parameters without concentric-circular stress regions or stress regions of other shapes indicates that the concentric-circular stress region has an excellent ability to separate degenerate modes. Additionally, frequency sweeping is conducted at 1530-1570 nm to investigate the modal wavelength dependency and mode dispersion of the fiber. Finally, the beam propagation method (BPM) is adopted to simulate the fiber bending, and the bending resistance is analyzed. Our study provides ideas for the design of short-distance and large-capacity optical fibers.Results and DiscussionsThrough the design and optimization of the fiber (Fig. 1), the results show that the proposed optical fiber can transmit 10 modes stably (Fig. 6). The introduction of concentric-circular stress-applying region in the structure can enhance the effective refractive index difference between higher-order modes by nearly an order of magnitude, balancing the lower-order mode separation and the higher-order mode separation (Fig. 4). The minimum effective refractive index difference between adjacent modes reaches 2×10⁻⁴ at 1550 nm (Table 1) and not less than 1.8×10⁻⁴ over the C-band. At 1530-1570 nm, mode dispersion is not higher than |-55.0219| ps·nm-1·km-1 (Fig. 7) and can be further reduced by increasing the semi-minor axis of the fiber core to better adapt to the short-distance transmission. In addition, the bending resistance of the fiber is analyzed. The results indicate that when the bending radius is no less than 9.5 cm, none of the 10 modes will be leaked into the cladding and the maximum bending-induced loss is in the order of 10-7 dB/m.ConclusionsWe put forward a panda polarization-maintaining few-mode fiber with concentric-circular stress-applying region. The effects of elliptical-ring core size and concentric-circular stress region size on the effective refractive index of 10 modes and the effective refractive index difference between adjacent modes are studied. Numerical results show that by optimizing the parameters, this structure can separate the degenerate modes transmitted in the fiber. The mode characteristic changes before and after the introduction of the concentric-circular stress region are analyzed. It is proven that this low refractive index stress region can significantly improve the effective refractive index difference between higher-order modes. The bending resistance of the fiber is sound, with small mode dispersion. In addition, the fiber structure is expected to further increase the number of guided modes by changing the size of the core and other parts. The element of the concentric-circular stress-applying region is also suitable for designing other fiber structures. Our research has application value in the future optical interconnection transmission systems to provide a new idea for the development and design of polarization-maintaining few-mode fibers.
ObjectiveSound source localization (SSL) technology is vital in a wide range of applications such as smart robots, unmanned aerial vehicle (UAV) detection, and unmanned driving. Acoustic sensor arrays are the main solution to SSL. However, with the development of small devices, it is difficult for these arrays to simultaneously satisfy the requirements of miniaturization and high precision. Inspired by small animals' auditory organs, bio-mimetic acoustic vector sensors are an alternative to acoustic sensor arrays. The parasitic fly Ormia ochraceainspires mechanical coupling between two membranes with an interaural phase difference (IPD) gain. Bio-mimetic acoustic vector sensors based on mechanical coupling inherit the IPD gain function. The gain effect of the current bio-mimetic acoustic vector sensors is limited to around the eigenfrequency. Meanwhile, electrical sensors are highly susceptible to extreme environments such as strong electromagnetic and high temperatures, while fiber-optic sensors can endure these conditions. We propose a flywheel-like fiber-optic Fabry-Perot (F-P) acoustic vector sensor for wide-range IPD gain based on the diaphragm coupling gain principle. We hope that the diaphragm-coupling fiber-optic F-P acoustic vector sensor can achieve the IPD gain of several kilohertz frequency ranges, adapting to ambiguous sound source direction in extreme environments.MethodsThe flywheel-coupling diaphragm is simplified to a two-degree-of-freedom (2-DOF) mass-spring-dashpot system with two shape modes of rocking mode and bending mode. COMSOL Multiphysics is employed to analyze diaphragm vibration characteristics and the structure parameters of the diaphragm are optimized based on the simulation results. The flywheel-coupling structure on stainless steel sheet is produced by ultraviolet laser etching technology. The adjoint spokes of two flywheel vibration units naturally couple to form a simplified intermembrane bridge coupling structure. The vibration units combined with individual fiber form independent fiber-optic F-P sensing units. The displacement of the vibration units changes the light intensity of the F-P sensing units detected by the intensity demodulation system. The intensity demodulation contains a tunable laser, 1×2 fiber splitter, optical circulators, photoelectric detectors, and data acquisition card (Fig. 8). The operating wavelength is determined in a common linear region of two sensors. The real-time IPD calculation is acquired by a phase-sensitive detection algorithm, and the incident angle of the sound wave is localized based on the IPD. The uncoupling two-sensor array is simultaneously subjected to SSL experiments to contrast with the flywheel-coupling acoustic vector sensor.Results and DiscussionsThe proposed sensor has a wide frequency range of IPD gain. The rocking mode and bending mode eigenfrequency is simulated as 7.2 kHz and 7.6 kHz. The simulation results exhibit a significant gain in the frequency range of 5 kHz to 7.4 kHz, with a maximum gain of 4.5 at 7.2 kHz (Fig. 4). The experimental results are in good agreement with simulations conducted in COMSOL Multiphysics (Fig. 10). The measured eigenfrequency is 7.2 kHz and 7.6 kHz with a slight discrepancy. The sensitivities of the sensing units are S1=0.24 V/Pa@7.6 kHz and S2=0.21 V/Pa@7.6 kHz. Two-dimensional planar SSL in -90°-90° based on IPD cues is achieved (Fig. 11). The experiment results from 5 kHz to 7.4 kHz present a wide frequency range IPD gain with a maximum gain of 5.05 at 7.2 kHz (Fig. 12). Cavity length and fiber end face inclination affect the spectrum of each sensing unit (Fig. 7). As a result, sensor consistency is difficult to achieve due to unavoidable processing errors. Since the phase-sensitive-detection algorithm is affected by noise, low signal-noise-ratio (SNR) signals may incur high localization errors. Both experimental and simulation results characterize that the sensor has a wide frequency range of IPD amplification effect.ConclusionsWe propose a flywheel-like fiber-optic F-P acoustic vector sensor for wide-range IPD gain based on the diaphragm coupling gain principle. The proposed flywheel-coupling diaphragm has two vibration modes of rocking and bending. The corresponding eigenfrequencies of 7.2 kHz and 7.6 kHz are calculated by COMSOL Multiphysics. The sensor has an obvious IPD amplification effect from 5 kHz to 7.4 kHz in the frequency ranges. The maximum sensitivity and gain are acquired at 7.2 kHz in the simulation. Cavity length and fiber end face inclination affect the spectrum of each sensing unit, limiting the SSL accuracy based on interaural intensity difference. Our paper applies a phase-sensitive-detection algorithm to obtain the phase difference between the two signals in real time. However, the method does not apply to low SNR signals. Meanwhile, the algorithm accuracy is affected by DC components, harmonics, and other factors. Finally, the scheme based on IPD is chosen and a flywheel-coupling diaphragm fiber-optic F-P acoustic vector sensor is fabricated. The first-order eigenfrequency is measured at around 7.2 kHz. The structure achieves SSL with IPD gain in the frequency range from 5 kHz to 7.4 kHz, compared with an uncoupling fiber-optic F-P acoustic sensor array. The measured maximum gain factor of 5.05 is better than the simulation results. The maximum line size of the proposed sensor is smaller than the wavelength of the test acoustic wave to realize a miniaturized acoustic vector sensor with a simple structure and easy processing. The detection method using optical principles can be applied to satisfy SSL needs in extreme environments.
ObjectiveVortex beams, distinguished by their unique spiral wavefront structure, phase singularity, and orbital angular momentum, offer possibilities for enhancing system performance. Notably, vortex beams with different modes are spatially orthogonal, enabling their use in orbital angular momentum multiplexing for augmenting the channel capacity and spectral efficiency. Moreover, demultiplexing these beams at the receiving end provides an additional boost to system capabilities.This paper focuses on the application of coherent detection technology to a bi-directional slant path optical wireless communication system, employing orbital angular momentum multiplexing. This approach eliminates the need for image recognition steps, such as diffraction interference, thereby reducing errors introduced during the process. It analyzes the impact of the topological charge, altitude, and transmission distance on the performance of a vortex optical multiplex communication system. By incorporating an adaptive optics system for uplink and downlink correction, we can minimize crosstalk between modes, leading to improved detection sensitivity and channel capacity.MethodsThe architecture of the orbital angular momentum multiplexing coherent detection system for optical wireless communication using bi-directional slant transmission is illustrated in Fig. 1. Fig.2 presents a schematic view of the system's transmitting and receiving ends. At the transmitting end, the source signal laser is split into four beams using a 1×4 coupler. The signal for each channel undergoes external modulation after series-to-parallel conversion and is then transformed into a vortex beam, with topological charges of 1, 2, 3, and 4, through spiral phase plates. These channels are then combined with a 4×1 coupler for coaxial transmission. At the receiving end, a 1×4 coupler divides the beam into four channels, each mixed with local oscillator vortex beams with corresponding topological charges. Following balanced detection, the electric signal is recovered, demodulated, and then converted back into signals through parallel-to-series conversion, enabling signal transmission from the source to the end. The uplink and downlink employ a single adaptive optics system, located near the downlink receiver, for correction. This system's working principle is depicted in Fig. 3. Given the reversibility of the transmission link and the reverse superposition of the wavefront, the distortion of the uplink signal wavefront at the transmitting antenna is conjugate with the wavefront distortion of the downlink received by the receiving antenna. This feature allows for post-correction of the downlink and pre-correction of the uplink.Results and DiscussionsFig. 4 illustrates the coherent gains of signal and local oscillator light with varying topological charges after mixing. These gains include uplink, downlink, corrected, and uncorrected scenarios. When the topological charge of the signal light (ls1) is 1, and the topological charges of the local oscillator (LO) light (llo) are 1 and 2, the corresponding coherent gains stand at 0.867 and 0.156, respectively. Atmospheric turbulence, which is most potent near the surface, induces wavefront distortion in vortex light, reducing coherence between signal and LO light, and affecting their orthogonality. As a result, the downlink's correction effect is superior to that of the uplink. Fig. 8 reveals the bit error rate of each channel and the system's bit error rate under varying transmission distances. With increasing transmission distances, the wavefront distortion caused by strong turbulence in the uplink exceeds the adaptive optics' correction capability. Insets in Fig. 8 show the uncorrected and corrected light intensity and phase distribution after uplink and downlink transmission. The uplink utilizes pre-correction processing, leading to a larger corrected spot diameter compared with the uncorrected one. Wavefront correction does not influence the light intensity distribution, so no differences are observed in the light intensity distribution before and after downlink correction.ConclusionsThe study concludes that atmospheric turbulence can trigger mode crosstalk during vortex optical multiplexing transmission, and extending the transmission distance heightens the system's bit error rate. At the same transmission distance, mode crosstalk becomes more pronounced as the topological load increases. Adaptive optics is typically apt for phase compensation in weak turbulence conditions, with the correction effect of the downlink more obvious than that of the uplink. The vortex beam orbital angular momentum multiplexing coherent detection significantly enhances the system's detection sensitivity and channel capacity. These findings apply to coherent detection communication involving multiple orbital angular momentum multiplexing with an expanded multiplexing interval.
ObjectiveTo solve the nonlinear impairment during transmitting high-order quadrature amplitude modulation (QAM) signals, we propose a high-order QAM transmission system based on Delta-Sigma modulation (DSM). With the commercialization of 5G networks, the number of mobile internet traffic terminals has surged to increase the demand for fronthaul network transmission rates. At present, the mobile fronthaul network interface common public radio interface (CPRI) usually adopts 15-bits sampling width, which means that at least 15 times of oversampling is required, which results in low spectral efficiency (SE). To this end, researchers proposed a fronthaul network based on DSM technology. Under ten times of oversampling, one-bit quantized DSM can provide a signal-to-noise ratio (SNR) of about 33 dB and support 1024QAM mobile fronthaul. Therefore, facing ever-increasing traffic demands, we study the transmission performance of broadband DSM signals to provide certain references for the future design of high-speed fronthaul networks based on DSM technology.MethodsTo study the transmission performance of broadband DSM signals, we carry out the transmission experiment of 100 Gbaud DSM signal. For the power fading caused by chromatic dispersion that often occurs in intensity modulation/ direct detection (IM/DD) systems, we have chosen the O-band transmission. For the insufficient bandwidth for the transmission system, we employ pre-equalization technology to address the high-frequency fading caused by narrow-band channels. We adopt the on-off-keying (OOK) signal as the training sequence and carry out 100 Gbaud optical back-to-back (BTB) transmission. Then, the frequency domain corresponding to the tap coefficient in the steady state of the constant modulus algorithm (CMA) in the digital signal processing (DSP) algorithm is taken as the inverse response of the channel. Afterward, the finite impulse response (FIR) is generated according to the tap coefficients of CMA. Finally, the generated FIR filter is utilized to filter the transmission signal after two-up-sampling to complete the pre-equalization. Through O-band transmission and pre-equalization technology, the transmission of 100 Gbaud DSM signals is successfully realized.Results and DiscussionsFor the transmission of 50 Gbaud DSM signals, the corresponding experimental results are shown in Fig. 4. In the case of 25 km transmission, when the received optical power (ROP) is -2 dBm, the DSM-OOK signal can realize the error-free transmission. In the case of 50 km fiber transmission, error-free transmission is realized when ROP is 0 dBm. Compared with BTB transmission, the transmissions of 25 km and 50 km introduce 2 dB and 4 dB of power penalty respectively. For the transmission of 100 Gbaud DSM signals, the corresponding experimental results are shown in Fig. 6. When the ROP is 2 dBm, the BER of the DSM-OOK signal after BTB transmission and 10 km transmission is 10-5 and 3×10⁻⁵ respectively. However, in the case of 15 km transmission, the conventional DSP algorithm can only achieve BER of 10-4. Therefore, by adding post-filtering (PF) and maximum likelihood sequence estimation (MLSE) algorithm after the traditional DSP, the BER is successfully reduced to 10-5. The final experimental results are summarized in Table 1.ConclusionsThis study realizes the 50/15 km transmission of 50/100 Gbaud DSM signals on the O-band IM/DD link by utilizing one-bit quantized DSM and pre-equalization technology. Thanks to one-bit quantization DSM with SNR of 33 dB, the system supports up to 4096QAM signal transmission that meets the soft decision threshold of 4.0×10⁻², and the EVM of 1024QAM signal meets the EVM standard of 2.5% for mobile fronthaul. In the transmission of 50 Gbaud DSM signals, the 1024QAM mobile fronthaul with a rate of 5×10×127/256=24.8 Gbit/s on 50 km fiber is achieved. In the transmission of 100 Gbaud DSM signals, by utilizing PF and MLSE, the 1024QAM signal mobile fronthaul with a rate of 10×10×127/256=49.6 Gbit/s on 15 km fiber is realized. In addition, the system supports a maximum net bit communication rate of 12×10×127/256×0.75=44.6 Gbit/s. The broadband DSM signal transmission system demonstrated in the experiment provides a solution for high-order QAM signal transmission in the IM/DD link and also provides references for future design of high-speed mobile fronthaul approaches based on DSM technology.
ObjectiveIn the case of a non-line-of-sight azimuth transmission system based on polarization-maintaining fiber, aligning the output light passing through the fiber with the photoelectric conversion receiver is necessary to increase the extremely small diameter of the outgoing light after transmission through the fiber. A beam-expanding system can be introduced to solve this problem, and the azimuth transmission can be achieved in a non-line-of-sight condition. Because the classical refractive beam spreading system is composed of lenses, the influence of lenses in polarization transmission determines the accuracy of the azimuth transmission. However, general studies of the lens focused on the influence of polarization states of incident light and lacked analyses regarding lens parameters and beam-expanding systems comprising lens groups. In the non-line-of-sight azimuth transmission system, the influence of lenses on polarization transmission is key to introducing the beam-expanding system. This system has broad application prospects in many fields, including spacecraft docking in space stations, tunneling engineering, and high-precision instrument measurement.MethodsIn this study, the analysis related to lenses is based on the Jones matrix principle and the Fresnel equation. First, the Jones vector is used to characterize the incident polarized light. Second, the incident light gets refracted after passing through the lens and the Jones vector relationship between the incident and refracted light is calculated using the Jones matrix with respect to the lens. Subsequently, the Jones matrix with respect to the lens can be characterized using the amplitude transmission ratio, which is the ratio between the angle of incidence and angle of refraction. These angles are derived based on the Fresnel equation. Finally, the geometric relationship between the light and lens is analyzed using the ray-tracing method to determine the angle of incidence and refraction. Using the Galileo beam expanding system as an example, the process of polarization transmission with respect to the lens is analyzed in detail and the equation of the deflection angle comprising lens parameters is derived. The influence of the lens parameters on polarization azimuth deflection is simulated and verified via experiments.Results and DiscussionsIn this study, the influencing factors with respect to the linearly polarized light using lenses are divided into three categories: first, the polarization state of the incident light; second, the refractive effect of lens spheres; and third, the material properties of lenses. The polarization-azimuth-deflection equation comprising the lens parameters was obtained based on the study of the lens parameters and beam-expanding system comprising the lens group (Eq. 12). Simulations and experiments conducted herein show that the polarization azimuth deflection is inversely related to the radius of curvature of the lens. When the curvature radius of the lens increases, the polarization azimuth deflection decreases and tends to zero (Fig. 5 and Fig. 11). The polarization azimuth deflection is squared with the incident light radius. When the radius of incident light increases, the polarization azimuth deflection increases, and when the incident radius tends to zero, the polarization azimuth deflection tends to zero (Fig. 6 and Fig.12). The central thickness of the lens is linearly related to the polarization azimuth deflection; that is, when the center thickness of the lens increases, the polarization azimuth deflection increases (Figs. 7 and 13). Furthermore, the polarization azimuth deflection is squared with the refractive index; that is, when the refractive index increases, the polarization azimuth deflection increases (Fig. 8).ConclusionsBased on Fresnel equations and Jones matrixes, this study analyzes the influence of lens parameters on polarization transmission, which is mainly reflected in the polarization azimuth deflection of polarized light. Using the Galileo beam spreading system as an example, the geometric relationship of light in the beam spreading system is analyzed via the ray-tracing method. Then, the polarization azimuth deflection equation comprising the lens parameters is derived. Subsequently, the influence of curvature radius, center thickness, the radius of incident light, and refractive index on the polarization azimuth deflection are simulated, and the principle is analyzed. The results of our study show that the curvature radius is inversely related to the polarization azimuth deflection; that is, when the curvature radius decreases, the polarization azimuth deflection increases, and when the curvature radius tends to approach ∞, the polarization azimuth deflection tends to be zero. Meanwhile, the center thickness is linearly related to the polarization azimuth deflection; that is, when the center thickness increases, the deflection angle increases. The incident light radius is squarely related to the polarization azimuth deflection; that is, when the incident light radius increases, the polarization azimuth deflection increases, and when the incident light radius tends to be zero, the polarization azimuth deflection also tends to be zero. The refractive index is squared with the deflection angle; that is, when the refractive index increases, the polarization azimuth deflection also increases, and when the refractive index tends to zero, the polarization azimuth deflection tends to be zero. This study provides a reference for the introduction of the beam-expanding system in the non-line-of-sight azimuth transmission system based on the polarization-maintaining fiber.
ObjectivePerimeter security technologies, such as electronic fences and tension networks, are currently outperformed by the phase-sensitive optical time domain reflectometer (Φ-OTDR). Φ-OTDR, known for its antielectromagnetic interference, high concealment, and large monitoring range, provides efficient large-scale monitoring at a reduced cost. Moreover, it not only can locate intrusion events but also identify event types when combined with signal recognition methods. These unique attributes make it valuable for perimeter security applications. Existing identification methods for perimeter intrusion signals are predominantly reliant on machine learning and deep learning techniques. However, machine learning methods require a high level of expert knowledge and their classification efficacy heavily depends on the chosen combination of features and classifiers. Furthermore, the currently available deep learning methods suffer from inadequate learning ability for time-series signals and require complex calculations. To address these challenges, we propose a deep learning recognition model that incorporates a multiattention mechanism. This model was designed to enhance the extraction of critical signal features and improve network learning capabilities. We used the DAS system to gather signals from climbing, knocking, trampling, and no intrusion events, to validate the effectiveness of our proposed method. We also contrasted the recognition rate and efficiency of various deep learning models and assessed the differential impacts of machine learning and deep learning for large sample multiclassification issues.MethodsWe first extracted the time-domain waveform of the vibration signal using a signal demodulation technique and then employed a mobile difference method to locate the intrusion event. Following this, we introduced a multiattention temporal convolutional network (MATCN) recognition model, which provides the collected vibration signals directly for identification. This model utilized the channel attention mechanism to optimize the residual module, thereby enabling the selective learning of crucial information from different feature channels. Moreover, we employed the leaky rectified linear unit (Leaky ReLU) to mitigate the issue of neuron death during convolution and to enhance the model's robustness. Furthermore, we incorporated a temporal attention mechanism to help the network identify critical information-laden time slices. We determined the depth of the MATCN based on number of stacked layers in the residual module, informed by the changes in the validation sample's loss function value during training. We conducted ablation experiments to validate the proposed strategy's effectiveness. We also compared MATCN with other typical networks for timing signal recognition tasks, including long short-term memory networks (LSTM), convolutional layers incorporated into long short-term memory networks (CNN-LSTM), and temporal convolutional networks (TCN). An early stop mechanism was added during the network training process to prevent model overfitting. We compared the iteration speed, training epoch, and recognition rates of the different deep learning models. Lastly, we contrasted the recognition effects of MATCN and machine learning methods using two feature sets: zero crossing rate, kurtosis, energy entropy, and approximate entropy; zero crossing rate, kurtosis, skewness, and permutation entropy. These features were combined with common classifiers such as random forest (RF), K-nearest neighbor (KNN), and support vector machine (SVM) for recognition. We compared the recognition effectiveness of different feature group-classifier combinations.Results and DiscussionsWe devised performance comparison experiments for different deep learning models, employing LSTM, CNN-LSTM, TCN, and MATCN to process the same training and validation samples. The network training effectiveness is evaluated by comparing the iteration time, number of epochs, training time, and recognition rate of validation samples throughout the training process for each network (Fig. 13, Table 2). Network performance was assessed based on the recognition rate of each event and the testing time for nontraining samples (Table 3). The results demonstrate that although the iteration speed of MATCN is marginally slower than that of TCN, MATCN require less training time to converge, resulting in the highest overall training efficiency. Moreover, the recognition rate of MATCN for nontraining samples reaches 98.50%, and the recognition time is a mere 0.53s, thus outperforming LSTM and CNN-LSTM. Machine learning methods were also employed to identify the same training and nontraining samples, revealing that the recognition efficacy of machine learning relies heavily on feature extraction and classifier selection. The highest recognition rate achieved by machine learning is 88.67%, falling short of MATCN and even LSTM, thereby underlining the advantages of deep learning for large sample multiclassification problems (Fig. 14).ConclusionsTo address the issue of high expert reliance in machine learning and inadequate learning ability in deep learning for critical time-series signal features in optical fiber perimeter security pattern recognition, we propose a MATCN-based optical fiber perimeter signal recognition model. This model considers the temporal sequence of vibration signals and combines channel and temporal attention mechanisms to extract critical information from various angles. It enhances network learning capability and employs Leaky ReLU to mitigate neuron death during the convolution process, thereby boosting the model's robustness. The recognition results for the four signals indicate that the recognition rate of MATCN for nontraining samples attains 98.50%, thus surpassing LSTM and CNN-LSTM. Furthermore, MATCN outperforms machine learning in handling large sample multiclassification problems. The proposed model can selectively learn critical information across different channels and time slices, facilitating precise and efficient identification for perimeter intrusion signals.
ObjectiveBirefringence is a key parameter to judge whether polarization-maintaining fiber can maintain polarization state, which has research significance. The birefringence of traditional single-mode fibers is very sensitive to subtle changes in the external environment, and two orthogonal polarization modes in fibers are easy to couple. Generally, polarization-maintaining fibers have strong birefringence, and two orthogonal polarization modes with different propagation constants are not easy to couple. The birefringence caused by external environment changes is far less than that of the fiber itself. Therefore, polarization-maintaining fibers have good polarization-maintaining ability and resistance to external interference, with a wide application prospect in optical fiber sensing, optical components, optical fiber communication, and other fields. We design a high birefringence elliptical-core pseudo-rectangle polarization-maintaining fiber with both shape birefringence and stress birefringence. The shape birefringence depends on the ellipticity of the core, while the stress birefringence depends on the pseudo-rectangle structure in the stress region, which has a simple structural design. The structural parameters are optimized by numerical simulations, and the birefringence of the designed fiber is nearly doubled compared with that of the traditional panda-type polarization-maintaining fiber. The designed high birefringence fiber will be helpful to practical engineering and provide the possibility for the sensing of high birefringence polarization-maintaining fibers.MethodsWe study the structure design and birefringence characteristics of numerical simulations in elliptical-core pseudo-rectangle polarization-maintaining fibers. Firstly, the birefringence characteristics of the circular-core pseudo-rectangle polarization-maintaining fiber model are studied and compared with the existing research results to verify the correctness of the proposed polarization-maintaining fiber model. Then, based on the circular-core pseudo-rectangle polarization-maintaining fiber model, the changes in core ellipticity and birefringence characteristics are studied when the core ellipticity changes from less than 1 to more than 1. Then, the von Mises stress distribution and stress-induced birefringence distribution in the x direction of the cross section of the elliptical-core pseudo-rectangle polarization-maintaining fiber are analyzed by simulation software. The influence of the length and width of the stress zone on the birefringence of elliptical-core pseudo-rectangle polarization-maintaining fiber is studied and compared with that of circular-core pseudo-rectangle polarization-maintaining fiber. Next, we research the relationship between the effective refractive index and birefringence of the core fundamental modes in the x and y polarization directions at different wavelengths. Finally, the designed birefringent fibers in other references at home and abroad in recent years are compared.Results and DiscussionsWhen the ellipticity of the designed elliptical core rectangular polarization-maintaining fiber is less than 1, the mode birefringence decreases with the increasing short semi-axis a of the core [Fig. 4(a)]. When the ellipticity of the core is greater than 1, the mode birefringence increases with the rising long semi-axis a of the core [Fig. 4(b)]. The relationship between elliptical-core pseudo-rectangle polarization-maintaining fiber and circular-core pseudo-rectangle polarization-maintaining fiber with the distance between the core and the stress zone is compared and analyzed. As the distance between the core and the stress zone increases, the birefringence decreases significantly (Fig. 5). The functional relationship between the birefringence of elliptical-core pseudo-rectangle polarization-maintaining fiber and circular-core pseudo-rectangle polarization-maintaining fiber is studied respectively. With the increasing length of stress zone, the mode birefringence of the two types of polarization-maintaining fibers tends to rise, but the birefringence is quite different [Fig. 7(a)]. With the increase in the width of the stress zone, the basic trend of the mode birefringence of the two types of polarization-maintaining fibers is the same, with a faster growth rate and smaller birefringence difference [Fig. 7(b)]. Additionally, the birefringence of the designed fiber reaches 8.0794×10⁻⁴ at the wavelength of 1550 nm [Fig. 8(b)], which is nearly doubled compared with that of the traditional panda-type polarization-maintaining fiber. Thus it has a good polarization-maintaining ability.ConclusionsWe design an elliptical-core pseudo-rectangle polarization-maintaining fiber based on shape birefringence and stress birefringence, which has an elliptical core and two symmetric rectangular stress regions. The influence of the size of the rectangular stress region and the core ellipticity on the birefringence of the polarization-maintaining fiber is studied by numerical simulations. When the ellipticity changes from less than 1 to more than 1, the birefringence increases with better polarization-maintaining ability. Under other conditions unchanged, the width of the stress zone required by elliptical-core pseudo-rectangle polarization-maintaining fiber should be smaller than that of circular-core pseudo-rectangle polarization-maintaining fiber to obtain the same birefringence, which indicates a smaller area of stress zone. By optimizing the parameters, the birefringence of elliptical-core pseudo-rectangle polarization-maintaining fiber at 1550 nm is 8.0794×10⁻⁴, which is nearly double that of the traditional panda-type polarization-maintaining fiber. Additionally, the relationship between birefringence and wavelength of the proposed fiber in the C communication band (1530-1565 nm) is also studied. The proposed elliptical-core pseudo-rectangle polarization-maintaining fiber has a simple structure and potential applications in optical fiber communication and sensing.
ObjectiveDepth estimation is an important research topic in the field of computer vision, which is used to perceive and reconstruct three-dimensional (3D) scenes using two-dimensional (2D) images. Estimating depth based on a focal stack is a passive method that uses the degree of focus as a depth clue. This method has advantages including small imaging equipment size and low computational cost. However, this method relies heavily on the measurement of image focus, which is considerably affected by the texture information related to a scene. Measuring the degree of focus accurately in regions with poor lighting, smooth textures, or occlusions is difficult, leading to inaccurate depth estimation in these areas. Previous studies have proposed various optimization algorithms to increase the accuracy of depth estimation. These algorithms can generally be classified into three categories: designing satisfactory focus-measurement operators, optimizing the focus-measurement volume data to correct errors, and using all-in-focus images for guided filtering of the initial depth map. However, numerous factors, including scene texture, contrast, illumination, and window size, can affect the performance of focus-measurement operators, resulting in erroneous estimates in initial focus-measure volume data, resulting in inaccurate depth estimation. Effectiveness of the methods that optimize an initial depth map heavily depends on the accuracy of the initial depth map. Because the initial depth values may be estimated incorrectly owing to insufficient illumination, introducing considerably valid information to improve depth estimation through postprocessing is difficult. Therefore, intermediate optimization methods are ideal for improving the accuracy of a depth map. To solve the problem of inaccurate depth clues in regions showing weak texture and occlusion, this study proposes a novel method based on 3D adaptive-weighted total variation (TV) to optimize focus-measure volume data.MethodsThe proposed method consists of two key parts: 1) defining a structure consistency operator based on the prior geometric information related to different dimensions between the focal stack and focus-measure volume data, which is used to locate the depth boundary and area with high reliable depth clues to increase the accuracy of depth optimization; 2) incorporating the prior geometric information related to the scene hidden in the 3D focal stack and focus-measure volume data into the 3D TV regularization model. The structure of the image is measured using pixel-gradient values. Gradient jumps in the focal stack reflect changes in physical structure, while those in the focus-measure volume data reflect changes in focus level. When the physical structure and focus level exhibit considerable variations at the same position, the structure is consistent and corresponds to an area with reliable depth change. By measuring the structural consistency between the focal stack and focus measure, we can determine the positions exhibiting reliable depth clues and guide the optimization process related to the focus-measure data highly accurately. The traditional 2D TV optimization model has some edge-preserving ability while performing denoising. However, when the noise-gradient amplitude exceeds the edge-gradient amplitude, this model faces a dilemma between balancing denoising and preserving edge details. Based on the guided filtering method, the edge information of a reference image is used to denoise the target image, effectively resolving the dilemma. This leads to a weighted TV optimization model; however, when applying guided filtering to 2D images, the optimization information that can be introduced is limited. Therefore, we attempt to extend this method to a 3D image field. A weighted 3D TV regularization model can balance denoising and edge-preserving abilities high effectively owing to the rich information in 3D data. Herein, the process of optimizing the focus-measure data is modeled as a 3D weighted TV regularization method, and the adaptive weight is determined based on structural consistency.Results and DiscussionsFirst, an analysis is conducted on the selection of model parameters. We observe that adjusting these parameters can considerably impact the performance of the proposed algorithm, thereby optimizing the accuracy of depth estimation. Second, herein, a detailed analysis is conducted on the impact of structural consistency during the optimization process and the problems that may arise because of focusing solely on texture information for optimization. A comparative analysis is also performed with the introduction of 3D structural consistency. Finally, the proposed algorithm is tested on simulated and real image sequence datasets and the results are compared with those from two other methods: mutually guided image filtering (MuGIF) and robust focus volume (RFV). The proposed method computes 3D structural consistency, which is an additional dimension of information, as opposed to the MuGIF method, which uses consistent structural guidance filtering on inputs from all-in-focus and depth maps. The RFV method uses focal stacks to guide focus measure for optimizing depth estimation in 3D. Compared with the RFV method, the proposed method considers the property issues related to focal stack and focus measure and uses their consistent structure to guide optimization. Furthermore, three evaluation metrics are used to analyze and validate the three algorithms with respect to simulated data. The experimental results demonstrate that the proposed method exhibits better performance than the other methods, providing more accurate information for correcting the focusing measure process through 3D structural consistency. The proposed method not only preserves edge information but also preserves texture information with high accuracy and reduces errors in depth estimation.ConclusionsFocal stack contains physical color information of a scene, while focus measure contains textural and geometric structure information of the scene. In this study, we propose a method for measuring the structural consistency between the two to effectively locate the depth discontinuities. A structural consistency weighted TV model enhances the ability of the model to preserve edge information while avoiding the introduction of color information into a depth map. Thus, effectively addressing the problem of loss of depth clues related to focal-stack depth estimation in regions with weak texture and occlusion and increasing the accuracy of depth reconstruction. The computation of the L1 model of TV is relatively easy; however, this computation suffers from local distortion. Using highly advanced regularization terms may further improve the reconstruction effect. Future research needs to consider ways of incorporating increased data and investigating methods to improve the regularization term during the optimization process.
ObjectiveOptical coherence tomography (OCT) is employed as a safe and effective diagnostic tool for a variety of ophthalmic diseases due to its high resolution and non-invasive imaging, which is regarded as the "gold standard" in ophthalmic disease diagnosis. However, various kinds of noise, especially speckle noise, seriously affect the quality of retinal OCT images to reduce the contrast and resolution, which makes it difficult to segment and measure retinal sublayer thickness at the pixel level. Therefore, it is of significance to reduce the noise of retinal OCT images and retain structural details such as layering and edges of the images to the greatest extent. The deep learning-based noise reduction method shows advantages in image quality, especially in preserving edge details. However, for in vivo imaging, it is difficult to obtain a large number of multi-frame registration ground truth images, which affects the performance of the supervised learning method. Therefore, the realization of unsupervised denoising independent of ground truth images is vital in the clinical diagnosis of eye diseases.MethodsWe propose an unsupervised deep residual sparse attention network (DRSA-Net) based on the Noise2Noise training strategy for retinal OCT image denoising. DRSA-Net consists of local sparse attention block (LSAB), depth extraction block (DEB), global attention block (GAB), and residual block (RB). The TMI_2013OCT dataset publicly provided by Duke University is selected and preprocessed, and a total of 7800 Clean-Noisy and Noisy-Noisy image pairs are obtained. The proposed DRSA-Net is compared with the classical deep learning denoising networks U-Net and DnCNN from two aspects of qualitative visual evaluation and quantitative numerical evaluation and is also compared with the traditional BM3D algorithm. Then the denoising effects of three convolutional neural networks under supervised learning and unsupervised learning strategies are compared. Finally, generalization ability tests and network module ablation experiments are performed based on another public retinal OCT image dataset.Results and DiscussionsThe results of unsupervised training denoising (Fig. 3) show that the built model has better denoise and intra-layer fine structure preservation ability for retinal OCT images. U-Net-N2N tends to destroy the details and boundary of layers and introduces some fuzzy structures among layers. DnCNN-N2N brings degradation of layer boundary and blurring of the outer limiting membrane. The comparison between the results of supervised training and unsupervised training (Fig. 4) indicates that when ideal ground truth images cannot be provided, the denoised images of the supervised learning model have more noise, while the unsupervised learning model has a higher denoise degree and can provide clearer structures and edge information. The denoising numerical evaluation results of supervised learning and unsupervised learning (Table 1) show that compared with the original noise images, the supervised learning and unsupervised learning models realize great improvement in various evaluation indexes of the images. Additionally, compared with the traditional block matching algorithm BM3D, the denoising algorithm based on deep learning reduces the denoising time by two orders of magnitude. High-quality noise reduction of OCT images can be achieved within 1 s, and the proposed algorithm can get ahead of most evaluation indexes regardless of what kind of training strategy is adopted. The test results of generalization ability of unsupervised learning (Fig. 5) show that our proposed model has better generalization ability among different datasets, and can obtain a cleaner background than ground truth in terms of background denoise. In terms of structural information retention, it has clearer interlayer structures and more uniform layers. The results of ablation experiments on different modules of the denoising network proposed (Table 3) indicate that the combination of LSAB+DEB+GAB+RB is better in various evaluation indexes, which fully demonstrates the contribution of each module in the network structure to high-quality noise reduction.ConclusionsWe put forward an unsupervised depth residual sparse attention denoising algorithm independent of ground truth images to solve the noise interference in retinal OCT images and the difficulty of acquiring high-quality multi-frame average images in in vivo imaging. The attention mechanism is combined with sparse convolution kernel to complete the information mining between data efficiently and fully, and the Noise2Noise training strategy is adopted to complete the high-quality training with noise images, which achieves a high level of noise reduction and preserves the multi-layer structure information of retinal OCT images. The traditional denoising algorithm and the classical deep learning network are compared and analyzed from the visual evaluation and numerical evaluation including PSNR, SSIM, EPI, and ENL respectively. The denoising effect of supervised learning and unsupervised learning and the experimental results of the generalization ability test on the public retinal OCT image dataset show that the proposed noise reduction algorithm yields good results in various evaluation indexes and has strong generalization. Compared with supervised learning, unsupervised learning can still obtain better noise reduction performance under insufficient data sets.
ObjectiveThe collection of cultural relics in the Palace Museum has a complete system. The cultural relics cover ancient and modern times, with excellent quality and rich categories. The total number of existing collections reaches over 1.8 million pieces (sets), of which more than 8000 are first-class collections. The involved cultural relics are very diverse, mainly including calligraphy and painting, ceramics, metalwork, lacquer, wood, inlaid decoration, textiles, watches, murals, ancient architecture, the copying of ancient calligraphy and painting, and traditional packaging. The Forbidden City not only engages in the maintenance, restoration, and upkeep of cultural relics but also studies the production techniques and disease mechanisms of cultural relics to provide a better preservation environment for cultural relics and promote the development of new protection technologies. Cultural relics are the physical retention witnessing historical human development. It is also the most powerful basis for helping modern people explore history and restore historical truths. The protection and restoration of cultural relics is a multidisciplinary job containing archaeology, physics, chemistry, and biology. Terahertz (THz, referring to the frequency range from 0.1 to 10 THz) selected for research on cultural relic protection has the electromagnetic characteristics of wavelength: perspective, low energy, and high spectral time resolution. Enamel plays an important role in palace art and has complex production processes. Therefore it is of significance to apply THz technology to the conservation and restoration of enamel. This study builds a high-speed scanning THz imaging system based on asynchronous optical sampling (ASOPS) and employs it for the reflection imaging of enamel.MethodsA high-speed scanning THz imaging system is built in the Palace Museum, and it is based on the ASOPS technology. It is a new technology that combines ultrafast spectroscopy with femtosecond laser and can solve the problem of long imaging time. The traditional THz imaging system is divided into two paths, the pump and detection sections through a beam splitter respectively. However, the pump and detection sections of the asynchronous sampling THz imaging system are not split through a beam splitter. They are generated by two femtosecond lasers with controllable repetition rates, and the time delay device of the pump path is canceled. Thus, the time delay between the pump and detection paths is completely controlled by the repetition frequency of the two femtosecond lasers. As shown in Fig. 2, the laser adopted in the experimental measurement has a repetition frequency of 100 MHz, a pulse width of 100 fs, and output laser energy of 300 mW. The spectral width of setup system is 5 THz, the scanning speed is 100 Hz, and the signal to noise ratio is 80 dB.. In this system, the THz wave generation is based on photoconductive antennas. The commonly employed photoconductive material is high-resistivity GaAs. The reflection mode is adopted to test the enamel sheet, and the THz wave is almost vertically incident and focused on the enamel sheet. During the measurement, the enamel sheet is fixed on a three-dimensional (x-y-z) electric translation. The system can not only test flat objects but also test complex shapes such as circles.Results and DiscussionsAs shown in Fig. 3, the length, width, and thickness of the enamel sheet are 11, 6, and 0.3 cm respectively. Enamel is an important component of palace decorations, whereas there are few references on the application of THz technology to enamel both domestically and internationally. Through observations from the enamel sheets, the edges and patterns are made of yellow metal. The thickness of the leveraged metal lines varies in different parts, and the reflection of THz pulses exists both in the glaze and bottom layers. In Fig. 4, the enamel surface is enveloped and not flat, which indicates that the thickness of each position is different. The surface of the metal substrate is flat, which can be estimated as 0.23 cm according to Ref. [2]. As shown in Fig. 4 (a), the grayscale intensity image is the optical contrast of the enamel sheet with different materials in the THz frequency band. The yellow metal part, especially the metal part inside the box, has higher reflectivity, while the reflectivity of the edge pattern is not as high as the metal part inside the box. Although the internal filigree pattern is relatively thin, its shape can also be displayed in THz images. Additionally, no differences in the color of different enamel glazes are observed. The data is further optimized to obtain false color images of the enamel sheet, as shown in Fig. 5 (b). The reflectivity of the box and some edge parts is not the same as the edge part. The reason may be that the metal composition of the two parts is different.ConclusionsWe study the enamel sheet by utilizing the setup system in the Palace Museum. This system is utilized to investigate the enamel sheet. The experimental results show that the reflectivity of the carcass and filigree structure is higher, but the reflectivity of the edge pattern is not as high as that of the intermediate metal. Although the metal wire of the filigree structure is relatively thin, its morphology can still be displayed in THz images. There are no observed differences in the color of different enamel glazes, and the interior of the enamel sheet has at least two layers of structures respectively, including carcass layer and filigree glaze layer. The surface of the glaze layer for enamel is not flat but presents an envelope shape. It may be due to incomplete polishing during the final step of making enamel. The underlying carcass is flat and regular.
ObjectiveThe phase-shifting method can extract the phase with high resolution, high precision, and high robustness. However, since the number of fringe patterns is generally three or more, it is sensitive to positional movement. The 2+1 phase-shifting method can reduce the phase error caused by motion. However, the local specular reflection of the measured object causes local intensity saturation, which leads to phase error. Although the multi-exposure method can extract fringe patterns with a better signal-to-noise ratio (SNR), it is difficult to quantify the exposure time and range. In addition, the number of fringe patterns is huge, and the measurement efficiency is low. The adaptive fringe projection method adaptively adjusts the projected pixel intensity according to the pre-acquired image, but its ability to correct the phase error is limited by the following two aspects. One is the pixel-matching error between the camera and the projector, and the other is the limitation of the grayscale range of the camera and projector. The polarization method has a great suppression effect on specular reflection, but it reduces the SNR on low-reflection surfaces. In addition, the adjustment of the optical path is complicated. For the three-dimensional (3D) measurement of highly reflective objects based on the 2+1 phase-shifting method, a novel double 2+1 phase-shifting method is proposed, which can not only correct the saturation-induced wrapped phase error but also has a higher measurement efficiency.MethodsFirst, the computer simulates the intensity-saturated fringe pattern. When the fringe intensity is saturated, there are high-frequency components in addition to the fundamental frequency component, and the high-frequency components increase with the increase in the intensity saturation coefficient. Therefore, the intensity-saturated fringe pattern can be expressed as a high-order Fourier series. Second, based on the analysis of the Fourier spectrum, the intensity-saturated fringe pattern can be approximately represented by a third-order Fourier series. Third, we calculate the ideal wrapped phase and the actual wrapped phase based on the 2+1 phase-shifting method. We subtract the ideal wrapped phase from the actual wrapped phase and simplify the phase difference according to the Fourier spectrum to establish a saturation-induced wrapped phase error model. From the saturation-induced wrapped phase error model, it can be seen that the 2+1 phase-shifting method contains a saturation-induced wrapped phase error of one time the fundamental frequency. Fourth, based on the above model, the opposite wrapped phase error can be obtained by doing a π phase shift to the original 2+1 phase-shifting fringes. Since the background image (the variable a in Eq. (5)) does not require a π phase shift, the additional fringe sequence is one less than the original fringe sequence. Finally, an additional fringe sequence with a phase shift of π is projected to generate the opposite wrapped phase error. The phase unwrapping adopts three-frequency hierarchical temporal phase unwrapping, and we reduce the saturation-induced wrapped phase error by fusing the unwrapped phases of the original fringe sequence and the additional fringe sequence.Results and DiscussionsThe multi-exposure method can obtain a high-precision unwrapped phase with enough exposure time and a wide exposure time range. The unwrapped phase extracted by the proposed method is close to the multi-exposure method, which is better than the traditional method and the adaptive fringe projection method (Fig. 6). We use the unwrapped phase extracted by the multi-exposure method (23 exposures) as the ground truth and calculate the root mean square error (RMSE) of the traditional method, the adaptive fringe projection method, and the proposed method, respectively. The RMSE of the proposed method is 69.92% lower than the traditional method and 65.2% lower than the adaptive fringe projection method (Table 1). Since the computational cost of each algorithm is similar, the measurement efficiency mainly depends on the number of fringes (Table 2). The number of fringes using the traditional method is 7, the number of fringes using the multi-exposure method (23 exposures) is 7×23=161, and that of fringes using the adaptive projection fringe method is 7×3+15=36. In contrast, the number of fringes using the proposed method is 7+6=13. Compared with that of the multi-exposure method and the adaptive fringe projection method, the measurement efficiency of the proposed method is increased by 91.9% and 63.9%, respectively.ConclusionsThe 2+1 phase-shifting method has good performance in suppressing motion errors. However, highly reflective surfaces such as metals, plastics, and ceramics can cause intensity saturation of the fringe pattern, resulting in phase extraction errors. To this end, we propose a new saturation-induced wrapped phase error model of the 2+1 phase-shifting method. Based on the above saturation-induced wrapped phase error model, an efficient and high-precision double 2+1 phase-shifting method for reconstructing strongly reflective surfaces is proposed. Compared with the traditional 2+1 phase-shifting method and 2+1 phase-shifting method of adaptive fringe projection, the proposed method greatly reduces the saturation-induced phase error. Compared with the 2+1 phase-shifting method of adaptive fringe projection and multi-exposure 2+1 phase-shifting method, the proposed method requires fewer additional fringes and thus has higher measurement efficiency. Therefore, the proposed method has potential applications in the 3D reconstruction of highly reflective surfaces.
ObjectiveSpectral features in hyperspectral video (HSV) enhance the ability to identify similar targets. However, HSV has high dimensions and a large amount of data, which causes great difficulties and high computing costs for feature extraction, and thus it is difficult to apply target tracking technology to HSV. In recent years, the development of snapshot hyperspectral technology has made it possible to acquire HSV. Many researchers have also turned their focus to HSV target tracking technology. In many target tracking processes, the target scale often changes to result in failed algorithm tracking. How to track targets robustly under the scale variations is an urgent problem to be solved.MethodsThe algorithm is based on the correlation filtering framework and the scale-adaptive kernel correlation filter tracker. We employ the difference between the spectral curve of each pixel and the local spectral curve of the target and count the error value to segment the target pixel and the background pixel. The target spectral curve is obtained by averaging the target pixels, and the dimensionality reduction is realized by adopting the simple correlation between the target spectral curve and the image. Meanwhile, the dimensionally reduced image is input into the MobileNet V2 to extract deep features. The target area is judged by the local variance, and the 3D histogram of oriented gradient (HOG) features of the target are enhanced. To preserve the unique spectral information of hyperspectral images and the semantic information of deep features, we utilize the method of channel convolution fusion to obtain more discriminative deep convolution HOG features which are fed into the filter to adapt to scale variations through the scale pooling idea.Results and DiscussionsThree hyperspectral target tracking algorithms are selected for comparison in the experiment to verify the effectiveness of the proposed algorithm. Additionally, the results are presented in the experimental sequence for visualizing the performance of the algorithm. Fig. 7 presents the qualitative results of the algorithm on selected experimental sequences. In the book sequence, since the proposed algorithm adopts the scale pooling idea, it can estimate the scale of the target and track it stably. In the excavator sequence, the proposed algorithm is more robust by leveraging multi-feature fusion. The algorithm shows better adaptability when car sequence and face sequence are challenged by scale variations. We quantitatively evaluate the algorithm performance from two aspects of precision and success rate. Tables 1 and 2 present the values of the precision and success rates of the four algorithms respectively. Fig. 8 indicates the precision and success rate curves of each algorithm on the selected test sequences. Figs. 9 and 10 display the precision and success rate curves related to the scale variation challenge and the out-of-plane rotation challenge respectively. The precision and success rate results indicate that the proposed algorithm shows sound performance on the test sequence. As shown in Fig. 10, the proposed algorithm ranks first in the precision and success rate of the total test sequence. Specifically, the precision is improved by 3.3% and the success rate is increased by 2.2% compared with material based object tracking in hyperspectral video (MHT). Due to the utilization of fused features, the proposed algorithm is more robust. The precision and success rate of the proposed algorithm under scale variations are 19.8% and 14.0% higher than those of the second place, showing excellent adaptability (Fig. 11). The other three algorithms perform slightly worse under the scale variation challenge because they do not have corresponding scale estimation modules. Additionally, as shown in Fig. 12, the precision of the proposed algorithm under the out-of-plane rotation challenge is 1.31% lower than that of MHT, but it ranks first in the success rate due to the absence of a corresponding coordinate affine transformation strategy. Table 3 reveals the precision and success rate of the ablation experiment, and the proposed methods have improved the target tracking robustness.ConclusionsTo solve the tracking failure caused by scale variations in hyperspectral target tracking tasks, we propose a hyperspectral target tracking algorithm based on spectral matching dimensionality reduction and feature fusion. Spectral matching dimensionality reduction provides low-dimensional feature input for the network and reduces computational complexity, and DC-HOG features improve target discriminability. Experimental results demonstrate that the proposed algorithm is better than other algorithms and can handle the scale variations well. Future research will explore an HSV target tracking algorithm with better performance to deal with challenges such as background clutter and out-of-plane.
ObjectiveIn real life, the targets behind the window need to be detected on many occasions. For example, when a natural disaster occurs, the targets inside trapped vehicles and boats should be identified, and it is also necessary for museums to filter out glass display cases of stray light and highlight the true appearance of exhibits. Additionally, the driving status of drivers should be accurately identified in road video surveillance, and in the fight against crimes, it is a necessity to accurately distinguish the location relationship between criminals and hostages behind the window. These occasions require a more reasonable target through-window detection method, and traditional target through-window detection methods have certain limitations in avoiding image degradation. The current research mostly adopts polarization image processing and image fusion methods to solve the image degradation, but these methods are not applicable in the light spot obscuring the target. When reflection interferes with target identification, single polarization suppression reflection is the most commonly employed polarization suppression reflection method. However, in the face of strong reflected light interference, the acquired image is overexposed and it is difficult to distinguish the target from the background. Utilizing double polarization suppression reflection can overcome the strong reflected light interference, and the contrast between the target and the background is improved with lower overall image brightness, and the recognition ability for dark and weak targets is poor in practical applications. Therefore, a more reasonable polarization suppression reflection method is necessary for active imaging, and it can be applied to target recognition under strong reflection interference and to the recognition of dark and weak targets. Finally, better image information for subsequent image processing can be provided.MethodsThe specular reflection of glass is used as the interference object. Firstly, we analyze the ability of polarization suppression reflection and conduct polarization suppression reflection experiments by single polarization suppression method and double polarization orthogonal method respectively. Secondly, we analyze the change law of Mueller matrix elements under different incident angles of light source. M22 and M33 images in the Mueller matrix are different from other matrix elements in the distribution of gray values, and the depolarized images generated by M22 and M33 can effectively distinguish the target from the background. Finally, by comparing the target through-window detection image index, it is proven that the utilization of depolarized images can ensure higher overall brightness of the images and improve contrast between the target and the background simultaneously.Results and DiscussionsThe double polarization orthogonal method suppresses the specular reflection well, with improved contrast between the target and the background and lower overall image brightness (Fig. 8). The M22 and M33 images are the most sensitive to the distinction between the target and the background, and the gray values of the M22 and M33 images are more dispersive than those of other matrix elements (Fig. 10). The mean gray value and standard deviation of M22 and M33 images are significantly higher than those of other matrix elements, which indicates that the brightness dispersion and gray values of M22 and M33 images are much higher than those of other matrix elements, and the incident angles of different light sources show the same pattern (Fig. 11). The depolarized images improve the contrast between the target and the background, and ensure the overall image brightness. Meanwhile, they have a sound image effect in dealing with the target through-window detection at most angles, and do not cause image information loss due to the excessive intensity of the light source (Table 4).ConclusionsThis study designs a Mueller matrix test setup. Firstly, the polarization ability to suppress reflection is analyzed. Secondly, the gray value distribution of Mueller matrix elements under different incident angles of the light source is analyzed to obtain the change law of different Mueller matrix elements. Finally, depolarized images are employed to improve the target saliency. The results show that the double polarization orthogonal method exploits the difference in polarization characteristics between the specularly reflected light and the target reflected light. The orthogonal polarization information is suppressed by the polarizer. The polarization information through the same polarization direction as the polarizer is applied to achieve the purpose of suppressing reflection. However, the overall image brightness obtained by the double polarization orthogonal method is too low, and it is difficult to identify the dark and weak targets. The double polarization orthogonal method is effective but defective in practical application capability.In analyzing the variation pattern of Mueller matrix elements under different incident angles of the light source, the average gray values and standard deviation of M22 and M33 images in the Mueller matrix are significantly higher than those of other matrix elements. This indicates that the dispersion of brightness and gray values of M22 and M33 images are much higher than those of other matrix elements, and the incident angles of different light sources show the same pattern. The depolarized images generated by M22 and M33 can effectively distinguish the target from the background. Therefore, we further adopt Mueller matrix images to generate depolarized images and obtain images with better target through-window detection. The depolarized images generated by M22 and M33 improve the contrast between the target and the background and ensure the overall image brightness. They have a better image effect in dealing with target through-window detection at most angles and do not cause image information loss due to excessive light source intensity. There is a significant improvement over the single polarization suppression method and the double polarization orthogonal method. Therefore, the reasonable use of depolarized images for target through-window detection can effectively suppress reflection and improve the recognition of target detail information. Additionally, a new solution is provided for the relevant applications of product design and the unavoidable requirement for target through-window detection. However, we do not further optimize the depolarized images through image fusion, resulting in bright spots in some parts of the images. In the future, image optimization will be conducted on depolarized images, and image fusion will be employed to restore the images to bright spot-free ones.
ObjectiveIn laser-driven inertial confinement fusion (ICF) drivers used in fusion experiments, shaping and smoothing the target focal spot are key technologies. To improve the irradiation uniformity of the target and reduce various instabilities related to laser-plasma interaction, a distributed and uniform target focal spot is necessary. Moreover, the uniformity of the focal spot must be maintained up to a certain focal depth. Hence, diffractive devices such as continuous phase plates (CPPs) are used to shape the focal spot and beam smoothing techniques are utilized to reduce contrast of the focal spot. Furthermore, polarization smoothing utilizes the birefringence of crystals to separate the beam into two orthogonally polarized beams that are incoherently superimposed, thus reducing the contrast of the focal spot. This study focuses on polarization smoothing in converging beams and presents a mathematical model that fully describes the transmission characteristics of the beam during polarization smoothing. Moreover, this study demonstrates the relationship between the focal spot shape parameters and the smoothing crystal and lens parameters. Furthermore, the longitudinal smoothing effect of the beam far field is quantitatively described for the first time in this study. Herein, the relationship curve between the contrast of the focal spot and crystal parameters is determined and the optimum range of crystal thickness and tilt angle is calculated. The research obtained from this study can provide a reference for the selection of polarization smoothing techniques and the design of smoothing crystals used in laser drivers.MethodsA theoretical and numerical model for realizing polarization smoothing in convergent beams is presented in this study. A CPP is used for shaping the focal spot of a thin lens. The front and back surfaces of the polarization smoothing crystal are parallel and the crystal axis is perpendicular to these surfaces. This crystal is placed in the path of the convergent beam behind the lens. The incident light field is a square aperture that is linearly polarized and comprises a monochromatic harmonic wave. The wave vector of the transmitting beam passing through the above elements is calculated with respect to a spherical coordinate system. The vector expression of the crystal output light field is obtained by combining the ellipsoid equation of crystal refractive index with the wave vector. Then, the far-field distribution near the focus of the lens is calculated using the Huygens-Fresnel diffraction formula. Using small-angle approximation, a simplified relationship between the longitudinal separation of far-field focal spots and crystal thickness and angle is derived based on a simplified vector expression. Numerical simulations are conducted to verify the correctness of the simplified expression.Results and DiscussionsThe longitudinal separation of the far-field focal spots is proportional to crystal thickness and is not substantially affected by the crystal tilt angle [Eq. (21), Fig. 9(a)]. By contrast, the transverse separation is proportional to the crystal thickness and tilt angle [Eq. (22), Fig. 9(b)]. The polarization crystal smooths the far-field focal spot distribution in the transverse and longitudinal directions (Fig. 13), without significant change in the overall shape of the focal spot. The maximum relative intensity and contrast of the smoothed focal spot vary with crystal thicknesses and tilt angles (Fig. 14, Fig. 15). Moreover, the polarization smoothing effect obtained using a crystal with small thickness is similar to that obtained using a wedge-based solution.ConclusionsThis study presents a mathematical model to analyze polarization smoothing in convergent beams. Herein, the formulas for the transverse and longitudinal separations of the focal spot with respect to the thickness and tilt angle of the polarization smoothing crystal are derived. Numerical calculations are performed with respect to the proposed method, and the relationship curves between the focal spot shape parameters and crystal parameters are provided. The numerical-simulation results show that the best smoothing effect with respect to the focal spot can be achieved when the crystal thickness and tilt angle are within the desired range. Further theoretical analysis is required to investigate the relationship between the smoothing effect and other parameters of the system.
ObjectiveTo constantly improve performance requirements for InGaN lasers, we investigate the effect of the In mole fractionin the upper waveguide layer on the performance of InGaN-based blue laser diodes. The research results can be employed to improve the performance of InGaN-based blue laser diodes which have many potential applications in areas such as solid-state lighting, laser displays, and optical storage. Our study is motivated by electron leakage limiting the output power of laser diodes. Due to mobility differences, the injection rate of holes will be slower than that of electrons to bring about varying amounts of hole injection in several quantum wells, which makes electrons leak into the waveguide layer and reduces the carrier density in the active layer. Additionally, the polarization effect of InGaN materials will lead to energy band offset and quantum confinement Stark effect. To this end, many optimization ideas have been proposed, but most of them focus on multiple quantum wells and barriers, lower waveguide layers, and electron barrier layers. Our study shows that the upper waveguide layer also plays a crucial role in the performance of InGaN-based blue laser diodes. By adjusting the In mole fraction of the upper waveguide layer, the corresponding band structure can be changed to alleviate the electron current overflowing from the quantum well, thereby improving the radiation recombination rate and optical output.MethodsBased on the experimental sample structure, an InGaN-based blue laser with the same structure is constructed by PICS3D simulation software. Its photoelectric performance, such as the optical power curve, voltammetry curve, and spectral peak curve, achieves strict comparison. The internal parameters are measured in a manner consistent with the experimental sample. In the reference, the reflectivity of the front cavity surface is modified to 10%, 45%, and 82% in turn, and different slope efficiencies are obtained. The internal loss and carrier injection rate of the laser are indirectly measured by linear fitting. We also adopt the same setting parameters, measure internal parameters in the same way, and compare them with references. It is found that the relative errors of internal loss and carrier injection efficiency are 3.5% and 5.3%, which proves the reliability of subsequent data in our paper. Subsequently, a series of InGaN-based blue lasers are constructed, and the In mole fraction in the upper waveguide layer is optimized by comparing the optical output power, carrier distribution, optical field distribution, radiation recombination coefficient, and energy band curve parameters under different In contents. During employing a constant In component, we find that as the In mole fraction increases, the effective potential barrier to electrons gradually rises, with improved electron leakage. However, when the In mole fraction exceeds 8%, the high component difference will lead to bending energy bands and accumulated excessive charges at the interface, which will cause space separation of electrons and holes, and the wave function overlap will be reduced. In addition, with the rising In mole fraction, the light field also moves away from the active region, thereby resulting in a decrease in the light field limiting factor and a decrease in light output efficiency. Therefore, a series of InGaN-based blue light lasers with gradient components are constructed, and the optimal gradient component is obtained through comprehensive comparison.Results and DiscussionsFirstly, the original sample with strictly consistent parameters and structure is set according to the references, and its optical power curve and wavelength are also consistent with the experimental sample (Fig. 2). The internal loss is measured by adopting the same variable cavity surface method as the experimental process (Fig. 3), which is compared with the references and shows credibility. Secondly, the optical power, electron leakage rate, and wave function coincidence rate of the upper waveguide layer with different constant In contents are compared (Fig. 5). Subsequently, a series of gradient component upper waveguide structures are constructed with fixed final values of the gradient, the initial value of the gradient is changed, and their optical power is compared (Fig. 6). Finally, two different optimized structures with better optical power have been proposed, and both of them reduce electronic leakage and improve slope efficiency, thereby enhancing photoelectric conversion efficiency (Fig. 7). The sample with gradient components has the most suitable height of electron and hole barriers, thus leading to a higher hole injection amount. In terms of optics, our proposed sample changes the refractive index of the material through a gradient upper waveguide layer, which makes the center of the light field move towards the active region (Fig. 11) and is conducive to limiting more carriers to the stimulated radiation recombination in the quantum well.ConclusionsWe investigate the effect of the In mole fraction in the upper waveguide layer on the performance of InGaN-based blue laser diodes. The results show that appropriately increasing the In mole fraction of the upper waveguide layer can reduce the carrier leakage of the original structure, which exerts a significant influence on the output optical power. The In mole fraction in the upper waveguide layer of the original experimental structure is increased to about 8%, and then the slope efficiency rises by 53.54% of the original value and reaches 2.09 W/A at 1.5 A injection current. When the In mole fraction of the upper waveguide layer is changed to 5%-8%, the high hole barrier can be alleviated, with improved electron injection. Meanwhile, the optical field is more concentrated and the optical loss is reduced. The slope efficiency is increased by 69.70% compared with the original structure and reaches 2.31 W/A at 1.5 A injection current. The research results provide valuable references for the design and fabrication of high-performance InGaN-based blue laser diodes.
ObjectiveCompared with other types of laser diodes, semiconductor laser diodes have excellent properties such as high optical power, high efficiency, low cost, and good laser quality. Thus, laser diodes, especially those with short excitation wavelengths, have important and wide applications in solid-state illumination, high-density optical storage, radio-optical communication, biomedical technology, and chemical analysis. To continuously meet the increasing performance requirements of InGaN-based violet laser diodes in the above fields, we select an experimental sample from the reference as reference structures and theoretically investigate the effect of structural changes in the laser diodes on their optoelectronic performance. Meanwhile, we are motivated by the current problems in the actual growth epitaxy process and operation of violet laser diodes that hinder the performance enhancement, such as difficulties in p-type doped epitaxial growth, lattice mismatch, polarization of the GaN material, and electron leakage. Typically, the mobility of electrons in semiconductors is higher than the mobility of holes, resulting in electron leakage from the active region. This is the region where the radiative composite of electrons and holes is supposed to occur, to the p-cladding layer where holes inject, and non-radiative composite with holes occurs therein, which significantly reduces the carrier radiative composite rate. Additionally, the polarization effect of the GaN material results in a shift in the internal energy band structure of the laser diodes and also reduces the optoelectronic performance. Thus, many researchers have proposed a number of optimization schemes to reduce electron leakage and minimize the influence of the polarization effect, and most of the schemes are the growth optimization in the actual epitaxy process and the structure optimization of the waveguide layer and active region in the laser diodes. We conclude that by directly modifying the structure of the electron blocking layer (EBL) such as thickness and contents, the energy band structure can be adjusted and the electron leakage rate can be reduced without decreasing the hole injection to improve the wall plug efficiency.MethodsThe experimental InGaN-based violet laser diode sample in the reference is selected, and the completely identical laser diode sample is constructed by the PICS3D software to simulate the optoelectronic performance. During the simulation, we set the simulation parameters exactly according to the experimental parameters in the reference. After simulation, the luminescence power variation of the simulation results with the injection current is plotted and strictly compared with the luminescence power of the experimental structure to confirm the accuracy and rationality of the obtained simulation results. Subsequently, a series of simulated structures are designed based on the reference structure. The basic concept is to modify the EBL to reduce the electron leakage. Therefore, we first divide the EBL into two layers and optimize the Al content and thickness of the insert layer close to the active region by comparing the wall plug efficiency, and then illustrate the reasons for the performance optimization in carrier distribution and energy band structure distribution. Subsequently, we optimize the Al content of the original EBL far from the active region to increase hole injection and radiative recombination rate and also explain the reasons for the performance optimization by comparing the carrier distribution and energy band structure distribution. Finally, the optoelectronic performance of the optimized structure is compared with that of the reference structure to illustrate the performance enhancement significance.Results and DiscussionsFirst, we simulate the reference structure in PICS3D software according to the experimental structure, plot its optical power-injection current curve and compare it with the optical power curve measured from the experimental structure, and the results indicate the validity of the proposed simulation (Fig. 2). Subsequently, a series of insert layer structures are designed by changing the Al content in the insert layer and keeping the total thickness constant, and the wall plug efficiency of different Al content in the insert layer of this series is compared (Fig. 4). By adjusting the thicknesses of the insert layer and the original EBL, the Al content of the insert layer are varied in the same way with the total thickness of the composite EBL constant, and five series of wall plug efficiency is obtained (Fig. 5). As a result, we obtain the optimized structure B. Furthermore, to obtain the reason for the better performance of the optimized structure B, we select three samples with the same thickness and different Al content of the insert layer and compare their energy band structures and carrier distribution (Figs. 6 and 7). The reason is that the change of energy band structure leads to easier carrier injection. Additionally, five samples with different thicknesses and the same insert layer Al content are also selected to compare their optical powers and voltages (Fig. 8), and the reason for optimization is illustrated in terms of the hole barrier height and energy band tilt (Table 3 and Fig. 10). Finally, a series of samples are designed by changing the Al content of the original EBL from a constant Al content to a gradient to obtain their wall plug efficiency (Fig. 11). Finally, we obtain the final optimized structure C. Images of the energy band structure and carrier distribution are plotted according to a similar method (Figs. 12 and 13), which illustrates that the performance optimization is due to the easier hole injection led to by the gradient of the Al content of the original EBL. The optimized samples show an increase in wall plug efficiency relative to the reference structure (Table 4 and Fig. 14).ConclusionsThe effects of the thickness and Al content of the composite EBL on InGaN-based violet laser diodes are investigated. The results show that adjusting the thickness and content of the insert layer and changing the Al content of the original EBL to gradient can reduce the electron leakage of the reference structure and increase its hole injection, thus significantly improving the wall plug efficiency. Setting the insert layer thickness to 15 nm and the Al atomic number fraction to 0.30 can reduce the electron leakage and thus increase the radiative recombination rate for improving the wall plug efficiency from 8.365% to 10.72%. On this basis, the Al atomic number fraction of the original EBL are set to a gradient of 0.24 to 0.06, which further increases the hole injection and radiation recombination rate, and improves the wall plug efficiency to 11.45%. Finally, the wall plug efficiency is improved by 36.9% at 1200 mA injection current compared with the reference structure, and the results provide references for improving the InGaN-based violet laser diodes.
ObjectiveChromatic confocal technology is one of the most commonly used optical methods for three-dimensional surface morphology detection. It is a non-contact, non-destructive measurement, which is very precise, fast, and insensitive to the surrounding environment. Presently, the point and line chromatic confocal technologies require one- or two-dimensional space scanning during detection, resulting in low detection efficiency. Multi-point array or snapshot chromatic confocal measurement technologies have been investigated for improving detection speeds. The axial dispersion lens is one of the important components of the measurement system. The dispersion range of the lens and the image space numerical aperture determines the axial resolution and the maximum measurement angle of the measurement system, and the field-of-view and magnification determines the lateral detection area. A survey showed that the majority of contemporary wide-field chromatic confocal dispersion lenses adopt expensive diffractive elements and aspheric surfaces and produce a narrow field-of-view and dispersion ranges.The objective of this study is to design a wide-field long-axis dispersion lens to enlarge the measurement area and improve the accuracy of a snapshot chromatic confocal measurement system.MethodsThe surface white light passes through the dispersive lens and generates the surface axial dispersion. Light, with different wavelengths, is focused at different axial positions, and the same wavelength and different fields-of-view are focused on the same vertical plane. The dispersion lens is required to meet the telecentric conditions in the image and object space to receive the maximum amount of light, reflected from the measured object. The double telecentric dispersion lens with -1 magnification is divided into two parts, front and back group, which are symmetrical at the middle point. The back group is designed first, and the front is its mirror image. The axial dispersion distance is twice that of the back or front group. As suggested by the structural characteristics of the dispersion lens, the Cook three-piece is selected as the initial structure. The axial chromatic and residual aberration evaluation functions are established to obtain the initial parameters of this structure and design the symmetrical half-group lens. After flipping and combining the two assemblies, the whole dispersion lens is obtained. Then, the Cook structure is adjusted by trying back group with different numerical apertures and combining them with their matching front group to obtain a wide field-of-view axial dispersion lens with adjustable performance parameters.Results and DiscussionsIn this paper, a wide field-of-view axial dispersion lens (Fig. 14) was designed. Its performance parameters can be adjusted by replacing the back group, and the effect of parameter adjustment is elucidated. The dispersion lens designed in this paper is characterized by two sets of performance parameters. The first set comprises a 9-mm image height, 4.06-mm axial color difference, 4 F number, and -1 magnification. The second set includes a 2.7-mm image height, 1.2-mm axial color difference, 1.2 F number, and -0.3 magnification (Table 2), and the image quality reaches the diffraction limit. Reasonable manufacturing and installation tolerances were considered, and the mechanical and optical parts were produced. Finally, the lens was adjusted using a center deviation eccentricity measurement instrument for auxiliary group. A ZYGO interferometer was used to test the image quality of the axial dispersion lens. The results show that the wavefront RMS value of the axial dispersion lens with the first set of parameters is 0.053λ-0.075λ, while the wavefront RMS value for the second set of parameters is 0.061λ-0.078λ (Table 3). The first set of performance parameters is deemed suitable for measuring objects with large detection areas, smooth surface structures, and large height differences, whereas the second set is for objects with small detection areas, complex surface structures, and small height differences.ConclusionsIn this paper, a design method is proposed for a wide field-of-view dispersion lens, which not only reduces the design difficulty but also doubles the axial dispersion of the back group of the lens. By replacing the back group, the lens performance parameters can be adjusted, so that the measurement system can be adopted for more applications. The objective of a chromatic confocal lens is to expand the dispersion range, increase the image space numerical aperture, and maintain the near-linear dispersion performance. However, the three parameters are related to the energy utilization of the measurement system and the volume and complexity of the lens. Increasing the image space numerical aperture will enhance the signal-to-noise ratio measurement and will also increase the aberration of the lens while affecting the linearity and dispersion range. A wide field-of-view dispersive lens was developed using the proposed design method, which can utilize two sets of performance parameters. To verify the performance of the designed dispersion lens, an experimental measurement device was constructed, which comprised of a light source, a pinhole array plate, and an imaging spectrometer beam splitting module. The experimental tests demonstrate the feasibility of the proposed design method.
ObjectiveIn recent years, optoelectronic oscillators (OEOs) have undergone rapid development due to their remarkable advantages such as high frequency, large bandwidth, and magnetic interference immunity. They are widely used to generate microwave photonic signals with ultralow phase noise level, which are mainly used in important fields such as communications, radar systems, and measurements. In the past decades, double-loop, coupled, injection-locked, and cosymmetric-time symmetry (parity-time symmetry) OEOs have been developed. These different structures of OEOs can be used to generate high-frequency microwave signals as well as complex microwave signals, such as chirped microwave signals via applied modulation, phase-locked microwave signals, and chaotic signals. However, the abovementioned OEOs rely on their own fiber cavity lengths to produce a single oscillation frequency with a limited frequency tuning range. In 2020, Prof. Ming Li's group at the Institute of Semiconductors, Chinese Academy of Sciences, proposed to combine backward Rayleigh scattering (RS) in an optical fiber with optoelectronic oscillation to realize a broadband random OEO (ROEO), and an ultra-broadband (DC-40 GHz) random microwave signal is obtained in an open cavity through backward RS. The generated signal possesses random characteristics, and its oscillation frequency was not limited by the fixed length of the resonant cavity. Random signals have potential in many applications such as random bit generation, radar systems, and electronic jamming and countermeasures. However, their open-loop noise results in a large substrate noise because of the active amplifier devices, and the random signal power is only 20 dB greater than the noise power. Schemes for improvement of the signal-to-noise ratio (SNR) of random microwave signals have not been reported. In this study, we propose an ROEO for the generation of high-SNR random microwave signals. The ROEO consists of a random fiber laser and an optoelectronic oscillation loop, which improves the SNR of random microwave signals by introducing a wavelength division multiplexer (WDM) in the random cavity and eliminating the remaining Raman pump power. The regulated polarization controller (PC) controls the polarization state of the signal light to suppress the stimulated Brillouin scattering (SBS) effect in the dispersion-compensating fiber (DCF).MethodsThe ROEO consists of two devices a random fiber laser and an OEO. Broadband random microwave signals are generated by the ROEO through random distribution feedback provided by RS in the random fiber laser. The SNR of the random microwave signal generated by the ROEO is improved by adding another WDM (WDM2) to the random fiber laser to eliminate the residual Raman pump light from the random cavity. The polarization state of the signal light is controlled by the PC to reduce the Raman gain and thus suppress the SBS effect in the OEO loop. The signal light from port 2 of the optical circulator (OC) is combined with 1455-nm Raman pump light via WDM1 and excited in the DCF at 7.2 km for achieving RS to produce a random distributed feedback. RS can occur at any position in the DCF; therefore, the loop length of the OEO is not determined, and all eligible frequencies can oscillate in the OEO. WDM2 is added to the system following the DCF to filter out residual Raman-pumped optical power. The backscattered Rayleigh light propagates from port 2 to port 3 of the OC, and the optical amplifier amplifies the weak, backscattered optical signal by 10 dB. 10% port of OC2 allows for the measurement of the amplified spectrum and the optical power in the photodetector (PD) (DC-18 GHz), with 90% power coupling into the loop. The PD converts the optical signal into an electrical one, which is fed through electronic amplifier 1 (EA1) (DC-15 GHz). The microwave signal with 50% power is analyzed using a spectrum analyzer, and the remaining 50% microwave signal is fed back to a phase modulator (PM) through secondary amplification by EA2 with 27-dB gain, which constitutes the complete ROEO. When the loop gain exceeds the loop loss, the microwaves with different frequencies oscillate simultaneously.Results and DiscussionsIn Fig. 3(a), DC-30 GHz bandwidth is shown for a random signal for which the open-loop noise rejection may reach ~40 dB. The power of the spectrum for 18-30 GHz frequencies rapidly decays because the bandwidth of the PD used is DC-18 GHz. The spectrum obtained for DC-18 GHz has uneven distribution because the amplification bandwidth of EA1 and EA2 is 15 and 10 GHz, respectively. The resolution bandwidth of the spectrum analyzer (RMS FSV30) is 500 kHz, the video bandwidth is 500 kHz, and the cutoff bandwidth of ESA is 30 GHz. The Raman gain is dependent on polarization, and the SBS effect in the DCF is suppressed by the adjustment of the polarization state of the signal light by the PC to attenuate the Raman gain. Compared with systems presented in the literature, the power contrast suppression of the Stokes optical signal and the random microwave signal is improved by ~15 dB by the present system. The RF signal and open-loop noise plots for DC-10 GHz, shown in Fig. 5(a), which exhibit a significant power difference of ~40 dB, show the excellent noise rejection of the present system, which is due to WDM2 that eliminates the excess Raman pump power and attenuates the substrate noise. Compared with the 20-dB power difference achieved in previous studies, the gain of the present OEO system is more prominent and the RF power is more uniform for DC-10 GHz. In addition, the system can generate random microwave signals with a large bandwidth if the two-stage EA has a wider amplification bandwidth. Upon removing WDM2, as shown in Fig. 5(b), the open-loop substrate noise level increases and the OEO power at DC-10 GHz is between 20 dB and 30 dB from the noise power, when the feedback loop is closed to form OEO, the power observed at OSA1 increases. Compared with the literature, our study uses a PM with a lower insertion loss (1.7 dB); the OEO microwave power is more effectively fed back into the cavity, and the difference between the OEO oscillation power and the open-loop power is higher.ConclusionsThis study demonstrates a high-SNR ROEO that generates random microwave signals with good flatness when considering DC-10 GHz and a noise rejection of 40 dB. The SNR of the ROEO is enhanced by stripping the excess Raman-pumped light from the random cavity using WDM2. The polarization state of the signal light is controlled using a PC to reduce the Raman gain and thus suppress the SBS effect in the OEO loop. The open cavity of the ROEO eliminates the limitation of conventional OEOs of generating single-frequency microwave signals, and the generated broadband random microwave signals exhibit considerable application potential in noisy radar systems, electromagnetic interference, secure communications, and random coding. Narrowband random signals can be generated using narrowband filters for channel encryption applications.
ObjectiveAcousto-optic deflectors, which constitute a class of precision optical functional components, play a central role in modern optoelectronics technology owing to their excellent performance. Bandwidth, a key performance indicator, determines the frequency range of these devices. Conventional acousto-optic deflectors with single transducer structures face challenges related to bandwidth and diffraction efficiency. To increase the bandwidth, the transducer length must be reduced; however, this may lead to low diffraction efficiency. Therefore, the influence of transducer length on diffraction efficiency and bandwidth must be considered to maintain a balance between the two factors when designing an acousto-optic deflector. The proposed ultrasonic tracking technique addresses this challenge and provides simultaneous improvements in bandwidth and diffraction efficiency. Further optimization of the device's performance requires investigation of additional methods that can ensure high diffraction efficiency while enhancing bandwidth.MethodsThis paper proposes a design method that enhances the bandwidth of an acousto-optic deflector while maintaining high diffraction efficiency. Utilizing the principle of ultrasonic tracking, the proposed method employs two transducers in series to form an antiphase drive. This configuration generates an ultrasonic beam that can change its propagation direction according to frequency, enabling the device to achieve Bragg diffraction over an extended frequency range, thereby improving ultrasonic energy utilization and increasing Bragg bandwidth. By maintaining the same acousto-optical interaction area for single- and double-blade transducers, the overall transducer length remains constant, ensuring high diffraction efficiency. Additionally, the surface electrode of the two-piece transducer features a serrated design, which further enhances ultrasonic wave dispersion and Bragg bandwidth. To validate this method, the phase distribution of the acoustic field generated by the serrated and rectangular electrodes is simulated mathematically by the angular spectrum method. The simulation confirms that the sawtooth edge of the electrode increases ultrasonic waveform volatility. Bandwidth comparison experiments further verified the effectiveness of this approach, showing that the acousto-optic deflector with two-piece serrated electrode structure possesses a large bandwidth and high diffraction efficiency.Results and DiscussionsIn designing the acousto-optical deflector with two-piece serrated electrode structure, two transducers featuring serrated surface electrodes are used. The geometric features of these serrated electrodes consist of the inner width, outer width, and period (Fig.2). Through the angular spectrum method, sound field simulations were established for the two-piece rectangular and serrated electrodes (Fig.4). A comparison of the phase distribution at the central plane of the acoustic field generated by the two-piece rectangular and serrated electrodes reveals that while the rectangular electrode produces a planar acoustic wave, the serrated electrode produces a more volatile acoustic wave with a large divergence angle (Fig.5). Since normal Bragg diffraction necessitates the ultrasonic wave direction to equally divide the incident and diffracted light, the increased angular dispersion of ultrasonic waves facilitates effective ultrasonic tracking over a large frequency range, resulting in a device with increased bandwidth. The acoustic fields of the two-piece sawtooth electrode structures with different parameters were individually simulated. Their comparison revealed that smaller serrated periods yield electrode shapes closer to rectangles and decreases acoustic wave volatility (Fig.6). To further validate these results, bandwidth comparison experiments were conducted for the acousto-optic deflectors with single rectangular, double rectangular, and double serrated table electrode transducer structures (Fig.9). The results show that the bandwidth of the acousto-optic deflector with two-piece serrated electrode structure (3 dB) surpasses that of the deflector with single-piece rectangular electrode structure (by 62.5%) under the same experimental conditions (Fig.10).ConclusionsThis paper proposes an acousto-optical deflector with two-piece serrated electrode transducer structure that effectively increases the bandwidth while maintaining high diffraction efficiency. Utilizing the two-blade transducer structure, the surface electrode is designed into a serrated shape. This design inherits the advantages of ultrasonic tracking multichip transducers while ensuring high diffraction efficiency of the device and enhancing the ultrasonic dispersion range, ultimately leading to an improved acousto-optic deflector bandwidth. The phase distribution of the two-piece rectangular and serrated electrodes is determined by the angular spectrum method. Further, the comparison of the simulation results reveal that the serrated edge of the electrode increases ultrasonic wave volatility. Bandwidth comparison experiments were conducted for acousto-optic deflectors with single rectangular, double rectangular, and double serrated table electrode transducer structures. The results show that the acousto-optic deflector with two-piece serrated electrode transducer structure can enhance the bandwidth while maintaining high diffraction efficiency. The implementation of this two-piece serrated electrode transducer structure in high-frequency acousto-optic devices will have a considerable effect on bandwidth enhancement.
ObjectiveFlow rate detection plays an important role in various fields from biochemical detection to national defense security protection. In particular, microfluidics technology has been widely used in cell and biomolecular detection, drug screening, and chemical synthesis and analysis. Currently, various flow rate sensors have been developed, such as electromagnetic flow rate meters, vortex flow rate meters, ultrasonic flow rate meters, and fiber optic flow rate meters. Most of these flow rate meters have problems such as complex detection, susceptibility to interference, and limited flow resolution. Whispering gallery mode (WGM) optical microcavity has the characteristics of high Q value, small mode volume, and high optical field density, and it has attracted much attention in the field of high-sensitivity optical sensing. When combined with microfluidic technology, hollow optical microcavity can be used as a microfluidics channel, high Q value, and strong light matter interaction, so it has extensive research value in high-precision fluid detection and other biochemical sensors. However, there is still room for improvement in flow rate sensitivity. Moreover, higher-order radial modes require high coupling conditions and relatively low excitation efficiency. We propose a flow rate sensor based on graded hollow-core microcavity (GHM) with axial gradient, which achieves direct detection of fluids under micro-pressure conditions using the resonant light field of the microcavity. The sensor has excellent flow rate sensing performance and high application value in high-sensitivity fluid detection, water quality detection, and other fields.MethodsThe distribution of fluid rate, pressure, and light field in GHM is analyzed theoretically by using the computational fluid dynamics (CFD) algorithm and finite element analysis of algorithms. High Q value GHM is fabricated. GHM and tapered fiber are coupled precisely and packaged, WGM resonance spectrum is excited and varied according to the change of the flow rate in real time. The flow rate of the liquid is controlled by adjusting the parameters of the peristaltic pump (TJ-3A, the minimum flow rate is 7 μL/min) (flow rates are 15 μL/min, 30 μL/min, 45 μL/min, 60 μL/min, and 75 μL/min, respectively).Results and DiscussionsExperimental results show that the resonance wavelength shifts towards a longer wavelength as the flow rate is increased (Fig. 5). This is because the sensitivity of the sensor is mainly related to the wavelength of the WGM spectra, the refractive index of the microcavity, and the energy distribution of the WGM in the liquid core region. As the resonance wavelength increases, the flow rate sensitivity will be enhanced. In addition, flow rate sensing is performed on GHMs with different coupling positions and outer diameters (Figs. 6 and 7). The results show that the flow rate sensitivity increases for the larger outer diameter of the GHM. By using an axial gradient structure to increase the interaction between the microcavity WGM light field and the flow field, high-performance flow rate sensing with a flow rate sensitivity of 0.270 pm/(μL/min) (Fig. 7) and a resolution of 1.43 μL/min is obtained (Fig. 8). In addition, the sensor has great stability (Fig. 8) and fast response ability (Fig. 9).ConclusionsWe propose and demonstrate a highly sensitive flow rate sensor based on high-quality graded hollow-core microcavity (GHM), which achieves direct detection of flow rate by the resonant light field of the microcavity's WGM oscillation with minimum intracavity pressure. Firstly, the flow rate and light field of the GHM are theoretically analyzed by fluid dynamics and finite element method. Secondly, GHM with a high Q value (Q>107) is prepared by fused biconical tapering and gas pressure control methods. High Q WGM spectra are excited by high-precision and low-loss coupling between the microcavity and tapered fibers, with five dimensional high-precision displacement stages involved. The flow rate sensing characteristics of the proposed sensor are experimentally investigated by WGM spectra and measured with different cavity sizes and coupling conditions. The maximum flow rate sensitivity is measured to be 0.27 pm/(μL/min), with a flow rate resolution of 1.43 μL/min. This flow rate fiber sensor has high repeatability and real-time performance, and it has potential applications in various fields such as high-sensitivity fluid detection and water quality detection.
ObjectiveSurface plasmon resonance (SPR) technology features high sensitivity, fast response speed, and stable measurement results, and is widely applied in the fields such as biomedical and nanomaterials detection. According to the signal modulation methods, SPR sensors are classified into four types of intensity modulation, wavelength modulation, angle modulation, and phase modulation. Compared with other modulation methods, phase modulation SPR has higher sensitivity. When SPR occurs, the phase of the p-polarized light changes greatly near the resonance angle, and its detection sensitivity is usually two-three orders of magnitude higher than that of other types of SPR sensors. However, previous literature reported phase jumps in the calculated phase sensitivity of prism-structure SPR, and the maximum sensitivity obtained from this calculation is not achievable in practical measurements. Further research and analysis prove that the appearance of jumps is due to the utilization of the arctangent function in calculating the phase angle. When the phase value of an angle infinitely approaches -π, the subsequent angle's phase result jumps to π, which causes an increase in the phase differences between the two angles and the occurrence of phase jumps. We solve the phase jumps by introducing the phase unwrapping function during calculating the phase angle and correct the calculation results of the phase difference of three gold films with different thicknesses. At the same time, the SPR phase demodulation method based on the Mach-Zehnder interferometer is optimized, and the correctness of the phase unwrapping method is experimentally verified. Our proposed method is expected to provide an optimized solution for the design of phase-type SPR sensors.MethodsWe propose a phase unwrapping function to solve phase jumps. The basic idea is to employ phase continuity to determine the location of the phase wrap by comparing the values of two adjacent phases in the calculated phase function results, and then adopt the phase unwrapping function to unwrap the phase at the wrap point. After all the phase values are processed in this way, the phase unwrapping process is completed, and continuous phase results can be obtained. Next, a Mach-Zehnder interferometric SPR phase measurement system is designed, in which the interference light paths are divided into a signal path and a reference path. The signal path includes an SPR prism which is rotated by a stepper motor to change the incident angle. In the reference path, modulation is introduced through a piezoelectric ceramic to allow interference between the signal light and reference light at the beam splitter prism. The p and s polarized lights are then separated by a polarizing beam splitter prism, and the signal is processed on a computer to obtain the measured phase differences. In signal processing, the wavelet filtering method is introduced to filter non-standard sinusoidal interference signals, and then the phase difference is calculated by the arcsine function phase extraction method.Results and DiscussionsThe phase unwrapping method is leveraged to obtain continuous SPR phase results without 360° phase jumps as the incident angle increases (Fig. 3b). With the increasing thickness, the maximum value of the phase difference shows a trend of increasing first and then decreasing (Fig. 4b), which indicates the existence of an optimal gold film thickness for maximizing the sensitivity of the phase-type SPR. Considering the dispersion of the gold film, the optimal gold film thickness is inferred to decrease gradually as the incident light wavelength increases (Fig. 5). The arcsine phase extraction method is adopted to demodulate the SPR phase, with stable demodulation results (Table 1). Finally, after the interferometric SPR phase measurement system is employed, the SPR phase differences of three gold film thicknesses are measured (Fig. 8). It is found that the maximum values of the phase differences for gold films with thicknesses of 36.58 nm, 45.43 nm, and 62.86 nm are 117.38°, 258.29°, and 42.72° respectively near the SPR resonance angle. Additionally, the experimental results of the phase differences for different thicknesses of the gold films are consistent with the trend of the theoretical calculation curve. The experimental results also verify the theoretical calculation accuracy of the SPR phase differences through the phase unwrapping method.ConclusionsWe address the phase discontinuity in phase modulation-based SPR sensing systems during phase demodulation by introducing a phase unwrapping function to calculate the phase differences and eliminate phase jumps. Based on this optimized demodulation algorithm, the phase differences of three different thicknesses of gold films are measured with a Mach-Zehnder interferometric SPR phase measurement system. Both theoretical calculations and experimental results show that the phase differences during SPR change continuously. Near the SPR angle, the maximum change in phase difference presents a trend of first increasing and then decreasing with rising gold film thicknesses, which indicates an optimal thickness corresponding to the maximum sensitivity change. The proposed SPR phase difference demodulation method using phase unwrapping correction provides an accurate solution for phase-based SPR sensing.
ObjectiveDifferent noise types may be introduced into light field data during acquisition, transmission and processing, due to low light conditions, corrupted pixel values, the statistical nature of electromagnetic waves, faulty memory space in storage, and hardware damage. Data noise seriously affects the accuracy of subsequent light field imaging techniques like depth estimation and post-capture refocusing. Therefore, light field denoising is important in light field imaging. 4D dual fan, 4D hypercone, and 4D hyperfan are classical filters designed based on the structure of the light field spectrum support. These filters can achieve light field denoising by passing the light field signal on the spectrum support while eliminating a significant amount of noise energy that lies outside the spectrum support. However, the noise suppression effect of the filter is poor for the noise located on the spectrum support, and the aliasing effect on the spectrum support also seriously affects the denoising quality. To further improve the denoising effect of the filters, we explore the structural characteristics of the spectrum support conducive to denoising effect improvement for determining the light field reparameterization. Both the quantitative indicator and the visual effect of the denoising results are improved by reparameterizing the noisy light field properly before denoising. Moreover, the idea of determining the light field reparameterization based on structure characteristics of the spectrum support provides a new perspective for improving the processing effect of light field data.MethodsWe consider two structural characteristics of the light field spectrum support, including the symmetry degree and the angle between two boundaries of the spectrum support. Analysis of how the two characteristics affect the denoising effect shows that the smaller angle and higher symmetry degree of the spectrum support are beneficial for enhancing the denoising effect. Based on the two structural characteristics, the concentration concept of the light field spectrum support for light field denoising is proposed, and the concentration degree metric function is designed. We can obtain the distance between two planes of reparameterized light field which is more favorable for denoising by minimizing this metric function, and the denoising effect can be improved by reparameterizing the noisy light field at this distance before applying filters.Results and DiscussionsDenoising experiments are conducted on both synthetic and real light field data. For synthetic data (12 HCI light field data), the PSNR and SSIM of the denoising results are both improved by introducing proper reparameterization compared with direct denoising under the same noise level and noise type (Table 3). Under different noise levels and noise types, the denoising results PSNR and SSIM obtained by introducing proper reparameterization before denoising are also improved (Figs. 11 and 12). Furthermore, after zooming in on the smooth area of the Pens light field, the direct denoising method still leaves obvious noise, while the reparameterization method eliminates the noise more effectively (Fig. 13). Zooming in on the area of Cotton light field where there is edge and reflection information reveals that the direct denoising method leaves obvious noise with the loss of edge information and reflection information, while the reparameterization method removes more noise and preserves better edge and reflection information (Fig. 14). For real light field data, the reparameterization method can provide better denoising effect compared with the linear shift-invariant filter, which is another type of filter based on the spectrum structure (Table 4).ConclusionsOur paper considers two structural characteristics of the light field spectrum support, including the symmetry degree and the angle between two boundaries of the spectrum support. We analyze how the two characteristics affect the denoising performance, and propose the concept of the concentration degree of the spectrum support for light field denoising and its corresponding metric function. The distance between the two planes of the reparameterized light field is obtained by minimizing the metric function, and the reparameterization is introduced to improve the light field denoising effect. The synthetic light field experiments show that by minimizing the metric function of concentration degree, the spectrum support of the light field data becomes more concentrated. For the classical 4D hyperfan, 4D dual fan, and 4D hypercone filters, the introduction of proper light field reparameterization can improve the denoising quality of light field data, and PSNR and SSIM are increased under different noise levels and noise types. Additionally, more edge and reflection information can be preserved with more noise removal. The real light field experiments show that compared with the linear shift-invariant filter, classical filters with reparameterization yield better denoising results in both PSNR and SSIM values. In addition to light field denoising, exploration of the target spectrum structural characteristics of other computational imaging tasks, and application of corresponding reasonable reparameterization of light field data, the proposed idea of introducing reparameterization before light field data processing can be beneficial for other specific computational imaging tasks.
ObjectiveLaguerre-Gaussian beams have better stability in atmospheric propagation due to their unique vortex characteristics. However, the coherence of the transmitted beams will be significantly reduced under the influence of turbulent media. Furthermore, the generation of the Kerr effect can also affect the light transmission characteristics with high power output. We simulate the Kerr effect in the propagation of high-power partially coherent vortex beam and compare the influence of the Kerr effect with different coherence lengths and topological charges. The results indicate that the Kerr effect can help maintain the ring structure of light intensity, and increasing the topological charge can effectively alleviate the decay of vortex structures caused by the coherence decrease.MethodsDuring analyzing the influence of the partial coherence of laser beams, the coherent mode decomposition method is adopted because the phase change cannot be directly added to the cross-spectral density function of the partially coherent beams. The modal expansion of the cross-spectral density of Gaussian Schell-model beams can be regarded as the incoherent superposition of a set of coherent sources, which is characterized by a Laguerre polynomial. Then, phase modulation is loaded onto the coherent light of each mode. When Kerr phase modulation is applied to coherent light, the split-step Fourier method can be employed to solve the problem. The main idea is to evenly divide the light transmission path into segments, with each segment considering linear and nonlinear effects. The influence of the Kerr effect on light wave transmission can be calculated by a model similar to a multi-layer phase screen. In calculation, linear transmission should be separated from nonlinear effects. Firstly, the diffraction effect of linear transmission at each distance, and the nonlinear effect on corresponding transmission distance need to be considered. The phase modulation caused by the Kerr effect is superimposed on the amplitude within the distance. The cross-spectral density function of partially coherent beams under the influence of the Kerr effect can be obtained by calculating the propagation of coherent beams of each mode, and then the sum is weighted.Results and DiscussionsWhen the laser power is too small to simulate the Kerr effect, the hollow characteristics of the light intensity distribution of partially coherent Laguerre-Gaussian beams should disappear after transmission [Fig. 2 (a)]. With the increasing laser power, the Kerr effect will cause some coherent Laguerre-Gaussian modes to converge, which results in a rapid increase in light intensity [Fig. 3 (b)], and the overall vortex ring structure of the synthesized light intensity will be restored [Fig. 3 (a)]. We analyze the influence of coherence length on the Kerr effect, as shown in Fig. 4. With the rising coherence length, the diffraction effect weakens. The modulation effect of the Kerr effect on light intensity will increase with the concentration ratio of the intensity distribution. Additionally, it will result in the rapidly rising peak light intensity. Furthermore, the ratio of peak light intensity to central light intensity continues to increase, and the ring structure of light intensity distribution gradually becomes apparent. The most interesting result is that the disappearance of light intensity ring characteristics under low coherence can be improved by adjusting the topological charge number of vortex beams. As shown in Fig. 5, the increase in topological charge number brings about the rising radius of the light spot. Meanwhile, the central part of the light intensity significantly decreases compared to the surrounding ring area. The vortex ring structure is well restored, and better coherence leads to more obvious improvement brought by increasing the topological charge.ConclusionsBased on the nonlinear Schrodinger equation, the propagation characteristics of partially coherent Laguerre-Gaussian beams are simulated by the split-step Fourier method and the coherent mode decomposition method. The results indicate that the intensity convergence effect of the Kerr effect can effectively compensate for the degradation of vortex characteristics caused by beam diffraction. Thus, the ring structure of partially coherent vortex beams can be maintained. In addition, changing the topological charge of the beam can also affect the intensity distribution structure of vortex light. When the ring structure decays due to the low coherence degree of the beam, it can be compensated by increasing the topological charge. When the coherence length is 1 mm, raising the topological charge to 3 can well alleviate the decay of the vortex ring structure.
ObjectiveQuantum cryptography is a new research field emerging from the combination of cryptography and quantum mechanics. Furthermore, the basic principles of quantum mechanics guarantee its security, such as Heisenberg's inaccuracy principle and the unclonability principle which are different from classical ciphers. Therefore, quantum cryptography is theoretically capable of achieving unconditional security. Recently, with the continuous development of quantum cryptography, its related research has received wide attention. Meanwhile, the quantum key agreement is an important branch of quantum cryptography and a quantum channel-based security protocol that calls for a secure shared key able to be negotiated between participants and does not allow any part of the participants to control the generation of this key. Unlike classical key agreement protocols relying on mathematical hard problems to guarantee security, the security of quantum key agreement protocols is guaranteed by the basic principles of quantum mechanics and can achieve unconditional security, thus better meeting practical needs. However, general quantum key agreement protocols can only satisfy the cases where all participants have full quantum capabilities. Thus, semi-quantum key agreements have been proposed by scholars, which means that one participant in the protocol has full quantum capability while the other participants have only semi-quantum capability. In this case, some of the large institutions or companies are treated as entities with full quantum capabilities, while some ordinary users are treated as entities with semi-quantum capabilities who only need to employ the Z-base 0,1 for quantum state preparation or measurement. However, there are still few studies on multi-party semi-quantum key agreement protocols, with cases of reliance on trusted third parties or low efficiency of quantum bits. Therefore, the multi-party semi-quantum key agreement protocol is significant to be studied.MethodsWe design a new four-party semi-quantum key protocol based on a four-particle cluster state. Furthermore, the secure shared key in this protocol is established by one full-quantum party of Dave, and three semi-quantum parties including Alice, Bob, and Charlie through measurement-resend operations and the entanglement properties of the four-particle cluster state, without the assistance of a trusted third party. The four-particle cluster state is a particular sort of four-particle entangled state whose entanglement properties are adopted in the key agreement and eavesdropping detection parts of the protocol. In this protocol, the measurement-resend operation is performed several times. Finally, since CTRL particles that are normally discarded in a previous protocol can be employed again, the quantum resource waste is reduced. In terms of security, the protocol is proven to be effective against internal attacks and all external attacks. Additionally, two optical devices, the wavelength quantum filter (WQF), and the photon number separator (PNS) are introduced in the protocol, which allows both Trojan horse attacks to be effectively defended against. In terms of qubit efficiency, the protocol performance is measured by Cabello qubit efficiency.Results and DiscussionsFirstly, general quantum key agreement protocols can achieve the purpose of shared keys securely established between participants. However, in the existing quantum key agreement protocols, participants are required to have excessive capabilities and equipment. Therefore, we put forward a new four-party semi-quantum key negotiation protocol based on a four-particle cluster state. The three semi-quantum participants of Alice, Bob, and Charlie, and one participant Dave with full quantum capability in this protocol can perform key negotiation without any third party. As a consequence, the requirements for participant capacity and equipment in this protocol are reduced. The four-particle cluster state is utilized in the protocol for key agreement and eavesdropping detection. Secondly, the measurement-resend operation is leveraged in the protocol, which means that the particle is randomly executed with a CTRL or SIFT operation. In this case, the CTRL operation means that the particle is subjected to a reflection operation, the SIFT operation means that the particle is subjected to a Z-base measurement with the preparation of a new particle, and finally the newly prepared particle is resent. Furthermore, the measurement-resend operation is performed twice in the protocol to make the CTRL particles normally discarded in the previous protocol can be reused, Therefore, the quantum resource waste is reduced. Thirdly, the protocol is verified to be effective against both external and internal attacks through security analysis. Meanwhile, the protocol shows superior performance through performance analysis.ConclusionsOur paper proposes a four-party semi-quantum key agreement protocol based on a four-particle cluster state. In this protocol, no assistance from trusted third parties is required to ensure that a secure shared key is established by negotiation between a full quantum party and three semi-quantum parties and that the contributions of each party to the shared key are equal. Analysis indicates that internal attacks and all external attacks can be effectively defended by the new semi-quantum key agreement protocol. The final comparison results show that the proposed semi-quantum key agreement protocol can improve performance and save quantum resources simultaneously.
ObjectiveClassical optical imaging requires that the light source, object, imaging lens, and imaging plane are in a collinear position, and the first-order correlation property of the light field is employed to obtain the object information for imaging. Different from classical optical imaging, quantum imaging divides the imaging optical path into the signal optical path and the reference optical path and separates the process into the detection process and imaging process, which can complete imaging in the case that classical optical imaging cannot be achieved. As an important development field of quantum information science, quantum precision measurement studies how to utilize quantum effects to measure physical quantities. Compared with traditional measurement techniques, quantum precision measurement has more advantages in measurement accuracy, sensitivity, and security. In the medical and aerospace fields, it has caught widespread attention in China and abroad, with great development potential. Although quantum imaging is based on photon arrival time series received on signal and reference optical paths for coincidence measurement or intensity correlation to achieve imaging, with strong anti-interference ability compared with classical optical imaging, there are still some problems. In the reference optical path, it is necessary to adopt digital micromirror device (DMD) for two-dimensional spatial scanning to obtain spatial information. Pixel-by-pixel scanning is required to obtain accurate coincidence values, which limits imaging efficiency. To improve the efficiency of entangled optical quantum imaging, our study adopts the two-step coincidence counting method to quickly obtain target imaging information and reduce the time overhead of entangled optical quantum imaging.MethodsFirst, the pump light generated by the laser is modulated by the combination of the lens and wave plate to improve the efficiency of spontaneous parametric down-conversion of the periodically poled KTiOPO4 (PPKTP) crystal. Second, the ranging region is selected by the DMD to construct the difference value of the single-photon time pulse sequence. Third, this difference value is leveraged to complete local coincidence counting to obtain the time difference between signal and reference optical paths. Fourth, by controlling the DMD, the imaging region is selected; the single-photon time pulse sequence is corrected, and then global coincidence counting is completed by this corrected sequence. Finally, the quantum image of the target is obtained by mapping the coincidence counting value into the gray value.Results and DiscussionsAs the distance between the light source and the target increases, the image quality decreases (Figs. 4 and 5). Although the imaging quality of the proposed method is slightly lower than that of the classical quantum imaging method, the required imaging time overhead is significantly reduced. The average imaging time overhead of the classical quantum imaging method is 179.1807 s, while that of our method is only 0.2412 s. Our method can significantly improve imaging efficiency and obtain the distance between the light source and the target, and the corresponding average ranging error is 0.039 m (Table 1). With the increasing ranging area size, the imaging quality improves. When the ranging region is greater than 16 pixel×16 pixel, the imaging quality of our proposed method is better than that of the classical quantum imaging method. The main reason is that the classical quantum imaging method only employs the photon information of a single pixel position to estimate the delay difference, while our method processes the photon information of all pixels in the ranging region. The increase in photon information can obtain more accurate coincidence values and better imaging quality (Figs. 6 and 7). Compared with the imaging time overhead of the classical quantum imaging method (with an average imaging time overhead of 180.1317 s), the imaging efficiency of our method is significantly improved (with an average imaging time overhead of 1.1326 s), and meanwhile, accurate target ranging can be achieved spontaneously (Table 2). With the rising single pixel exposure time (SPET), the number of photons received at each pixel increases, and then more accurate coincidence values can be obtained. When SPET are 1, 2, and 3 s, the PSNRs of the proposed method are 4.2914, 14.6427, and 17.8427 respectively, while the PSNRs of the classical quantum imaging method are 3.1075, 12.8154, and 17.7154 respectively. As the SPET increases, the image quality also improves (Table 3). In addition, a real optical path is built to conduct actual experiments based on the above simulation analysis. The associated results are shown in Table 4, Table 5, and Table 6, and are consistent with simulation results.ConclusionsA new entangled optical quantum imaging method based on two-step coincidence counting is proposed. This method adaptively acquires and corrects the delay difference between signal and reference optical paths when the target location is unknown to obtain more accurate coincidence values and realize quantum imaging and distance estimation of the target. Compared with the classical quantum imaging method that corrects coincidence counting for each pixel, the proposed method employs the DMD to select local areas for coincidence counting and then utilizes the delay difference obtained during the imaging to correct the photon arrival time series. This method can reduce repeated operations in the classical quantum imaging method and improve the imaging speed on the premise of ensuring certain imaging quality. In addition, with the decreasing distance between the light source and the target and the increasing ranging area, the imaging quality can be effectively improved. Furthermore, an actual quantum imaging optical path is built, and the corresponding experimental results are consistent with simulation results, verifying the effectiveness of the proposed method.
ObjectiveWhen the robot or autonomous vehicle is driving, since the lidar will detect dynamic objects such as pedestrians and cars, these dynamic point clouds are stacked in the constructed map, which affects the accuracy of point cloud registration. Therefore, removing the dynamic point clouds of lidar has profound significance for improving the mapping and localization accuracy of the SLAM algorithm. Currently, most of the algorithms for removing dynamic point clouds are offline, which needs to compare the differences between the current frame and the map to determine the dynamic point cloud. These methods need to store many point clouds at historical moments, which require high computing and storage resources. As a result, it is impossible to determine the point cloud category in real time, and the removal efficiency of dynamic point clouds is affected. We propose a lidar SLAM algorithm that can remove dynamic point clouds online, which can both remove dynamic point clouds and improve the accuracy of lidar odometry.MethodsAiming at the problem that dynamic objects in the environment affect the mapping accuracy and efficiency, we propose a lidar SLAM algorithm DOR-LOAM to remove dynamic point clouds online. Firstly, the algorithm employs the current frame and the prior map to match the pseudo-occupancy area and divides the pseudo-occupancy area block by block for reducing the time consumption caused by the matching process. Secondly, it filters the bin regions that only contain ground point clouds, enhancing the robustness and speed of removing dynamic point clouds. Thirdly, it replaces the traditional method of utilizing whole-area matching and proposes a method of gridded pseudo-occupied areas. This enhances the recognition accuracy of the algorithm for areas containing both dynamic and static objects, and the recognition effect for small dynamic objects is particularly prominent. Fourthly, it adopts a sliding window method based on a dynamic removal rate to construct a priori map, greatly reducing the time consumption caused by matching dynamic point clouds. Meanwhile, the concept of dynamic point cloud memory area is proposed to further reduce the cost of repeated point cloud matching, making dynamic point cloud removal work in real-time.Results and DiscussionsThe DOR-LOAM algorithm is evaluated on the KITTI dataset, and we assess the algorithm's point cloud removal accuracy and lidar odometry accuracy respectively. In terms of point cloud removal accuracy, the static point cloud preserve rate PR, dynamic point cloud removal rate RR, and F1 score reach 94.13%, 97.11%, and 95.52% respectively. Compared with the latest open-source algorithm ERASOR, the PR of DOR-LOAM improves by 4.00% (Table 1), and due to the utilization of gridded pseudo-occupied areas, the removal effect of small dynamic objects is better than other advanced algorithms (Fig. 6). In terms of lidar odometry, the relative translation error and relative rotation error are 0.81% and 0.0033 (°)·m-1 respectively. Compared with the E-LOAM, T-LOAM, and NDT-LOAM algorithms, the relative translation error of DOR-LOAM is reduced by 0.75,0.12,and 0.09 percent point respectively (Table 2). Additionally, an ablation experiment is carried out on the algorithm, which verifies that the dynamic point cloud removal module can improve the lidar odometry accuracy (Table 3). In terms of the time consumption performance of the system, the algorithm greatly reduces the time consumption of point cloud matching through the point cloud memory area and the construction of sliding windows. The average time consumption per frame is 87.48 ms, which can meet real-time performance (Fig. 9).ConclusionsThe traditional lidar SLAM algorithm extracts point cloud line and surface features in different dynamic scenes, and the wrong extraction of non-static features will affect the point cloud matching accuracy. Thus, we propose a DOR-LOAM algorithm for the online removal of dynamic point clouds. Based on the spatiotemporal inconsistency of dynamic point clouds, the algorithm filters out non-correlated dynamic point clouds to eliminate its influence on lidar odometry at low cost and high efficiency and adapt to complex and changeable scenes. The verification results on the KITTI dataset show that the F1 score of the algorithm for removing dynamic point clouds is 95.52%, and the relative translation error and relative rotation error are 0.81% and 0.0033 (°)·m-1 respectively. The proposed algorithm not only yields better performance in the removal of dynamic point clouds but also improves the accuracy of the lidar odometry.
ObjectiveFiber Bragg grating (FBG) sensors are widely studied due to their unique advantages of light weight, small size, and sound stability in harsh environments. Most of the conventional demodulation methods for FBG sensing such as the filtering method, wavelength swept laser method, and tunable F-P filter method are performed in the optical domain, and they have the disadvantages of slow demodulation speed and low resolution. Therefore, it is important to develop new demodulation techniques with fast demodulation speed and high resolution. With the development of microwave photonics (MWP), the FBG sensing demodulation techniques based on an optoelectronic oscillator (OEO) have attracted extensive research interest. Compared with optical signals, microwave signals have relatively low frequencies and can be detected more rapidly and accurately. However, most of the current OEO-based FBG sensors are single-loop structures with large frequency fluctuations and a small free spectrum range (FSR) of the microwave signal output from the OEO, which results in a small measurement range and large measurement errors. Most importantly, only single parameter measurement can be realized. To this end, our paper proposes a frequency division multiplexing FBG sensing system based on a dual-loop OEO. We construct an optical dual-loop structure in the OEO loop and then perform frequency division multiplexing by a wavelength division multiplexer (WDM) and two electrical bandpass filters (EBPFs) with different center frequencies. This not only realizes the simultaneous sensing of strain and temperature but also significantly improves the measurement range and sensor stability.MethodsFirst, we employ two cascaded FBGs as the sensing heads for strain and temperature measurement respectively. Secondly, two optical loops 1 and 2 with great length differences are constructed to form a dual-loop structure to reduce the frequency fluctuation and increase the FSR of the output microwave signals. Then, the optical signal is divided into two paths by WDM and frequency division multiplexed by two EBPFs with different center frequencies to realize the simultaneous sensing. Finally, the wavelength-to-frequency mapping mechanism is adopted to demodulate the strain and temperature. In the experiment, we apply strain to FBG Ⅰ and temperature to FBG Ⅱand gradually increase strain and temperature on FBG with a step of 45 με and 6°C to obtain the sensing sensitivity. The maximum frequency offset of the OEO output is recorded for ten minutes at different strains and temperatures to evaluate the stability of the OEO oscillation frequency. After that, the optical loop 2 is disconnected and the above steps are repeated to measure the sensing sensitivity and the maximum frequency offset of the frequency division multiplexing FBG sensing system based on a single-loop OEO. In addition, the measurement ranges of strain and temperature are estimated for single-loop OEO and dual-loop OEO structures respectively.Results and DiscussionsBy processing and analyzing the experimental data, an FSR of 5.01 MHz is obtained for the dual-loop OEO-based sensor (Fig. 2). The microwave oscillation frequency offset (Δfdual) from the OEO output has a good linear relationship with the strain and temperature applied to the FBG, and the microwave oscillation frequency (fdual) shifts to the high frequency region as strain and temperature increase [Figs. 3(a) and 3(c)]. The fitting results show a sensitivity of 0.100 kHz/μ? for strain and 1.135 kHz/℃ for temperature [Figs. 3(b) and 3(d)]. The FSR of the single-loop OEO-based sensor is 177 kHz (Fig. 2), and the sensitivities of strain and temperature are 0.111 kHz/μ? and 1.170 kHz/℃respectively. Generally, the measurement range of the sensor is limited by the FSR of the OEO to avoid frequency ambiguity. Compared with the single-loop structures, the dual-loop structures substantially increase the measurement range of the sensor with little effect on the sensor sensitivity. In addition, the maximum frequency offset of the single-loop structure is 4.637 kHz and 4.420 kHz, corresponding to a measurement error of 42 μ? and 4 ℃ for the sensor [Fig. 4(a)]. The maximum frequency offset of the dual-loop structure is 0.035 kHz and 0.072 kHz respectively, with theoretical measurement errors as low as 0.35 μ? and 0.06 ℃ [Fig. 4(b)]. Therefore, the stability of the dual-loop OEO tracking signals is much higher than that of the single-loop OEO.ConclusionsWe propose and experimentally demonstrate a frequency division multiplexing multifunction sensor based on a dual-loop OEO. By configuring two optical paths with different lengths in the dual-loop OEO structure, the FSR is expanded by about 28 times and the measurement range is improved. Compared with the measurement error of 42 μ? and 4 ℃ based on the single-loop OEO sensor, the theoretical measurement error of the dual-loop OEO is only 0.35 μ? and 0.06 ℃, which provides the sensor with high stability, large measurement range, and small measurement error. Two dual-loop OEO structures are formed by frequency division multiplexing through WDM and two EBPFs with different center frequencies, which allows strain and temperature to be sensed simultaneously. The sensing sensitivities of 0.100 kHz/μ? and 1.135 kHz/℃ are obtained in the experiment. Additionally, if dense WDM and more EBPFs with different center frequencies are applied to our proposed sensors, more parameters can be measured in the form of a group network.
ObjectiveUltrashort pulses, with a pulse duration of tens of picoseconds (10–12 ps) or less, are timing tools with the highest precision available currently. Their narrow pulse width and high peak power characteristics have considerably advanced the development of nonlinear optics. However, ultrashort pulse lasers unavoidably suffer from the dispersion introduced by various optical elements during their operation, resulting in pulse deformation and power attenuation, which adversely affect the performance of ultrashort pulses. Therefore, extensive research has been conducted on pulse width regulation. The current solution is primarily based on the utilization of dispersion-compensation devices, which suffer from low integration characteristics and nonactive regulation. Recently, the optical Moiré structure has become a widely discussed topic due to its high potential in the modulation of light field by changing Moiré angles. However, most published works introduce physical twisted angles, and optical Moiré structures combined with the concept of synthetic dimensions have rarely been reported. Therefore, we propose an optical Moiré lattice with artificially synthesized Moiré angles to achieve ultrashort pulse width modulation.MethodsA method of constructing optical Moiré lattices with artificially synthesized Moiré angles (nonphysical twisted angles) is proposed herein. Moiré lattices comprise two simple photonic lattices with different periods, and the ratio of the arctangents of their periods represents the Moiré angle of the optical Moiré lattice. Three optical Moiré lattices with gradually increasing Moiré angles are theoretically designed, and the band structure of the optical Moiré lattices is determined by the transfer matrix method; we observe that the increase in Moiré angles leads to the flattening of the band structure. The band dispersion is further analyzed, following which the group velocity and pulse width changes introduced by an ultrashort pulse through the Moiré lattices are computed. The theoretical calculations demonstrate the effect of Moiré lattices on the width of ultrashort pulses. Subsequently, an optical path based on an autocorrelator is built to experimentally verify the theoretical results. Further, we define the variation rate of pulse width to effectively illustrate the modulation of ultrashort pulses.Results and DiscussionsFirst, the effects of artificially synthesized Moiré angles on the band structure are analyzed: the increase in the Moiré angles results in higher band compression coefficients (Fig.2), which indicates a decrease in the bandwidth (Fig.3). Meanwhile, a narrow band leads to a decreased group velocity (Fig.4) and considerable second- and third-order group velocity dispersion (Fig.5). We demonstrate a theoretical model to explain the effect of group velocity dispersion on the width of ultrashort pulses (Equations 3-8). The equations imply that Moiré lattices with high group velocity dispersion lead to intense pulse broadening and pulse compression of ultrashort pulses. The results of pulse width measurements before and after passing through the three Moiré lattices were obtained using the autocorrelator (Table 1). As seen from Table 1, the variation in pulse width increases with the increase in the Moiré angle. The accurate modulation of the ultrashort pulse width by the optical Moiré lattice is confirmed by the comparison of the theoretical and experimental values of the pulse width ratio (Fig.7).ConclusionsThe construction method for the optical Moiré lattices in the synthetic space proposed herein can effectively realize the analogy of traditional optical Moiré lattices with physical twisted angles. The regularity of the artificially synthesized Moiré angles affecting band structures has been clearly confirmed. Theoretical calculations show the following: a larger artificially synthesized Moiré angle leads to lower group velocity and more considerable second- and third-order group velocity dispersion, which results in larger variations in pulse widths. Moreover, the accurate modulation achieved by the optical Moiré lattice indicates that the lattices can be predesigned to satisfy universal requirements such as a wide range of pulse width adjustments. In theory, we can design a series of Moiré lattices with different artificially synthesized Moiré angles, resulting in rich and more predictable pulse width variations. In summary, first, we state that the optical Moiré lattice in the synthetic dimension considerably simplifies the complexity of structural processing: traditional optical Moiré lattices require precise control of the physical twisted angles of the two sublattices, while the optical Moiré lattice in the synthetic space depends on strategic parameter definitions. The one-dimensional structure in the geometric space renders its processing highly convenient. Second, the optical Moiré lattice provides a new degree of light field modulation, which means that a flattened band structure can be obtained by changing the Moiré angle. Finally, the overall thickness of our optical Moiré lattice is at the micrometer level, which has the advantage of high integration. Our structure can become the key component in the manufacturing of laser pulse width compressors.
ObjectiveX-ray fluorescence CT (XFCT) is a novel imaging modality that combines X-ray CT with X-ray fluorescence analysis (XRFA) and can be employed to probe the distribution and concentration of functionalized gold nanoparticles inside the tumor. It has good potential in the diagnosis and treatment of early-stage cancers. How to suppress Compton scattering noise for XFCT imaging is a current hotspot. Traditional denoising methods include the background fitting method, scanning phase subtraction, and iterative denoising method. Deep learning-based denoising and reconstruction methods can utilize the powerful feature learning ability of deep learning without priori information such as parameters of imaging systems, which can effectively reduce the background noise and obtain sound imaging quality.MethodsWe propose an XFCT denoising algorithm based on noise level estimation and convolutional neural networks (NeCNN), which consists of noise estimation subnetworks and main denoising networks (Fig. 2). The estimated subnetwork estimates the noise level and reduces the preliminary noise through the denoising convolutional neural network (DnCNN). The estimated results are input into the fully convolutional neural network (FCN) and the output is adopted to learn the Compton scattering distribution. Meanwhile, as the FCN integrates a deconvolution module, the denoising and reconstruction of end-to-end fluorescence CT images can be directly achieved. We utilize the air-loaded phantoms for pre-training, while the related parameters are transferred into the PMMA phantoms to simulate the human tissue and achieve faster convergence. This two-level network structure is not a simple cascade, and the input-output and hyper parameter settings between two-level networks are linked to each other. With preliminary noise level estimation and input into the secondary network as priori information, there is a superior denoising effect compared with a single denoising network. Additionally, the mean square error (MSE) and structure similarity (SSIM) are employed as the loss function to get the local and global optimal solutions.Results and discussionsThe imaging system contains an X-ray source, a phantom to be measured, two sets of pinhole collimators, and two sets of fluorescence detectors (Fig. 1). The distances between the fan beam X-ray source and the phantom center, between the pinhole collimator and the phantom, and between the detector and pinhole collimator are 15, 5, and 5 cm respectively. The detector consists of 55 × 185 cadmium telluride (CdTe) detector units with an energy resolution of 0.5 keV, and the crystal size is designed to be 0.3 mm×0.3 mm. The datasets are obtained with Geant4 software by scanning air phantom and PMMA phantom in which various metal nanoparticles (Au, Bi, Ru, Gd) are filled, and different incident X-ray intensities are set to simulate different noise levels and enhance the model's generalization ability. The imaging phantom is set as a cylinder with a diameter of 3 mm and a height of 5 cm, and the settings of element concentration are divided into two types, including high mass fraction versus low mass fraction, where high mass fraction includes 0.2%, 0.4%, 0.6%, 0.8%, 1.0%, and 1.2%, and low mass fraction includes 0.1%, 0.12%, 0.14%, 0.16%, 0.18%, and 0.2%. The programming language is Python 3.6 and the NeCNN is implemented based on Pytorch 1.7.0. Meanwhile, the hardware platform is configured as Intel i5-9600kf CPU, NVIDIA Titan V (12 GB/NVIDIA) GPU, and 16 G DDR4 RAM. The hyper parameters are shown in Table 1. Figure 6 shows the denoised images with NeCNN, BM3D, and DnCNN algorithms. We can easily find that both NeCNN and DnCNN can effectively reduce noise in the background region, which is difficult to handle for the BM3D algorithm. Additionally, NeCNN is more effective than DnCNN in removing abnormal pixel spots caused by self-absorption in the center region of interest (ROI). Generally, the proposed NeCNN is quantitively and qualitatively superior to the traditional BM3D and DnCNN algorithms. The NeCNN algorithm has the largest PSNR (29.01558) and SSIM (0.95066) values. Compared with DnCNN, NeCNN shows an improvement of 0.23993 and 0.02734 in terms of PSNR and SSIM respectively.ConclusionsThis sduty proposes a novel denoising algorithm for XFCT images based on deep learning to estimate the Compton scattering noise level by noise estimation subnetworks and noise reduction by the denoising main network. The experimental results show that for both air and PMMA phantoms, the PSNR and SSIM of images with NeCNN are both higher than DnCNN and BM3D. This illustrates the effectiveness of the proposed algorithm and shows its potential to be applied in practical imaging systems in the future.