


Please enter the answer below before you can view the full text.
4-2=
ObjectiveOn April 16, 2022, the aerosol and carbon dioxide detection lidar (ACDL) was successfully launched with the atmospheric environment monitoring (DQ-1) satellite. The high spectral resolution lidar (HSRL) system of ACDL, which is responsible for measuring atmospheric aerosol and cloud profiles, has successfully worked in orbit for more than one year and provided accurate global aerosol and cloud profiles. Aerosols have a significant impact on the global radiation balance and climate change. The biggest unknown when it comes to predicting climate is the radiative effect between aerosols and clouds. Therefore, in order to determine the distribution and the change of aerosols in the atmosphere, it is important to make high-precision observations of aerosols in the atmosphere with high temporal and spatial resolution. As an active remote sensing instrument, lidar is widely used in atmospheric aerosol profiles with high temporal and spatial resolution and continuous observation during the day and night. High spectral resolution lidar has the advantage of separating atmospheric aerosols Mie scattering signal and molecular Rayleigh scattering signal, compared with traditional elastic scattering lidar. Therefore, HSRL can directly obtain the backscattering coefficient, extinction coefficient, depolarization ratio, and lidar ratio of aerosols, without assuming the lidar ratio. It significantly improves the accuracy of aerosol optical parameters which would be used widely in environment monitoring and climate study.MethodsThe spaceborne HSRL system of ACDL based on an iodine molecular filter is implemented in orbit to measure aerosol and cloud profiles with high accuracy. Combined with the temperature and pressure data of the atmospheric reanalysis dataset (ERA5) of the European Centre for Medium-Range Weather Forecasts (ECMWF), the optical parameters such as backscattering coefficient, extinction coefficient, depolarization ratio, and lidar ratio of aerosols are obtained through data inversion. Aerosols are classified by reference values of optical parameters of different aerosol types. In this paper, cases of measurement data over Sahara Desert and Canadian wildfires region are selected to analyze the dust aerosols and smoke aerosols, respectively.Results and DiscussionsThe optical properties of dust aerosols and smoke aerosols are analyzed by selecting the observation data of spaceborne high spectral resolution lidar over the Sahara Desert and the Canadian wildfires. These optical parameters include the backscattering coefficient, extinction coefficient, depolarization ratio, and lidar ratio of aerosols. The trajectory of ACDL and the attenuated backscatter coefficients at 532 nm of the parallel channel, perpendicular channel, and molecular channel over the Sahara Desert (Figs. 3-4) and the Canadian wildfires (Figs.7-8) are presented. The results show that the aerosols within 5 km near the ground in the selected Sahara Desert area are mainly dust aerosols (Fig. 6), and the depolarization ratio is concentrated in 0.2-0.4; the lidar ratio is concentrated in 40-60 sr (Fig. 5). The selected Canadian wildfire region is dominated by smoke aerosols (Fig. 10), whose depolarization ratio is concentrated in the range of 0.02-0.15, and lidar ratio is in the range of 50-70 sr (Fig. 9). The unique high spectral resolution detection technique of lidar has important applications in the fine detection and classification of aerosols and clouds and will play an important role in environmental monitoring.ConclusionsIn this paper, the high spectral resolution system based on the iodine molecular filter of Chinese spaceborne lidar ACDL and the inversion method of aerosol optical parameters are presented. Dust aerosols over the Sahara Desert and smoke aerosols generated by Canadian wildfires are selected as typical aerosol events for analysis. Accurate aerosol optical parameters are obtained by ACDL, and aerosols are classified according to those parameters. The spatial and temporal distribution characteristics and formation causes of aerosols in these areas are analyzed. The research in this paper shows the advantages of spaceborne high spectral resolution lidar in large-scale continuous and accurate observation of global aerosol distribution and provides a powerful means for accurate measurement and scientific application of global aerosol.
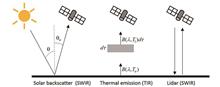
SignificanceAtmospheric environmental parameters directly affect the earth's ecological environment and climate changes, and even human life and health. For example, aerosols, clouds, and greenhouse gases affect the radiation balance between the sun and the earth through sunlight absorption and scattering, which is an important cause of atmospheric environmental pollution and frequent extreme weather. Additionally, the atmosphere is an aerospace operation area, and environmental parameters such as atmospheric temperature, pressure, density, and atmospheric wind field exert a decisive influence on the design and performance indicators of the equipment. Therefore, the detection of global atmospheric environmental parameters has caught much attention from scholars all over the world.Satellite remote sensing is an important technical means to obtain global atmospheric environment parameters, and can be divided into active and passive detections. Active detection of its radiation source is to emit different forms of electromagnetic waves to the target. Meanwhile, it does not depend on sunlight and can work day and night. Passive detection of its non-radiation source needs to rely on the reflection of the target object or the electromagnetic wave of the natural radiation source (such as the sun). Compared with the active spaceborne detection technology, the passive detection payloads have a long history, mature technology, and diversified types of remote sensing instruments and detection targets, but there are some problems such as reliance on sunlight, detection time, and regional limitations. The active spaceborne detection technology represented by lidar makes up for these shortcomings, and the active and passive spaceborne remote sensing atmospheric detection technologies are developed jointly to provide strong technical support for the detection of global atmospheric environmental parameters.Currently, atmospheric environment detection of satellite remote sensing has made great contributions to the detection of clouds, aerosols, atmospheric wind fields, greenhouse gases, temperature, pressure, density, and other parameters, and solved the problems of air pollution, climate changes, and national defense applications. We introduce the development history of spaceborne lidar and focus on the comparative analysis of the advantages and disadvantages of active and passive spaceborne remote sensing payloads for detecting major atmospheric environmental parameters. Finally, the future development trend of atmospheric environmental parameter detection technology in spaceborne lidar and passive remote sensing is summarized.ProgressSince the launch of LITE in the United States, domestic extraterrestrial lidars have developed rapidly for nearly 30 years, and the atmospheric parameters that can be detected mainly include clouds, aerosols, greenhouse gases, and atmospheric wind fields. Although LITE has a short working time, it lays a good foundation for spaceborne lidar atmospheric detection with milestone significance. The ice, cloud, and land elevation satellite (ICESat) carries the geoscience laser altimeter system (GLAS) and is the world's first earth observation laser altimeter satellite. As a follow-up mission to ICESat, the ICESAT-2 satellite is launched by the national aeronautics and space administration of America (NASA) in September 2018, and is equipped with the advanced topographic laser altimeter system (ATLAS) (Fig. 1). Developed by NASA in collaboration with the French National Space Research Center (CNES), CALIOP is a major breakthrough in the development of spaceborne lidar technology and has been in orbit for 17 years now, far exceeding the expected design. Scientific data are provided for such scientific issues as aerosol-cloud-precipitation interactions, global dust distribution, transport and pollution, and studies on weather and climate changes (Fig. 2). As the only lidar system aboard the space station to date, CATS employs photon counting methods to obtain vertical cloud and aerosol distribution characteristics (Fig. 3). To obtain information about the three-dimensional wind field of the global atmosphere, the European Space Agency (ESA) launched the ADM-Aeolus satellite on August 22, 2018, carrying the Atmospheric Laser Doppler Instrument (ALADIN). It is the first Doppler wind measurement lidar to acquire the global atmospheric wind field. This indicates the high precision and strong real-time wind measurement capability of spaceborne lidar and has made great contributions to improving the weather and climate forecasting accuracy, optimizing atmospheric models, and advancing atmospheric dynamics research (Fig. 4). Domestic spaceborne lidar started late. On April 16, 2022, China launched the aerosol and carbon dioxide detection lidar (ACDL) on the atmospheric environmental monitoring satellite (DQ-1). Based on path integral laser differential absorption (IPDA) and high spectral resolution lidar (HSRL) technologies, atmospheric environmental parameters can be obtained, such as global cloud, aerosol vertical profile distribution, and CO2 column line concentration in full time and with high accuracy. It is also the only on-orbit spaceborne lidar actively detecting greenhouse gases globally (Fig. 5). Spaceborne lidars such as ASCENDS, A-SCOPE, and MERLIN are also based on IPDA. The platforms and main technical parameters of these spaceborne lidar are shown in Table 1.There are many kinds of passive spaceborne remote sensing for cloud, aerosol, greenhouse gas, and atmospheric wind field loads, and the inversion algorithms are diverse and mature. In 1960, the United States launched the first meteorological satellite TIROS-1 to open a new era of satellite cloud remote sensing observation. The representative of China is the Fengyun meteorological satellite series. The moderate resolution imaging spectroradiometers (MODIS) in the United States launched on the Terra and Aqua satellites and the Himawari series in Japan show good results in cloud remote sensing. There are many kinds of spaceborne passive remote sensing of aerosols and can be roughly divided into the following categories: multi-spectral remote sensing instruments, polarization remote sensing instruments, and multi-angle remote sensing instruments, such as AVHRR, DPC, MODIS, and MISR. In the passive satellite remote sensing of greenhouse gases, the most representative ones are Japan's GOSAT series, the United States' OCO series, and China's GF-5. The atmospheric wind field of passive spaceborne remote sensing mainly takes cloud, water vapor, and atmospheric composition as detection targets for inversion, including MERSI-Ⅱ, AGRI, DPC, MODIS, and AHI.Conclusions and ProspectsSatellite remote sensing is an effective means to obtain global atmospheric parameters and provide scientific data support for global environmental and climate changes. The development of passive spaceborne remote sensing starts earlier with more mature technology and more abundant atmospheric environment parameters that can be detected. However, passive remote sensing has inevitable disadvantages, such as low accuracy, incomplete coverage of high latitude areas, and lack of night detection data. As a typical active remote sensing equipment, lidar features high precision and high spatio-temporal resolution, which can make up for the shortcomings of passive remote sensing. At present, ground-based and airborne atmospheric lidar detection has been quite mature, and spaceborne lidar remote sensing detection is the future development trend, which has developed for nearly 30 years since the launch of LITE. The atmospheric parameters that can be detected mainly include clouds, aerosols, greenhouse gases, and atmospheric wind fields. Through comparative analysis, the advantages and disadvantages of active and passive spaceborne remote sensing detection technology of atmospheric environmental parameters are revealed. According to different application scenarios and needs, the appropriate detection methods are chosen.
SignificanceThe atmospheric detection of the mesosphere (about 80-110 km) is of scientific research and application significance. There are many important spatial features and phenomena in this region, including the coldest altitude of the Earth's atmosphere (~90 km), and special phenomena such as high-altitude noctilucent clouds, temperature inversion layer, and atmospheric metal layers also occur in this region. Gravity wave fragmentation makes the atmospheric disturbances in this region particularly intense, and the wind shear in this region becomes extremely intense. This region is also part of the atmospheric photochemical layer, and the atmospheric compositions have dramatic diurnal variations. With the development of aerospace, the influence of this region needs to be closely focused on. For example, suborbital flights (generally defined as 35 to 300 km to the Earth) involve this region, and these studies will lay a solid foundation for future suborbital commercial flights.This region has long been relatively unknown to humans because of the limitations of traditional detection methods. Fortunately, there are atmospheric metal layers in this region. As the cross section of resonance fluorescence scattering of metal atoms and ions is much larger than those of Rayleigh scattering and Raman scattering, it can be employed to detect low-concentration atmospheric components. In the past half century, by adopting the transition spectra of atoms and ions at specific wavelengths, the metal layer of the atmosphere has been detected by lasers with specific wavelengths and laser remote sensing technology. These metal atoms and ions are excellent tracers of atmospheric fluctuations, and many parameters such as atomic number density, temperature, and wind have been obtained. In recent years, with the discovery of thermospheric metal layers, the height range of atmospheric metal layers has been expanded, and the study of metal layers has been paid great attention to.ProgressBased on the research of our team and collaborators, we introduce the development of atmospheric metal layer lidar and the current situation and trend of atmospheric metal layer detection by lidar. First, the dye laser opens the door to the atmospheric metal layer. Second, the sum frequency of the dye laser and YAG laser increases the laser energy further. Third, with pulsed dye amplifier employing dye as the working substance, directly amplifies the single-mode continuous seed laser into a high-power pulse laser. This meets the dual characteristics of high spectral resolution and sound center frequency stability of wind and temperature detection in metal layers. Fourth, narrow-band filtering technology extends lidar detection from night to all time. Fifth, a dye laser needs to change dye frequently with low single pulse energy, and all-solid-state laser solves this problem. Sixth, OPO lasers have many advantages such as high integration degree, good pump light spot, high single pulse energy, and further improved detection ability of atmospheric compositions. Additionally, we list the parameters of sodium atom, calcium atom and ion, iron atom lidar, and potassium atom lidar in four tables respectively.Conclusions and ProspectsWith the development of Q-switching, harmonic generation, tuning, high-power optical fiber devices, and other technologies, the pulse energy, stability, and operation convenience of lasers are constantly improving. In recent years, the simultaneous detection of multi-component density, temperature, and wind has become the trend. The multi-function lidar with high resolution and detection accuracy has been excavated and applied in China and abroad. In the future, the development and application of automated and intelligent lidar will promote satellite lidar, and in combination with ground-based lidar, more ion component detection will be possible to provide support for temperature and wind detection at higher altitudes. Finally, the cognition of chemical and physical processes in the upper atmosphere, and the coupling research on different regions of the ionosphere will be advanced.
SignificanceGlobal climate governance and greenhouse gas emission reduction are of great urgency. The volume fraction of atmospheric methane (CH4) has been rising continuously since the industrial revolution and is now averaging about 1895.7×10-9 globally. In addition, since the global warming potential of CH4 is about 27-30 times higher than that of carbon dioxide (CO2), the monitoring of atmospheric CH4 becomes the focus and hotspot of carbon emission reduction.Satellite remote sensing features fast detection speed, wide coverage, and rich information. It can conduct continuous and stable observations of atmospheric CH4 with high temporal and spatial resolution and high precision on a global scale and can provide verification and support for the "bottom-up" emission inventory.Relying on the rapid development of satellite detection technology and the urgency to reduce greenhouse gas emissions, a large number of satellites with CH4 detection capabilities have emerged in the past two decades. The detection technology has become more mature with increasingly higher detection accuracy. Additionally, corresponding algorithms of various satellite sensors have also made a huge leap forward. Rapid advances in both sensors and algorithms enable us to better monitor the temporal and spatial variability of atmospheric CH4 and its impact on climate change.With the purpose to promote the further development of CH4 satellite remote sensing and retrieval research and realize the dual carbon target, it is necessary to summarize and discuss the existing research progress and future development trends, which can provide scientific and technological support for China's low-carbon sustainable development.ProgressFirstly, the development of atmospheric CH4 satellites and sensors is reviewed and introduced. Early sensors mainly rely on the thermal infrared band of about 8 μm for CH4 detection, and typical representatives include IMG, AIRS, and IASI (Table 1). Subsequently, a series of passive short-wave infrared sensors represented by SCIAMACHY, TANSO-FTS, and TROPOMI are developed. They rely on CH4 characteristic bands near 1.6 μm and 2.3 μm for detection and are more sensitive to changes in near-surface CH4 concentration. Among them, the high-resolution imaging spectral sensors and platforms represented by GHGSat, AHSI, and MethaneSAT also take advantage of their high spectral resolution and high spatial resolution to monitor the CH4 point source emissions. There is no doubt that new energy is injected into the development of CH4 satellite remote sensing (Table 2). In recent years, active detection represented by the methane remote sensing lidar mission (MERLIN) has also developed rapidly, effectively making up for the shortcomings of passive remote sensing detection with improved detection efficiency.Subsequently, the principles, application conditions, and retrieval accuracy of different sensor algorithms are summarized. From the early DOAS algorithm, proxy algorithm, and PPDF algorithm, to the most commonly employed full-physical algorithm with the highest precision at this stage, the physical algorithms have been continuously improved with enhanced efficiency and accuracy. The full-physical algorithms represented by NIES-FP, UoL-FP, RemoTeC, RemoTAP, IAPCAS, and FOCAL have an accuracy of 6×10⁻⁹. At the same time, with the rapid development of computer technology and artificial intelligence, various new algorithms, such as neural network algorithms, are also emerging, which can almost complete the real-time retrieval of CH4. These methods have also brought breakthroughs to CH4 retrieval.Conclusions and ProspectsIn the future, CH4 detection satellite sensors will continue to develop toward the goal of high temporal and spatial resolution, high precision, high accuracy, and continuous observation. Many high-performance satellites such as MethaneSAT, Sentinel-5, and CO2M are under planning (Fig. 5). Furthermore, the construction of the satellite network should be stepped up to meet the demands of CH4 global high-precision detection. Correspondingly, new requirements are put forward for the accuracy, coverage, and calculation speed of CH4 observation data and retrieval products. For the most accurate full-physical algorithm at present, the adoption of more accurate forward radiative transfer models and prior information, collaborative retrieval and correction of clouds and aerosols, and multi-satellite joint retrieval and verification are all important means for algorithm improvement.With the accelerated global climate governance and reduced greenhouse gas emissions, more and more countries have formulated and implemented a series of CH4 emission reduction measures, and China has also proposed the dual carbon target, which is steadily advancing. However, the issues of climate governance and carbon emissions are very complex, and to some extent have even become the focus of competition among countries. In this context, the development of China's atmospheric CH4 satellite remote sensing cannot be slackened and should be highly valued and vigorously developed to seize opportunities. China has deployed the launch of the next-generation carbon satellite task, which will implement the main passive observation, and significantly broaden the range of detection time and space. Finally, the spatial and temporal resolution is improved to promote an effective amount of data and realize the full range of high-precision detection, thus providing a solid foundation and strong support for realizing a dual carbon target.
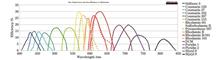
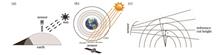
SignificanceOzone is an important trace gas in the atmosphere and can affect the state and process of the troposphere and stratosphere. About 90% of ozone is concentrated in the stratosphere (10-50 km) and can absorb ultraviolet radiation from the sun, thus affecting the atmospheric circulation and the earth's climate, and protecting the earth's life system. 10% of ozone is located in the troposphere, which exerts an important influence on atmospheric chemistry, air quality, and climate change, and its spatial distribution is affected by both cross-regional transport and regional production. The main source of near-surface ozone is a photochemical reaction, and its main precursors are carbon monoxide (CO), nitrogen oxides (NOx), and volatile organic compounds (VOCs). In addition, near-surface ozone concentration is also affected by meteorological conditions and regional transport. In recent years, ozone has become the primary pollutant after PM2.5 in China and even the world, especially in summer and autumn. Correspondingly, ozone pollution prevention and control have been the focus of air pollution control in the future.Ozone data can be obtained by ground-based, sounding, airborne, and space-borne observations. The ground-based observation stations can provide spatial-temporal distribution information of ozone. The data at each site are of high accuracy and good stability with the insufficient spatial representation of the sites, and the ozone concentration in the whole troposphere is not well-reflected. The vertical distribution characteristics of atmospheric ozone can be obtained by sounding and airborne observations, which can be employed to verify the satellite observation accuracy. However, the lack of spatial-temporal continuity makes it difficult to obtain the ozone distribution in a large area. As space-borne observations are not subject to geographical restrictions, it is possible to acquire global ozone spatial-temporal distribution information with all-weather coverage and provide hyperspectral and high-precision data. Therefore, high-precision, global, and all-weather ozone information can be obtained based on multiple satellite detection payloads.ProgressCurrently, the global ozone detection instruments are divided into three detection methods of nadir observation, occultation observation, and limb-viewing (Fig. 1). The total ozone column with high precision and ozone profiles with low vertical resolution can be obtained by the nadir observation. The ozone profile can be detected by limb-viewing and occultation observation. Occultation observation features high vertical resolution and precision, but with limited sampling frequency and small data volume. In contrast, limb-viewing can detect ultraviolet, infrared, and microwave bands, and it has high sampling frequency and can realize all-weather sampling. According to the detection spectrum and detection principles, global ozone detection instruments can be divided into ultraviolet spectral detection sensors and infrared spectral detection sensors. Based on the satellite development technologies, the inversion algorithms of the total ozone column and ozone profile are proposed (Figs. 3 and 4), and the estimation method of near-surface ozone is developed by integrating multi-source data. The whole layer ozone information and the vertical ozone distribution information can be obtained from the ultraviolet spectrum and infrared spectrum of satellites respectively. The monitoring accuracy of the total ozone column has currently reached 90%, but the inversion accuracy of the ozone concentration in the middle and lower troposphere and near the surface needs to be improved. According to the current level of inversion technology, the combination of various technical methods can be adopted to improve the detection capability of the middle and lower ozone.The application of various ozone satellite remote sensing can be carried out in the technology of atmospheric ozone detection and inversion. Our study focuses on ozone pollution progress, including the analysis of spatial-temporal characteristics of ozone pollution and typical pollution events, and the interaction between ozone pollution and meteorological conditions. The different meteorological factors can affect ozone pollution precursors. Quantifying the influence of meteorological conditions on the photochemical reaction process of ozone is an important prerequisite for formulating scientific emission reduction schemes to improve air quality. The analysis of typical ozone pollution processes can clarify the formation mechanism, development process, and subsequent evolution of near-surface ozone pollution.Conclusions and ProspectsThe continuous development of instrument design and inversion technology of various satellite detection payloads makes it possible for satellite remote sensing inversion and monitoring applications of ozone. The supervision and control of ozone pollution need to find out the source and accurately evaluate the pollution cases, which can be gradually analyzed in precursor emissions, chemical conversion, meteorological influence, and three-dimensional transport. The synergistic emission reduction of VOCs and NOx is the ozone treatment fundamental in China, and it is also the major research direction in the next step.
SignificanceAnthropogenic greenhouse gas emissions represented by carbon dioxide and methane are an important driving force of global warming in the last century. The key to controlling global warming is to control greenhouse gas emissions. Carbon dioxide is an important greenhouse gas. Research and development of scientific carbon dioxide emission monitoring technology and scientific identification of regional carbon dioxide emission and absorption are of great significance to serving our country's carbon emission policies at different stages.ProgressTraditional inventory methods calculate the total carbon emissions by counting the energy consumed by each emission source. Since statistics and emission factors cannot be updated quickly, it is difficult for these methods to capture the dynamic changes in emission sources. Flux data based on concentration measurement is updated frequently, and the measurement data is objective, which can provide a more accurate basis for greenhouse gas emissions and traceability. In recent decades, various methods have been proposed to measure fluxes based on concentration measurement. The measurement methods for the terrestrial biosphere flux include the chamber method, micrometeorology method, equilibrium boundary layer concepts, and inverse system for space-borne platforms. The measurement methods for the point sources flux contain the inverse diffusion technology represented by the Gaussian plume model, source pixel method, cross-sectional flux method, integrated mass enhancement method, Gaussian vector integral method, and horizontal net flux measurement method.The ground-based in-situ measurement technology represented by the flux tower features high measurement accuracy and strong time continuity and plays a vital role in the flux detection of forests, farmland, and other earth ecosystems. However, since the measurement area of the flux tower usually does not exceed 1 km2, it is difficult to quantitatively understand the sources and sinks of greenhouse gases on a global scale due to the sparseness of the sites and limited representation distance.Satellite remote sensing data can obtain the global spatial distribution and changes of greenhouse gases with fast inversion speed, which can make up for the shortage of ground base stations. At present, satellite remote sensing can detect greenhouse gas emissions from the earth's ecosystems and point sources. Many countries and teams have inverted the greenhouse gas fluxes of global ecosystems based on satellite remote sensing. In 2021, the Chinese Institute estimated the global CO2 flux distribution based on the TanSat satellite, and the results are in good agreement with other satellites such as Japan's GOSAT and the US's OCO-2. There are also a number of studies that capture CO2 fluxes from terrestrial power plants through satellite measurements. However, satellite remote sensing still has many limitations in accuracy, resolution, and data coverage. The atmospheric chemical transport model can simulate the three-dimensional gas concentration field of the atmosphere, but due to the incomplete transport model and meteorological field, and uncertain initial field and emission sources, the obtained three-dimensional distribution of gas concentration deviates from the actual situation, and it needs to be combined with the actual situation. The observed data is further corrected to improve accuracy.Lidar technology is characterized by long detection distance, high spatial-temporal resolution, and all-day detection. Active remote sensing is an important direction for the development of satellite remote sensing. However, current satellite active remote sensing is mainly based on the path integration technology IPDA and can only obtain the concentration of the entire atmospheric column, thus making it difficult to accurately invert the vertical distribution of point source emissions and affecting the inversion effect of point source emission flux. The ground-based differential absorption lidar DIAL can obtain distance-resolved gas concentration distribution and simultaneously detect atmospheric wind field data with high precision. Although its coverage is not as good as that of satellites, it is wider than that of a single station. It is an effective means for local area gas flux monitoring.Conclusions and ProspectsAlthough the measurement methods of greenhouse gas fluxes are becoming increasingly more abundant, the spatial-temporal resolution, data coverage, and measurement accuracy of the existing methods for the concentration distribution and emission flux of greenhouse gases are still very limited. In the future, greenhouse gas flux measurement technology can be further developed in several directions. Measurement data from satellites, and ground-based and airborne platforms is assimilated to obtain higher-precision three-dimensional distribution of greenhouse gas fluxes, the mechanism of greenhouse gas sources and sinks is analyzed, and natural and anthropogenic carbon emissions are identified. In addition, we develop a greenhouse gas assimilation forecast system and build accurate greenhouse gas source-sink models and inversion models at different scales. As a result, global high spatial-temporal resolution remote sensing is realized through satellite networking to form a global quality-uniform and continuous greenhouse gas observation dataset, and observe the greenhouse gas concentration and spatial-temporal changes of sources and sinks in an all-round way. Collaborative monitoring technologies for greenhouse gases and pollutants are also developed.
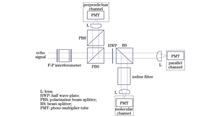
SignificanceAerosols and clouds are important components of the earth-atmosphere system with intricate physical, chemical, and optical properties. They have a significant influence on the atmospheric environment, climate change, and human health. Observing and studying the properties of aerosols and clouds are of great significance to gain insight into these issues. Currently, remote sensing technologies and methods are widely developed to observe aerosol and cloud properties, such as optical depth, extinction coefficient, and particle size distribution.Lidar is one of the most useful active remote sensing tools due to its ability to detect the vertical distribution of the atmosphere. Among various types of lidars, ground-based Mie scattering lidar is the most popular one for cloud and aerosol detection with strong echo signals, simple system structure, and easy implementation. The development of Mie lidar began in the 1960s, and later multi-wavelength and polarization techniques were developed to more comprehensively detect scattering properties and particle sizes of aerosols and clouds. Nowadays, many lidar networks have been established for regional and global atmospheric environmental monitoring.As the ground-based Mie lidar is becoming widespread, accurately retrieving their data is urgently required. However, retrieval is still facing many challenges that lead to large uncertainties. First, the correction of the overlap factor is crucial because the near-surface atmospheric information is often the most concerned. Second, the identification and extraction of cloud and aerosol layers from noisy lidar signals are essential for subsequent optical parameter retrieval and atmospheric research. Finally, data retrieval is a key step in lidar signal processing as it reveals the optical properties of aerosols and clouds. Hence, we mainly review the research progress in overlap factor correction, layer detection, and signal retrieval for the ground-based Mie lidar to guide future research and application.ProgressThe key challenges in Mie scattering lidar data processing include overlap factor correction, layer detection, and signal retrieval (Fig. 1). For overlap factor, the correction methods can be divided into experimental and theoretical methods. The experimental methods do not depend on the lidar system parameters but require the assumption of a uniform atmospheric distribution. The theoretical methods include analytical methods and ray tracing methods, which can guide the design of the lidar system. In addition, the overlap factor effect can be reduced more effectively by adjusting and improving lidar systems, such as dual field-of-view lidar and CCD side-scattering lidar.For layer detection, the slope-based method can be directly applied to the raw lidar signal but is very sensitive to the noise. The threshold-based method is relatively more robust and commonly used to produce standard products (Fig. 4). However, tenuous layers may be missed because their signal intensity does not consistently exceed the threshold. The hypothesis test method based on the Bernoulli distribution decides whether the signal is a layer or not based on the estimated probability of it belonging to a layer. Studies have shown that its detection performance is superior to the threshold-based methods (Fig. 5).For signal retrieval, the Fernald method is the most widely used but requires two parameters: the lidar ratio and the boundary value. The boundary value will directly affect the retrieval accuracy (Fig. 6) and can be determined by the fixed scattering ratio method, single-component fitting method, two-component fitting method, and joint observation method. Among them, the two-component fitting method can independently distinguish the contribution of atmospheric molecules, with excellent applicability and high accuracy. Furthermore, an incorrect lidar ratio will cause the overall retrieval deviation (Fig. 7). Methods for determining the lidar ratio mainly include the empirical method, aerosol optical depth (AOD) constraint method, and joint observation method. The popular AOD constraint method can obtain the lidar ratio mean value accurately but lacks its vertical profile distribution. The joint observation method using multiple vertical observations can provide a lidar ratio profile, but there are very few simultaneous vertical observations. In addition, many signal denoising algorithms have also been developed, but it is still a problem to evaluate their performance due to the lack of accurate observations as references.Conclusions and ProspectsKey issues such as overlap factor correction, layer detection, and signal retrieval still exist in ground-based Mie scattering lidar data processing. The development of new technologies such as dual field-of-view lidar and CCD side-scattering lidar provides more possibilities for low-overlap observation. The hypothesis test method can avoid one-size-fits-all empirical judgments and detect layers more accurately than other methods. In the retrieval, accurate boundary value selection requires avoiding simple assumptions and separating aerosol and molecule contributions. In addition, with the development of other vertical observations, the acquisition of lidar ratio profiles has become easier, which largely improves the retrieval accuracy of ground-based Mie scattering lidar.
SignificanceMethane is a significant and powerful greenhouse gas, with a global warming potential over 80 times than that of carbon dioxide over a 20-year time scale. At the same time, methane decomposes much faster than carbon dioxide, with an average lifespan (namely, the duration an emitted molecule of methane stays in the atmosphere) of about 12 years, compared with hundreds of years for carbon dioxide. This means that compared with a reduction of carbon dioxide, a reduction of methane emissions can offer more control over the greenhouse effect, including controls on global average temperature rise in the short term. In addition, methane is also a precursor of both tropospheric ozone and carbon monoxide. Therefore, a reduction in its emissions will help reduce air pollution and improve air quality.During coal mining activities, the methane contained in the coal seam is released in a variety of ways, including escape from the coal seam in open pit mines, discharge through ventilation and drainage in underground coal mines, and release from pockets trapped in the coal matrix during mining. Escape continues during post-operation activities and coal processing. Methane in abandoned mine shafts also continues to escape from coal remaining after operations. According to data from the International Energy Agency, in 2022, global coal mine methane emissions were about 40.5 million tons, accounting for more than 10% of total anthropogenic methane emissions. China is the largest coal producer in the world. According to the 2014 National Greenhouse Gas Inventory of the Second Biennial Update Report on Climate Change in China, methane emissions from the country's energy industry accounted for about 46% of the total emissions, mainly attributed to coal emissions from mining. Studies have shown that the increase in global anthropogenic methane emissions from 2000 to 2012 and the increase in China's methane emissions from 2010 to 2015 are both significantly impacted by China's coal mining industry. Accelerating the establishment of a dynamically updateable high-spatial-resolution methane emission inventory for the coal industry is an important starting point for promoting methane emission reductions in the coal industry.Using the short-wave infrared absorption spectrum of methane at 1.65 μm and 2.3 μm, satellite remote sensing technology has been successfully used in the detection and quantification of methane emissions in the coal industry. Satellite remote sensing detection of methane emissions in the coal industry requires close cooperation between sensors, algorithms, and detection targets. We analyze the research progress from the aspects of remote sensing satellites that can be used for the study of methane emissions in the coal industry, the corresponding methane column concentration, and emission rate inversion technology, and propose a satellite remote sensing method for building a high-spatial-resolution methane emission inventory of China's coal industry research focus.ProgressThe spatial scale of the methane emission capacity of the coal industry detected by remote sensing satellites has been previously divided into regional and point source types (Table 1). Regional remote sensing satellites mainly include SCIAMACHY/ENVISAT, Sentinel-5P/TROPOMI, GOSAT, etc. In order to realize the accurate observation of methane concentration, its spectral resolution is higher (within 0.3 nm), and the band is more concentrated in the methane absorption window, so it is mainly aimed at the study of spatially large-scale and temporally long-term methane emission sources. GHGSat-D is the representative remote sensing satellite for point source methane emission targeting the coal industry. It observes an area of about 12 km2 at a time, with a spatial resolution of 25 m. Substantial progress has been made in the detection of emissions from many coal mines around the world. In addition, the scientists found that the high spatial resolution (3.7-60 m) imager originally used for Earth observation also can detect methane plumes in its broad absorption (2.3 μm) band.The methane column concentration inversion of regional satellite sensors such as SCIAMACHY, TROPOMI, and GOSAT estimates the atmospheric methane column concentration ΩCH4 by fitting the observed spectrum to its simulated spectrum. In order to eliminate the influence of surface pressure changes, the column mass is first normalized by the dry air column concentration Ωair, yielding the dry air column average mixing ratio XCH4. According to the band difference of the specific configuration of the instrument, two types of algorithms, namely the full physical inversion and the CO2 proxy method, can be used. Remote sensing satellites for coal mine point source emissions can be divided into hyperspectral type and multispectral type. The former includes GHGSat-D with a spectral resolution of 0.3 nm and AHSI, PRISMA, and EnMAP with a spectral resolution of 10 nm; the latter includes Sentinel-2 A/2B. Landsat-8/9, WorldView-3, etc.According to the spatial scale of methane emissions identified by satellite observation data, there are two main methods for estimating the methane emission rate of the coal industry: regional remote sensing satellites usually use atmospheric chemical models to invert and optimize the two-dimensional distribution of methane emissions on a regional scale, while point source remote sensing satellites estimate the emission rate of a single point source through mass conservation of methane emissions within a plume-model assumption, where a point source is generally a single facility that emits more than 10 kg/h in an area less than 3×30 m2.Conclusions and ProspectsThis work recommends speeding up the construction of a "top-down" emission inventory of China's coal industry from two different scales: coal mine agglomerations and single coal mines. This work further points out three weaknesses that need to be focused on and improved in the future: 1) simplified mass balance methods using TROPOMI observations to constrain and retrieve the methane emissions over 14 large coal bases across the country; 2) detection and quantification of the methane emissions of thousands of coal mines across the country based on hyperspectral remote sensing satellites with 10 nm resolution; 3) more closely examining the internal links between remote sensing satellite observations at different scales and other observations collaboratively and analytically.
ObjectiveLow-level jet (LLJ) is a phenomenon where the horizontal wind speed appears to be extreme in the vertical profile. When the extreme value is within the atmospheric boundary layer, it is called boundary layer LLJ. The characteristics of LLJ in the vertical structure make it often appear in the research on heavy convective weather such as heavy rainfall, aviation safety, pollutant transport, and wind energy development and utilization. Main observation instruments for LLJ and vertical wind fields include radiosonde, wind profile radar, and Doppler wind lidar. Doppler lidar can obtain vertical wind field information with a high spatial and temporal resolution. Additionally, its higher vertical resolution and lower detection blind area give itself an obvious advantage in observing the structural features of LLJ. The higher detection accuracy of vertical wind speed enables us to better find the change of atmospheric vertical diffusion ability in the LLJ process, which is also a key mechanism of the impact of LLJ on pollutant concentration. In China, the LLJ research is mainly focused on weather-scale LLJ related to rainfall, while less research is on boundary layer LLJ. Due to the lack of observation data, the studies on structural characteristics of LLJ are rare. Juehua Island, an island about 10 km offshore in the Bohai Sea, has a distinctive LLJ structure due to the influence of land and sea, which makes our study meaningful.MethodsThe coherent Doppler wind lidar is operated in Juehua Island, Huludao City, Liaoning Province from September 21st, 2020 to May 8th, 2021. The vertical wind field lidar data is employed to find the atmospheric boundary layer LLJ in this area. Statistical characteristics are analyzed by combining the mean sea level pressure and 1000 hPa temperature data provided by the ERA5 reanalysis model. Combined with the PM2.5 mass concentrations of Huludao City, the impact of LLJ on the change in PM2.5 mass concentrations is analyzed. In previous studies, the criteria for LLJ are often selected according to the research purposes, instruments, and environmental characteristics of the observation area. Referring to Wu and Bass, our criteria for judging the LLJ are as follows. The extreme value of wind speed should be greater than or equal to 8 m?s-1. The difference between the extreme wind speed and the minimum wind speed at higher altitudes shall be greater than or equal to half of the maximum wind speed.Results and DiscussionsAmong effectively observed 24550 wind profiles, 2766 wind profiles are determined as LLJ wind profiles. During the observation period, the occurrence frequency of LLJ is 0.11, with obvious monthly changes (Fig. 2). The average jet wind speed is 13.2 m?s-1, and the wind directions of the jets are mainly concentrated in the northeast and southwest. Statistically, the jet height is mainly below 500 m, and the height of maximum frequency is between 200 m and 300 m (Fig. 3). The mean sea level pressure of ERA5 reanalysis data shows that the observation area is mainly affected by two types of weather background situations during the study period, which is one reason why the LLJ is concentrated in the southwest and northeast (Fig. 6). Correlation analysis indicates that strong horizontal pressure gradient provides favorable conditions for LLJ formation in the boundary layer. In winter, the wind direction distribution of LLJ is different from that of the background wind field (Fig. 5). Because the land temperature is lower than the ocean temperature at most time in winter (Fig. 7), the temperature gradient can enhance the horizontal pressure gradient difference between the northwest and southeast, which is conducive to the formation of the northeast jet and plays a role in hindering the formation of the southwest jet (Table 2). Doppler wind lidar could catch the process of the atmospheric boundary layer LLJ from formation to extinction. Through the standard deviation of vertical wind speed provided by the lidar and PM2.5 mass concentration data of Huludao City, LLJ has accelerated the reduction of PM2.5 mass concentration by enhancing the vertical diffusion ability of the near-surface atmosphere (Fig. 8). The relative change of PM2.5 mass concentration at the time of LLJ is shown in Fig. 9, and the size of the circle in the figure is determined by the standard deviation of vertical wind speed.ConclusionsHuludao City is located in the mid-latitude coastal area, with the coastline trending southwest-northeast. The atmospheric boundary layer LLJ in this region has obvious seasonal characteristics. Its wind direction is mainly affected by the seasonal characteristics of the large-scale weather situations and the trend of the coastline, with obvious regional characteristics. For coastal areas, differences between the thermal properties of land and sea will provide favorable or unfavorable conditions for LLJ formation in different background wind fields, thus affecting the LLJ distribution under different wind directions. When the LLJ occurs at night, the decrease in PM2.5 mass concentration can be accelerated or its growth rate can be weakened by enhancing the vertical diffusion ability of the near-surface atmosphere. The conclusions are of certain reference significance for subsequent LLJ observation in the boundary layer and the study on air pollution in similar areas. The coastline of China is extensive with complex topography of coastal areas, and the current single-station observation is far from covering LLJ's characteristics. Additionally, the relationship between the horizontal distribution characteristics of the LLJ in the boundary layer and the coastal tomography needs further exploration.
ObjectiveIn recent years, harmful gases in the atmosphere have gradually become an important issue of concern for people. Gas sensing technology can perform highly sensitive monitoring of trace gas concentrations, obtaining information on the composition, knowing the concentration changes of gases, and understanding the distribution changes of gases. Quartz-enhanced photoacoustic spectroscopy (QEPAS) technology based on quartz tuning fork detection has the advantages of simple structure, low cost, and strong anti-noise ability, which is a hot spot in the field of gas sensing. In common QEPAS technology, commercial quartz tuning forks are generally used with a resonance frequency of 32.768 kHz, but the performance of QEPAS systems is limited due to high resonance frequency, short energy accumulation time, and small interfinger spacing.MethodsIn this paper, the finite element analysis method is used to simulate the stress and charge distribution of quartz tuning forks. A T-shaped quartz tuning fork is designed, and the resonance frequency of the T-shaped quartz tuning fork is 8930.93 Hz, with a Q value of 11164 and a cross interfinger spacing of 1.73 mm. In the experimental verification phase, by using water vapor in the atmosphere as the measurement object, the QEPAS water vapor detection system is built. Under the same conditions, we test two types of quartz tuning forks. One is a commercial quartz tuning fork, and the other is a T-shaped quartz tuning fork. A comparison of experimental results between these two quartz tuning forks is performed to verify their detection performance.Results and DiscussionsThe T-shaped quartz tuning fork has a length of 9.4 mm, a width of 1.2 mm, and a thickness of 0.25 mm (Table 1). By using the optical excitation method, firstly, the performance of commercial quartz tuning forks and T-shaped quartz tuning forks is tested separately, so as to obtain the resonance frequency curves of two types of quartz tuning forks. The resonance frequency f0 of a commercial quartz tuning fork is 32767.76 Hz, and the quality factor is 9128. f0 of the T-shaped quartz tuning fork is 8930.93 Hz, and the quality factor is 11164. The resonance frequency of the T-shaped quartz tuning fork is reduced by 73%, and the quality factor is improved by 22% compared with the widely used commercial quartz tuning fork (Fig. 4). The signal level of the QEPAS system is related to the laser incidence position. The optimal laser incidence position for commercial quartz tuning forks is 0.7 mm from the top, and the optimal laser incidence position for T-shaped quartz tuning forks is 1.6 mm from the top (Fig. 6). The amplitude of the 2f signal using a commercial quartz tuning fork is 16.44 μV, and the noise level and the signal-to-noise ratio are 58.86 nV and 279.31, respectively. The amplitude of the 2f signal measured using a T-shaped quartz tuning fork is 25.37 μV, and the noise level and the signal-to-noise ratio are 56.54 nV and 448.71, respectively. Compared with commercial quartz tuning forks, the signal amplitude detected by T-shaped quartz tuning forks has increased by 54.32%, and the signal-to-noise ratio has increased by 60.65% (Fig. 7).ConclusionsThe commercial quartz tuning forks widely used in QEPAS technology currently have certain limitations. For example, the high resonance frequency makes the system unable to detect gases with low molecular relaxation rates, short energy accumulation time leads to weak collection ability of acoustic signals, and small interdigital spacing is not conducive to coupling transmission of laser beams and reducing system noise. We use finite element analysis to simulate a T-shaped quartz tuning fork with low resonance frequency, high Q value, and large interdigital gap. After actual measurement, the resonance frequency of this T-shaped quartz tuning fork is 8930.93 Hz with a Q value of 11164 and interdigital spacing of 1.73 mm. Compared with the widely used commercial quartz tuning fork, the resonance frequency of the T-shaped quartz tuning fork is reduced by 73%, and the quality factor is increased by 22%. Finally, this quartz tuning fork is applied to the near-infrared QEPAS water vapor detection system to further verify its sensing performance. Compared with commercial quartz tuning forks, the signal-to-noise ratio of the water vapor QEPAS system based on the T-shaped quartz tuning fork has increased by 60.65%, proving the superiority of the sensing performance of this quartz tuning fork. However, the equivalent resistance value of this quartz tuning fork is still too high, which has an impact on the overall detection performance. Further optimization will be carried out to reduce the equivalent resistance value and further improve the sensing performance of the system.
SignificanceTrace gas detection technology plays an important role in applications such as greenhouse gas detection, industrial hazardous gas monitoring and medical breath gas analysis. Conventional methods such as gas chromatography, semiconductor, electrochemical sensor and contact combustion are widely employed for trace gas detection. However, these methods have one or more disadvantages, such as low sensitivity, low selectivity, frequent calibration requirement, system complexity and high cost. Recently, optical methods based on absorption spectroscopy have been used for trace gas detection, such as cavity ring-down spectroscopy, Fourier transform infrared spectroscopy, differential absorption spectroscopy, tunable diode laser absorption spectroscopy, non-dispersive infrared gas sensing technology, and photoacoustic spectroscopy (PAS).Distinguished from other optical detection methods, PAS is an absorption spectroscopy technique without background noise, with high sensitivity, high selectivity, fast response time and so on. In addition, the structure of photoacoustic system is relatively simple and does not require a complex optical path calibration process, thus PAS has become an important technique for trace gas detection. Acoustic sensors are very important in PAS gas detection systems and directly affect the sensitivity of the photoacoustic system. Capacitive microphones are commonly used as acoustic sensors, which have the advantages of mature technology and low price. However, the capacitive microphones as electronic devices are inevitably affected by the electromagnetic interference and high temperature environments. Optical acoustic sensors with no electronics, featuring high sensitivity, high signal-to-noise ratio, wide frequency band response, and wide dynamic range, can break through the limitations of traditional capacitive sensors.In recent years, all-optical PAS gas detection technology, which integrates the optical fiber sensing technology and PAS technology, has been rapidly developed. In the all-optical PAS system, the photoacoustic signal is detected by the optical acoustic sensor, so it has the characteristics of anti-electromagnetic interference and can greatly reduce the size of the photoacoustic system. Currently, the optical acoustic sensors are based on three main types of optical intensity attenuation principle, fiber grating principle, and interferometer principle. In particular, the interferometric all-optical PAS gas detection system based on the optical acoustic sensor of interference principle, featuring high signal-to-noise ratio and high sensitivity, has become a research hotspot in recent years, and a series of important research results have been achieved.This paper reviews the research progress of the interferometric all-optical PAS gas sensing technology, and focuses on the all-optical PAS gas sensing technology based on Michelson interference principle and Fabry-Perot (F-P) interference principle.ProgressThere are mainly four types of interferometer-based acoustic sensors, namely Mach-Zender interferometer (MZI), Sagnac interferometer (SI), Michelson interferometer (MI) and F-P interferometer (FPI). The optical acoustic sensors based on MI and FPI principles can help to improve the sensitivity of acoustic wave detection due to their reflective interferometric structure, therefore this paper focuses on the application of MI and FPI based interferometric all-optical PAS in the field of gas detection.In MI-based all-optical PAS, we first introduce the MI-based all-optical quartz-enhanced photoacoustic spectroscopy (QEPAS) technology (Fig. 1). This technology solves the problem that the traditional QEPAS is vulnerable to weak anti-electromagnetic interference and difficult to adapt to the detection of trace gases in harsh environments. Then, we present the MI-based principle of cantilever enhanced photoacoustic spectroscopy (CEPAS) technique (Figs. 2-4). However, the MI-based all-optical PAS gas detection system is susceptible to environmental vibration, which makes the system difficult to work in a wide range of applications in industrial environments.The FPI-based all-optical PAS can be better applied to trace gas detection in industrial environments. The all-optical PAS technique based on the diaphragm-based FPI have been demonstrated (Figs. 5-8). The highly sensitive FPI-based all-optical PAS technique combined with QEPAS (Fig. 9) and resonant CEPAS (Fig. 11) techniques to achieve highly sensitive detection of trace gases are described in the second part. In the PAS gas detection technology, besides the pursuit of high sensitivity, the miniaturization of the sensing probe is also an important research topic. Therefore, the FPI-based miniaturized all-optical PAS technology is introduced in the third part. In particular, a fiber-tip all-optical photoacoustic gas sensing probe is introduced (Fig. 15) as well as a miniaturized gas sensing probe (Fig. 16) for simultaneous detection of multiple gases, which provide a new solution for long-range measurement of single or multiple gases in confined spaces. As the development of gas sensing technology has fully entered the practical stage, the applications of FPI-based all-optical PAS for environmental gas monitoring (Fig. 17 and Fig. 18), transformer fault monitoring (Figs. 19-21), and medical respiratory analysis (Fig. 22 and Fig. 23) are highlighted in the last part.Conclusions and ProspectsThe interferometric all-optical PAS trace gas detection technology has broad application prospects in industrial production, environmental gas monitoring, and medical respiratory analysis. The future interferometric all-optical PAS trace gas detection technology will be developed towards ultra-high sensitivity, high stability, anti-interference ability, low cost, miniaturization, etc.
SignificanceIn China's "ground-air-space" integrated environmental monitoring platform, satellites are positioned in space to observe both atmospheric and terrestrial activities. Meanwhile, numerous air quality monitoring stations are established on the ground to complement the satellite observations. However, conventional monitoring platforms are insufficient in effectively covering the surface boundary layer, which ranges from 0.1 to 1 km above the ground. To this end, unmanned aerial vehicles (UAVs) with high mobility, moderate flight altitude, and easy deployment are employed for gas monitoring in the surface boundary layer when combined with gas sensors. One critical issue with the utilization of UAVs for gas sensing is their endurance, which poses a challenge for onboard gas sensors. These sensors should be small and lightweight with low power consumption to be carried on the UAVs. Currently, gas sensors employed for onboard applications are classified into four categories of electrochemical type, photoionization, catalytic combustion, and infrared sensing. Among them, the first three types of sensors are small, lightweight, and low-power, making them suitable for UAV payloads. However, they are generally less selective, which leads to difficulty in distinguishing target gases. In contrast, infrared sensors rely on the unique spectral fingerprint of gases to identify and detect target gases. When adopted with lasers, they exhibit high sensitivity, resolution, and selectivity, thus reducing measurement errors. As a result, infrared sensors are preferred for onboard gas sensing in UAVs, providing accurate and reliable measurements for monitoring air quality in the surface boundary layer.The miniaturized sensing module based on laser absorption spectroscopy technology is highly suitable for UAV platforms. With the development of microelectronics technology, the lasers' current driving board, temperature control board, and signal processing circuit can realize the small size and high accuracy. This progress further promotes the miniaturization of UAV-based laser monitoring platforms for pollutant gases. UAV laser monitoring platforms can measure gases in the atmospheric boundary layer, thereby enhancing China's "ground-air-space" integrated monitoring platform. Consequently, a positive effect is produced on China's efforts to build a beautiful world and a community with a shared future for mankind.ProgressThe UAV pollution gas laser monitoring platform comprises the UAV platform and the onboard laser sensor. Technological advancements have resulted in various UAV types with varying performance capabilities, which can cater to different task requirements (Fig. 1, Table 1). Pre-deployment tasks such as the availability of multiple UAV simulators, onboard computers, and open-source ground stations guarantee the flight safety of the UAV platform during task execution (Tables 3-4). Gas sensors suitable for UAVs must be small and lightweight, with minimal power consumption. In trace gas monitoring, several miniature optical sensing modules based on laser absorption spectroscopy technology have been experimentally verified (Figs. 2-6, Table 2). To minimize the flow field interference created by high-speed propeller rotation and obtain the most accurate onboard sensor system for the required sensing data, we employ fluid dynamics simulation to optimize and analyze the turbulent distribution around the UAV. The combination of miniaturized laser gas sensors with UAVs has been applied in atmospheric air quality monitoring and natural gas leakage monitoring (Figs. 8-11). Such a combination can achieve three-dimensional measurements of time, space, and spectrum.Conclusions and ProspectsOur study provides an overview of current UAV platforms, including their types, advantages, disadvantages, and applications. It also highlights several principles and applications of laser spectroscopy sensing technologies suitable for UAVs. Additionally, we compare various open-source UAV simulators, onboard computers, and ground stations, and examine the challenges and solutions involved in integrating sensors with UAVs. The significant potential and value of employing small-scale laser sensors with UAVs in gas monitoring are also discussed. Finally, we emphasize the development direction for UAV-based pollution gas laser monitoring platforms, which is towards miniaturization and micro scale.
ObjectiveOn-chip gas sensor based on infrared absorption spectroscopy is useful for environmental detection because of its small size and low power consumption. Direct absorption spectroscopy is a commonly used detection technique for on-chip gas sensors, but the noise of this detection method is high. The wavelength modulation spectroscopy technique can suppress noise. The combination of the wavelength modulation spectroscopy technique with the on-chip gas sensor can improve the performance of the sensor. However, the waveguide parameters including external confinement factor, loss, and length influence the second harmonic signal. A slot waveguide can increase the external confinement factor by using the mode field distributed in the slot for sensing. We provide guidance for the design of on-chip gas sensors based on wavelength modulation spectroscopy.MethodsThe optical field distribution results and external confinement factor are obtained by COMSOL Multiphysics with electromagnetic waves and frequency domain module. The optical parameters of the waveguide are set at the wavelength of 3291 nm. The chalcogenide rectangular waveguide is fabricated by the lift-off method. The process of the lift-off method includes spinning photoresist, lithography, development, thermal evaporation, and removal of photoresist. The noise of the waveguide sensing system is used for simulation analysis. The second harmonic signal amplitude of the on-chip gas sensor is simulated by MATLAB. The important parameters of the simulation model include gas absorption parameters at 3291 nm, waveguide parameters, and laser parameters. The simulated limit of detection is calculated based on the signal-to-noise ratio.Results and DiscussionsThe trapezoid waveguide morphology is shown in Fig. 2, and the external confinement factor of the waveguide is about 8%. The CH4 sensing results based on wavelength modulation spectroscopy at 3291 nm show that the response result is linear (Fig. 5). The slot waveguide structure with magnesium fluoride as the lower cladding layer and chalcogenide glass as the core layer is optimized, and the external confinement factor reaches 42% (Fig. 6). Based on the experimental results, the effects of waveguide loss and waveguide length on the second harmonic signal amplitude are studied (Fig. 7). Decreasing waveguide loss and selecting an appropriate waveguide length can increase the sensing performance. The influence of the change of environmental pressure on the slot waveguide sensor can be ignored (Fig. 8). The influence of fabrication errors on slot waveguide sensor performance is analyzed (Fig. 9).ConclusionsIn this paper, an optical waveguide CH4 sensor with a lower cladding of magnesium fluoride and a core layer of chalcogenide glass is fabricated. With the combination of wavelength modulation spectroscopy technique and on-chip optical waveguide gas sensor, the CH4 sensing performance is analyzed. The performance of the slot waveguide CH4 sensor combined with the wavelength modulation spectroscopy technique is studied. Decreasing waveguide loss and choosing an appropriate waveguide length can increase the amplitude of the second harmonic signal and improve the performance of the waveguide gas sensor. When the waveguide loss is <3 dB/cm, the limit of detection can be <1×10⁻³. Further reducing the noise of the system can also reduce the limit of detection. The influence of the change of environmental pressure on the slot waveguide sensor can be ignored. The influence of fabrication errors on slot waveguide sensor performance is analyzed. We provide guidance for the design of an on-chip gas sensor based on wavelength modulation spectroscopy.
ObjectiveBroadband and high-resolution spectroscopy plays a significant role in many research fields such as atmospheric trace gas detection, industrial monitoring, precision measurement, and basic physics and chemistry. Large spectral bandwidth allows for the simultaneous detection of multiple species, which enables a single instrument to have many functions. However, detection techniques that can provide a pm-level spectral resolution over a wide bandwidth still need to be further studied. The virtually imaged phased array (VIPA) is a plane-parallel etalon, where the input beam is injected at an angle through an entrance window on the front face. The multiple reflections occur within the VIPA etalon. The emerging light interferes to make different frequencies exit at different angles. VIPA spectrometer is an orthogonal dispersion system composed of VIPA and grating and can achieve spectral coverage of tens of nm in a single frame and spectral resolution of pm. In the past years, the VIPA spectrometer has been widely applied in high-precision broadband spectral measurement. However, practical applications of VIPA spectrometer face the following problems. First, some algorithms that employ gas absorption to calibrate the VIPA spectrometer ignore the instrument lineshape function (ILS), and second, these algorithms are difficult to calibrate when weakly absorbed. Additionally, the adjustment structure of the VIPA spectrometer can still be improved. Our paper reports an improved near-infrared spectrometer based on the VIPA and presents the experimental details and performance evaluation. The broadband and high-resolution measurement technology of CO2 in 1.43-1.45 μm is carried out by combining the supercontinuum source and multi-pass cell. The results verify the reliability of the system and the accuracy of the improved data processing algorithm.MethodsThe experimental system mainly consists of a supercontinuum laser, a Chernin muti-pass cell, and a VIPA spectrometer. The broadband light is collimated by the aspheric collimator. Then the emergent light is reflected eight times inside the gas cell and finally connects to the interface of the VIPA spectrometer by a single-mode fiber to acquire the CO2 absorption spectrum. The experimental source is a supercontinuum laser with a spectral coverage of 0.47-2.4 μm. The Chernin cell is composed of five pieces of plano-concave mirrors with a radius of 0.5 m. To obtain CO2 absorption of appropriate intensity and avoid absorption saturation, the mirror angle of the Chernin cell is adjusted to realize the reflection number of 8 and the optical path of 4 m. The VIPA spectrometer is made of high-strength hard aluminum alloy with dimensions of 400 mm×280 mm×120 mm. The main improvements of the spectrometer structure are as follows. The adjusting structure of the cylindrical lens and the collimator is combined to change the incident optical axis, and the off-axis aberrations of the VIPA spectrometer are reduced. The adjusting structure of the imaging lens is improved and the CCD leads to more compact spectrometer. Meanwhile, the grating rotation structure is added and the spectral coverage of the VIPA spectrometer is extended. The system employs pure N2absorption as the background image (I0) and pure CO2absorption as the signal image (I). The algorithm subtracts the dark image from each of the signal and background images and then adopts Eq. (10) to subtract the baseline to get the absorption image. Finally, the algorithm extracts the one-dimensional spectra according to the rules shown in Fig. 2 and realizes the absorption spectral inversion.Results and DiscussionsThe fitting residual of the CO2 absorption spectrum at 6971.0021 cm-1 is 3×10⁻³[Fig. 4(c)], which verifies the correctness of the improved algorithm with the spectral resolution of the VIPA spectrometer being 4.5 pm [Fig. 4(d)]. By generalizing unimodal fitting to multimodal fitting, the broadband theoretical absorption spectrum can be obtained by line-by-line integration [Fig. 5(a)]. The minimum fitting residual of the whole spectrum (1.43-1.45 μm) is 5.31×10⁻¹, proving that the developed VIPA spectrometer can be utilized for broadband and high-resolution spectral measurement of gases. The standard deviation (SD) of the baseline is 2.68×10⁻¹[Fig. 5(a)], and the detection limit of CO2 molecules corresponding to the highest absorption peak of line intensity is 1.85×10⁻¹, which can be improved by increasing the optical path.ConclusionsA high-resolution near-infrared VIPA spectrometer with a relatively simple structure, a spectral resolution of 4.5 pm, and a spectral coverage of 25 nm in a single frame is developed. Improving the adjustment structure of the VIPA spectrometer makes the spectrometer more compact, reduces the off-axis aberrations, and extends the actual spectral coverage of the VIPA spectrometer. In terms of the data processing algorithm, the extraction accuracy of weak signals is improved by adding image enhancement algorithms, and the accuracy of gas parameter inversion is improved by considering the ILS. Finally, the broadband and high-resolution measurement technology of CO2 in 1.43-1.45 μm is carried out by combining the supercontinuum source and multi-pass cell. The fitting results of the single absorption peak at 6971.0021 cm-1 verify the spectral resolution of the VIPA spectrometer. The accuracy and reliability of the VIPA spectrometer applied to the measurement of broadband and high-resolution gas absorption spectrum are verified by comparing the measured absorption spectrum with the theoretical absorption spectrum. In the future, the VIPA spectrometer combined with optical cavity can realize broadband and high-resolution spectral measurement of trace gases.
SignificanceThe suspended particle in the environment is an indispensable component of the atmospheric system. Because of the uncertainty in time and space, it is difficult to identify and characterize the suspension system accurately in real time. Researchers in related fields focus on obtaining the online index system of the interaction between suspended particles and light technically, simulating the process and mechanism of the interaction between suspended particles and light theoretically, and then identifying and distinguishing the microphysical properties of suspended particles qualitatively and quantitatively by light scattering detection. The polarization scattering analysis in optical measurement can not only detect the original particle scattering process but also expand the information dimension of experimental data by polarization vector analysis, providing the possibility for the fine identification of different particle classes and attribute differences.ProgressThe light intensity distribution on the scattered sphere will change when the size, refractive index, structure, and other factors of suspended particles change. Based on the number of particles, the light scattering method can be divided into group suspended particle and single suspended particle detection.1) Group suspended particle detection technology. In the field of atmospheric climate prediction, the measurement of group suspended particles has broad application value. Han et al. designed an aerodynamic particle size spectrometer (APS) probe for measuring aerosol size distribution and an integral turbidimeter for measuring the total light scattering coefficient (Fig. 1) to measure the scattering coefficient, particle size, and complex refractive index of aerosol suspended particles, respectively.In the field of aerosol identification, LiDAR technology is widely used in aerosol monitoring and identification since it can provide longitudinal profile aerosol distribution information. Costabile et al. proposed a scheme to classify aerosol populations based on the spectral optical properties of suspended particles. Groß et al. proposed an aerosol identification scheme based on high spectral resolution lidar (HSRL) (Fig. 2) to analyze the two-dimensional graph of the lidar coefficient and linear polarization parameter to determine the aerosol type. However, such methods can only identify a limited number of aerosols and are limited to the analysis of two-component mixtures.2) Single suspended particle detection technology. Kaye et al. designed a suspended particle detection instrument based on spatial light scattering [Fig. 3(a)], which qualitatively analyzed the types of particles through angular scattered light and fluorescence intensity, effectively avoiding false positive detection of bioaerosols. Ding et al. designed an instrument that can measure multi-angle scattered light [Fig. 3(a)], enabling measurement and signal acquisition of 250 to 500 suspended particles per minute at three scattering angles (0°, 120°, and 240°), and the experimental results proved its feasibility in identifying spherical and irregular particles. In addition, Renard et al. designed a continuous particle monitor based on small-angle scattered light, enabling real-time monitoring of the concentration of suspended particles in the environment. By integrating active microfluidic and optical fluid technology into a single PDMS chip, Parks et al. demonstrated the feasibility of microfluidic chips for manipulating and detecting individual fluorescent particles.3) Polarized light suspended particle measurement technology. The particle information extraction after the introduction of polarization analysis reduces the high dependence on the scattering space angle and adds a new information dimension based on the polarization vector. At this time, the information of incident light and scattered light is transformed from a single light intensity dimension representation to a four-dimensional Stokes vector representation to realize a more detailed study of the physical properties of particles. It provides a guarantee for the identification of particle size, shape, structure, and more complex physical properties of suspended particles. Chen et al. designed an instrument based on single-angle polarization scattering measurement (Fig. 5), and the results showed that ball, ellipsoid, and fiber bundle samples had different mean and variance of polarization indices at 85° scattering angle, which proved the feasibility of the experimental device to identify particle morphology. Li et al. designed a device for measuring the polarization scattering of suspended particles (Fig. 6), realizing real-time high-throughput measurement of suspended particles in the air.4) Theoretical calculation of the scattering process of suspended particles. To solve the propagation process of polarized light in group particles, solving the scattering characteristics of single particles is the basis of solving the radiative transfer equation of group particles. There are many simulation methods for the single particle scattering process (Table 1), including the separation of variables method (SVM), finite difference time domain method (FDTD), Mie theory, and discrete dipole analysis (DDA).5) Optical information extraction of suspended particles. Suspended particles usually have a wide size distribution, complex composition and morphology, and a variety of complex microphysical characteristics. In the interaction between light and particles, the change in polarization state contains a wealth of information about the microphysical properties of particles. Therefore, some studies on the refinement of composite properties of suspended particles and quantitative extraction mostly use polarization scattering measurement signals. For example, a polarized optical particle counter determines the particle size by scattering signals, extracts morphological features from the polarized signals, and then qualitatively characterizes the type of particles. Liao et al. used the obtained polarization-measurement signals to retrieve the refractive index of the aerosol complex.The data obtained from the measurement of suspended particles are often complex temporal pulse signals, so it is very important to develop suitable data analysis algorithms. At present, the analysis methods of suspended particle detection data mainly include multi-dimensional polarization spectrum (Fig. 8), neural network (Figs. 9-11), and attribute inversion algorithm.Conclusions and ProspectsSuspended particles are an important part of the earth's atmospheric environment, which affects the climate environment and various activities of human society. Although the source of pollutant suspended particles only accounts for about 10% of the total aerosol, its impact on people's health cannot be ignored. The double uncertainty in time and space greatly improves the difficulty in real-time monitoring, accurate identification, and reliable prediction of suspended particles. Therefore, it is very important to introduce new detection and analysis techniques. The scattering polarization measurement method in the optical detection method can not only detect the scattering behavior of particles but also expand the dimension of measurement information by relying on the polarization property, which provides more possibilities for particle detection and identification.In this paper, advances in detection technology, calculation theory, and information extraction of suspended particles are reviewed. The two measurement methods of group particle and single particle are summarized respectively, especially the polarization scattering correlation technique. On the theoretical methods of suspended particle optical processes, several modeling methods of single particle scattering processes are introduced. Finally, the analysis and application of suspended particle detection data are summarized from three aspects: multi-polarization spectrum, neural network, and attribute inversion. These studies show the important application value of scattering polarization measurement in the field of aerosol measurement and also provide an important basis for the follow-up of researchers in more complex aerosol measurement solutions.
ObjectiveInce-Gaussian (IG) beams are widely used in the fields of beam generation and application due to their unique beam structure and phase distribution. In free-space optical communication, especially in atmospheric turbulent channels, IG beams show better anti-interference ability than Gaussian beams. However, the ocean turbulent channel environment is more complex and changeable, and the impact on the beams is more serious. To study the beam and signal transmission and communication characteristics of IG beams in ocean turbulent channels, we systematically study the transmission characteristics of IG and Gaussian beams in simulated ocean turbulent channels. The results provide a reference for IG beams to be applied in underwater laser communication.MethodsThe transmission and communication experimental platforms of IG optical signals in simulated ocean turbulent channels are designed and built. The platform can simulate ocean turbulence with different intensities by changing parameters such as water injection height, water temperature, and salinity. Firstly, the intensity scintillation index, centroid drift, and detector received power of IG beams and Gaussian beams are experimentally compared under different ocean turbulence intensity channels. Then the waveform distortion characteristics of the modulated signals of the two beams are further studied by modulating the square wave signals of 0.5–3 MHz frequency. Finally, the communication performance evaluation experiment of IG and Gaussian beams is carried out by loading modulation 7.5 Mbit/s signals with field programmable gate array programming. According to the above comparative results, the transmission and communication characteristics of IG beams in ocean turbulent channels are obtained.Results and DiscussionsThe underwater transmission and communication performance of IG beams and Gaussian beams are compared, including scintillation index, centroid drift, power jitter variance, waveform distortion, and the bit error rate (BER). When the water temperature increases from 40.1 ℃ to 60.2 ℃, the performance advantage between the scintillation index of the IG beams and Gaussian beams increased from 15.5% to 21.8%. The performance advantage between centroid drift increased from 11.6% to 18.3%. However, compared with the Gaussian beams, the power jitter variance performance advantage of the IG beams reduced from 12.9% to 3.7%. The performance advantage between the waveform distortion of the square wave signal of the IG beams at the modulation frequency of 3 MHz decreases from 6.3% to 5.6% when the water temperature increases. Compared with Gaussian beams, the communication systems with IG beams as carriers have better BER performance. When the BER is 3.8×10⁻³ (forward error correction threshold), the communication performance of IG beams in three kinds of underwater channels is better than that of Gaussian beams. The communication performance of the IG beam is improved by 0.8 dB at most in channels with different water injection heights, improved by 4 dB at most in channels with different temperatures, and improved by 2.5 dB at most in channels with different salinity. Moreover, the communication performance advantages of IG beams compared with Gaussian beams enhance with the increase in water injection height, temperature, and salinity.ConclusionsThe results of transmission experiments show that the scintillation index, centroid drift, and power jitter of the IG beams are better than those of the Gaussian beams. With the increase in ocean turbulence intensity, the improved ability of scintillation index and centroid drift of IG beams is enhanced, while the improved ability of power jitter is decreased. In different simulated ocean turbulence, the distortion of the modulated square wave of IG beams is lower than that of the Gaussian beams at the same frequency. The experimental results show that, when the BER is 3.8×10⁻³, the communication performance of IG beams in channels with different water injection heights, different temperatures, and different salinity is 0.8 dB, 4 dB, and 2.5 dB higher than that of Gaussian beams, respectively. In summary, IG beams have a unique advantage in transmission and communication characteristics compared with Gaussian beams in ocean turbulent channels.
ObjectiveClouds have a significant influence on radiation propagation in atmospheres. In atmospheric remote sensing, band radiative transfer (BRT) models in cloudy atmospheres are crucial and are widely used in climate change, environmental monitoring, weather forecasting, and other research fields. Although the line-by-line (LBL) model is widely acknowledged as the most accurate BRT calculation method, its widespread usage is constrained by its high cost. Recently, correlated k-distribution (CKD) methods have progressed significantly and have emerged as the most promising alternatives in BRT calculations. They provide a better balance of accuracy and efficiency compared to other methods. However, most CKD methods tend to optimize quadrature parameters based on spectral distributions of absorption coefficients in clear atmospheres and use band-averaged cloud optical properties (COPs), ignoring the influence of COP changing with wavenumber. When COPs vary greatly in the wavenumber space, such treatment will cause significant errors. This paper proposes a CKD method suitable for BRT calculation in cloudy atmospheres that takes into account the effect of spectral parameters other than absorption coefficient on radiation.MethodsGiven the high cost of band radiative transfer calculations for cloudy atmospheres in remote sensing applications, a maximum correlated k-distribution optimal algorithm for single-scattering parameters (SSP-MCKD) is proposed. First, the CKD theory is extended to multiple spectral parameters for cloudy atmospheres, such as single albedos, asymmetry factors, etc., after analyzing the correlation of their spectral distributions under different environmental conditions. Further, based on the influence of spectral parameters on the single-scattering source function, the maximum correlated parameter of each spectral line is confirmed. A maximum correlation parameter group is formed by spectral lines with the same maximum correlated parameter. Based on the proportion of spectral lines within groups, the quadrature intervals are divided into each maximum correlation parameter group. Further, spectral parameters within the group are rearranged in the order of the maximum correlated parameter. The average equivalent parameters and quadrature weights are then calculated between and within groups. Finally, experiments were conducted to verify the applicability of the proposed method under different conditions.Results and DiscussionsFig. 7 shows the mean relative errors of radiation calculated using the Δlog k method, correlated k-distribution with parameterization of cloud optical properties (PCOP-CKD), and the SSP-MCKD method under different number of quadrature intervals. With increasing quadrature intervals, the results of the three methods gradually converge to those calculated using the LBL model. The Δlog k method mainly considers the influence of the extinction coefficient, and the convergence curves are relatively stable. However, when the extinction coefficient is not the maximum correlated parameter in a given band, poor results are obtained, as shown in Fig. 7(c). The PCOP-CKD method ranks COPs based on the atmospheric absorption coefficients, where the correlation in the spectral distributions between the atmospheric absorption coefficients and COPs is maintained. This method ignores the influence of cloud scattering on BRT calculations. When the number of quadrature intervals is small, considerably desirable results are obtained. However, when the number of quadrature intervals increases, its calculation accuracy improves slowly. Hence, this method cannot meet the demand for practical engineering. The method proposed herein comprehensively considers the influence of spectral parameters on BRT calculations. As the number of quadrature intervals increases, its calculation accuracy has the fastest convergence speed.Table 6 lists the mean relative errors of radiation calculated using the Δlog k, PCOP-CKD, and SSP-MCKD methods in clouds with different heights. The PCOP-CKD method considers cloud atmosphere as two parts: cloud and atmosphere. This method is more accurate in the atmosphere part. This method in scene 1 is more accurate because of the lower cloud and stronger gas absorption. The average error obtained using the SSP-MCKD method is 1.68%, which is improved by 26.92 percentage points and 5.63 percentage points compared with that of the Δlog k and PCOP-CKD methods, respectively. Thus, the proposed method is suitable for BRT calculations in clouds at different heights.Table 8 lists the mean relative errors of radiation calculated using the three methods for different cloud types. The average error calculated using the SSP-MCKD method is 5.54%, which is improved by 17.73 percentage points and 3.31 percentage points compared with that of the Δlog k and PCOP-CKD methods, respectively.ConclusionsThe proposed SSP-MCKD method can be effectively employed in BRT calculations for cloudy atmospheres in remote sensing applications. This method has faster convergence in absorption, semi-absorption, and transmission bands compared with the other two methods. When the cloud average extinction coefficient and standard deviation are lower than 45 and 15 km-1, respectively, the proposed method shows good results. Even when the cloud extinction coefficients or its standard deviation increase significantly, this method still outperforms the other two methods. The idea of optimizing and grouping according to maximum correlation parameters can be used as a reference to solve BRT calculation problems in other mixtures containing both gases and particles.
ObjectiveSpace vehicles, deep space explorers, long-endurance aircraft, and other equipment have increasingly high requirements on navigation accuracy. In this aspect, a major issue to solve is how to improve the space navigation accuracy of aircraft, achieve fully autonomous interference-free navigation, and reduce the cost of expensive equipment. Starlight atmospheric refraction navigation technology neither involves the transmission and exchange of information with the outside world nor depends on the navigation and positioning by ground equipment. It is thus characterized by remarkable concealment and strong resistance to the external environment. However, due to the complex atmospheric environment in the near-Earth space, the bending of starlight toward the center of the Earth after entering the atmosphere will affect the accuracy of starlight atmospheric refraction navigation. For this reason, building an accurate starlight atmospheric refraction model is crucial for improving navigation accuracy. In related studies of starlight atmospheric refraction models, analysis is mostly based on the data from the United States Standard Atmosphere (USSA) parameter model, the COSPAR International Reference Atmosphere (CIRA) model, and the Neutral Atmosphere Empirical Model-2000 (NRLMSISE-00). However, the data from these universal models have a low resolution. Therefore, a corrected starlight atmospheric refraction model is constructed using the data from the National Centers for Environmental Prediction (NCEP) in this paper. NCEP data are recorded four times a day to give due consideration to the effect of the day and night temperature difference, and the resolution is 1°×1° in latitude and longitude. The model built on this basis will be more accurate than the traditional models with CIRA as the typical representative.MethodsThe accuracy of the commonly used USSA and CIRA atmospheric reference models is low. To solve this problem, this study builds a spatiotemporally varying atmospheric parameter model using the high-resolution NCEP atmospheric parameter data and employing the Fourier interpolation algorithm. The atmospheric refractive indices at different altitudes, latitudes, and longitudes are used to calculate the propagation path of starlight in the atmosphere, and a corrected starlight atmospheric refraction model is constructed.Results and DiscussionsThe comparison among the corrected starlight atmospheric refraction model and the existing models shows that the spatiotemporally varying atmospheric temperature model developed in this study has a relative error smaller than 2% and an average absolute error of 1.86 K when fitting measured data (Fig. 1) and a relative error below 4.39% when fitting the atmospheric density (Fig. 4). Moreover, the relative error between the refractive spatiotemporal model and the traditional single-point model at low, middle, and high latitudes in January is 37.64%, 9.79%, and 28.78%, respectively [Fig. 9(a)]. The relative error between the two models at low, middle, and high latitudes in July are 27.95%, 26.89%, and 39.10%, respectively [Fig. 9(b)]. Therefore, the proposed starlight atmospheric refraction model considering spatiotemporal variations has higher theoretical accuracy.ConclusionsIn this study, high-resolution data from the NCEP are selected for the reanalysis of the atmospheric parameter data. The reanalysis data are further used to build a spatiotemporally varying atmospheric parameter model. Model simulation results are presented, with due consideration given to the effects of temporal, horizontal, and vertical atmospheric parameters on starlight atmospheric refraction. The propagation path of starlight in the atmosphere is calculated, and the corrected starlight atmospheric refraction model is constructed on the basis of the spatiotemporally varying atmospheric parameter model. The changes in the refraction angle with height at different time, longitudes, and latitudes are calculated, and the deviations of the refraction angle with height at different time, longitudes, and latitudes are obtained through analysis. The results show that the relative errors between the refractive spatiotemporal model and the traditional single-point model at low, middle, and high latitudes in January are 37.64%, 9.79%, and 28.78%, respectively. The relative errors between the two models at low, middle, and high latitudes in July are 27.95%, 26.89%, and 39.10%, respectively. Finally, the apparent height is obtained by inverting the refraction angle, and its relative deviations from the traditional apparent height at low, middle, and high latitudes are 6.27%, 5.10%, and 5.42%, respectively. Because the corrected model takes into account the spatial and temporal variations in the atmosphere, the simulation results are closer to the changes in the real atmosphere.
ObjectiveAtmospheric turbulence causes laser intensity fluctuation, beam drift, and beam spreading, which necessitates the determination of its intensity. Refractive index structure constant (Cn2) profile and atmospheric coherence length (r0) are usually used to describe the atmospheric turbulence in the whole layer. The Cn2 profile in the whole layer is difficult to measure in real time economically in some cases, and researchers estimate atmospheric turbulence in different ways. Cn2 profile can be estimated using conventional meteorological parameters or artificial neural networks. Nevertheless, such methods either perform poorly in real time or require a considerable amount of measured data. An atmospheric coherence length monitor is usually employed to measure atmospheric coherence length and the isoplanatic angle, which can be further used for the real-time inversion of Cn2 profile. However, this instrument is easily affected by bad weather because it needs to track stars continuously. The study proposes a method to estimate the whole-layer atmospheric optical turbulence with multi-source measurement data from the microwave radiometer, wind profiler radar, meteorological sensor, micro-thermometer, and radiosonde. Being real-time and weather-proof, the proposed method is effective in engineering applications.MethodsSpecifically, a real-time atmospheric parameter profile is constructed with multi-source measurement data from the microwave radiometer, wind profiler radar, meteorological sensor, and radiosonde. Real-time ground-based data and radiosonde data are spliced together in accordance with the coefficients of correction at different heights. Then, this study distinguishes the atmospheric stratification state and calculates boundary layer height according to the distribution characteristics of the potential temperature gradient with the data from the microwave radiometer. After that, the Cn2 profile in the boundary layer is estimated by applying the exponential decline model, using real-time data from the micro-thermometer. The exponential decline index is -3/4 during the daytime and -2/3 at night. The Cn2 profile in the free atmosphere is estimated by employing the Dewan outer-scale model, using the previously constructed real-time atmospheric parameter profile. Furthermore, the Cn2 profiles in the two layers are spliced together to estimate r0 according to the integral relationship between the two layers. Finally, the estimated r0 is compared with the value measured by the atmospheric coherence length monitor.Results and DiscussionsThe calculated boundary layer height varies from hundreds of meters at night to more than three thousand meters in the afternoon, and it is based on the previously constructed real-time atmospheric parameter profile data from August 3 to August 5 (Fig. 2). The estimated Cn2 profiles in the boundary layer and free atmosphere are spliced together, and the results show that Cn2 decreases with fluctuations, as altitude increases from ground level to 25 km. The order of magnitude of the estimated Cn2 decreases from 10-15 to 10-19 at night and in the morning and from 10-14 to 10-19 during the daytime (Fig. 3). The estimated r0 has the same order of magnitude and daily variation trend as those of the measured values. The consistency between them is fair in unstable atmospheric stratification but poor in the case of stable and near-neutral atmospheric stratifications (Fig. 4). The deviation is maximum in near-neutral atmospheric stratification, when the atmospheric turbulence near the ground is weak (Fig. 5). The root-mean-square error (RMSE) between the estimated r0 and the measured r0 is 2.988 in unstable atmosphere stratification, 6.858 in near-neutral atmospheric stratification, and 5.088 in stable atmosphere stratification. The correlation in unstable atmospheric stratification is much better than that in stable or near-neutral atmospheric stratifications (Table 2). In addition, the estimated r0 in the two component layers is compared with that in the whole layer obtained by applying the Dewan model. The RMSE between the estimated r0 and the measured r0 shows that the estimated r0 in the whole layer is slightly more consistent than that in the two component layers. Nevertheless, the standard deviation shows that the estimated r0 in the two component layers is much less fluctuant than that in the whole layer (Fig. 7). The deviation of the estimated r0 from the measured r0 is caused by several reasons. First, the atmospheric turbulence model has a technical route different from that of instrument measurement. Second, the applicability of the atmospheric turbulence model is doubtful in the sense that the similarity theory of turbulence is probably false in stable or near-neutral atmospheric stratification. Last but not least, data fusion and processing may also cause estimation errors.ConclusionsMulti-source atmospheric measurement data are used to estimate Cn2 profile and r0 in real time. The results show that the estimated r0 has the same order of magnitude and daily variation trend as those of the measured r0. Moreover, the RMSE is minimum in unstable atmospheric stratification and maximum in stable atmospheric stratification, and the correlation in unstable atmospheric stratification is better than that in stable or near-neutral atmospheric stratification. Analysis proves that the whole-layer atmospheric optical turbulence can be estimated in real time by estimating the Cn2 profile in the two component layers with multi-source measurement data. The proposed method provides better real-time performance in estimating the whole-layer atmospheric optical turbulence and can validate instrument measurement in some cases. Therefore, it has great engineering application significance. Since the key to this method is to estimate the Cn2 profile in the boundary layer accurately, modifying the atmospheric turbulence model for the boundary layer is important for improving estimation accuracy.
ObjectiveOptical OFDM index modulation (O-OFDM-IM) is a new multicarrier modulation technique that can achieve remarkable improvements in transmission rate and bit error rate (BER) performance by carrying additional information through the index of subcarriers. Currently, in the field of optical communication, O-OFDM-IM has triggered a research boom for potential improvements in system error performance and spectrum efficiency. However, existing O-OFDM-IM schemes require complex channel estimation at the receiver to obtain channel state information, which not only increases the complexity of the receiver but also brings a large spectrum resource overhead. This study proposes a differential index shift keying DC-bias optical OFDM (DISK-DCO-OFDM) scheme that avoids complex channel estimation while ensuring BER performance. Additionally, a multiclassification detector based on radial basis function (RBF) neural network is suggested to address the high complexity of the receiver.MethodsBy considering a single subcarrier block as an example at the transmitter side, an initial transmission matrix that does not carry information is first prepared at the transmitter before the differential operation is performed. Then, the input binary bits are mapped into a time-frequency dispersion matrix that satisfies the difference operation, i.e., the matrix has only one non-zero element in each row and column. For difference operation, the time–frequency dispersion matrix of the current moment is multiplied with the transmission matrix of the previous moment to obtain the true signal matrix of the current moment. Next, the real signal matrix is transmitted by the laser after the Hermitian symmetry and inverse Fourier transform. On the receiver side, the received signal matrix of the previous moment was first inverted and then multiplied with the received signal matrix of the current moment, and the characteristic matrix of the received signal can be obtained. Then, the real and imaginary parts of the feature matrix were used to construct a one-dimensional feature vector, which was used as the input of the RBF neural network. Finally, the trained neural network was used as a multiclassification detector to complete the decoding work at the receiver side. The proposed scheme completely avoids complex channel estimation.Results and DiscussionsThe DISK-DCO-OFDM system was established in this study and the BER performance of the system was simulated under different turbulence intensity and received aperture conditions. First, we derived an upper bound of the average bit error rate (ABER) of the system and compared the simulated BER with the ABER (Fig. 2). The two curves asymptotically coincided at high signal-to-noise ratios, which demonstrated the accuracy of the derived ABER. Then, we compared the BER performance of the proposed scheme with that of the conventional subcarrier index shift keying DCO-OFDM (SISK-DCO-OFDM) system, and the corresponding results are shown in Fig. 3. The BER performance of the proposed scheme is substantially better than that of the SISK-DCO-OFDM system when the subcarrier block length is 2 under weak turbulence condition. When the subcarrier block length is 4, the BER curves of the proposed scheme and the SISK-DCO-OFDM system coincided at high SNR. Therefore, the proposed scheme guarantees the BER performance while effectively avoiding the channel estimation. The computational complexity reduction rate and BER performance of the proposed multiclassification detector for the receiver side compared with the differential maximum likelihood (DML) detection algorithm are shown in Fig. 6 and Fig. 7, respectively. The computational complexity of the proposed detector is reduced by 16.67% and 70% for subcarrier block lengths of 2 and 4, respectively, compared with the DML. The difference in the BER performance between the two detection algorithms does not exceed 2 dB under weak turbulence.ConclusionsThis study proposes a DISK-DCO-OFDM scheme. The main feature of this scheme is the use of a time-frequency dispersion matrix that satisfies the differential process. Simulation results show that the proposed scheme not only effectively avoids the channel estimation process but also guarantees better BER performance than all current optical OFDM index modulation systems in a weak turbulence environment. Meanwhile, the proposed multiclassification detector can considerably reduce the decoding complexity at the receiver side, and the difference in BER performance compared with DML does not exceed 2 dB. In particular, the method of constructing the received signal feature vector provides an effective reference for future decoding using machine learning or deep learning methods at the receiver side for differential-type systems. Therefore, the proposed scheme can provide a reference for the application of optical OFDM index modulation in complex channel environments, and the proposed multiclassification detector can contribute to future research on reducing the decoding complexity at the receiver side.
ObjectiveIn recent years, quantum communication has become a research hotspot in China and abroad for its better data transmission security. As the core of the quantum information theory, quantum communication can be more secure and reliable for information transmission and is an important direction of inquiry. With the development of underwater wireless communication, it is important to research underwater quantum communication for marine and military fields. Bubbles are ubiquitous in the ocean, and the scattering and refraction effects of bubbles on light can cause certain losses in optical quantum transmission, which exerts a certain impact on the performance of underwater optical quantum communication. However, the research on the effect of bubbles on the channel performance of underwater quantum communication has not been conducted. By building the particle size distribution and scattering coefficient models of marine bubbles, the paper analyzes the effects of different condition parameters on link attenuation, entanglement, channel capacity, and channel bit error rate (BER) in the marine bubble environment to investigate the influence of these bubbles on the channel performance of underwater quantum communication. This is of great significance to improve the efficiency of underwater quantum communication.MethodsMarine bubbles are mainly generated by wind-driven wave breaking. With an aim to study the influence of marine bubbles on the channel performance of underwater quantum communication, the particle size distribution function of the bubbles is firstly derived and established. The scattering characteristics and extinction coefficient of the bubbles are studied according to the particle size distribution model of marine bubbles. Additionally, according to the extinction characteristics, the relationship between marine bubble parameters and link attenuation is firstly established, and then the effects of different depths and bubble radii on channel entanglement are analyzed. Then, the effects of different bubble concentrations and transmission distances on three channel capacities of amplitude damped channel, depolarized channel, and bit-flip channel are analyzed respectively. Finally, the effects of different bubble concentrations and transmission distances on channel BER are studied and analyzed. At the same time, the effects of different bubble concentrations and transmission distances on the channel BER are studied and simulated. The theoretical analysis and simulation results can provide a reference for the design of underwater quantum communication in the marine bubble environment.Results and DiscussionsThe simulation results show that the density of bubbles decreases with the increasing depth from the sea level, whereas increases with the rising wind speed. The scattering coefficient of bubbles has the same trend as the bubble density number under the same parameter conditions. Under short transmission distance and small bubble concentration, the link attenuation caused by marine bubbles is also small. With the increase in the transmission distance of optical quantum signals and the bubble concentration, the link attenuation grows rapidly. The channel entanglement increases with the rising depth from the sea level and the decreasing bubble radius. For the amplitude damping channel, depolarization channel, and bit-flip channel, the channel capacity decreases to different degrees with the increasing transmission distance and bubble concentration. The capacity of the depolarization channel and the bit-flip channel is more affected by the transmission distance, and the transmission distance exerts less effect on the channel capacity. The BER in the marine bubble environment is also affected by the transmission distance and bubble concentration. When the bubble concentration is small with a short transmission distance, the system BER changes slowly. When the bubble concentration is large with a long transmission distance, the optical quantum signal attenuates seriously and the BER value rises rapidly.ConclusionsTo investigate the effect of marine bubbles on the channel performance of underwater quantum communication, this paper studies the scattering characteristics of the bubbles according to the particle size distribution model of marine bubbles. In addition, the effects of different condition parameters on link attenuation, entanglement, channel capacity, and channel BER are analyzed according to the extinction coefficient of bubbles, and simulation experiments are conducted. The results show that the increase in bubble concentration and transmission distance increases the link attenuation and BER, and the channel capacity decreases for amplitude damping channel, depolarization channel, and bit-flip channel. The channel entanglement decreases with the increasing bubble radius and decreasing depth, and the impact of marine bubbles on communication performance cannot be ignored. Meanwhile, parameters related to underwater quantum communication should be adjusted appropriately according to the concentration of marine bubbles to reduce the impact of the marine bubble environment on the communication system and improve the reliability of the communication system in practical application.
ObjectiveScattering and absorption of light by suspended particles in scattering media can lead to significant degradation of image quality. In the imaging environment of turbid water, the interference of backscattered light leads to image degradation, and the light is partially polarized. In order to obtain clear images, it is necessary to suppress backscattered light, which is also the core of underwater polarization imaging technology. Most of the existing underwater polarization imaging methods distinguish scattered light from signal light in the spatial domain based on their polarization information. However, overlapping in the spatial domain makes it difficult to fully suppress the backscattered light only by using the polarization characteristic difference between the target signal light and the backscattered light. In fact, the two kinds of lights are distributed differently in the spectrum of a linearly polarized image. The backscattered light, which is the main cause of image degradation, is relatively concentrated in the low-frequency components of the spectrum, while the information of the target signal light is mainly distributed in the high-frequency components. In this paper, an underwater polarization imaging method based on polarization image spectrum processing is proposed, which effectively suppresses backscattered light by the frequency domain filtering and polarization correlation processing of orthogonally polarized images and improves the contrast and clarity of underwater images. The method proposed in this paper and the results are of great significance to the research on polarization image enhancement and underwater clear imaging.MethodsThe proposed method mainly utilizes the spectrum distribution differences between the target signal light and backscattered light. With the help of frequency domain filtering and polarimetric recovery, this method separates and suppresses scattered light in steps and finally achieves high-quality image recovery. First, the cross-linear image in orthogonal polarization images is processed by a high-pass filter, which contains more target information, so as to automatically search for the optimal cut-off frequency of the filter. By extracting high-frequency components, the target signal light and backscattered light are preliminarily separated. With the high-frequency components of the cross-linear image, polarization-related processing is performed on the co-linear image. In fact, there is a polarization relation between the two orthogonal polarization images, which can be represented by the degree of polarization (DOP). In order to maintain this intrinsic polarization relation, it is necessary to keep DOP constant and process the co-linear image based on the high-frequency component of the cross-linear image filtered by the optimal filter. Then the processed orthogonal polarization images are employed to estimate parameters including the DOP of backscattered light, the value of backscattered light from infinity in turbid media, and the transmission based on the improved traditional polarimetric recovery method, and then the recovered image of the target objects in underwater can be finally obtained.Results and DiscussionsThe results of polarization imaging experiments of different objects in water with different turbidity show that the proposed method can efficiently restore the images of target objects and improve the underwater imaging quality. In experiments of the panda-pattern target, search results of the optimal cut-off frequency of each filter are visualized in Fig. 4. By analyzing the intensity histogram at the dash of the result images (Fig. 5), it is found that the proposed method is superior to the Schechner's method. Several methods are used to recover a series of images of another target, and the result shows that the proposed method displays better performance in restoring object details and improving the overall visual effect (Fig. 6). Meanwhile, according to the value of enhancement measure evaluation function(Fig. 7), the proposed method has achieved the highest value representing the most significant improvement in image quality. Further experiments are carried out to verify the effectiveness of the proposed method for different objects in highly turbid water. Compared with other methods, the proposed method can better suppress scattered light. Therefore, the result images by the proposed method are more evenly illuminated, and the details are clearer (Fig. 8).ConclusionsIn this paper, in order to obtain clear images, a turbid underwater polarization image enhancement method is proposed based on frequency domain processing and polarization preservation, and the difference between the scattered light and the signal light in the frequency domain is utilized. By applying a high-pass filter on the orthogonal polarization image pair in the frequency domain, the backscattered light concentrated in the low-frequency component is initially separated and removed. Here, the optimal parameters of each filter in different concentrations and scenes are automatically searched to obtain more accurate target object information. Then the polarization degree is maintained to correlate more accurate orthogonal polarization image pairs. Finally, on the basis of the traditional physical model, the images of objects have been successfully recovered. This paper has carried out a series of experiments on different objects in underwater environments with different turbidity, and the results show that the proposed method based on frequency domain processing can effectively suppress the impact of scattered light on polarization imaging and highlight the signal light of objects. Compared with the traditional underwater polarization imaging methods, the proposed method can improve the uneven illumination problem in turbid water and significantly enhance the contrast and clarity of images, especially for highly turbid water.
ObjectiveIn the context of intelligent surveying and mapping, the quality of remote sensing imagery directly determines the intelligent interpretation level, the accuracy of image products, and ability of application services. Before processing and application, effective evaluation of remote sensing imagery or payload is required. Spatial resolution is an important index to measure the imaging performance of optical remote sensing payload, which is usually detected by three-bar targets or fan-shaped targets deployed in the remote sensing calibration. The three-bar detection method features simplicity and directness. However, due to discrete deployment, the detection results are easily affected by the phase difference factor, with low accuracy of the method. Fan-shaped targets are usually deployed on a two-dimensional plane. Due to the influence of perspective imaging and geometric distortion, the spatial resolution detection method should be carried out under the condition of vertical photography or geometric correction. Thus, during imaging at a large angle, the method cannot be directly employed for resolution detection due to large geometric deformation. Even under the condition of geometric correction, the resolution detection accuracy will be greatly reduced due to edge reduction or pixel mixing effect. Therefore, according to the isotropic characteristics of the three-dimensional spherical surface, this paper proposes to construct a fan-shaped resolution detection target on a spherical surface, which is called a spherical target. It also hopes that the spherical target can be helpful in solving the problems brought by three-bar or fan-shaped radial targets, and can be directly adopted for spatial resolution detection of high-resolution optical imaging loads under non-vertical imaging and non-geometric correction conditions.MethodsFirstly, this paper builds a mathematical model of the spherical target and analyzes the design modes of the spherical target under equal and unequal conditions, with deployment strategies of spherical targets being given. Secondly, based on the traditional two-dimensional target image resolution determination method, an ideal spherical target image resolution determination method is given, and the resolution detecting range is analyzed for different types of spherical targets. Thirdly, the imaging characteristics of spherical targets are analyzed. Additionally, based on the building of the strict imaging model, the central projection deformation rule of the spherical target is studied by parameter simulation. The conclusions are obtained as follows. For multiple concentric circles with the center of the fan-shaped target strip as the origin, imaging ellipses on the two-dimensional images have the same eccentricity. The centers of the imaging ellipses are on the same straight line, while the proportional relationship between the long half axes of the ellipses is approximately equal to that of the image resolution. Finally, an image resolution determination method based on directional moving ellipse fitting is innovatively proposed for the spherical targets, and technical steps of the method are given.Results and DiscussionsUnder the condition of central projection, images are simulated for the concentric circle of the spherical target (Fig. 5). Both the imaging characteristics and ellipse fitting characteristics are analyzed through the simulated data. Simulation results show that the distance ratio error of the long half-axis of the spherical target imaging ellipse is low, and the maximum deviation of the simulated data is not more than 1% (Table 4), which is suitable for spatial resolution detection. By employing the actual spherical target fixed in the China (Songshan) satellite remote sensing calibration field, the edge extraction (Fig. 6) and ellipse fitting (Fig. 7) process on a unmanned aerial vehicle (UAV) sensor target image is conducted, and then the ellipse eccentricity (Table 5) is calculated. Based on multi-scale ellipse construction and sampling point acquisition (Fig. 8), the gray curve of the target strip image obtained by the fixed center ellipse fitting method (Fig. 9) is intercepted and drawn and is compared with the intercepted and drawn results obtained by the proposed method (Fig. 10). Then, the optimal long half axis size of UAV image target ellipse is analyzed (Table 8), and the spatial resolution of UAV imaging load is calculated and evaluated to verify the validity and accuracy of the proposed method.ConclusionsThis paper aims at improving the imaging performance evaluation effectiveness of aerospace remote sensing payloads. Based on analyzing the advantages and disadvantages of the two-dimensional fan-shaped target in the remote sensing calibration field, it proposed a method for determining the spatial resolution of optical imaging payload directly on the spherical target image. Then, it also conducts experiments on both simulated data and actual UAV spherical target images and verifies the feasibility and correctness of the proposed method for remote sensing payload under tilt imaging conditions. Compared with the traditional two-dimensional fan-shaped target, the proposed method avoids the image correction processing based on ground control points or digital elevation model data and does not need the image geometric positioning model to be involved in the correction solution. In addition, the spherical target image can be directly employed to determine the load imaging performance, with a more accurate spatial resolution determination effect. The methods and experimental results in this paper can provide technical support for the construction of the spherical target in the remote sensing calibration field and the spatial resolution determination of high-resolution optical remote sensing payload.
ObjectiveAs indicators of the ecological health of water bodies, planktonic algae are important primary producers in water ecosystems. The density monitoring of planktonic algae is of great significance to the diagnosis of water quality and the warning of algal blooms. Due to the presence of small individual and large numbers of planktonic algae, suspended impurities and other factors, traditional methods are difficult to achieve rapid and accurate measurements. Flow cytometric fluorescence method counts by detecting single cell fluorescence. This method features rapid, accurate, and highly efficient measurement, but it is not suitable for miniaturized field rapid measurement because of its complex injection structure and cumbersome focusing mode. Microfluidic chip technology realizes the functions of feeding, focusing, and sorting by constructing micro-channel pipelines on a square centimeter chip. This technology can simplify the complex feeding structure of the flow fluorescence method and has been widely employed in pharmaceutical and life science fields. Based on chlorophyll fluorescence in the characteristic band emitted by excited algal cells, this paper combines microfluidic chip technology and microfluorescence detection technology. It aims to realize rapid and accurate density detection of planktonic algal cells by detecting the number of single algal cell fluorescence peaks at a specific volume under a simple structure.MethodsThe experimental system consists of a sample feeding module, a fluorescence excitation module, and a fluorescence detection module. The excitation light from the monochromatic high-brightness LD is focused on the surface of the microfluidic channel by the drop-in microscopic optical structure. The algal cells in the microfluidic channel pass through the excitation window at a uniform speed under the propulsion of the syringe pump, and the cells are excited to emit fluorescence. Each cell flow across the microscopic field of view corresponds to a fluorescence peak, and then the density of algal cells in the sample can be calculated by recording the number of fluorescence peaks for a specific volume of the sample.Results and DiscussionsA method of detecting the planktonic algae density based on microfluidic and microfluorescence technology is studied to realize rapid and accurate density measurement of planktonic algal cells. By microfluidic chips, injection pumps, objective lenses, and photomultiplier tubes, an experimental system is established to measure the fluorescence signals of algal cells with different densities. Combined with optical simulations, this method can accurately measure the fluorescence signals of algal cells with low and medium densities. The relative errors of the counting results at low densities are less than 3.49% compared with those of microscopy and Coulter counting (Table 1), and the results of testing algal cells of different species and particle sizes show that the relative errors of the method in the density range of 1.3×10⁶ L-1 are less than 3.96%. All of them were less than 3.96%, and the accuracy is not affected by the suspended matter, algal cell species, and size (Fig. 5). With the expanding range of testing algal density samples, the measurement error shows an increasing trend, which means that the measurement accuracy of the method and algal density is negatively correlated (Fig. 6). This is consistent with the simulation results, and the upper limit of the detection density is increased to 5×10⁶ L-1 within the allowable error range of 10% (Fig. 7).ConclusionsDue to the existence of small individual and large numbers of planktonic algae, suspended impurities and other factors, it is difficult to accurately detect algal density through the currently available algal density rapid detection technology. This paper proposes a microfluidics-microfluorescence-based method for planktonic algae cell density detection. This method is also based on microfluidics for rapid quantitative sample injection, confocal microfluorescence structure for high signal-to-noise acquisition of algal cell characteristic fluorescence signals, and the analysis of fluorescence peak information for planktonic algae cell counting. The results show that the relative measurement error in the density range of 1.3×10⁶ L-1 is less than 3.96%, and the accuracy is not affected by the suspended matter, algal cell type, and size. The upper limit of algal density detection can be increased to 5×10⁶ L-1 with the allowable error range of 10%, which can meet the demand of natural water bodies. The proposed microfluidic-microfluorescence technology that employs the unique chlorophyll fluorescence information of algae effectively overcomes the interference of suspended matters and features simple feeding module and optical structure. It is a new way for rapid and accurate detection of algal cell density.
ObjectiveRapid industrialization in China has gradually led to long-term accumulated soil environmental problems. In addition, pollution caused by industrial and agricultural production processes constantly deteriorates soil environmental quality. Polycyclic aromatic hydrocarbons (PAHs) are a class of persistent organic pollutants that are mainly derived from man-made pollution and migrate globally with biogeochemical cycles. Residual PAHs in soil have a profound impact on environmental quality and human health. Therefore, it is of great practical significance to monitor organic pollutants in soil and timely grasp the pollution situation of the regional topsoil. At present, PAHs are detected using field sampling and laboratory instrument analysis. Trace analysis methods based on chromatographic separation have the advantages of low detection limit and high accuracy, but they usually require complex sample pretreatment, complicated operation, and long detection cycle. Thus, studies have developed a light-emitting diode (LED)-induced fluorescence methods using newly-invented luminescent materials and advanced production technologies. An LED can make up for the deficiencies of traditional excitation light sources, facilitating the production of small instruments. In this paper, the feasibility of using an LED-induced fluorescence spectroscopy technology for the rapid determination of PAHs in soil is discussed based on the fluorescence detection system of UV LED array excitation and a theoretical basis is provided for the application of LED-induced fluorescence in the rapid, accurate, and real-time detection of soil organic pollutants.MethodsIn this experiment, four types of PAHs were selected as the research objects. Two different types of soil, standard soil and actual soil, were selected to prepare soil samples with PAHs. An LED-induced fluorescence detection system mainly comprises an excitation light source, sample pool, optical fiber spectrometer, fluorescence signal acquisition device, and computer control unit. The UV LED array beam irradiates the soil sample, forming a moderately sized circular light spot on the surface of the sample. After filtering, the fluorescence signal generated via excitation was collected using the fluorescence collection device and transmitted to the spectrometer using the UV fiber for beam splitting and detection. Furthermore, the spectral data was stored and analyzed by the computer control unit, which is connected to the spectrometer. The Savitzky–Golay convolution smoothing method was used to preprocess the fluorescence spectrum of the detected PAHs to improve the accuracy of fluorescence signal extraction and effectively retain the useful information in the spectrum while filtering the noise.Results and DiscussionsIn this study, a 255-nm UV LED-induced fluorescence detection system was designed to rapidly detect the fluorescence spectra of different PAHs in soil. The authenticity of the fluorescence spectra obtained by the experimental system was verified by comparing the LED-induced fluorescence spectra of PAHs in the soil with the three-dimensional fluorescence spectra of PAHs in the solution obtained by standard fluorescence instruments, which resulted in a reliable optical support system for the follow-up experiments. Our results show that the number of fluorescence bands and the position of characteristic peaks of PAHs in different soil types are basically the same, while the shape and intensity of the spectral peaks are slightly different. The fluorescence intensity and concentration of PAHs in two different standard soils show a good linear relationship within a certain concentration range, and the linear correlation coefficients are greater than 0.98. Under similar conditions, the system can effectively detect PAHs at lower concentrations in kaolin, and its detection limit is generally lower than PAH samples of loess. Thus, these findings indicate that soil microstructure characteristics and soil matrix complexity, and the combination of soil minerals and PAHs affect the detection of LED-induced fluorescence. The quantitative analysis of PAH soil samples under the actual complex soil background based on the fixed-point wavelength concentration inversion model reveal that the relative errors of the model for the concentration prediction of PAH soil samples in the test set are within the ideal range, except for some low concentration PAH samples. In addition, the average relative errors of different PAH samples are no more than 15.5%.ConclusionsThe LED-induced fluorescence method provides a new approach for detecting PAH organic pollutants in soil and makes up for the limitations of traditional chromatography and fluorescence spectroscopy. Based on the established UV LED-induced fluorescence detection system, this paper analyzed the LED-induced fluorescence characteristics of PAHs in different types of standard soil and further discussed the quantitative analysis of actual soil contaminated with PAHs. The experimental results verify the feasibility of the LED-induced fluorescence method for the rapid detection of PAHs in soil and its good applicability in different soil types. This also provides a technical reference for the rapid insitu detection of PAH organic pollutants in soil.
ObjectiveTo meet the performance indicator requirements of long focal length, far detection distance, and high agility, modern optoelectronic equipment usually adopts the discrete optical-mechanical design to integrate a series of complex optical-mechanical components and sensors such as off-axis three mirrors, scanning reflector, fast steering mirror, and inertial measuring unit (IMU). These optical-mechanical components and sensors dramatically lead to more complex optical paths, making the optical axis pointing accuracy increasingly more sensitive. On one hand, the relative positions between the optical and mechanical components are changed easily under the excitation of vibration and shock mechanical environment and thermal environment. On the other hand, there are also measurement errors in IMU sensors. Both of them will ultimately lead to the out-of-tolerance of optical axis pointing accuracy. Frequent reassembly will not only consume huge manpower and material resources but also seriously interface with the program progress. Additionally, the influence of the assembly and adjustment residuals for the discrete optical system on the pointing accuracy cannot be ignored. Compared with the traditional mechanical assembly and adjustment, the digital correction can realize the rapid calibration of optical axis pointing through the pointing error modeling and the sample data obtained by tests. Therefore, it has become more and more urgent for the discrete optical system to develop research on digital correction technology.MethodsA digital correction method of optical axis pointing error based on star measurement is studied to realize the fast correction of the optical axis pointing error of discrete optical systems. A discrete optical system containing the scanning reflector, fixed reflector, and IMU sensor is taken as an example to conduct the studies. At first, the optical axis pointing model in the geodetic coordinate system is derived by the quaternion method. In the pointing model, a total of 11 error parameters caused by structural processing assembly errors and sensor measurement errors are taken into account. Then, the equations are linearized by the first-order approximation of Taylor series expansion of the error parameters trigonometric function terms, and the calibration model of the error parameters is further deduced through the least square fitting. In addition, the calibration datum for star targets is established and the position of the star datum in the geodetic coordinate system is computed based on astronomical navigation principles. Finally, the digital correction technology of the optical axis pointing error is verified through the star measurement experiment.Results and DiscussionsA total of 11 error parameters of the discrete optical system and the fitting accuracy are all obtained by combining the calibration model of error parameters and data of test samples (Table 2). The error angles between the calculated and theoretical optical axis vectors before and after correction are computed for all samples and are compared (Fig. 7). The root mean square (RMS) value of the pointing errors after calibration is 11.61″, which equals the fitting accuracy, indicating the fitting accuracy can represent the optical axis pointing accuracy after correction. Through comparative analysis, the RMS value of the pointing errors decreases from 398.15″ to 11.61″ and the pointing accuracy is improved by 97.1% after the digital correction is developed (Fig. 7). The qualitative and quantitative verification tests are carried out respectively to evaluate the improvement effect of the pointing accuracy. The location values of the building feature point obtained through the gyro theodolite are taken as the given to adjust the optical axis. There is a large deviation between the optical axis pointing and the building feature target before correction, while the deviation almost disappears after pointing error correction (Fig. 8). After correction, the missing distance of the target star can be obtained by adjusting the optical axis pointing to the target star in the target pointing mode (Fig. 9). The RMS value of the missing distance is 10.78″ (Fig. 10). Both qualitative and quantitative verification test results show a significant increase in the pointing accuracy after digital correction.ConclusionsWe propose a digital correction method for the optical axis pointing error to improve the pointing accuracy of the discrete optical system. The theoretical modeling and experimental verification are carried out carefully. In theoretical modeling, the optical axis pointing model of the discrete optical system is built by the quaternion method, and the calibration model of the error parameters is deduced through the Taylor series first-order approximation of the trigonometric function terms of the error parameters and the least square fitting method. In addition, the star calibration datum is established based on astronomical navigation principles. The verification experiments indicate that the optical axis and building feature point almost coincide after correction, and the pointing error between the optical axis and star datum reduces from 398.15″ to 11.61″ after correction, with the pointing accuracy being improved by more than 97.1%.
ObjectiveRadiation calibration is a necessary prerequisite for the quantification of remote sensing data from laboratory calibration before launch to on-orbit calibration after launch throughout the entire life cycle of remote sensors. Site calibration is a common method for on-orbit alternative calibration of remote sensors with large fields of view. When a remote sensor is operating normally, it is calibrated with a large area of uniform ground objects as the calibration source, which has the advantages of a high calibration frequency and no need for synchronous measurement. The Greenland ice sheet (-75°S, 123°E) and the Antarctic ice sheet (73.375°N, -40°W) are commonly used as targets for snow and ice scenes, whose surfaces are covered with evenly distributed snow. Due to their high altitudes (usually greater than 2 km), they are less affected by the atmosphere and help obtain calibration samples with better data quality. Furthermore, ice and snow have a relatively flat spectrum in the visible range, which makes band transfer easier with other calibration methods. Thus, using the Greenland ice sheet and the Antarctic ice sheet as the calibration source of snow and ice scenes has many advantages for the calibration and verification of remote sensors.MethodsThe research method in this paper is based on the previous study of polar scene calibration methods. First, we choose Greenland as the calibration target of snow and ice scenes and select the calibration sample in the directional polarimetric camera (DPC) level 1 data. The area interfered with by cloud pixels is then eliminated after spectral channel traversal and angle traversal through the calibration sample's rows and columns. After substituting the surface bidirectional reflectance distribution function (BRDF) and atmospheric parameters (aerosol, water vapor, ozone, and other profiles) of the snow and ice scene into the radiative transfer model to obtain the zenith reflectivity and radiance, we test the on-orbit radiation response changes of the payload of the DPC on Gaofen-5 satellite. In addition, the obtained conclusions are in good agreement with the calibration results of the desert and ocean scenes, and the dispersion of the calibration results is smaller.Results and DiscussionsWe compare the measured results of the DPC with the calibration results and obtain the following findings.1) When the view zenith angle is less than 50°, the measured reflectance values of each band of the DPC have good consistency with the calibrated reflectance values. The standard deviations of their ratios are within 3%, and the root-mean-square errors were both lower than 2% (Fig. 4 and Table 3).2) When the view zenith angle is less than 30°, the measured top-of-atmosphere (TOA) radiance values in each band of the DPC are compared with the calibrated TOA radiance values. The results show that the DPC data in the visible light band are relatively stable and have low uncertainty (Fig. 5 and Table 4).3) The influence of the atmosphere (aerosol, water vapor, and ozone) and the surface BRDF on TOA reflectivity is analyzed. The uncertainty of the BRDF model of the snow and ice scene is 2%. Finally, we synthesize the uncertainty of each factor, and the synthetic uncertainty of each band is 2% (Table 5).4) The research on the size of ice and snow shows that the average relative error of fine snow in each band is within 4%, and the relative error standard deviation of bands from 443 nm to 765 nm is within 2%, so the data of fine snow in each band is relatively stable (Fig. 9 and Table 6).5) The results obtained in this paper are compared with the calibration results of the desert scene and the ocean scene. The comparison results show that the calibration coefficient of the Greenland snow and ice scene deviates from the average value of the calibration coefficients of the ocean scene and the desert scene within 5%, and the standard deviation of the Greenland polar scene is within 2% (Table 7 and Table 8).ConclusionsInspired by the idea of on-orbit alternative calibration, we propose an on-orbit radiometric calibration method based on the glacier scenes in the North and South Poles. We choose Greenland for research and analysis and conduct radiometric calibration of the remote sensor DPC with a large field of view. The measurement results of the DPC are compared with the calibration results. The comparison results show that the measured value and the calibrated value in each band of DPC are in good agreement. The standard deviation of the ratio of the measured value to the calibrated value is within 3%, and the root-mean-square error is lower than 2%, which proves that DPC has a good performance in snow and ice scenes. Moreover, through the error analysis of the atmosphere and the surface, it is shown that the BRDF on the surface has the greatest influence, and the final synthetic uncertainty in the visible light band is 2%. Finally, the comparison of the calibration results of this paper with the calibration results of the desert scene and the ocean scene also proves the stability of the calibration results of the Greenland snow and ice scene and the validity and reliability of the calibration method. The method described in this paper can provide long-term monitoring and calibration of the detection data while the payload is on orbit and contribute to the quality improvement of products for operational application.
ObjectiveIn a satellite-based spectroscopic instrument, the telescope system forms the ground-based image on the slit, which is divided by a dispersive element and finally imaged on a surface detector, with the spectral information represented in one dimension and the spatial information in the other. The spectral and spatial information together is used to quantify the changes in the composition of the atmosphere. In the spectrometer system, the telescope system forms the image of the detection section at the slit, which is spectroscopically separated by the dispersive elements and finally re-imaged by the imaging system on the focal plane array (FPA). The intensity pattern in the spectral direction produced is called the instrumental spectral response function (ISRF). However, changes in the atmosphere and below (clouds, aerosol layer, and ground height) can cause changes in ground albedo or a large number of measured gas emission points. Such changes may lead to inhomogeneous illumination at the slit, which will cause the ISRF distortion and then the detection data deviation. As a result, the detection accuracy of content in atmospheric composition is affected. With the increasing requirements for atmospheric exploration and monitoring, the spectral accuracy of high-resolution spectrometers for Earth observation has increased significantly, but detection data deviation is more obvious when the spectral resolution of the instrument is higher. The concept of slit homogenizer is proposed during the Sentinel-5/UVNS imaging spectrometer development, and it can reduce the date error brought by the spectral signal distortion in the heterogeneous calibration scene.MethodsThe main work of this study is to analyze and study the principle of slit homogenizers and the systematic factors and external causes influencing ISRF. In addition, a geometric model and near-field diffraction principle are combined to establish the model structure from the telescope system to the slit homogenizer and from the slit homogenizer to the detector image plane. The equivalent simulation of parallel light is proposed to establish a more concise optical model, which reduces unnecessary calculations while retaining accuracy. Firstly, the rationality of the established model is briefly demonstrated. Based on the optical model, this paper analyzes the optical properties of the slit homogenizer. Through mathematical software and optical software simulation and mathematical analysis, the paper made concrete representations of the homogenizing effect of the slit homogenizer and the influence of the parameters of the slit homogenizer in a homogeneous incoherent scene and makes clearer the working principle and influencing factors of slit homogenizers. Then, the effect of the slit homogenizer is comprehensively evaluated from the entrance pupil scene: Analysis is made on the location of the strong emission point of trace gas and the influence of the coverage area on the ability of the slit homogenizer to maintain ISRF stability. The homogenization effect of the slit homogenizer is studied in different scenes under 25% illumination. The influence of different scenes on the spectrometer system ISRF is quantified. Finally, a method is proposed to improve detection accuracy.Results and DiscussionsThe rationality of the optical model of the slit homogenizer and the ability of the slit homogenizer to calibrate the contrast of different scene cases are demonstrated from the simulation and experimental points of view (Figs. 8 and 11). In the mathematical model, the factors influencing ISRF can be summarized as the spectrograph pupil intensity distribution and the spectrometer system. On the one hand, the object-image relationship of different systems influences the point spread function (PSF), which also has a corresponding effect on the final result of ISRF (Table 1). On the other hand, the spectrograph pupil intensity distribution influences slit illumination, and the homogenization effect of the slit homogenizer based on the established optical model greatly depends on the entrance pupil scene. The difference in cloud and rain positions, the difference in the emission point position, and the size of the coverage area in the entrance pupil scene will affect the ISRF stability (Fig. 13), thus affecting the ability of the slit homogenizer to improve data detection accuracy (Table 2). To improve the ability of the slit homogenizer to calibrate the contrast of the different scene cases, this paper proposes a solution of adjusting the tilt angle of the extension mirror below the slit homogenizer (Fig. 14).ConclusionsAs the new generation of spectroscopic instruments have higher requirements in terms of spatial resolution and radiation accuracy, slit homogenizers are employed to reduce the errors of measurement data from the imaging spectrometers for Earth observation. In this paper, the principle of the slit homogenizer is elaborated using the principle of near-field diffraction. In addition, a simple and reasonable optical model is established, and a more concise and calculable mathematical expression is given. The systematic factors and external causes influencing ISRF are discussed. The ability of the slit homogenizer to keep ISRF stability is found to be limited in the investigation with different positions of emission points and changes in the size of the coverage area, and the error of ISRF may affect data inversion accuracy. Finally, this paper proposes a solution of adjusting the tilt angle of the extension mirror below the slit homogenizer to make up for the deficiency of the slit homogenizer in reducing the influence of extreme scene cases.
ObjectiveMie scattering lidar is a remote sensing instrument with a high spatial and temporal resolution, and it has received extensive attention in research since it has successfully been applied in the fields such as atmospheric aerosol observation, cloud and fog characteristic analysis, and pollution emission monitoring. However, most of these ground-based lidars belong to the monostatic structure with the same transmitting and receiving sites. While they are been utilized to detect tropospheric or boundary layer, the transmitting and receiving coaxial systems (limited by the reflective telescope structure) or the transmitting and receiving systems with different axes (also known as off-axis) are almost affected by the near-field blind area and overlap factor, which results in the loss of near-field signals of the lidar or the reduction of accuracy. Therefore, the data of near-field point-type probing instruments (such as horizontal visibility meter, PM2.5 meter, and particle spectrometer) are usually required for data correction, compensation, or verification in these applications of lidar. However, the near-field atmospheric characteristics are usually essential data in meteorological, environmental, and other fields, which greatly limits the engineering and application process of the lidar. Therefore, overlap factor correction of lidar near-field signals and blind area have always restricted the practical process of lidar.MethodsBased on the assumption of horizontal atmosphere uniformity, a multi-angle scanning near-field signal adaptive correction method for lidar is proposed using the vertical scanning function of the developed two-dimensional scanning lidar system. Firstly, according to the overlap factor model of an off-axis lidar system, the influence of laser beam divergence angle, telescope field angle, optical axis distance, and optical axis angle on the overlap factor is analyzed. Secondly, using the Fernald aerosol retrieval algorithm and taking the advantage of lidar vertical scanning, a multi-elevation angle correction scheme dependent on signal-to-noise (SNR) threshold is proposed to achieve adaptive scanning control of different atmospheric states. Combined with the ground extinction coefficient retrieved by the Collis method and the multi-angle scanning remote sensing data, the aerosol extinction coefficient without a blind area profile is retrieved, and the effectiveness of the correction scheme under different weather conditions is compared.Results and DiscussionsBased on the stratification assumption of a uniform atmosphere, the multi-elevation angle scanning control and correction steps (Figs. 5 and 6) are designed to realize the adaptive scanning control for different atmospheric states. Using multi-angle scanning remote sensing data and taking the result of Collis retrieval by horizontal detection as the ground extinction coefficient, the blind area profile of the atmospheric aerosol extinction coefficient is obtained [Fig. 7 (c) and Fig. 8 (c)]. When the horizontal visibility is better than 18 km and the SNR threshold is 20, the average relative deviation of the overlap factor correction curve and the correction curve of the horizontal detection method is about 20% [Fig. 7 (d) and Fig. 8 (d)], and the average relative error of the overlap factor curve is 4.2% (Fig. 9). Finally, a group of data with 24-h observation is shown to verify the scanning correction method (Fig. 10), and the retrieval without blind area of atmospheric aerosol can be realized.ConclusionsIn order to correct the near-field aerosol extinction profile of ground-based Mie scattering lidar, a vertical scanning correction method and multi-angle retrieval algorithm are proposed for near-field signals of Mie scattering lidar, and then the adaptive control of the atmospheric state is probed based on the assumption of horizontal atmosphere uniformity. Owing to the scattering lidar equation, a model of the overlap factor and blind area in the near field of the lidar is constructed, and the characteristics of the overlap factor and the blind area are analyzed and simulated based on the developed two-dimensional scanning lidar. In combination with the Fernald retrieval algorithm, a multi-elevation scanning control and correction scheme dependent on SNR is presented to realize adaptive scanning control for different atmospheric conditions. The profile of atmospheric aerosol extinction coefficient without blind area under different weather conditions is obtained by merging multi-angle scanning remote sensing data and the ground extinction coefficient obtained by the Collis method of horizontal detection, and the effectiveness of this scheme is verified. The data analysis results show that the adaptive correction of the lidar overlap factor can be achieved through seven elevations of about 15-min observation with the SNR ratio of 20 as the threshold when the horizontal visibility is better than 18 km. The mean relative deviation of the obtained calibration curve from horizontal correction is about 20%, and the mean relative error of the correction results of the overlap factor curves is 4.2%, which can realize the retrieval of atmospheric aerosol without blind area.
ObjectiveWith the deepening research on space exploration, the photoelectric reconnaissance technology of various space targets has made great progress. Although this technology has been gradually improved, the problem of high-precision reconnaissance for long-range space targets has not been well solved. At present, the mainstream space photoelectric detection system is still based on the traditional optical system, which is limited by its diffraction limit, effective aperture, and other factors. This space photoelectric reconnaissance technology based on the traditional optical imaging theory is usually unable to perform in the field of remote accurate detection and imaging. Laser reflective tomography imaging (LRTI), as a new remote and high-precision space target detection method, has more advantages in high-precision imaging of remote targets. 1) LRTI is easy to implement in principle and easy to construct system structure. 2) The imaging resolution of LRTI is mainly related to the pulse width of the emitted light, the performance of the detector, and the signal-to-noise ratio, but is relatively unrelated to the detection distance and receiving aperture. 3) LRTI adopts the method of direct detection. It mainly receives the energy information from the laser echo signal reflected by the target, which is relatively less interfered with by atmospheric turbulence and other factors. Thus, LRTI has better applicability and practicability, and better application prospect in remote detection. Additionally, the imaging optimization method as the core of LRTI becomes the focus of many researchers. At present, the optimization schemes for LRTI quality usually start from the reconstruction algorithm, rotation center registration, subsequent image processing, and so on, but cannot eliminate the influence of image artifacts caused by noise and waveform distortion caused by turbulence. The noise and distortion doped in the laser echo signal greatly reduce the image quality optimization effect of the above schemes, and result in more complicated algorithm processing. Therefore, it is of great significance to develop a LRTI optimization method that can start from the echo signals.MethodsWe study the related problems of LRTI quality optimization, apply the echo decomposition method to the LRTI optimization method, and propose a LRTI quality optimization method based on echo decomposition. This method aims to suppress the influence of waveform distortion and noise by adjusting and optimizing the waveform of laser echo signals. The proposed method employs layer by layer stripping method to decompose the laser echo signal into several waveform components and filter the waveform components containing target information through a preset noise threshold. After obtaining the wave components that meet the conditions, these wave components are combined to obtain a more real laser echo signal, and then the target image is reconstructed through the reconstruction algorithm.Results and DiscussionsWe build an experimental platform for LRTI and collect the projection data of the cube at a distance of 200 m (Fig. 6). The method put forward in our study is adopted to optimize the laser echo signal, and then the target image is reconstructed through the filtered back projection (FBP) algorithm (Fig. 9). The results show that when the same set of projection data is utilized, the peak signal to noise ratio (PSNR) before and after optimization by the proposed method is 16.5 and 17.8 respectively, with improved quality of the reconstructed image. At the same time, in terms of subjective visual perception, the artifact and noise of the optimized image are significantly less than those of the original image. This shows that the optimization method of LRTI based on waveform decomposition can effectively improve the quality of the reconstructed image, and better eliminate the influence of most ring artifacts and noise in the reconstructed image. This conclusion is still applicable under different sampling angle intervals (Fig. 10).ConclusionsWe propose a method of LRTI based on laser echo waveform decomposition. By applying the waveform decomposition processing method to the LRTI technology, this method realizes the clutter elimination and waveform correction in the laser echo signal. In addition, a LRTI verification experiment with a detection distance of about 200 m is carried out to verify the application effect of the laser echo waveform decomposition method in LRTI. The experimental results indicate that in the LRTI technology applied in more complex environments, the introduction of the waveform decomposition method can better eliminate the influence of ring artifacts and most of the noise caused by clutter, and has sound application effects at different sampling angle intervals. This will help to improve the quality of the reconstructed images of LRTI technology.
ObjectiveThe FY-3D medium resolution spectral imager (MERSI-II) has been in orbit for more than five years. Quantitative application inversion shows that the radiometric response of some channels has deteriorated significantly, seriously affecting the accuracy of satellite quantitative remote sensing products. Therefore, it is necessary to evaluate the radiometric response of the MERSI-II and update the operation calibration according to the evaluation results. Compared with traditional targets such as deserts and glaciers, deep convective cloud (DCC) features a higher signal-to-noise ratio, isotropic reflection characteristics close to Lambertian, and minimum water vapor absorption. In-orbit calibration methods based on DCC target are widely employed to monitor the radiation performance of satellite sensors. However, the uncertainty factors in the DCC calibration method will affect the accuracy and stability, such as DCC bidirectional reflectance distribution function (BRDF) correction model, reflectivity probability density function (PDF) eigenvalues, and seasonal fluctuations. In this study, the basic DCC calibration method is optimized. Firstly, the BRDF correction effects of the Hu model and CERES thick ice cloud model are compared, as well as the stability of PDF mode and the mean of DCC reflectivity. Secondly, a deseasonal method based on reflectivity fitting residual and the moving average is proposed as the BRDF correction model of DDC is invalid in the SWIR band. Finally, the radiation performance of FY-3D/MERSI-II reflected solar bands is quantitatively evaluated by the optimization method. The evaluation results will be adopted as an important basis for the service calibration update of MERSI-II reflected solar bands.MethodsWe utilize DCC targets to evaluate the trend of radiometric response changes in most of the MERSI-II reflected solar bands. Firstly, the DCC target pixels are identified according to the infrared 10.8 μm channel brightness temperature threshold, observation geometric conditions (latitude, solar zenith angle, observation zenith angle), and spatial homogeneity conditions. Secondly, the solar zenith angle and earth-sun distance corrections are performed on the identified reflectivity of each DCC pixel to obtain the apparent reflectivity of the DCC. Then, two DCC BRDF models are leveraged to correct the anisotropy of apparent reflectance and compare the correction effects. Thirdly, the monthly DCC reflectivity PDF is constructed. Finally, the radiometric response of the MERSI-II sensor is evaluated by tracking the monthly DCC reflectivity PDF mean or mode sequence. In this section, we investigate the seasonal characteristics of DCC and propose a deseasonal method to reduce the fluctuations of the reflectivity PDF mean or modal sequence.Results and DiscussionsFor the VIS/NIR bands, the correction effect of the CERES thick ice cloud model is better than the Hu model (Fig. 2), the RSD of the reflectivity is reduced by 15%-40%, and the fluctuations are reduced by about 10%-30% (Fig. 3). However, for the SWIR band, the two BRDF models have no obvious correction effect. For the VIS/NIR band, the monthly DCC reflectivity PDF mode is more stable than the mean, while the mean is more stable in the SWIR band (Table 2). The DDC distribution area migrates from north to south seasonally, and the same month in each year has high similarity, while the distribution of different months in each year is different (Fig. 4). The annual variation range of monthly DCC reflectance in VIS/NIR and SWIR bands is about 1.5% and 6.4% respectively, and SWIR band has higher seasonal sensitivity (Fig. 5). The proposed deseasonal method has yielded significant results in the SWIR band (Fig. 7). The reflectance RSD of 1.38 μm, 1.64 μm, and 2.13 μm channels decreases by about 22.4%, 22.0%, and 23.9% respectively, and the fluctuations decrease by about 52.9%, 51.2%, and 54.5% respectively, which compensates for the inefficiency of the BRDF model in the SWIR band (Table 3). The optimized DCC calibration method is employed to quantitatively evaluate the radiation degradation of the MERSI-II reflected solar bands from 2018 to 2022 (Fig. 8). The annual average degradation rate of 0.65 μm channel is only 0.02826% and the 0.47 μm blue channel is greater than 1.3%. The annual degradation rate of the three water vapor absorption channels in the NIR band is between 0.5% and 1%. This reveals a law that the degradation rate increases with the wavelength, and the fluctuation index is less than 3%, proving the superiority of the DCC calibration method in the water vapor absorption channel. The SWIR band has the most significant degradation, of which 1.38 μm has the largest degradation and the strongest fluctuation. The annual decay rates of 1.64 μm and 2.13 μm channels are 3.114 % and 2.134 %, respectively (Table 5).ConclusionsWe adopt the DCC target to evaluate the radiometric response trend of the MERSI-II reflected solar bands, and optimize the basic DCC calibration method. Firstly, the DCC BRDF correction model and the selection of monthly PDF eigenvalues (mean/mode) are optimized. Secondly, the seasonal characteristics of DCC are investigated, and a deseasonal method based on reflectivity fitting residuals and moving averages is proposed to compensate for the ineffectiveness of Hu and CERES thick ice cloud BRDF models in SWIR bands. This method significantly mitigates the RSD and fluctuations of monthly DCC reflectance in the SWIR band from 2018 to 2022, which are reduced by about 23% and 53%, respectively. This method is not only applicable to MERSI-II but also provides references for the radiometric calibration of other satellite optical remote sensors. Finally, the optimized DCC calibration method is utilized to quantitatively evaluate the attenuation of the radiometric response of the FY-3D/MERSI-II reflected solar bands. The results show that the blue channel and the four SWIR channels have significant degradation.
ObjectiveVector radiation transport in scattering media is a research hotspot. The exact analytical solution to the vector radiative transfer equation cannot be obtained without the simplified treatment, and it needs to be calculated by numerical calculation methods. The polarized Monte Carlo program simulates the transmission of mass photons. As it does not lead to computational errors due to finite dispersion, the program is usually employed as a standard to verify the computational accuracy of other methods. At present, this method can obtain the outgoing polarization state of each light wave after the solution is obtained, but it is difficult to know the photon transmission situation. This limits the analysis of the polarization state retention of scattering light. However, photons with good retention characteristics of the polarization state usually have a small information loss and a long transmission distance. The study and analysis of these photons can be potentially applied to extract good transmission signals.MethodsThis paper proposes a method to count the photon polarization states during forward transmission into scattering media on the basis of the polarization meridian Monte Carlo program. The original algorithm and improved algorithm are shown in Fig. 1. The white part is required for calculating both the original algorithm and the improved algorithm, and the blue part is the additional flow for calculating the improved algorithm. One hundred thousand parallelly polarized photons or right-handed circularly polarized photons are sent into a slab represented by one particular particle distribution for each environment, and photons are transmitted at a given distance. Then, the aggregated polarization is calculated from the photons that arrive in a given area, and photons on the front face of the slab are considered the transmitted photons. This process continues for all the launched photons, and the result is calculated. For the original algorithm, a photon completes forward transmission when it passes through a specific forward distance. The improved algorithm adds a link to output the polarization state of each photon. Moreover, the improved algorithm can count the total number of received photons and the number of photons similar to the polarization state of the initial photon.Results and DiscussionsThis paper uses an example to compare the original algorithm and the improved algorithm. The following simulations are performed in the polystyrene suspension with a mass concentration of 2.08 μg/μm3. The wavelength of incident light is 532 nm, and polystyrene's refractive index is 1.597. The particle diameter of the polystyrene suspension is 1 μm in simulation, and the transmission distance is 10 cm. One hundred thousand parallelly polarized photons or right-handed circularly polarized photons are launched for simulations of the original algorithm and the improved algorithm separately. There are 66358 received photons after the transmission of parallelly polarized photons and 66367 after the transmission of right-handed circularly polarized photons. After that, the first 100 received photons are selected as samples (Figs. 3 and 4). Calculations show that for the sample data of parallelly polarized photons, the NRoPS is 0.13, and for the sample data of right-handed circularly polarized photons, the NRoPS is 0.53. The calculation results are both similar to the overall situation. The simulated calculation of polarized light transmission in the polystyrene suspension demonstrates that the optimized method can not only reflect the change in the photon polarization state but also count the percentage of photons with good retention characteristics of the polarization state. The comparison between the original results and the optimization results shows that the results of the optimized algorithm are less than the polarization degree value. This is because the optimized algorithm not only avoids the error introduced in the calculation of the intensity difference in the orthogonal component but also excludes photons that are not similar to the polarization state of the initial photon.ConclusionsCompared with the polarized Monte Carlo program, the improved method can not only reflect the change in the photon polarization state but also count the percentage of photons with good retention characteristics of the polarization state. It reflects the change in the polarization state of the transmitted photons in multiple dimensions. This study can provide technical support for research on the extraction of excellent transmission signals.
Results and discussions A new type of exit prism with simpler processing was designed in this paper. The prism was developed by bonding a neutral density filter with a prism cut into a specific shape. The new prism designed could effectively reduce the influence of stray light on the measurement of large-angle backscattering and small-angle forward scattering. In Fig. 3, the measurement accuracy of the new prism is verified by comparing the measurement results of the old and new prisms. Fig. 5 compares the measured results of 3-μm diameter polystyrene standard particles with the theoretically calculated values and reveals that they are in good agreement with each other, which proves the reliability of the system in measuring the polarized volume scattering function. Finally, the system was tested in the natural water body of the Qiandao Lake, and the 3×3 scattering Mueller matrix of particles in water within the range of 10°-170° was obtained for the first time in China, as shown in Fig. 7 and Fig. 8. A comparison with the spectral shapes measured by HS6 indicates that the particle types at different depths at the same station are different, and the surface particle types at different stations are also different. The results show that polarized scattering characteristics can provide more abundant information of particle characteristics.ObjectiveThe polarized volume scattering function of particles in water is the most basic and complete parameter describing their scattering characteristics as it reflects the types, particle size spectra, shapes, and refractive indexes of the molecules and large particles in water. Therefore, the polarized volume scattering function of particles in water is of great research significance. This function is the most critical inherent optical parameter in the study of active and passive ocean optical remote sensing. Nevertheless, it is also the inherent parameter most difficult to measure. To solve the problem that no instrument is currently available in China for measuring the polarized volume scattering function of particles in water in a large angle range, this paper develops a measurement system for the polarized volume scattering characteristics of particles in water on the basis of a periscope-like optical path structure and the detection method of the rotating polarization detector. It further verifies the applicability of an output prism obtained by the half attenuation bonding method to the measurement of the polarized volume scattering characteristics in a large angle range and achieves the measurement of the 3×3 scattering Mueller matrix of particles in water in the range of 10°-170°.MethodsIn this study, pure water was used for baseline measurements, and the scattering characteristics of particles were determined by removing the contribution of the pure water signal to the total signal. According to the characteristics of standard particles in the Mie scattering theory, a standard particle (diameter of 0.2 μm) with relatively gentle Mie scattering results was used for amplitude calibration and calibration coefficient determination, and another one (diameter of 2 μm) with salient angle characteristics was used for angle calibration. Polarization was performed with a Stokes meter. The scattered light received by the detector suggests that the scattering optical paths detected at all angles are not the same, and the attenuation transmission distances in water are also different, which necessitates the normalization of the scattering optical path and the correction of the attenuation optical path.ConclusionsIn this study, a measurement system based on a periscope-like optical path structure and the rotating polarization detector was designed to measure the polarized volume scattering function of particles in water, and the measurement of the 3×3 polarized volume scattering function in the range of 10°-170° was thereby achieved. Moreover, a new type of exit prism with simpler processing was designed, and the measurement accuracy of the new prism was verified. To obtain accurate measurement results, this paper proposes strict methods for data processing and calibration procedures of the instrument, including baseline measurement, angle and amplitude calibration, polarization calibration, and data correction. An accurate theoretically calculated value of the polarized volume scattering function was obtained by applying the Mie scattering theory and compared with the measurement results of the experimental instrument. The measurement results are in good agreement with the theoretically calculated value. The accuracy of the measurement results of the experimental prototype is thus ensured. The system was further tested in the Qiandao Lake, and a 3×3 scattering Muller matrix of particles in water was obtained in the range of 10°-170° in this lake.