


Please enter the answer below before you can view the full text.
3-3=

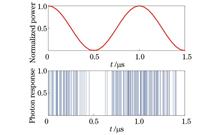
ObjectivesDue to the high sensitivity of the single-photon detector, an ultra-narrow band filter is needed to ensure the normal operation of the detector under the influence of strong background light noise in the daytime. Therefore, the anti-background noise ability of photon heterodyne detection is crucial. In addition, the dark count and post-pulse effect of the single-photon detector will lead to a false count and thus reduce the signal-to-noise ratio (SNR). Therefore, new methods are required to improve the SNR of photon heterodyne detection. In the earlier research on photon heterodyne detection, most scholars focused on signal processing for denoising. They proposed new signal processing methods to denoise echo signals and rarely made an effort to improve the detection system or change the photon counting mode. As current signal processing has limited ability to improve the SNR of photon heterodyne detection, this study applies the coincidence counting mode to photon heterodyne detection. This mode relies on multi-channel detection and filters out random optical noise at the photon counting terminal to improve the SNR.MethodsIn this study, a photon heterodyne velocity measurement system with two-channel coincidence counting is constructed by simulation. After frequency beating, light waves of heterodyne signals are evenly divided into two parts and sent into two single-photon detection channels separately. A two-channel coincidence counting mode is adopted at the single-photon detection end, and different coincidence gate widths are set for the system according to different situations. The two-channel coincidence counting system will automatically select the channel 1 as the main channel and the other channel as the slave channel and create a time window (the size of which can be set) centered on the main channel. When both channels have photon counting in this window, an effective coincidence will be generated, and the coincidence counting results within a certain collection time will be given at last. When the signal photon is detected in both channels within the coincidence time, it is judged to be an effective signal. In this way, the arrival time series of the photon can be obtained. Compared with the case of single-channel photon counting, the anti-noise capability of the system is greatly improved, and effective echo signals can be extracted under strong background noise.The traditional filtering method of photon heterodyne detection is to preliminarily process the photon response sequence to produce the cumulative photon histogram, perform the first-order filtering of the cumulative photon histogram curve, and process the filtering results as FFT to obtain the spectrum diagram. In this study, the first-order filtering algorithm adopts the moving average filtering method and compares three methods, namely, single-channel free-running mode, post-photon cumulative moving average filtering, and two-channel coincidence counting mode. The simulation results show that the power spectrum SNR of the intermediate frequency (IF) signal in the two-channel coincidence counting mode is significantly higher than that in the single-channel free-running mode and the first-order filtering.Furthermore, the variation laws of the power spectrum SNR of IF signals with the increase in the number of signal photons are studied under two counting modes. In addition, four factors such as local-oscillator light intensity, background noise, IF, and detection duration that affect the performance of photon heterodyne detection are investigated.Results and DiscussionsAccording to the simulation, the SNR of both the single-channel free-running mode and dual-channel coincidence counting mode gradually increases with the increase in the number of photons. However, as the number continues to grow, the SNR rises slowly and gradually reaches saturation (Fig. 7). When the ratio of local light intensity to signal light intensity is less than 1, the SNR changes most significantly with the increase in the number of signal photons, and when the number grows to 5 Mcps (Mcps represents the counts multiplied by 106 per second), the saturation state cannot be reached. When the ratio is equal to 1, the SNR is higher than that when the ratio is less than 1. This is because when the number of photons in the local oscillator is equal to the number of photons in the signal, the total number of photons is higher than the case when the ratio is less than 1, and the proportion of noise photons decreases. Hence, the SNR increases. However, a greater ratio of local light intensity to signal light intensity does not lead to better results. As can be seen from the figure, if the ratio is equal to 5, the SNR of the IF signal is higher than that of 1, but if the ratio is less than 3, it can be inferred that as the ratio of local light intensity to signal light intensity gradually increases, the system's SNR increases before it declines. The peak is reached near the ratio of 3 (Fig. 8). Stronger background noise means a lower SNR. In addition, the photon number of the saturated signal is different under different background noises. Stronger background noise is accompanied by a larger photon number of the saturated signal. When the background noise is 0.5 kcps (kcps represents the counts multiplied by 103 per second), the number of signal photons gradually becomes saturated at about 3 Mcps, but when the background noise is 2 kcps, the number of signal photons is close to saturation at 5 Mcps. Under different background noises, the saturation SNR achieved is also inconsistent: stronger background noise indicates a lower saturation SNR (Fig. 9). IF has a steeper change in the early fitting curve of the influence of SNR and reaches a peak when the number of signal photons is 3 MHz. As the number continues to increase, the SNR of IF slightly declines and gradually becomes stable. Although the span of IF is from 0.5 to 7 MHz, the four curves are concentrated, and it is difficult to separate them or even have crossover parts in some line segments. Therefore, the IF signal frequency, that is, the speed of the moving target, has little influence on the SNR of the system (Fig. 10). As the detection duration becomes longer, the SNR increases significantly. When the detection duration increases from 0.05 to 0.10 ms, the saturation SNR increases by about 3 dB, while when it increases from 0.15 to 0.20 ms, the saturation SNR only increases by about 1 dB. The time parameters such as the dead time and coincidence window of single-photon detection are generally of the order of ns. Thus, although the detection duration only increases by 0.05 ms each time, it has already exceeded four orders of magnitude. Therefore, longer detection duration means more photons detected and more significant cumulative effects of the photon-density distribution law, and a greater contribution of IF signal distribution to the total number of photons indicates a higher SNR (Fig. 11).ConclusionThe results show that the proposed method has significant advantages over single-channel detection. In coincidence counting, part of the background noise and dark count noise can be filtered out to improve the SNR. This study provides a new idea for the application of coincidence counting and also renders guidance for the construction of a photon heterodyne detection system with two-channel coincidence counting in subsequent experiments.
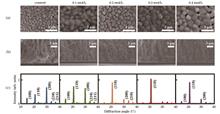
ObjectivePhotodetectors can convert incident light into electric signals and are widely used in many fields such as image sensing, optical communication, environmental monitoring, and biological detection. In recent years, all-inorganic metal halide perovskite CsPbIBr2 has been concerned in photoelectric detection due to its high light absorption coefficient, high charge carrier mobility, and low defect density. On the one hand, CsPbIBr2 film is susceptible to ambient humidity, so it is not usually prepared under an atmospheric environment but in glove boxes by methods such as spin coating. On the other hand, on account of uncontrolled nucleation during crystallization, CsPbIBr2 film has poor morphology and crystallinity, which results in weak photoelectric characteristics and instability of its photodetector. In order to overcome these problems, the morphology, crystallinity, and water/oxygen resistance of CsPbIBr2 thick film can be improved by additives and interface layer strategies. In this study, we employ an interfacial seed layer modification strategy under an atmospheric environment with relative humidity (RH) below 90% to prepare one high-quality CsPbIBr2 thick film with high crystallinity, excellent interfacial contact, and stable structure. We hope that our findings can help fabricate low-cost, high-performance, and long-lasting photodiode-type CsPbIBr2 photodetectors under an atmospheric environment.MethodsCsPbIBr2 thick films with controllable thicknesses in the range of 0.5-100 μm are prepared under an atmospheric environment with RH below 90% by pneumatic spraying. Prior to spraying, the interfacial seed layers are formed on the substrates by spin-coating followed by annealing. During spin-coating, the density distribution of the interfacial seed layers is realized by controlling the concentration of precursor solution. In this strategy, the interfacial seed layers act as the nucleating points for crystal growth, which improve the crystallization of the thick films in preparation processing. The morphology and the phase structure of the thick films are analyzed by scanning electron microscopy (SEM) and X-ray diffraction. Compared with the thick film without an interfacial seed layer, these films with interfacial seed layers have high crystallinity, excellent interfacial contact, and stable structure. In order to assess the effect of interfacial seed layers on the optical properties of the thick films, these thick films are investigated by absorption, photoluminescence (PL), and time-resolved PL spectra. In order to verify the feasibility of the thick films for photodetection, their photodiode-type photodetectors of Au/ITO/CsPbIBr2/Au are fabricated and measured. The I-V and response time curves of the photodetectors are examined under laser excitation of 405 nm. In order to characterize the long-term stability, tracing measurements on the on-off ratio of the devices are made, and the naked-eye photographs of the corresponding thick films are recorded.Results and DiscussionsCompared with the control film with small-size crystal grains and a large number of holes on the surface, the modified films by introducing interfacial seed layers exhibit large-size crystal grains and dense morphology [Fig. 1(a)]. From the cross-sectional SEM images, the improved interfacial contacts between the modified films and the substrates lead to columnar growth features [Fig. 1(b)]. The modified films show a preferred orientation on the (110) diffraction plane, especially for 0.3 mol/L, which is consistent with the SEM results [Fig. 1(c)]. Once seed layers are inserted between the thick films and the substrates, the absorption coefficients and PL peak intensities increase significantly in the whole visible range, and the fluorescence lifetime increases from 0.95 ns to 4.49 ns (Fig. 2). The dark current from the control device to the modified devices decreases from 2.05×10⁻⁷ to 5.70×10⁻¹⁰ A, while the on-off ratio significantly increases from 490 to 1.8×10⁴ [Fig. 3(a)]. By fitting the I-V curves under light illumination, it is proved that the modified device of 0.3 mol/L has a stronger light response (n=0.87) and larger response range (RLD=80 dB) than the control device (n=0.60 and RLD=34 dB) [Fig. 3(b)-(e)]. The rising and falling time (ton and toff) from the control device to the modified devices decreases from 38 μs to 9 μs and from 110 μs to 13 μs, respectively [Fig. 3(f)]. After lasting 60 days, the modified device of 0.3 mol/L still retains a high on-off ratio of 1.5×10⁴, which is 83% of the initial on-off ratio, and the naked-eye photographs of the thick films do not change significantly (Fig. 4).ConclusionsIn this study, under an atmospheric environment with RH below 90%, high-quality CsPbIBr2 thick films are prepared by pneumatic spraying via an interfacial seed layer modification strategy. In this strategy, the interfacial seed layer acts as the nucleating points for crystal growth, which results in the improvement of the crystallinity, interfacial contact, and structural stability of the CsPbIBr2 thick films. Furthermore, the introduction of interfacial seed layers has no significant effect on the optical band gaps of CsPbIBr2 thick films, ranging from 2.10 eV to 2.12 eV. It is worth noting that the absorption coefficient of visible light and the PL intensity are enhanced significantly, and meanwhile the fluorescence lifetime is increased (from 0.95 ns to 4.49 ns). The photodiode-type CsPbIBr2 photodetector (p-n CsPbIBr2-ITO) shows a low dark current (5.70×10⁻¹⁰ A) and possesses high-performance photodetection parameters, namely high on-off ratio (1.8×10⁴) and microsecond-level response times (9 μs and 13 μs). Moreover, the unpackaged CsPbIBr2 photodetector is strongly resistant to water and oxygen under an atmospheric environment with RH below 90%, which is 83% of the initial on-off ratio after lasting 60 days. These results can provide an effective way to prepare low-cost, high-performance, long-lasting, and stable photodiode-type CsPbIBr2 photodetectors under an atmospheric environment.
ObjectiveIn fields such as laser processing, surface ablation, and medical testing, flat-topped beams with uniform energy distribution are more valuable than Gaussian beams directly output by lasers. Diffractive optical elements (DOEs) are widely used as beam-shaping devices with the advantages of simple structure, high design degree of freedom, accessible mass production, and wide range of material selection. Differing from traditional refractive devices, DOEs use surface relief microstructures to adjust the amplitude or phase of the wavefront, thereby tuning the distribution of the output beam. DOEs have high requirements for the wavelength, waist width, eccentricity, beam quality, and other conditions of the input beam. When these requirements are not met, the output light spot will deviate from the design results, which affects actual use. Unlike other tolerance constraints, the effect of beam quality on DOEs cannot be directly calculated from the diffraction propagation of coherent light fields, and the effect of input beam coherence must be considered. However, few studies have discussed the influence of beam quality on DOEs. In this work, we study the output results of Gaussian shell-model (GSM) beams with different beam qualities passing through the DOE and propose a new method for designing DOEs with GSM beam shaping.MethodsIn this work, an improved G-S algorithm, namely, the symmetric iterative Fourier transform algorithm (SIFTA), is used to design flat-topped DOEs. By introducing a signal window, this algorithm can obtain a highly uniform output light spot while ensuring output efficiency. With the DOE designed by SIFTA as a standard, the influence of beam quality is studied. The multimode laser can be approximately described by a GSM beam. The transmission of the GSM beam through a DOE is typically described by using a cross-spectral density (CSD) function, which involves a 4-order Fourier transform and results in significant computational complexity. In order to simplify the calculation, the mode decomposition of CSD is used to study the output light spot of the DOE under GSM beams. The coherent-mode representation uses coherent Hermite-Gaussian modes to express the CSD and requires only a limited number of modes to obtain accurate solutions. Similarly, the random-mode representation uses random modes that conform to statistical relationships to represent the CSD and reduce computational complexity. We also use variable substitution to simplify CSD transmission and find that the DOE output can be directly separated into a convolution of coherent and noncoherent parts.Results and DiscussionsBy using the mode decomposition method, the output light spot distributions of GSM beams with different beam qualities passing through the DOE are calculated (Fig. 3). It can be seen that as the M2 factor increases, the size of the flat-topped area of the output light spot gradually decreases until it deteriorates to a Gaussian-type light spot, and the flat-topped shaping effect of the DOE fails. The flat-topped DOE has a high requirement for beam quality. When the M2 factor increases to 1.5, the output result already has significant deformation. The same conclusion can be obtained using the convolutional representation of the GSM beams (Fig. 4). Only when the width of the convolution kernel is much smaller than the spot size D of the DOE will the convolution result approach the designed output light spot. Therefore, for a given DOE, the applicable maximum M2 factor is related to the output spot size D and the input beam size w0, and they can be expressed as M2=1+πDw0/αλf21/2. Specifically, α is the proportional coefficient between the output spot size and the maximum convolution kernel width; λ is the wavelength; f is the focal length. In addition, the convolution property of DOE output is similar to the image blurring effect caused by the point spread function (PSF) in optical imaging systems. Therefore, methods in photolithography systems can be applied to the design of DOEs with GSM beam shaping. A modified coherent output target pattern is obtained by directly adding serifs to the original target shape, and then a DOE is designed using traditional coherent algorithms. Figure 5 shows an example of designing a DOE with GSM beam shaping using the proximity correction method. The output light spot of the designed DOE under the GSM beam can well match the target pattern. Moreover, the DOE with GSM beam shaping effectively improves the coherent noise phenomenon.ConclusionsIn this work, the SIFTA is used to design an 8-order flat-topped DOE with a square light spot. Using the methods of coherent-mode representation and random-mode representation, the output results of GSM beams with different beam qualities passing through the DOE are studied. It is found that increasing beam quality will lead to a reduction in the size of the flat-topped area of the output light spot and make the DOE ineffective. It is shown that the output light spot is a convolution of coherent and noncoherent parts, and the convolution contribution of noncoherent parts is the cause of light spot degradation. The relationship among the applicable maximum M2 factor of flat-topped DOEs, output spot size, and input beam size is given, which provides a basis for laser selection in practical application. A design method of DOEs with GSM beam shaping is presented, which is expected to achieve the application of DOEs in lasers with low beam quality.
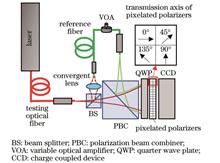
ObjectiveFiber lasers have been widely used in industry, national defense, and other fields, with the advantages of compact structure, high efficiency, and flexible energy transmission. Beam quality is one of the most important parameters of the fiber laser and directly determines the performance and propagation effects of the laser. Various beam quality parameters have been proposed so far, such as factor M2, Strehl ratio, barrel power, and diffraction limit multiples. In all these parameters, factor M2 is a relatively perfect evaluation parameter of the laser beam quality and can reflect both the near-field and far-field characteristics of the laser. With the increase in the laser power, thermal accumulation and nonlinear effects in the laser can cause dynamic changes in the beam quality. Dynamic measurement of factor M2 is beneficial to reveal the physical mechanism of mode field changes of the laser and control the real-time distribution of the laser mode field. Therefore, it has great significance to the design, manufacture, and application of lasers.MethodsIn this study, we propose a dynamic measurement method of factor M2 of a fiber laser using coaxial interferometry. The far-field complex amplitude of the laser under test is determined by the spatially phase-shifted coaxial interferograms. The intensity distributions of the laser at different places in the vicinity of the laser near-field are then obtained through angular spectrum transmission and lens transformation. Factor M2 of the laser is finally determined by fitting the beam diameters at different places. Our new method has a compact structure that avoids manufacturing and assembly errors caused by optical lenses. Compared with off-axis holographic technology, the method described in this study can obtain fast, high-precision, and complex amplitude information with high resolution and realize the fast and accurate measurement of laser beam quality factor M2 factor.Results and DiscussionsIn order to verify the feasibility of the factor M2 measurement method, the measured results of lasers from different fibers are compared with those measured by the commercial factor M2 measurement system (BEAM SQUARED). Two experimental setups are shown in Fig. 7. The fiber laser under test is collimated by an infinitely conjugated microscope objective lens and then reflected into the commercial factor M2 measurement system through two aluminized mirrors, as shown in the dashed box of Fig. 7. Through comparison, our coaxial interferometer in the solid line frame of the figure is more compact. It should be noted that to ensure the consistency of the laser under test in the two measurement systems, we only measure the beam quality of the P-light in the dashed box.Figure 8 shows the factor M2 results of the output from 630-HP fiber (Nufern), 1060-XP fiber (Nufern), and SMF-28e fiber (Corning) with two different systems shown in Fig. 7. The three fibers can transmit 1, 6, and 10 modes in a single polarization direction, respectively. For each fiber laser, we repeat the measurement three times and use their average values as the results. Figure 7 also compares the light intensity at the waist position with different methods. For 630-HP fiber, the measurement result of the proposed method is Mx_c2=1.09 and My_c2=1.03, and that of the commercial BEAM SQUARED is Mx_m2=1.04 and My_m2=1.04. The average measurement error of M2 is 0.028. For 1060-XP fiber, the measurement result of the proposed method is Mx_c2=1.16 and My_c2=1.46, and that of the commercial BEAM SQUARED is Mx_m2=1.10 and My_m2=1.58. The average measurement error of M2 is 0.065. For SMF-28e fiber, the measurement result of the proposed method is Mx_c2=1.95 and My_c2=2.53, and that of the commercial BEAM SQUARED is Mx_m2=2.06 and My_m2=2.45. The average measurement error of M2is 0.043. In the verification experiment of the beam quality, in order to avoid the system error introduced by building the measurement system repeatedly, we only move the fiber to be tested to switch the system. However, when the measurement system is switched, the attitude of the optical fiber will be slightly changed, which will change the output mode field of the laser and thus cause the measurement error of M2 of the beam to be measured. The error is more obvious when the number of modes is large, and excessive modes will lead to mode coupling, which is also the reason for the poor repeatability of multiple measurements of SMF-28e in the above experimental results.ConclusionsWe propose a new method for the dynamic measurement of beam quality factor M2 of a fiber laser by using far-field coaxial interferometry. The far-field complex amplitude of the laser under test is determined by the spatially phase-shifted coaxial interferograms. The intensity distributions of the laser at different places of free space are then obtained through angular spectrum transmission and lens transformation. factor M2 of the laser is finally determined by fitting the beam diameters at different places. In the experiment, we have measured factor M2 of the laser output from fibers with different core diameters at 633 nm. The results are consistent with those determined by the commercial beam quality instrument. In addition, it takes 0.02 s to complete the factor M2 calculation of lasers by the proposed method, which is more than two orders of magnitude faster than that of the commercial instrument. Our new method has a compact structure that avoids manufacturing and assembly errors caused by optical lenses. The method provides a technical means for the quality detection and state monitoring of few-mode fibers and their devices and is conducive to the design, manufacture, and development of fiber lasers and their fiber devices.
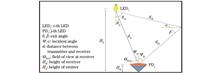
ObjectiveIn an indoor visible light communication (VLC) system, it is indispensable to optimize the uniformity of the system, ensuring the flatness of illumination and the fairness of communication. On the one hand, uniform received illuminance can provide a more comfortable lighting environment, which is also the primary purpose of indoor lighting sources. On the other hand, uniform received optical power can improve the communication quality and fairness of the VLC system. However, the layout and configuration parameters of the lighting source will directly affect the uniformity of the light signals. The existing schemes often optimize the lighting source layout based on the top of the room without considering the deployment height of the lighting source and tend to employ a sequential optimization scheme to improve the lighting source layout and power allocation. Besides, little research is conducted on simultaneous optimization. Therefore, it is extremely important to optimize the uniformity of illuminance and received power of the system in view of the uneven distribution of light signals in the indoor VLC system.MethodsGiven the above problems, a fast whale optimization algorithm (FWOA) based on a fusion improvement strategy is proposed to simultaneously optimize the indoor lighting source layout and power allocation in this study. Considering the lighting source layout and power distribution of the LED deployment height, we adopt a simultaneous optimization scheme to achieve the optimal LED position layout and uniformity of indoor light signals. At the same time, as there may be a wide range of search and long optimization time in simultaneous optimization, the whale optimization algorithm (WOA) is introduced from the perspective of swarm intelligence. The convergence speed and global optimization ability of the algorithm are further improved through the fusion improvement strategy. The specific improvement design is as follows. First, to solve the problem of insufficient convergence speed of the WOA, we employ reverse learning to optimize the initialization stage of the whale algorithm. Second, although the existing knowledge of LED position layout and power distribution scheme facilitates algorithm convergence, the primary stage of the algorithm has not been greatly improved. Therefore, the coefficient matrix is adjusted so that the optimization stage enters the local search more quickly to accelerate the convergence process of the WOA. Third, entering the local search too early will induce the algorithm to fall into the local extremum search condition. For the problem of the algorithm falling into local optimum, a global perturbation search mechanism is added to better balance the search ability of the algorithm.Results and DiscussionsAfter the simultaneous optimization of 16 LED layout models (Fig. 3), five different LED lighting source optimization schemes are selected for comparison (Table 5), and the performance indicators after optimization are listed. The results show that compared with the previous optimization schemes, the illuminance uniformity of the proposed optimization scheme has been improved by 7.39% to 109.03%, and the quality factor of received power has been improved from 5.25 to 12.23, an increase of nearly 133%. After simultaneous optimization of lighting source layout and power distribution, the factor further increases to 15.12. The simultaneous optimization scheme and the proposed FWOA have excellent optimization performance. In addition, the optimal layout (Fig. 6) and received power distribution (Fig. 7) of the system are explored when the number of LEDs is 14, 12, 9, and 6 respectively. It is found (Table 6) that in different scenarios, a better balance between system energy and performance can be achieved by selecting the appropriate number of LEDs. In addition, by introducing the FWOA, the time for simultaneous optimization is also greatly reduced, and the calculation time is shortened to less than 1 h, which verifies the superior performance of the proposed algorithm in terms of convergence speed and optimum search.ConclusionsIn the indoor VLC system considering one reflection, we propose a FWOA based on the fusion improvement strategy and realize the optimal distribution of LEDs by simultaneously optimizing the lighting source layout and power distribution model of the LED deployment height. The research results show that compared with the traditional optimization models, the uniformity of the received power, illuminance, and signal-to-noise ratio (SNR) of the optimized distribution model is better with excellent communication fairness. Besides, the distribution model of different numbers of LEDs in the room is also studied. The results show that as the number of LEDs increases, the system performance exhibits a positive convergence characteristic. By increasing the number of LEDs, the optimized lighting source layout and received power can improve system performance. However, this growth relationship converges when the number of LEDs increases to 12. Then, increasing the number of LEDs can no longer significantly improve system performance, and will in turn increase system energy consumption and optimization time. Therefore, the performance and energy efficiency of the system can be better balanced by selecting the appropriate number of LEDs. This study can provide a valuable reference for the application of VLC in indoor rooms of different sizes.
ObjectiveThe optical manipulation of particles is important in biomedicine, physics, and optics. Given the rapid development of the field of micromanipulation, there is considerable demand for improved functionality of optical tweezers. Currently, conventional optical tweezers and fiber optic optical tweezers can achieve limited particle transport without moving the probe. This limitation may have certain operational and analytical implications in the measurement of the angular frequency of cells for malaria diagnosis using optical capture techniques. Thus, there is a requirement to perform research on controlled and stable particle capture using fiber optic optical tweezers without moving the fiber and reciprocal axial transport between different capture sites. Certain researchers proposed multiple cases of reciprocal particle transport using fiber optic optical tweezers such as mode multiplexed tweezers and dual fiber optical tweezers. Most mode multiplexing tweezers use misaligned fusion to generate LP01 and LP11 modes in single-mode fibers, and these modes can realize the reciprocal motion of particles without moving the fiber. These tweezers have special requirements for shaping the fiber tip and cannot achieve reciprocal motion over long distances owing to the formation of two focal positions. Dual fiber optical tweezers are used to change the force balance of particles by adjusting the magnitude of the optical power emitted from both fiber ends so as to achieve particle capture and reciprocal motion. However, this method is a complex experimental setup, involves cumbersome operation, and has a limited particle transport distance owing to the two fiber ends. Therefore, in this study, a new fiber optic optical tweezer device is proposed that enables stable particle capture and the controlled manipulation of motion distance and velocity without moving the fiber optic probe.MethodsA new optical tweezer is proposed using the balance of solution evaporation force and optical force in which an appropriate amount of blue butyl glue is glued to each of the four corners of the slide, and then a coverslip is placed on the blue butyl glue to form the sample chamber. Here, the height of the port where the fiber optic probe is placed should be higher than the height of the port on the opposite side while the remaining two sides should be in parallel. Such an arrangement increases the contact area between the solution and air at the port where the fiber optic probe is placed, thus increasing the evaporation force of the port. Then, the configured sample suspension is injected into the sample chamber using a syringe. The liquid does not flow out of the sample chamber when the solution fills it owing to the tension between the surface molecules of the solution and sample chamber. The solution will drive the particles to the fiber side owing to the effect of evaporation force, thus providing a force opposite to the optical force. When the optical force and evaporation force of the solution reach equilibrium, a stable capture of particles can be achieved. Moreover, the output power of the fiber probe can be periodically changed by modulating the driving current of the laser. When the optical force is more than the solution evaporation force, the particles will move far away from the fiber tip, but when the optical force is less than the solution evaporation force, the particles will be pulled to the fiber tip. The distance and speed of particle movement can be controlled by adjusting the amplitude and period of the modulation signal. Finite element analysis was used to analyze the optical field distribution at the tip of the fiber and the magnitude of the force on these particles.Results and DiscussionsThe experimental and simulation results demonstrate that the proposed method can achieve stable capture of polystyrene spheres and repeatable axial reciprocal transport without moving the fiber. When the driving current of the laser increases, the peak of the particle motion curve increases as the modulation current of the laser gradually increases, moreover, the motion distance of blob increases. The slope of the particle motion curve increases as the modulation current increasing, indicating that the particle motion is faster. The motion distance of the particle is linear with the modulation current. Moreover, the laser light source with 980 nm used in the experiment can effectively reduce the photothermal effect during particle manipulation and avoid the damage caused during particle transport. As a controllable all-fiber integrated device, the method proposed in this study enhances the functionality and flexibility of the optical manipulation method, providing a potential technical support for its application in the fields of micromanipulation and biomedical research.ConclusionsIn this study, a new single-fiber optical tweezer based on current modulation is proposed to achieve stable particle capture by adjusting the magnitude of the evaporation force of the solution. Moreover, the driving current of the laser is modulated to change the output power periodically and change the force of the particle so as to achieve the controlled manipulation of particle transport distance and transport speed. In this study, a simulation model is built to analyze the force situation of the particles during the motion, and the mechanism of the periodic reciprocating motion of the particles is provided. The experimental results demonstrate that stable particle capture and reproducible axial reciprocal transport are achieved with polystyrene microspheres and yeast cells as target particles without moving the optical fiber. Moreover, the correspondence between the modulation current of the laser and the particle motion distance are analyzed, the particle motion curves under different driving currents are plotted, and the particle motion distance is demonstrated to be linearly related to its modulation current as presented in the fitting equation. As a controllable all-fiber integrated device, the proposed method extends the application possibilities of single-fiber optical tweezers.
ObjectiveIn the past three decades, Brillouin optical time domain reflectometry (BOTDR) has attracted widespread attention from researchers and has been applied to health and safety monitoring in various engineering structures. BOTDR based on short-time Fourier transform (STFT) performs signal processing on the broadband signal of the Brillouin scattering spectrum. The acquisition time of the broadband signal is shorter than that of the frequency sweep system, and therefore system response is swifter. Spatial resolution and frequency resolution are two important performance parameters of the STFT-BOTDR system. The former, spatial resolution, is proportional to optical pulse width and related to the form and length of the window function. The latter is related to the signal-to-noise ratio of the electrical signal, step length of frequency, center frequency of the Brillouin gain spectrum, and full width at half maximum. The two resolutions correlate with each other. Meanwhile, the computing time of the STFT is related to the set parameters of frequency step length and of the sliding window. As a result, improving the system frequency resolution will increase the system's computing time. How can we optimize the photoelectric design and improve the efficiency of the demodulation algorithm under the current system of typical BOTDR to obtain highly enhanced spatial resolution by using economic optical pulses of common width (instead of using narrow pulses and other costly photoelectric modules)? The solution to the question is essential to the extensive and large-scale application of BOTDR in the engineering field.MethodsWe propose a maximum-seeking method based on the BOTDR system, which realizes the rapid positioning of frequency shift and the enhancement of system spatial resolution based on fast Fourier transform (FFT) and STFT. The maximum-seeking method based on the equal division FFT process first performs FFT processing on the time-domain signal and linear fitting and then maximum-seeking processing on the spectrum within the frequency range of 100 MHz on both sides of the Brillouin center frequency. Then, by using the judgment Eq. (5), it determines whether there is temperature variation or strain information and then continuously divides the time-domain signal. Finally, it selects the corresponding length of the time-domain signal to determine the temperature variation or strain frequency shift range, thus realizing the rapid positioning of frequency shift and reducing the system's operation time. The maximum-seeking method based on STFT first processes the time-domain signal with STFT to construct a three-dimensional Brillouin gain spectrum and then builds a Brillouin frequency shift distribution through the maximum-seeking method. The Brillouin frequency shift curve is corrected by using the judgment Eq. (7) in different situations, determining the length of the short-distance temperature variation or strain segment, thereby improving the system's spatial resolution.Results and DiscussionsIn the experiment, we design a BOTDR system based on STFT and quickly locate the heated fiber in a section of 130 m the fiber of 2 km under test. We use the spectrum constructed with equal division FFT (Fig. 6) to determine the position of temperature occurrence based on whether the frequency shift peaks appear in each segment of the spectrum. The traditional STFT-BOTDR system detects fiber temperature variation data of 130 m in 12800 groups of data, with a system operation time of 482 s. By using the maximum-seeking method based on equal division FFT, the system operation time for detecting the temperature variation information of 130 m is reduced to 68 s, which is 1/8 of the original time. The calculation speed is much improved. At the same time, to verify the enhancement of spatial resolution by using the maximum-seeking method based on STFT, we design test fiber 2 (Fig. 7) with heating section temperatures set at 40 °C and 50 ℃. Under the condition of setting the probe light pulse width to 100 ns, we use the traditional peak search algorithm and the maximum-seeking method to process the constructed Brillouin frequency shift distribution (Fig. 9). From the experimental data of Brillouin frequency shift distribution (Fig. 9), it can be seen that after using the STFT-based maximum-seeking method, the system's spatial resolution is optimized from 12.8 m to 1.2 m under the heating section at 40 °C and from 4.6 m to 0.6 m under the heating section at 50 ℃.ConclusionsWe propose a new method to achieve rapid frequency shift positioning and spatial resolution enhancement in the BOTDR by using the maximum-seeking method. By continuously dividing the original signal and performing FFT processing, the maximum-seeking method processes the two-dimensional Brillouin gain spectrum to determine the position range of temperature variation or strain segments, reducing the system's computing time. At the same time, the three-dimensional Brillouin gain spectrum obtained from STFT is processed by using the maximum-seeking method to construct Brillouin frequency shift distribution, reducing the minimum detectable temperature variation or strain segment length and enhancing the system's spatial resolution. In the experiment, an STFT-based BOTDR system is designed. By using the maximum-seeking method based on equal division FFT, the heated fiber of 130 m in the test fiber of 2 km is quickly located, reducing the system's operation time to 1/8 of the original and improving calculation speed. Simultaneously, under the condition of setting the probe light pulse width to 100 ns, a spatial resolution of 0.6 m is achieved on the test fiber of 2 km. The experimental results show that this method can further improve the performance of existing STFT-BOTDR systems without sacrificing other sensing performance parameters. By using the maximum-seeking method based on STFT, the sub-meter level spatial resolution is achieved. Compared with the traditional BOTDR system, the STFT-BOTDR system based on the maximum-seeking method has faster detection speed and better spatial resolution in engineering applications. Besides, this method helps to obtain higher system performance under limited system cost, making it easier for low-cost and high-precision BOTDR systems to be used in larger quantities at construction sites, bridges, and other occasions, thereby accelerating the engineering and large-scale application of distributed fiber optic sensing technology.
ObjectiveIn response to the trade-off of spatial-angular resolution in light field data acquisition due to data flux limitations, we propose a neural radiance field-based method to achieve high-quality light field super-resolution in the angular domain. The occlusion, depth variations, and background interference make super-resolution in the angular domain a challenging task, and it is difficult to express the rich details of the texture. In order to address these issues, many solutions are proposed in terms of novel view synthesis based on explicit and implicit scene geometry. However, both explicit and implicit scene geometry methods generate new viewpoint images of the scene from the geometric features of the scene, which are prone to problems such as noise interference and difficult reconstruction of textural details. Therefore, we propose neural radiance field-based light field super-resolution in the angular domain to reconstruct densely sampled light fields from sparse viewpoint sets, which can avoid errors and noises that may be introduced during image acquisition and improve the accuracy and quality of subsequent three-dimensional (3D) reconstruction.MethodsBy training the neural network with the light field data, the neural radiance field captures the complete scene information, even for novel viewpoints, and thus enhances the scene representation performance. In order to achieve this, a multilayer perceptron is utilized to express a five-dimensional vector function that describes the geometry and color information of the 3D model. The image color is then predicted using volume rendering. The light field is subsequently represented by a neural radiance field, and dense sampling of the angular dimension is achieved by adjusting the camera pose in the light field to obtain new perspectives between the sub-aperture images. This approach overcomes the limitations of prior techniques, including occlusion, depth variation, and background interference in light field scenes. Additionally, the input variable is mapped to the Fourier features of that variable by positional encoding, effectively addressing the challenge of fitting to the high-frequency textural information of the scene.Results and DiscussionsWe propose the neural radiance field-based light field super-resolution in the angular domain by representing the light field by the neural radiance field. The main advantage of the proposed method over the selected experimental methods, such as local light field fusion (LLFF) and light field reconstruction using convolutional network on EPI (LFEPICNN) is that the proposed method is based on the neural radiance field to implicitly represent the light field scene, which can fit an accurate implicit function for the high-resolution four-dimensional light field and accurately represent the light field scene with complex conditions. The experimental results show that the super-resolution method based on the neural radiance field proposed can improve the angular resolution from 5×5 to 9×9. The peak signal to noise ratio (PSNR) is improved by 13.8% on average, and the structural similarity (SSIM) is improved by 9.19% on average (Table 1 and Table 2).ConclusionsWe propose a novel method of neural radiance field-based light field super-resolution in the angular domain. By representing the light field with the neural radiance field, the new perspective images between sub-aperture images are generated to achieve the dense sampling of the angular dimension. In the implicit representation of the scene, position encoding is utilized to map the input variables to their Fourier features to address the problem of difficult fitting for high-frequency information. Experiments on the HCI simulated light field dataset show that the proposed method achieves the best results in several super-resolution metrics and significantly outperforms other methods. Experimental results on the Stanford light field real dataset demonstrate the effectiveness of the method. Overall, the super-resolution method is not only able to deal with occlusions, depth variations, and background interference but also to obtain high-quality reproduction of rich textural details. In the future, the proposed method will be used for real-time rendering and scene reconstruction of large scenes. As a new paradigm for scene representation, neural radiance fields provide new ideas and methods for computational imaging of light fields, and we will further combine scenes' geometric and physical information to improve computational imaging performance and scene representation performance.
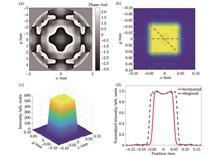
ObjectiveThe phase problem is encountered and required to be solved in many optical applications, such as optical metrology, adaptive optics, and biomedical imaging. This problem arises because optical detectors can only record the amplitudes of light beams, and the phases of light beams are missed. However, the transparent object, such as a living cell, does not affect the amplitude of a light beam passing through it, except for a phase shift, and phase imaging is the only way to acquire the structure information of transparent objects. Although the Zernike phase contrast microscope can convert a phase shift of the light beam passing through a transparent object, it is not quantitative and only effective for small phase shifts. Quantitative phase imaging (QPI), which is a label-free and powerful technique for providing quantitative information of transparent objects, attracts growing interest in biomedical applications. Up to now, the mainstream techniques for QPI are digital holography microscopy and phase retrieval. Digital holography microscopy, an interferometric technique, is highly accurate but extremely sensitive to the environment. Phase retrieval can recover the input phase from intensity-only measurements, but it has a stagnation problem and a limited dynamical range. These drawbacks have greatly limited the application of phase retrieval. In this study, a QPI technique based on both wavefront segmentation by a microlens array and multiplane phase retrieval is proposed for achieving QPI of phase objects with a large dynamic range. This technique has the characteristics of high accuracy, fast convergence speed, and large dynamic range, which can be a potential technique for QPI of phase objects in biomedical imaging.MethodsThe proposed method for QPI of a phase object is based on both wavefront segmentation by a microlens array and multiplane phase retrieval. In order to acquire QPI of a phase object with a large dynamic range, the proposed method imposes three constraints on the light field passing through the phase object. The first one is wavefront segmentation, which divides the input wavefront into small ones by a microlens array. The second one involves multiple intensity distributions recorded at different diffraction planes along the axial direction of the microlens array. Due to the abundant information provided by intensity maps at different diffraction distances, phase retrieval algorithms typically converge quickly. The third one is to employ multiple illuminations at different wavelengths. In order to acquire an unwrapped phase imaging of a phase object by the proposed approach, three steps need to be performed: firstly, recording multiple diffraction intensity distributions near the focal plane of the microlens array under different illumination wavelengths; secondly, retrieving the phase of the phase object using multi-plane phase retrieval at different wavelengths, respectively; finally, unwrapping the phase of the phase object using the retrieved phases at the synthetic wavelength. A series of numerical experiments are performed to evaluate the performance of the proposed method. Four different types of aberrations (the phase of a microlens array, complex random combination wavefronts, peak functions, and cell slices) are selected as the phase to be measured for exploring the versatility of the proposed method under the illumination wavelengths of 640 nm and 685 nm. Then, phase retrieval of wavefronts with different peak-to-valley (PV) values is performed to verify the large dynamic range of the proposed method. At last, the convergence of the proposed method is compared with that of the classical phase retrieval algorithm.Results and DiscussionsThe numerical experiments for retrieving four different types of phases show that the proposed method can recover phases of phase objects quickly and accurately (Figs. 5, 6, 7, and 8), which indicates that the proposed method is an effective way for QPI of phase objects. Using the proposed method, phase retrieval of a wavefront with a PV value exceeding 3 μm is achieved under the illumination wavelengths of 640 nm and 685 nm, nearly 5 times one illumination wavelength, indicating that the method covers a large dynamic range (Fig. 9 and Table 1). Furthermore, the comparison of convergence speed shows that the convergence of the proposed method is always better than that of the classical phase retrieval algorithm (Fig. 10 and Table 2).ConclusionsIn this study, a QPI technique for phase objects based on both wavefront segmentation by a microlens array and multiplane phase retrieval is proposed. This technique requires the recording of the intensity distribution maps of different diffraction distances near the focal plane of the microlens array under two different illumination wavelengths. The recorded intensity distribution maps are used to recover the digital complex light field passing through the phase object by multi-plane phase retrieval algorithm. The retrieved digital complex light field phases at different wavelengths are used to calculate the phase image of the phase object at a synthetic wavelength. In the numerical simulation experiments, the QPI for different types of phase objects with different PV values is achieved. It shows that this technique is powerful and efficient for QPI and serves as a promising technique for QPI of phase objects.
ObjectiveIn the vision-guided robot operation, it is necessary to acquire the 3D image of the target in the scene dynamically when there is relative motion between the target and the vision system. Binocular stereo vision can obtain images of the left and right cameras synchronously and quickly and has better dynamic adaptability compared with the 3D imaging methods characterized by scanning, such as laser radar and linear scanning structured light technology. The binocular stereo vision technology assisted by active speckle projection illumination enhances the texture information of the target surface and improves the matching accuracy of corresponding points of the left and right images. Thus, it is a simple and effective approach. At present, the research on the binocular stereo vision system with active speckle projection applied in the air is mature relatively, and many commercial products have been developed, such as the Kinect system of Microsoft, the Vic-3D measurement system of Correlation Solutions, and the Q-400 system of Dantec in Germany. However, when this technology is applied in the water, there are problems such as the pinhole model failure, unsatisfied matching conditions of polar constraints, and the image degradation caused by the underwater environment absorption and scattering of left and right images of the projected speckle. This will affect the matching accuracy of the corresponding points and the underwater 3D imaging effect.MethodsWe rebuild an underwater binocular vision imaging model that actively projects speckle patterns based on the 4D parameter representation of light. The influence of the speckle pattern on the matching accuracy of underwater binocular corresponding points is analyzed based on MATLAB 2015b. The experimental device of underwater binocular vision dynamic 3D imaging system with active speckle projection is mainly composed of a speckle pattern projector and two cameras. The employed speckle pattern projector is a projector. The speckle pattern generated by the computer is projected on the underwater target by the projector, and the left and right cameras synchronously and quickly shoot the underwater moving object with the speckle pattern on the surface. According to the principle of binocular stereo vision, the 3D image of the underwater target is calculated.Results and DiscussionsThe simulation results of the relationship between speckle pattern and matching accuracy of underwater binocular imaging are shown in Fig. 6. With the rising speckle size, the maximum matching error first decreases and then increases. When the speckle size is between 3 pixel and 15 pixel, the maximum matching error is less than 0.7 pixel, and when the speckle size is 9 pixel, the matching accuracy is the highest. This is because when the speckle density is constant, too large or too small speckle is not conducive to matching, and the appropriate size of the speckle can enhance the matching clues of the corresponding points of the left and right images. Fig. 7 shows the influence of speckle density on the matching accuracy when the speckle size is 9 pixel. With the increase in speckle density, the maximum matching error first decreases and then increases. When the speckle density is 1.5% to 3.5%, the matching error is less than 0.6 pixel, and when the speckle density is 2%, the matching accuracy is the highest. Fig. 8 presents that the maximum matching error gradually increases with the decreasing object distance (from 2400 mm to 3600 mm), but the maximum matching error is still less than 1.1 pixel. This method has high matching accuracy. In addition, the purpose of the underwater experiment is to investigate the underwater dynamic 3D imaging error of the established experimental device. The experimental scenario is shown in Fig. 10. The projector is connected to the computer, the speckle density generated by the computer is 2%, and the speckle size is 9 pixel. The projector projects the speckle pattern diagonally downward on the underwater target surface. The underwater target is a standard ball that is suspended by a string at about 3 m in front of the experimental device. As shown in Fig. 11, the standard ball swings on the parallel plane of two cameras, the starting angle is about 50°, and the ball can swing freely when it is released at zero initial speed. It has different instantaneous linear speeds at different positions and has the maximum instantaneous speed at the lowest point. The maximum instantaneous speed is about 1.2 m/s. The 3D point cloud can be calculated based on the captured left and right images. Fig. 13 shows the 3D point cloud images at the corresponding positions in Fig. 12. The PolyWorks software is adopted to fit the obtained 3D point cloud into a sphere (picture-in-picture in Fig. 13). The diameter of the sphere and coordinates of the center of the sphere are obtained (data in the upper right corner of picture-in-picture), and the dynamic measurement error is obtained by comparing the diameter of the standard sphere. The dynamic imaging experiment has been operated on many times. The diameter error of the standard ball at the lowest point and the standard deviation of the measured result are shown in Table 3. The experimental results show that the standard deviation of dynamic measurement error at the maximum instantaneous speed of the standard ball is 2.4 mm with a sound dynamic 3D imaging effect.ConclusionsWe conduct a study on the underwater binocular stereo vision dynamic imaging technology based on the active speckle projection, analyze the influence of active speckle pattern projection on the matching accuracy of corresponding points of underwater binocular stereo vision, and establish the experimental device of underwater binocular vision dynamic 3D imaging system based on active speckle projection. The experimental results indicate that the underwater binocular stereo vision technology with the active speckle projection has a sound dynamic 3D imaging effect, and the dynamic measurement error is within the static error determined by the structure and system parameters of the binocular stereo vision experimental device.
ObjectiveAs the demand for materials with excellent mechanical properties is increasing in scientific research and engineering, determining how to accurately measure the global displacement field of materials in mechanical experiments has become an important scientific research issue. Digital image correlation (DIC) algorithm is a non-contact optical method for measuring global speckle displacement fields based on visible light, which is widely used in experimental mechanics and engineering fields. It has the advantages of low measurement costs, high precision, high sensitivity, strong anti-interference ability, and global measurement. However, traditional DIC algorithm cannot meet the requirements of real-time measurement in practical applications, which greatly limits the development and promotion of this method. With the rapid development of deep learning in computer vision, deep learning methods gradually come into use in DIC algorithm. Thanks to the efficient calculation by general processing unit (GPU) devices, the deep learning-based method for measuring the speckle displacement field can more easily achieve real-time online calculation. Although the method is much faster than the traditional one, the model cannot accurately measure the complex large deformation displacement field in practical applications due to the incomplete dataset. Hence, this work aims to construct a more realistic and comprehensive speckle image dataset with a large deformation displacement field and propose a fast and high-precision deep learning model to measure the displacement field of speckle images with large deformation.MethodsA large number of different types of speckle images is obtained in various ways (Fig. 1) to construct a speckle image dataset with a large deformation displacement field in line with the actual situation. These speckle images are obtained from real experiments and computer simulations under different parameter combinations (Table 1). Then, a composite deformation composed of translation, stretching, compression, rotation, Gauss, shear, and other basic deformations is used to define the random displacement field. Finally, a speckle-image displacement-field dataset with a maximum displacement of 16 pixel and large deformation in line with the actual deformation is produced. In terms of the deep learning network model, a fast and high-precision network model DICNet (Fig. 5) for measuring the speckle images with a large-deformation displacement field is built upon the improvement on UNet. DICNet introduces a convolutional block attention module to increase the efficiency of feature extraction and fusion, uses depthwise separable convolution to replace some ordinary convolutional layers, and increases the convolution kernel size of some convolutional layers. It improves the displacement-field measurement accuracy and reduces the number of parameters of the network model. At the network training stage, a combination of the global shape loss function and global absolute loss function is proposed to improve the convergence speed and accuracy of the model.Results and DiscussionsNetwork selection experiments are conducted to prove that UNet is a rational basic network model for measuring the large-deformation displacement (Table 2). It has higher measurement accuracy of the displacement field, a smaller number of parameters, and faster inference speed. The DICNet proposed in this work is compared with the traditional DIC algorithm and the latest deep learning methods on the self-built dataset, and the performance of these methods in the measurement task of the large-displacement displacement field is comprehensively compared in terms of three indicators, i.e., the root-mean-square error (RMSE), the standard deviation, and mean time (Table 3). The results show that the measurement accuracy of the deep learning method is better than that of the traditional method. The RMSE of DICNet on the training set and the validation set is 0.056 pixel and 0.055 pixel, respectively, which is 67%-70% lower than that of other existing methods and about 39% lower than that of the original UNet network. On the test set, DICNet still has the smallest RMSE and the most stable performance (Table 4). The experiments of DICNet are also conducted on the public DIC challenge dataset (Fig. 8). The results show that the measurement results of the proposed method are highly consistent with those of the traditional algorithms, which indicates that the proposed method still has good generalization performance on the public dataset.ConclusionsThis work proposes a displacement field measurement method for speckle images with complex large deformation. This method uses the convolutional block attention module and depthwise separable convolution to improve the UNet network for measuring large deformation displacement fields. To train the model, this work constructs a dataset containing multiple types of speckle images and complex large-deformation displacement fields in line with the real situation and proposes a new loss function. This method is compared with traditional DIC algorithm and the latest deep learning methods on the self-built dataset and public dataset separately. The results show that the measurement results of DICNet are highly consistent with those of other methods, and the method in this work achieves the highest average accuracy with the smallest number of model parameters. The measurement speed of the displacement field is far higher than those of traditional methods, which can meet the actual real-time measurement requirements of a large deformation displacement field. The source code and network pre-trained weights of this study are available at https://github.com/donotbreeze/Large-deformation-measurement-method-of-speckle-image-based-on-deep-learning. The dataset is available athttps://pan.baidu.com/s/1KzC9g_GIkvMnGFumDYGyBA?pwd=fd5x.
ObjectiveAt present, optical elements are almost always employed in the utilization and development of a wide variety of optical instruments. Due to improper handling during processing, scratches can appear on the surface of optical elements. Scattered light from surface scratches can reduce the beam quality, increase system noise, and reduce contrast, thereby affecting the performance and normal operation of the entire optical system. Therefore, the detection of surface scratches on optical elements is significant. As the existing light scattering methods can only detect the surface scratches of optical elements, the CCD or CMOS sensor can only receive the light field distribution formed by the scattering of surface scratches, from which the two-dimensional size of the surface scratches can be obtained. However, the depth information of the scratches cannot be detected directly. Since up to 80% of the surface information such as depths and shapes of surface scratches is characterized by phase information, we propose to apply the angular spectrum iterative algorithm and transport of intensity equation (TIE) + angular spectrum iterative algorithm to the scattering method for detecting the depth of surface scratches on optical elements. Finally, a scattered light field acquisition optical path is put forward to detect the depths of surface scratches on optical elements.MethodsIn the detection of surface scratch depths, the angular spectrum iterative algorithm and transport of intensity equation (TIE) are applied to the detection of surface scratch depths by scattering method. The scratch depths can be obtained from the reconstructed surface scratch phase distribution by the phase modulation characteristics of surface scratches. In the simulation section, the forward and reverse propagation relationship models between the optical element surface and the CMOS receiving surface are built by the angular spectrum transfer function. Based on this model, the scattered light field distributions of surface scratches with different shapes are obtained. Then, the angular spectrum iterative algorithm and TIE+angular spectrum iterative algorithm are adopted to reconstruct the scratch phases. The reconstruction process of the angular spectrum iterative algorithm is to select a random phase as the initial phase of the CMOS receiving surface and iterate repeatedly between the two surfaces. Additionally, the calculated value is replaced with the amplitude value of the initial simulated scattered light field intensity and the unit amplitude of the optical element surface until the defined error reaches the preset precision or the set maximum number of iterations. The phase distribution of scratches on the surface of optical elements can be obtained, and the depths of scratches can be calculated by the modulation characteristics of the surface scratches to the phase. TIE+angular spectrum iterative algorithm is similar to the reconstruction process of the angular spectrum iterative algorithm, which means that the initial random phase is replaced by the phase calculated by TIE. Finally, the effectiveness of the two reconstruction algorithms is evaluated from the strength error, correlation coefficient, and relative root mean square error. In the experimental section, the scattered light field acquisition device is built and the scattered light field distribution on the surface of the optical element is received by the CMOS detector. At the same time, the reconstructed scratch distribution on the surface of the optical element is reconstructed by the above two reconstruction algorithms, and then the surface scratch depth size is calculated. Finally, the reconstruction results of the two algorithms are compared with the detection results of the white light interferometry, and the relative errors of the two algorithms are calculated.Results and DiscussionsIn the simulation section, scratch distribution and scattering field distribution of three different shapes, which are square scratch, triangular scratch, and oval scratch, are first simulated (Figs. 4 and 5). Then the scratch scattering field distribution is employed as the initial input of the angular spectrum iterative algorithm and TIE+angular spectrum iterative algorithm respectively to reconstruct the phase distribution of scratches on the surface of optical elements. The depth information of surface scratches is obtained based on the phase modulation characteristics of surface scratches (Figs. 6 and 7). Finally, we evaluate the effectiveness of the two algorithms from the strength error, correlation coefficient, and relative root mean square error. From the perspective of the intensity error evaluation, the number of iterations is set as 5000. The rising number of iterations leads to decreasing intensity error. Compared with the angular spectrum iterative algorithm, TIE+angular spectrum iterative algorithm has a smaller intensity error and faster convergence speed (Fig. 8). From the evaluation of the correlation coefficients, the correlation coefficients of both reconstruction algorithms are greater than 0.9 and the reconstructions are both highly correlated. However, the TIE+ angular spectrum iteration algorithm has a greater correlation coefficient and a higher degree of correlation compared to the angular spectrum iteration algorithm. From the evaluation of the relative root mean square error, the relative root mean square error of the TIE+angular spectrum iterative algorithm is 5.2%-5.3%, and that of the angular spectrum iterative algorithm is 5.8%-6.6%. The simulation results show that the scratch depth reconstructed by TIE+angular spectrum iterative algorithm is more accurate. In the experimental section, the scattered light field distribution of scratches on the surface of optical elements is collected experimentally, and the scratch depth on the surface of optical elements is reconstructed through the angular spectrum iterative algorithm and TIE+angular spectrum iterative algorithm (Fig. 12). Finally, the reconstructed results are compared with those of the white light interferometry, and the relative error range of the angular spectrum iterative algorithm is 1.35%-4.21%. The relative error range of the TIE+angular spectrum iterative algorithm is 0.90%-3.73%. The experimental results indicate that the scratch depth reconstructed by TIE+angular spectral iteration algorithm is more accurate.ConclusionsIn this paper, we apply the angular spectrum iteration algorithm and TIE+angular spectrum iteration algorithm to the surface scratch depth detection of optical elements by scattering method. During the experiment, only one image of the optical element surface light field distribution needs to be collected, which is employed as the initial input of two reconstruction algorithms to reconstruct the phase information of the scratch. Then the depth information of the scratch is calculated according to the modulation characteristics of the surface scratch to the phase. Compared with the angular spectrum iterative algorithm, TIE+angular spectrum iterative algorithm has a smaller scratch depth reconstruction error, faster convergence speed, higher reconstruction accuracy, and better reconstruction effect.
ObjectiveWith the progress of optical communication technology, optoelectronic devices are developing toward low power consumption, large data bandwidth, and high integration. The electro-optic modulator (EOM), a key optoelectronic device, plays a vital role in connecting the electric and optical fields, where the on-chip integration, high efficiency, low power consumption, and large bandwidth are always the crucial development directions of EOMs. Up to now, lithium niobate (LN) is still one of the most ideal materials for electro-optic modulation due to its excellent properties of wide transparent windows, strong Pockels effect, as well as stable physical and chemical features. However, the currently used EOMs are based on the bulk LN material, and the key modulation waveguides are formed by titanium diffusion or proton exchange on the bulk LN. Therefore, the formed waveguides have a low refractive index contrast (?n≈0.02), which leads to a large waveguide size required to well confine the optical mode, and the EOM footprint is also relatively large inevitably. Recently, the thin-film lithium niobate (TFLN) wafer has been fabricated by the smart cutting process and made available by several commercial companies. The TFLN wafer not only inherits some excellent material properties of LN but also has a high refractive index contrast (?n≈0.8), a feature considerably beneficial for shrinking the device footprint and making the on-chip compact integration available. In general, the TFLN-based EOMs can be divided into two types. One performs etching on the TFLN wafer to form the required waveguide, and the other deposits other high refractive index materials atop or below the TFLN wafer to form the waveguide, where the TFLN wafer does not need to be etched. By comparison, the etching-free TFLN scheme can reduce the fabrication difficulty. Therefore, we focus on the etching-free TFLN structure and propose a heterogeneously integrated EOM using embedded filling layers.Methods The structure of the proposed device is divided into three partsthe structural design of the modulation waveguide, the electrode structure, as well as the coupling structure between the modulation region and the input/output waveguides. The silicon nitride (SiNx) modulation waveguide is under the TFLN, and a layer of BCB is filled between them to reduce the half-wave-voltage length product (VπL) and optical loss. On this basis, we employ such structure as the interference arms in a Mach-Zehnder interferometer (MZI) waveguide structure, where the modulation electrodes are arranged as a ground-signal-ground (G-S-G) configuration. The modulation electrodes are deposited on the TFLN, and a SiO2 layer is sandwiched in between as an isolating layer to further reduce the optical loss, microwave loss, and the refractive index of the effective mode. Additionally, we propose an inverted stepped TFLN structure to achieve efficient coupling between input/output waveguide and modulation waveguide. Finally, we simulate and analyze the proposed structure using tools of COMSOL Multiphysics and FDTD Solutions to demonstrate its high-speed modulation performance.Results and DiscussionsThe BCB layer is filled between bottom SiNx modulation waveguide and TFLN. We simulate the influence of different thicknesses of the BCB layer and the SiO2 layer on VπL and the optical loss of the device. Results show that the proposed structure can effectively reduce VπL and optical loss (Fig. 2). At the same time, we optimize the electrode gap, and the optimum VπL of the device is 1.77 V·cm (Fig. 4). Further, we fill the SiO2 layer between modulation electrode and TFLN layer. The filled SiO2 layer can not only further reduce the optical loss (Fig. 3) and microwave loss (Fig. 5) of the device but also contribute to the index matching (Fig. 7). The high-speed analysis shows that the 3 dB modulation bandwidth of our proposed modulator is 140 GHz (Fig. 8). Finally, we design an inverted stepped thin-film structure, which can reduce the refractive index mismatch of the effective mode between SiNx waveguide region and SiNx-LN hybrid region. The simulation results show that the single-ended coupling loss of this structure is 0.73 dB (Fig. 9).ConclusionsIn this paper, we propose a heterogeneously integrated EOM based on TFLN. The modulation waveguide is formed by the bottom SiNx and top TFLN that are sandwiched by a BCB layer. The modulation electrodes are deposited on the TFLN, and a SiO2 layer is sandwiched in between as an isolating layer, which contributes to the index matching and the reduction in optical loss and microwave loss. Further, we construct an MZI-based EOM, where an inverted stepped thin-film structure is proposed to achieve the efficient coupling between input/output waveguide and modulation waveguide. After the high-speed matching design and optimization of the proposed electro-optic modulator, we obtain a VπL of 1.76 V·cm and a 3 dB bandwidth of 140 GHz in a modulation length of only 5 mm, and the single-ended coupling loss is reduced from 1.23 dB to 0.73 dB. Given these characteristics, we believe the proposed device structure could be applied in the large-bandwidth design of the TFLN-based EOM and would boost the development of TFLN-based photonic integrated devices.
ObjectiveUltra-stable laser has excellent characteristics such as extremely low frequency noises and extremely high coherence, and it is widely used in cold atomic light clocks, geodesy, gravitational wave detection, and optical frequency transmission. When the laser frequency is locked on the Fabry-Pérot (FP) cavity using Pound-Driver-Hall (PDH) frequency stabilization technology, the frequency stability of the laser depends entirely on the cavity length stability of the cavity. The temperature fluctuation of the FP cavity is one of the main factors that affect the cavity length. How to quickly analyze its temperature characteristics has been the research focus of ultra-stable lasers. The cavity length change of the FP cavity is mainly affected by the temperature fluctuation of the external environment. To suppress this effect, researchers both in China and abroad usually place the cavity in a vacuum chamber with multi-layer thermal shields to obtain a larger thermal time constant and a lower temperature sensitivity. Therefore, to quickly and accurately analyze the influence of the thermal shield parameters in the vacuum chamber on the temperature of the FP cavity, global researchers have carried out corresponding research based on various thermal analysis methods, such as the transfer function method, finite element analysis method, and direct differential method. At present, most of the thermal analysis methods of the FP cavity system only focus on the law of the temperature of the cavity changing with time, and the research results of the temperature sensitivity of the FP cavity required by the actual working conditions cannot meet the urgent needs of the actual working conditions. Therefore, this paper proposes a thermal analysis method of the FP cavity after comprehensively considering heat conduction and radiation and establishes the relationship between temperature sensitivity and corresponding physical parameters of the system, which can guide the design of the FP cavity system in practical engineering.MethodsIn this paper, a typical FP cavity vacuum system is taken as the research object. Through theoretical analysis, the differential equations between the FP cavity's temperature and the external temperature under heat conduction and radiation are derived. According to the differential equations, the transfer function relationship between the FP cavity's temperature and the external temperature is derived by using a reasonable simplified approximation method. The correctness of the transfer function relationship is proved by numerical calculation and finite element simulation. On the basis of the temperature sensitivity curve obtained from the Bode plot of the transfer function, a simplified approximate formula for calculating the temperature sensitivity of the FP cavity is proposed. By combining the overall trend of the curve and considering the wide applicability of the approximate formula, the proposed approximate formula is improved and revised. Finally, the curve obtained from the approximate formula is compared with that obtained from the theoretical formula by numerical calculation. The results show that the overall trend of the curves obtained by the two methods is completely consistent, although there are some small errors.Results and DiscussionsIn this paper, the transfer function relationship between the FP cavity's temperature and the external temperature is derived by reasonably simplifying the approximation method. Through the analysis and comparison of numerical calculation and finite element analysis methods, it can be concluded that the temperature curve of the FP cavity obtained by this transfer function is completely consistent with the one obtained by the theoretical formula, and it is very close to the calculation result of ANSYS software under both the condition of only considering heat radiation [Figs. 2(a) and 2(c)] or considering heat conduction and radiation comprehensively [Fig. 3(a)]. The residual curves [Figs. 2(b), 2(d), and 3(b)] given in the paper show that the difference between the curves is very small, and it can be approximately considered that the curves are completely consistent. The calculation results of the two formulas for the thermal time constant are consistent and very close to those of the ANSYS software. Based on the temperature sensitivity curve of the FP cavity (Fig. 4), this paper gives a simplified approximate formula for calculating the temperature sensitivity of the cavity. The comparison between the curve obtained from the approximate formula and that obtained from the theoretical formula shows (Fig. 5) that the overall trend of the curves is completely consistent. Although there are some errors, the sensitivity approximate formula has the characteristics of simple form, intuitional parameters, and convenient calculation, and it is of important guiding significance for the design of the ultra-stable laser system.ConclusionsIn this paper, the FP cavity vacuum system is taken as the research object, and the temperature characteristics of the FP cavity under multi-layer thermal shields are analyzed theoretically. The transfer function relationship between the FP cavity's temperature and the external temperature is simplified and deduced. The simulation results show that the transfer function formula is correct. According to the transfer function, the approximate formula for fitting the temperature sensitivity curve of the FP cavity is obtained. The results show that although there are some differences between the approximate formula and the theoretical value, the approximate formula has the characteristics of simple form, intuitional parameters, and convenient calculation, and it is of strong guiding significance for the preliminary design of the FP cavity vacuum system.
ObjectiveObtaining scene depth is crucial in 3D reconstruction, autonomous driving, and other related tasks. Current methods based on lidar or time of flight (ToF) cameras are not widely applicable due to their high cost. In contrast, only employing a single RGB image to infer scene depth information is more cost-effective, which has broader potential for more applications. Inspired by the successful applications of deep learning methods in various ill-posed problems recently, many researchers tend to adopt convolutional neural networks to estimate reasonable and accurate monocular depths. However, most existing studies based on deep learning focus on how to enhance the feature extraction capability of the network, without attention paid to the distribution of image depths. Estimating the pixel distributions of images can not only improve the inference precision but also make the reconstructed 3D images more consistent with ground truth. Therefore, we propose a new adaptive depth distribution module, which allows the model to predict different depth distributions for each image during the training.MethodsThe NYU Depth-v2 dataset created by New York University is employed. Overall, our model is built based on the encoder-decoder structure with skip connections, which has been proven to be able to guide image generation more effectively. An indirect representation of depth maps based on plane coefficient is also introduced to implicitly add the plane constraint in the depth estimation and obtain smoother depth estimation results in the plane region of the scene. Specifically, two sub-networks with different lightweight designs are adopted at the bottleneck and other upsampling stages in the network to enhance the model's feature extraction capability. In addition, an adaptive depth distribution estimation module is also designed to estimate different depth distributions according to different input images, which makes the pixel distribution of depth maps closer to the ground truth. A two-stage training strategy is employed. In the first stage, we load the pretrained weights on ImageNet into the backbone network and optimize the model using the loss function only at the 2D level. In the second stage, we perform joint training through loss functions at both the 2D and 3D levels.Results and DiscussionsOur study employs multiple metrics including root mean square error (RMSE), relative error (REL), and intersection over union (IoU) to qualitatively evaluate the inference ability of the proposed model. As shown in Table 1, the proposed lightweight network model outperforms most of the listed methods with only 46 M parameters, which proves the overall structure of the model is concise and effective. The visual comparison results of 3D depth reconstruction (Fig. 5) demonstrate that the proposed network can output smoother and more continuous depth predictions in planar regions, and reasonable predictions in the partially occluded or missing areas of planar regions. In terms of depth distribution, the carefully designed adaptive depth distribution module can make the predicted distribution fit better with the ground truth in the trend of the curve and can get a higher IoU rate compared with other methods (Fig. 6 and Table 3), thus indicating the effectiveness of the proposed module. Additionally, the lightweight network can balance accuracy and speed in real-time scenarios (Table 2), and yield good inference and reconstruction results. However, the proposed network has some limitations in recovering fine details of the depth predictions (Fig. 7), and thus how to design the network to recover more depth details while ensuring the model's real-time prediction performance will be the focus of our future work.ConclusionsAn innovative model based on plane coefficient representation with adaptive depth distribution for monocular image depth estimation tasks is presented. Qualitative and quantitative results obtained from the NYU Depth-v2 dataset and multiple comparative experiments demonstrate that the proposed method is capable of obtaining reasonable prediction results for planar regions in images with partial occlusions or small viewing angles. Additionally, the proposed depth distribution prediction module provides differentiated pixel distribution optimization for each image, which can make the model achieve pixel depth distribution prediction results closer to the real images. With its lightweight design, this method realizes a balance between inference speed and inference accuracy and is highly applicable in practical scenarios that require accuracy in real time, such as indoor virtual reality and human-computer interaction.
ObjectiveVision-based depth estimation is an important research direction of computer vision, which is of great significance to three-dimensional (3D) reconstruction, semantic segmentation, navigation, etc. The monocular depth estimation scheme has the advantages of low cost and easy installation, which cannot be realized by binocular stereo vision and lidar, and it has received more and more attention in recent years. There is a strong correlation between the out-of-focus image degradation and the location of the object being photographed, which can be used as a source of information for monocular depth estimation. Traditional depth estimation algorithms based on depth from defocus (DFD) use mechanical zoom, which results in misaligned images. In addition, mechanical zoom has certain disadvantages in terms of response speed, accuracy, and service life. To avoid these problems, Ye et al. used the liquid crystal lens as the zoom device to implement the DFD algorithm. Liquid crystal lens imaging requires the use of polarizers to filter ordinary light (o-light), so as to reduce the incoming light by half. Ye et al. proposed a liquid crystal lens imaging technology without polarizers. They collected two images: one with voltage applied to the liquid crystal lens, and the other without voltage. They used the image without voltage to obtain the o-light component and subtracted the o-light component from the image taken under voltage to obtain an extraordinary light (e-light) image. The non-polarizer liquid crystal lens imaging scheme requires the collection of at least two images for a single focus setting. If this scheme is employed for DFD, at least four images need to be collected. However, the use of image enhancement techniques such as image filtering to suppress noise can result in the loss of valuable image information. In this work, we propose a polarizer-free scheme that is well-suited for DFD. This scheme eliminates the need for collecting additional images and requires only the capture of two out-of-focus images by using a polarizer-free liquid crystal lens. We demonstrate that the scheme could further improve the accuracy of depth estimation while simplifying system components.MethodWe first established a blur degradation model for liquid crystal lens imaging without polarizers. To simulate the blur degradation under o-light and e-light, we utilized a Gaussian model. Considering that o-light and e-light accounted for nearly 50% of natural light, we simply summed half of the blur degradation models of o-light and e-light to obtain the blur degradation model of natural light. We improved the defocus equalization algorithm by incorporating a weighted deviation function that accounted for depth inconsistency within the local window. In order to obtain the confidence of depth estimation in the spatial domain, we introduced a brightness correction factor to remove the brightness inconsistency. In addition, we introduced semantic segmentation as a guide template and employed the Laplacian matting algorithm to carry out the depth completion. Moreover, we conducted a theoretical analysis of the error associated with the depth estimation algorithm using polarizer-free imaging. Our analysis showed that the effective depth of field of this algorithm was larger than that of the scheme using a polarizer.Results and DiscussionsWe compared the effect of initial depth estimation (without error rejection and depth completion) of liquid crystal imaging systems without polarizers and with polarizers on slope and plane scenes, and the depth of the slope ranges from 0.61 to 1.00 m. For the slope scene, the captured images and the depth estimation results are shown in Fig. 8. For the plane scene, the captured images and depth estimation results are shown in Fig. 9. It can be seen that for a plane scene, the accuracy of depth estimation with and without a polarizer is similar. As for the slope scene, it can be seen from the framed area that the effect of depth estimation without a polarizer is better than that with a polarizer. The numerical comparison results are shown in Table 2. The comparison data of the slope and the plane scenes show that for a certain fixed depth, the effect of depth estimation with and without a polarizer is close. For scenes with depth changes (slope scenes), the range of defocus spot radius is relatively large. According to the analysis of the error model in this study, it can be known that the polarizer-free system can tolerate a larger range of changes in spot size, and it can achieve better results under large spots. At the same time, it exhibits stronger stability against noise disturbance. It can be seen from the experimental data that in the scene of depth changes, the polarizer-free system has a better performance [its root mean square error (RMSE) is reduced by 25%]. We also verified the proposed depth estimation scheme for liquid crystal lenses without polarizers in complex scenes by placing different targets at different depths. The depth ranges of different targets are shown in Table 3. We first compared the difference between the input images with and without polarizers, As shown in Fig. 10, adding a polarizer reduces the amount of light entering the image, which requires increasing the exposure time or adjusting the exposure gain to maintain the same brightness as the image without a polarizer. However, this results in an increase in image noise. At the same time, the depth of field of the image taken without a polarizer is greater, and it can ensure that the radius of the equivalent blurred spot is maintained at a smaller value and that the DFD algorithm can achieve better results in a relatively large depth range. The image results are shown in Fig. 11, and the numerical results are shown in Table 4. In addition, by comparing the sixth and seventh rows of Table 4 with the sixth and seventh columns of Fig. 11, it can be seen that after adding instance segmentation, the RMSE decreases by 42%, and AWT125 increases by 26%. Therefore, estimation accuracy has been significantly improved.ConclusionsIn this study, we proposed a depth estimation scheme for liquid crystal lenses without polarizers. The theoretical error analysis and experimental results show that the depth estimation scheme of liquid crystal lenses without a polarizer has more advantages than that with a polarizer. Compared with the traditional polarizer-free solution, the depth estimation scheme for the polarizer-free liquid crystal lens proposed does not simply subtract the component of o-light but uses the blur caused by the o-light in the depth estimation to further improve the accuracy of depth estimation. Removing the polarizer reduces the complexity of the optical system. This is of great significance for the use of liquid crystal lens imaging (especially small aperture) in actual scenes. We improved the unbiased defocus-equalization filter (UDE) algorithm, introduced a weighted energy function and light intensity correction factor, and used instance segmentation to complete the image. The results show that our improvement can effectively enhance the accuracy of the algorithm.
ObjectiveA video stitching method based on dense viewpoint interpolation is proposed to solve the problem of artifacts and defects caused by parallax when stitching under wide baseline scenes. Video stitching technology can facilitate access to a broader field of view and plays a vital role in security surveillance, intelligent driving, virtual reality, and video conferencing. One of the biggest challenges of the stitching task is the parallax. When the cameras' optical centers perfectly coincide, they are unaffected by parallax and can easily synthesize perfect images. However, achieving the complete coincidence of camera optical centers in practical applications is not easy. The cameras are also scattered in some scenes, such as vehicle-mounted panoramic systems and wide field security surveillance systems. Therefore, it is important to study the problem of stitching in wide baseline scenes. A standard method uses a global homography matrix for alignment, but it has no parallax processing capability, which results in obvious flaws in wide baseline and large parallax scenes. In order to solve the above problems, many researchers have proposed corresponding solutions from the perspectives of multiple homography and mesh optimization. However, the mesh deformation may have significant shape distortion. Some deep learning methods combine vision tasks of optical flow, semantic alignment, image fusion, and image reconstruction to help deal with the stitching problem. However, the parameter information of cameras is not fully utilized, so the stitching results sometimes still show defects. Therefore, we wish to make full use of the parameter information of cameras and synthesize the smooth interpolated view by supplementing intermediate viewpoints between cameras to achieve better visual perception.MethodsThe present study proposes a real-time video stitching method based on dense viewpoint interpolation. The method focuses on the overlapping regions of stitching and synthesizes the smooth interpolated view by supplementing dense intermediate viewpoints on the baseline of cameras, which can better align multiple inputs. In the first place, binocular camera calibration is performed to obtain internal parameters and the transformation matrix of the cameras. The original views acquired by cameras are de-distortioned and adjusted to the same horizontal plane for stitching in the horizontal direction. The maximum possible overlap regions are separated and adjusted to coplanarity and row alignment by stereo correction so that the image data can be processed in only one dimension. Subsequently, pixel-level displacement fields sampled in the original views for the overlapping regions are predicted by using the cost volume in stereo matching. Without the ground truth of the interpolated view, the network is guided to learn view generation rules by using spatial transformation relationships between viewpoints. Through the pixel-level displacement fields generated by the network, two images are sampled in the input views respectively and fused by linear weights to generate the interpolated view of the overlapping regions. Finally, the generated interpolated view is combined with non-overlapping regions of two views. The cylinder projection is performed to align the fusion boundaries of three regions and obtain the final stitching result.Results and DiscussionsIn this paper, the stitching results of the proposed method are compared with mainstream stitching methods. Multiband blending may show artifacts under the influence of parallax, while the method based on multiple homography and mesh optimization may have significant shape distortion in non-overlapping regions after mesh deformation. The proposed method can eliminate artifacts and smoothly align the inputs with little shape distortion, resulting in better visual perception (Fig. 9 and Fig. 10). Furthermore, we evaluate the alignment quality of the overlapping regions. The traditional methods only deal with stitching from the perspective of image features, and the alignment quality is relatively low in the case of large parallax variations. The proposed method combines camera calibration information for preprocessing and deals explicitly with the parallax problem to obtain better alignment quality (Table 1). Regarding model size and speed, the proposed method has advantages because it can initially align images after camera calibration and uses a lightweight construction method of cost volume. The processing frame rate of 720 p video can reach more than 30 fps to meet the demand for online video stitching (Table 2). In the analysis of the variation of baseline width, the proposed method can align well under different baseline widths (Fig. 12). In addition, all of them can obtain a high improvement of indicators (Table 3), which is robust to the variation of the baseline width. In conclusion, the proposed method can improve the visual perception after stitching, eliminate artifacts, and smoothly align the inputs. It has high alignment quality, little shape distortion, and great application value because of its lightweight design and fast processing speed.ConclusionsApplying the proposed video stitching method based on dense viewpoint interpolation can effectively deal with the problem of stitching in wide baseline and large parallax scenes. The interpolated view with the smooth transition is synthesized for the overlapping regions of stitching by supplementing dense intermediate viewpoints on the baseline of the left and right cameras. A network for generating the interpolated view is proposed, which is divided into modules of feature extraction, correlation calculation, and high-resolution optimization to predict the sampling locations in the original views. The generated interpolated view is combined with the non-overlapping regions to obtain the stitching result. Moreover, the proposed method calculates the three-dimensional information at the original viewpoint in the virtual environment without the ground truth of the interpolated view. The corresponding spatial region of the interpolated viewpoint is searched by dichotomization. The interpolated view is transformed into the original viewpoint under the constructed loss function, which guides the network to learn the view generation rules. Various experiments have proved that the proposed method can improve the visual perception of video frames after stitching. It is adaptive for different baseline widths, has great generalization ability, and achieves real-time performance to meet the online stitching requirements in practical applications.
ObjectiveHuman eye is a crucial component of vision, but the number of patients suffering from ocular illnesses is growing every year. It has been discovered that the morphological characteristics of retinal blood vessels are strongly associated with several ocular conditions including diabetic retinopathy and glaucoma, and they are frequently employed in clinical diagnosis. Therefore, precise segmentation of retinal blood vessels based on color fundus images is crucial for the diagnosis of ocular illnesses. However, the fundus image itself displays noise, poor contrast, and an unbalanced distribution of blood vessels and background pixels. Additionally, morphological information gathering is challenging due to the delicate, highly curved, and multi-scale properties of retinal blood vessels. The time-consuming, difficult, and subjective nature of doctors' manual segmentation makes it ineffective for providing a large number of patients with a speedy diagnosis. To achieve precise automatic segmentation of retinal blood vessels from end to end, we propose the self-adaptive compensation network (SACom).MethodsSACom employs the U-shaped network as its fundamental structure. First, deformable convolution is incorporated into the encoder to enhance the model's capacity to learn information about morphological structures of retinal blood vessels. An adaptive multi-scale aligned context (AMAC) module is then developed at the bottom of the U-shaped network to extract and aggregate multi-scale context information and align the context features produced by pooling. It can adaptively extract context features according to the input image size and utilize the image context information correctly. Finally, a collaborative compensation branch (CCB) is proposed to fully leverage the feature layer in the decoder and high-level semantic features at the bottom of the network. Its multi-level outputs are helpful for positioning the overall structure of the blood vessel to fine details. Then they are fused with the output feature layer of the decoder end through the feature layer averaging adaptive fusion to improve the mapping capability of the model.Results and DiscussionsThe segmentation accuracy of retinal vessels can be effectively improved by the proposed SACom model. Each module is beneficial to improve segmentation performance according to the ablation experiment. Compared with the baseline model, SACom just adds a small number of extra parameters (Table 3). The proposed approach can thoroughly detect both thick blood vessels and thin blood vessels, and the connectedness of blood vessels is also more ideal, according to the visualization results of the segmentation (Fig. 6). Subsequent investigation reveals that there are microscopic blood vessels in the SACom segmentation results that are not labeled by experts but exist in fundus images (Fig. 7). It is clear that SACom has a good ability to segment blood vessels and identify blood vessel pixels more accurately, thereby addressing strong subjectivity in manual labeling. SACom performs better than other state-of-the-art methods generally (Table 5), with high sensitivity. The accuracy reaches 0.9695, 0.9763, and 0.9753, the sensitivities are 0.8403, 0.8748, and 0.8506, and the respective AUC values are 0.9880, 0.9917, and 0.9919 for DRIVE, CHASE_DB1, and STARE datasets, respectively.ConclusionsAn effective automatic segmentation algorithm called SACom is put forth to achieve precise segmentation of retinal vessels in fundus images. SACom integrates deformable convolution into the encoder based on the network architecture of U-Net to improve the learning capacity of vascular structural information. The bottom of the U-Net is constructed with an AMAC module that can collect and aggregate multi-scale aligned context information to adapt to the multi-scale issue of retinal blood vessels. Finally, a CCB is proposed. Its multi-level outputs calculate loss respectively and conduct backpropagation to improve the accuracy of each branch's output result. The outputs of the CCB are averaged and then adaptively fused with the output feature map of the decoder for accurate segmentation. The experimental results on three datasets reveal that the method has excellent generalization capability for different pixel classifications, especially for blood vessel pixels, and its comprehensive segmentation performance is better than other state-of-the-art algorithms. In addition, the proposed algorithm does not need too much computation load, which makes it easy to deploy in clinical applications.
ObjectiveIn recent years, photon orbital angular momentum, as a new degree of freedom, has attracted wide attention. The Laguerre-Gaussian (LG) beam is a commonly used orbital-angular-momentum (OAM) beam and is widely studied. Among a large amount of research, the mode conversion of LG beam attracts much attention from researchers. It is found that an LG beam can be converted into a Hermite-Gaussian (HG) beam with the help of cylindrical lenses. In addition, the nonlinear beam shaping technique can change the condition of phase matching in the nonlinear process to realize wave-front modulation, and harmonic waves with shaped wave-fronts can be achieved by this technique during nonlinear optical processes. By combining these hot topics, we propose a novel mode conversion method for special beams in nonlinear processes, and the local quasi-phase-matching (LQPM) theory is employed to design the required optical superlattice (OSL). The function of mode converters is concentrated on the superlattice structure, and the phase-matching condition is satisfied in the nonlinear mode conversion.MethodsLQPM is used to design the OSL structure required by the nonlinear mode conversion process. Different from the conventional quasi-phase-matching (QPM) method in the reciprocal space, the LQPM is a nonlinear beam manipulation theory in real space. According to the principle of LQPM, the OSL structure function for the nonlinear mode conversion of LG beams can be obtained. The domain structure shows a curved boundary, and the function of cylindrical lenses is integrated into the OSL. Matlab software is used to carry out numerical simulations for the nonlinear mode conversion process. The finite-difference method is employed in the numerical simulation process to calculate the field distribution in the two-dimensional OSL. The field distribution and intensity curves of the second-harmonic wave after nonlinear mode conversion are obtained. It can be found that the designed OSL structure shows positive results on both mode conversion and frequency doubling.Result and DiscussionsIn this paper, we propose an OSL structure that can realize the nonlinear mode conversion of the LG beam, and the curved domain structure is designed based on the LQPM theory. After analyzing the forms of the isophase planes of the structure, two different modes which we called positive mode and negative mode can be obtained (Fig. 1). It is found that both modes can be used to achieve nonlinear mode conversion under the phase-matching condition, but the positive mode has better effect and can achieve perfect mode conversion. The LG beam with p=0 is taken as the fundamental wave to perform functional simulation on the designed OSL, and the converted HG beam image is observed as expected (Fig. 5). The relationship between the LG beam and the HG beam mode index is verified by observing the light and dark fringes. According to the above theoretical calculation and simulation results, it can be seen that the designed OSL integrates the functions of mode conversion and frequency doubling effect at the same time, which can be used to obtain higher-order vortex beams and make the device more compact. This study is expected to promote the research on nonlinear mode converters.ConclusionsIn this paper, we propose a nonlinear mode conversion method based on OSL which can realize both second-harmonic generation and mode conversion in a single device. Compared with the previous mode conversion methods based on cylindrical lenses, in our method, not only the mode conversion function of the cylindrical lens is concentrated on the optical superlattice, but also the nonlinear effect of frequency doubling is realized. In addition, the original linear conversion process is replaced by a nonlinear process, and the phase mismatch is compensated by the LQPM theory. According to the field distribution image of the HG beam obtained by the numerical simulation, it is verified that the optical superlattice can realize the function of nonlinear mode conversion. In a word, a multifunctional OSL is designed, which can realize the nonlinear mode conversion between LG beams and HG beams. Through this study, the beam mode of the fundamental wave can be converted into another form in a nonlinear process with high efficiency, which has an important role in optical communication and other fields.
ObjectiveThe chromatic confocal displacement sensor forms a spectral dispersion of polychromatic light along the axial direction of the dispersion lens. When an object is within the effective dispersion range, its axial position can be determined by analyzing the wavelength of the reflected light. This sensor offers high detection accuracy, fast detection speed, and good stability, making it a crucial tool for the semiconductor industry, material science, biology, medical detection, and diagnostics. The dispersion lens is an important component of the chromatic confocal displacement sensor. The axial detection ability of the sensor is determined by its dispersion range and numerical aperture. This study found that a relatively small object or image numerical aperture of the dispersion lens results in a long overall length that hinders its miniaturization. In this study, we aim to develop a dispersion lens with a large numerical aperture and small volume to enhance the measurement accuracy and range of the chromatic confocal displacement sensor.MethodsThis paper presents the working principle of the chromatic confocal displacement sensor, then examines the factors affecting its main performance indicators, such as axial measurement range, linearity, and axial resolution. The axial measurement range of the sensor is determined by the axial chromatic aberration of the dispersion lens, and a combination of at least two glasses is required for optimal linearity. The control variable method is used to analyze the influence of image numerical aperture, working wavelength, and dispersion range on the axial resolution. Subsequently, the study investigates the factors affecting the shortening ratio in the reverse telephoto structure. Finally, the optical design structure is processed and modified based on experiments conducted to validate the accuracy of the theoretical analysis.Results and DiscussionsThe dispersion lens, designed using the reverse telephoto structure, has a shorter axial length and a larger image numerical aperture. The axial optical length is 135 mm, and the image numerical aperture is 0.48. With the same lens parameters, the axial length of the dispersion lens is about 35% shorter compared with that of the standard dispersion lens. The axial dispersion of the lens is 3.5 mm. While extending the axial dispersion can increase the measurement range, it also weakens the optical energy and reduces instrument signal-to-noise ratio. Increasing the image square numerical aperture of the dispersion lens improves the measurement signal-to-noise ratio but also increases head aberration, and affects linearity and dispersion range. Therefore, it is necessary to balance the design index of the dispersion lens. The image quality detection and performance evaluation experiments conducted on the adjusted dispersion lens show a maximum measurement standard deviation of 0.05 μm, a maximum average absolute error of 0.04 μm, and the actual axial resolution is better than 0.5 μm. The maximum measurement angle for the measured object is approximately 28.5°, confirming the accuracy of the theoretical analysis.ConclusionsIn this study, a compact long-axial dispersive spectral confocal lens with chromatic dispersion is designed by using the reverse telephoto structure. The design reduces the axial length of the lens by about 35% compared with conventional finite-range conjugate dispersion lens with the same performance parameters. A length reduction ratio formula is provided, which serves as a guide for designing chromatic confocal lenses with small object numerical aperture and large image numerical apertures. In application, the goals of the spectral confocal lens include expanding the dispersion range, increasing the numerical aperture of the image, and maintaining the near-linear dispersion performance. However, these three parameters are also related to energy utilization of the measurement system, volume, and the complexity of the lens. Increasing the numerical aperture of the image will improve the measurement signal-to-noise ratio but will increase the image aberration of the lens head, and the linearity and dispersion range will also be affected. The axial resolution of a dispersion lens is positively correlated with the image numerical aperture and the axial dispersion range, but the large numerical aperture and the long-axial dispersion range constraint the lens design and need to be balanced. The lens has an image square numerical aperture of 0.48 and can measure angles upto 28.5° inclined surface. To further improve the image square numerical aperture of the lens, it is necessary to increase the number of lens. As aspheric processing technology matures, aspheric correction of spherical aberration becomes an option for large numerical aperture lenses. Using optical fiber with smaller core diameter and spectrometer with higher resolution can further improve the axial resolution of the measurement system. The spectral confocal dispersion lens design in this study is advantageous for miniaturization displacement or three dimensional measuring instruments. Fewer lenses and glass types are conducive to commercial adoption and application.
ObjectiveImaging spectrometer can obtain spatial and spectral information of targets simultaneously, and it has been widely applied in ground object analysis, space remote sensing, target reconnaissance, and other aspects. As spectral imaging technology develops, designers hope that the imaging spectrometer can achieve a wider field of view (FOV) and wavelength band while meeting the structural compactness. In this aspect, the Offner imaging spectrometer shows excellent performance. However, with the expanding FOV and wavelength band, the aberration correction is more difficult. The Offner imaging spectrometer employing a traditional spherical mirror usually balances aberration by relaxing the size limits or adding lenses to the system, thereby leading to the increasing volume or complexity but failing to meet the requirements of lightweight and compactness. With the development of manufacturing and testing technology, the free-form surface has been widely employed in optical design. It is a kind of non-rotationally symmetric optical element, which can introduce more degrees of freedom into optical design. Introducing free-form surfaces into imaging spectrometers can improve the aberration correction ability of the system. However, too many free-form surfaces in optical systems or too many free-form terms on optical surfaces will cause a large deviation in the sag of surfaces, which will not only reduce the aberration correction ability of free-form surfaces in the system but also make the manufacturing of free-form surfaces more difficult. Therefore, we want to use a reasonable free-form surface in the imaging spectrometer design to achieve broad wavelength band and compact volume simultaneously.MethodsThe main aberration in the Offner imaging spectrometer is astigmatism. Firstly, the expression of the third-order astigmatism of the system is obtained based on the vector aberration theory. The analysis of the expression of third-order astigmatism shows that the astigmatism of the system increases with the increase of FOV and wavelength band. In the Offner imaging spectrometer, the design of the third mirror as a free-form surface allows for the correction of aberrations associated with both FOV and dispersion. Then we calculate the expression for astigmatism introduced in the Offner imaging spectrometer by Zernike polynomials of 4thorder and below when the third mirror is designed as a free-form surface with conical surface adding fringe Zernike polynomials. In the calculation, since the diffraction grating is set as aperture stop and the third mirror is a surface away from the stop, the pupil employed in the non-central FOV is shifted relative to the central FOV, and an offset vector is introduced to describe the pupil utilized by the non-center field on the third mirror. Additionally, since the third mirror is set behind the grating in the system, the rays passing through the grating have been dispersed on the third mirror, and the other offset vector is introduced to describe the pupil region leveraged by the rays with different wavelengths on the third mirror at this time. Finally, the relationship among the introduced astigmatism, wavelength, and FOV of the system can be obtained by analyzing the calculated expressions. The results show that in the optical design of the Offner imaging spectrometer based on free-form surfaces when Zernike free-form terms of 4th order and below are selected, the eighth, eleventh, and twelfth terms of Zernike polynomial can be selected to correct astigmatism in the wide FOV and wavelength band.Results and DiscussionsAn imaging spectrometer with broad wavelength band is designed, and its structure is shown in Fig. 4. The groove density of grating is 100 lp/mm and the diffraction order of -1 is selected, with a wavelength band from 400 to 2500 nm. The system is designed for dual-band detection of visible-near-infrared (VNIR) and shortwave-infrared (SWIR). Two slits with different widths are adopted to ensure the independent spectral resolution of each band. After the rays from the dual slit pass through M1, M2, and M3 successively, they are imaged to corresponding detectors respectively through a dichroic mirror as a beam splitter. The detectors have pixels of 14 μm for the VNIR band and 20 μm for the SWIR band. The system specifications are shown in Table 3 and the lens data of the system are shown in Table 4. M3 is designed as a free-form surface. The coefficients of different Zernike terms in M3 are shown in Table 5. The volume of the system is 42 mm×82 mm×100 mm, which is one-third of the spherical mirror system with the same specifications.ConclusionsThe imaging spectrometer based on the conventional optical element is difficult to meet the structural compactness and realize wide FOV and wavelength. Thus, the third mirror in the Offner imaging spectrometer is designed as a free-form surface expressed by a conical surface with fringe Zernike polynomial added. The relations among astigmatism introduced by polynomials of fourth order and below, wavelength, and FOV in the Offner imaging spectrometer based on vector aberration theory are analyzed. Then an imaging spectrometer with a wavelength range from 400 to 2500 nm and a volume of only 42 mm×82 mm×100 mm is proposed by selecting a reasonable polynomial adding on a conical surface. The system achieves dual-band detection. The rays from two slits with different widths are dispersed by the diffraction grating from the beam splitter to work in visible-near-infrared (400-1000 nm) and shortwave-infrared (1000-2500 nm) bands. The optimized design results indicate that the spectral resolution is 2.8 nm and 4 nm respectively with high imaging quality. Finally, theoretical reference implications are provided for the application of free-form surfaces in the design of imaging spectrometers.
ObjectiveIn the electronic industry, aerospace, medicine, automobile, and micro-electro-mechanical system, micro-holes are important structural units of devices and functional parts. The current development trend of micro-hole processing is small size, high aspect ratio, high machining accuracy, high machining efficiency, no recast layer, no heat-affected zone, and no micro cracks. At present, several methods, such as mechanical, electro-discharge, electrochemical, and pulse laser drilling, are used for micro-hole machining. Ultrashort pulse laser processing is particularly versatile and can guarantee a high level of controlling the process due to the ultrashort time scale and ultra-high peak power density characteristics. It has been used for micro-hole drilling with limited heat-affected zone to provide high quality and precision, especially for hard and brittle materials. If the ultrashort pulse laser is used as a drilling tool, the beam must be rotated in a circular movement. At present, helical laser drilling technology is mainly based on the rotation of optical components, such as Dove prism, wedge plates, and cylindrical lenses. However, there is still a lack of high stability, small size, and low-cost laser drilling system. In this paper, a helical laser drilling system based on a scanning galvanometer is designed to meet the requirements of precise micro-hole drilling with a diameter ranging from 100 μm to a few hundred microns.MethodsThe ultrashort pulse laser drilling system is based on a scanning galvanometer and a helical laser drilling lens. The scanning galvanometer can be rotated in XY direction with high accuracy and high speed. The helical laser drilling lens is made up of a scanning lens, an image transmission lens, and a focusing lens. The basic principle of the helical laser drilling lens is to offer a lateral offset of the laser beam before the focusing lens. Thus, the focusing lens forms an inclined angle on the laser machining surface (Fig. 1). The focal length of the scanning lens is f1. The image transmitting lens is f2, and the focusing lens is f3. Thus, the focal length of the helical laser drilling lens is f, which is expressed as follows f=f3×f1/f2.In order to achieve high stability and reduce the total length, the telephoto structure and symmetry design are applied to the design of the scanning lens and image transmission lens (Fig. 2). The design specifications of the helical laser drilling lens are listed in Table 1. It is required that the diameter of the beam intersection part should be less than the minimum machining aperture to achieve the desired processing hole aperture range. The processing hole aperture range of this paper is 100–400 μm, and the depth-to-diameter ratio is 10. In order to achieve these goals, the optical system design is carried out by using the optical design software ZEMAX. For ultrashort pulse laser, achromatic design and the best focusing performance should be considered in terms of image quality. Besides, group-velocity dispersion, thermal expansion, and damage threshold of components should all be considered in terms of system performance. Therefore, fused silica is selected as the main positive lens used in helical laser drilling lens because of its relatively high Abbe number, low heat expansion coefficient, and high damage threshold. Dense flint glass (H-ZF13, CDMG) is chosen as the material of the negative lens. The basic idea is that both lenses will compensate for their respective dispersions and cancel each other.Results and DiscussionsThe optical design result of the helical laser drilling lens is shown in Fig. 3, and the distribution of the focusing light field is shown in Fig. 4. The total length of the helical drilling system is 512.5 mm, which is far less than the sum of the focal length of three lenses (f1+f2+f3=950 mm). The telephoto structure and symmetry design are helpful to reduce the total length, thus increasing the system's stability. The spot diagrams and wave aberration results show that the on-axis and off-axis aberrations of the designed lens are almost equal, and the image quality achieves the diffraction limit. The design results show that the system can drill with a diameter of 100-400 μm, and the maximum depth-to-diameter ratio is 10∶1.The total removal of focused ghost reflections from the optical surfaces of the helical laser drilling lens that can damage optical components is critical. Therefore, lens optimization should be conducted along with an analysis of the focused ghost positions. The main methods that eliminate the focused ghost reflections are to adjust the curvature radius and air space of lenses. The analysis of the back-focused ghost reflections of the helical laser drilling lens is shown in Fig. 6. None of the back-focused ghost reflections are inside the components or on the surfaces.Tolerance is a critical factor that affects the performance and cost of an optical system. The tolerance of the helical laser drilling lens is analyzed in detail in this paper, as shown in Table 2. The machining and assembly tolerance analysis is put forward according to the actual condition. Analysis results show that the maximum change of spot radius (RMS) is 2.2 μm, much less than the diameter of the airy disk. The Monte Carlo simulation predicts a high-level accuracy performance for the helical laser drilling lens to be manufactured.According to the design results, the helical laser drilling system is fabricated and assembled. An ultrashort pulse laser is used to drill micro-holes, so as to analyze the performance of the system. The results (Fig. 7) show that the helical laser drilling system can achieve high precision.ConclusionsIn this paper, we have designed a helical laser drilling system based on a scanning galvanometer to meet the requirements of precise micro-hole drilling with a diameter ranging from 100 μm to a few hundred microns. Our comprehensive study has considered the essential issues in designing and optimizing the laser drilling system for high-power and high-precision applications. We have discussed helical laser drilling lens basics, principles of material selection, elimination of focused ghost reflections, and tolerance analysis. The design results show that the system can drill with a diameter ranging from 100 μm to 400 μm, and the maximum depth-to-diameter ratio is 10∶1. The experimental results show that the helical laser drilling system can achieve high precision.
ObjectiveIn order to improve the adaptability of cylindrical lenses and expand their application fields, a continuous zoom liquid micro-cylindrical lens system was fabricated. Cylindrical lenses are widely used in engineering fields such as beam shaping, scanning equipment, and holographic display due to their irreplaceable ability in beam manipulation. However, the commonly used focal length of cylindrical lenses is always fixed, and most of the research on zoom systems always focuses on the commonly used symmetric circular lenses, while zoom cylindrical lenses are relatively unexplored. Therefore, a series of liquid zoom cylindrical lenses have been designed in our previous study, including compound-type and capillary-type liquid core zoom cylindrical lenses. They change the refractive index of the core by changing the type or concentration of the liquid filled in the hollow area of the lens and then achieve the variable focal length. However, the compound-type lens has a large size and is not easy to integrate. The capillary-type micro cylindrical lens system has a short focal length and small zoom range, which limit its application. To address the above problems, we aim to design and fabricate a new type of liquid zoom cylindrical lens system based on a polydimethylsiloxane (PDMS) substrate, which is characterized by a high zoom ratio, stable structure, small volume, and easy integration. The continuous zoom liquid micro-cylindrical lens system can be used to replace the fixed focus cylindrical lens in beam manipulation, providing a higher degree of freedom and adaptability and applied in the accurate measurement of liquid refractive index and liquid diffusion coefficient.MethodsThe design and fabrication of a continuous zoom liquid micro-cylindrical lens system mainly include four processes: establishment and optimization of the initial structure, zoom ability and imaging quality evaluation, tolerance analysis, and processing and fabrication. In this paper, the capillary-type liquid core micro-cylindrical lens based on a PDMS substrate designed in our previous work is selected as the original structure, and its parameters are quadrupled as the initial structure to lengthen the focal length. When the refractive index of the liquid filled in the capillary varies by changing the type or concentration of the liquid, the focal length of the lens system changes, which can be considered as the different zoom states of the system and simulated by using the multiple structures in ZEMAX. We set the curvature radii, thicknesses, and glass material types of the cylindrical lens in the zoom system as variables and establish the evaluation function to optimize the system structure iteratively. We also analyze the optimized system's zoom ability and imaging quality until a high zoom ratio and good imaging quality over the zoom range are obtained. Then, the tolerance analysis, including curvature radius, decentering, as well as thickness of every surface in the molding process, and tilting of each cylindrical lens in the installation process, are performed to evaluate the feasibility of the design. We send the designed cylindrical lenses for processing and embed them into a PDMS substrate to complete the preparation. The setup of the observation system is complete, and then the zoom ability and the imaging quality of the continuous zoom liquid micro-cylindrical lens system based on a PDMS substrate are measured to verify the feasibility of the design scheme.Results and DiscussionsThe zoom lens system we have designed is composed of two symmetrical meniscus lenses and a biconvex cylindrical lens, which are all embedded in a PDMS substrate (Fig. 2). The edges of the two meniscus lenses are glued to form a cavity, and the focal length of the system can be changed continuously by varying the refractive index of the liquid filled in the cavity. The rationally designed biconvex cylindrical lens can control the aberrations of the cylindrical lens system in the whole zoom range. The detailed parameters are listed in Table 1. The dimension of the PDMS substrate is 14.7 mm×6.0 mm×10.0 mm. When the refractive index of the liquid injected into the cylindrical lens system changes from 1.3330 to 1.5530, the back focal length of the system changes from 52.292 mm to 4.972 mm continuously and smoothly (Fig. 3). In the whole zoom range, the radial root mean square radius of the diffuse spot of the cylindrical lens system is always less than 5 μm (Fig. 5), and the MTF curves are close to the diffraction limit in most zoom structures (Fig. 6). The possible tolerance of the cylindrical lens system is analyzed in detail (Figs. 7-10), and permissible tolerance is given. Then, the fabrication of the lens system (Fig. 11), as well as the measurement of the back focal length (Fig. 12) and the MTF curves (Fig. 13) are completed. The measured values and curves are close to the simulation results.ConclusionsA continuous zoom liquid micro-cylindrical lens system based on a PDMS substrate is designed and fabricated in this paper, and a cavity is used to inject liquid; a biconvex cylindrical lens is used to control the aberrations, and the square PDMS substrate ensures the stability of the lens system. Both the simulation and measured results have confirmed its high zoom ratio and great imaging quality. Compared with the original structure, the zoom range is enlarged by about 5 times while ensuring the imaging quality. The zoom system has the advantages of a high zoom ratio, small size, simple and stable structure, and high imaging quality, which can be used in integrated micro-devices.
ObjectiveThere are increasing concerns about flicker as light-emitting diode (LED) source products enter the market, which is linked to the driver. In a passive circuit, the light output exhibits a sinusoidal function of rippled current's sinusoidal waveform. Color shifts and variations in luminous flux during dimming are generally unacceptable in general lighting. There are complex interconnections among white LED lighting system parameters, dynamic optical properties, ripple currents, LED light source device parameters, and LED driver parameters. However, the above issue lacks the necessary theory for clarifying the superiority. Therefore, an investigation of the illuminance and flicker variation of white LEDs driven by sinusoidal waveforms is presented in this paper. It incorporates factors such as illuminance, flicker index, percent flicker, voltage amplitude, frequency, amplification factor, and heatsink temperature into a relatively realistic model over dimming. This paper aims to present a method for designing LED systems with sinusoidal driving schemes that minimize flicker indexes and percent flicker variations systematically. In order to meet the flicker requirements set forth in IEEE Standard, the proposed model assists power supply engineers in controlling LED source and driver parameters.MethodsBased on the interaction of photometric, electrical, and thermal factors of semiconductors, the maximum luminous flux, flicker index, and percent flicker of LED sources are modeled. Many parameters can affect luminous flux, flicker index, and percent flicker, including the heatsink temperature, the thermal resistance of the LED source, the heat dissipation coefficient, luminous efficacy, and driver parameters. A white LED lighting system has been used to demonstrate the proposed flicker modeling process. Light flicker analyzer (LFA-3000) shows the waveform of an LED system's light output with a sinusoidal wave of specified parameters. White LED system with different heatsink temperatures is electrically driven. A wideband amplifier (Texas Instruments ATA-122D) in the direct current (DC) component from the DC power supply adds the signal function (Gigol DG-500). The light output of the LED is captured from the detector (LFA-3000) using the high-speed signal amplifying function. The luminance of LED samples is measured after thermal stability with constant heatsink temperature from 25 ℃ to 85 ℃. The voltage amplitude ranges from 3 V to 5 V. The amplification factors vary from 2 dB to 6 dB. The frequency ranges from 100 Hz to 2000 Hz. LED source and photodetector are connected by the dark tube. There is a spacing of 20 cm between the source and the photodetector. Therefore, the ambient light does not influence the measurement results.Results and DiscussionsAccording to Eq. (8), heatsink temperature, and maximum electrical power, it is possible to predict the dynamic illumination of the LED source. A plot of the predicted and measured illumination variation is shown in Fig. 5. The results appear to be fairly in agreement. When the heatsink temperature is 30 ℃, the variation illumination of the LED source ranges from 2688 lx to 4512 lx, and the variation range is about 59.8%. Increasing the electrical power to 2.1 W results in a variation illumination range of 11252-21033 lx, with a variation range of around 53.2%. At a heatsink temperature of 85 ℃, the variation illumination is 2532-4399 lx at a maximum electrical power of 0.35 W, while the variation range is about 57.5%. As electrical power and heatsink temperature increase, there is a decrease in the variation range. This can be attributed to several reasons. First, with an increase in current density injected into the quantum well and junction temperature, the reduction of band gap and electron mobility will decrease. It means that the radiative recombination of electrons and holes in the potential well will decrease with increasing non-radiative recombination. The reduction of the internal quantum efficiency is caused by an increase in the number of electrons overflowing the potential well. As shown in Figs. 8 and 9, the average and maximum deviations between the calculations and measurements are about 7.1% and 12.8%, respectively. The illumination of white LED devices increases with increasing voltage amplitudes and amplification factors. It decreases with increasing frequency. When the voltage amplitude varies from 3 V to 3.5 V (amplification factors of 1 dB, heat sink temperature of 25 ℃, and frequency of 100 Hz), the illuminance increases from 3966 lx to 5889 lx, with a variation range of 32.6%. When the frequency changes from 100 Hz to 2000 Hz (amplification factors of 1 dB, heat sink temperature of 25 ℃, and voltage amplitude of 3 V), the illuminance decreases from 3966 lx to 2059 lx, with a variation range of 48.1%. When the heat sink temperature ranges from 25 ℃ to 65 ℃ (frequency of 100 Hz, amplification factors of 2 dB, and voltage amplitude of 4.5 V), the illuminance decreases from 13206 lx to 12904 lx, with a variation range of 2.3%. According to the proposed model, the deviations between theoretical and experimental results may be caused by the following factors: 1) the proposed model does not include the droop effect of multiple quantum wells and the nonlinear relationship between amplification factors of current ripple and carrier concentration; 2) the proposed model does not contain the relationship between Fermi energy level and voltage amplitude and cannot accurately predict threshold of carrier overflow potential well; 3) the proposed model does not contain the three-dimensional heat flow conduction and fails to accurately establish junction temperature of the device under different operating conditions. The ripple frequency of the LED device is 100-2000 Hz. Therefore, the allowable percent flicker is 0.3-66 according to IEEE standard 1789—2015 (Fig. 6). With a frequency of 100 Hz and maximum electrical power of 0.35 W, percent flicker is 0.276 and 0.289 under heatsink temperatures of 30 ℃ and 85 ℃, respectively. It is noted that the values of percent flicker are lower than the requirements of IEEE standard. When the maximum electrical power is increased to 2.1 W, the percent flicker increases to 0.341 and 0.356 under heatsink temperatures of 30 ℃ and 85 ℃, respectively. It should be pointed out that the values of percent flicker are higher than the requirements of IEEE standard.ConclusionsA real-time LED measurement method is demonstrated in this paper, so as to analyze and develop dynamic light outputs in real time. The dynamic illuminance, percent flicker, and flicker index of LED sources can be calculated independently as a function of heatsink temperature, frequency, voltage amplitude, amplification factors, and electrical power. By using the proposed model, it is possible to convert the dynamic light output from LED sources into flicker indexes and percent flickers under different conditions. There is good agreement between measured and calculated optical and flicker results, even when measured at different heatsink temperatures and driver parameters. According to dynamic optical and flicker performance, the tool allows designers to optimize LED system designs. Therefore, researchers and engineers can determine dynamic illuminance and flicker index using the LED and driver datasheets instead of optical instruments.
ObjectiveThe valley topological edge states (VTESs) and resonance loops are both important in optical communication systems, but they are usually two separate structures. In this paper, multi-layer nested valley photonic topological structures are designed. The energy transfer between loops is realized through the coupling of the evanescent field. By choosing its resonance frequency or changing the position of the light source, each loop has its own resonance frequency, and single loop or multiple-layer loops can be solely excited in the nested layered structure. Compared with similar studies, the loops do not design defects to form a resonant cavity and thus retain the integrity of the valley photonic crystal structures. This design has both the functionalities of resonance and waveguide transmission and increases the density of transmission channels. The results have application value in the reconfigurable photonic circuits.MethodsQuantum valley Hall effects (QVHEs) are realized by introducing angular rotation of the electron wave function at points K and K' in the first Brillouin zone (BZ), which provides an intrinsic magnetic moment, analogous to that provided by the electron spin. Similarly, vortex chirality (i.e., pseudospin) of photonic energy flow provides a new degree of freedom for optical waves via the orbital angular momentum, which can be realized by reducing the lattice rotation symmetry. By constructing different types of domain walls via these structures, valley edge states can be achieved. Firstly, it is necessary to construct a two-dimensional photonic crystal unit cell. The design of the unit cell structure in this article takes into account that Bragg-scattering not only exists between lattices but also occurs between the various medium columns within the lattice. In order to obtain a wider bandgap, the method of rotating the medium columns is used to break the spatial symmetry of the photonic crystal so that the degeneracy at the high-symmetry point K in the first BZ of the reciprocal lattice is separated, thereby showing a complete bandgap in the energy band diagram. Subsequently, by analyzing the phase difference between the two lattices at point K after rotating the medium columns (i.e., the topological invariant), it is proved that the structure has opposite topological phases at the K point, thereby indicating that the edge mode is the topological boundary mode. Secondly, by periodically arranging the two lattices, a supercell can be formed. After the frequency domain simulation, the supercell in this article has two edge states, and the spin-locked properties of the VTESs can be studied. Based on the above studies, we construct a nested loop model to achieve energy exchange between photonic crystals in the form of loop coupling. The principle of this coupling is evanescent field coupling. Compared with most current coupling methods that use waveguides and cavities, evanescent field coupling does not require the construction of waveguides or other defects or cavities. The topological edge mode of the valley photonic crystal designed in this article has great local properties and does not require additional defects. Last but not least, based on the advantages of topological properties, the design can also achieve efficient transmission while maintaining the original structure.Results and DiscussionsWe propose a new reconfigurable topological photonic structure model, which is a multi-layer nested photonic topological ring similar to Russian dolls. Based on the one-way transmission property of topological boundary states and the theory of coupling of electromagnetic waves, a three-layer nested loop (Fig. 7) is designed. The source position is at the center of any loop, and when the frequency is the same, different source positions will excite different transmission channels of the circuit. Furthermore, keeping the source position unchanged and changing the frequency of the source can excite multiple transmission channels. According to statistics (Fig. 8 and Fig. 9), the transmission channels in the structure will exhibit diverse forms such as single external loop, single inner loop, single middle loop, as well as double loops and triple loops. Compared with other similar schemes, the model design in this paper is intuitive, and there are no transmission channels connecting the loops. Energy transmission is entirely carried out by the coupling of the evanescent field to achieve reconfigurability. Its reconfigurability does not require any external conditions, which greatly reduces the complexity and difficulty of the design.ConclusionsThe VTES has become a new research hotspot in topological photonics because of its flexibility and diversity. In this paper, reconfigurable topological channels in the form of multiple-layer nested loops have been designed. By combining the topological edge states of the valley photonic crystal with the resonance loops, a variety of different channels can be excited. Although the reconfigurable topological waveguides have been widely studied, the unique value of our design is that the reconfigurable method does not rely on external conditions; instead, single or multilayer circuits can be selectively excited by setting the location and frequency of the source. This model can be used as a multi-channel frequency selector or optical resonator. Different from the general selector and resonator, the channel in the structure is a topological loop, which combines the common characteristics of topological protection and resonance, so as to reduce the loss as far as possible. It provides a new idea for the application of VTESs in optical devices.
ObjectiveResonant cavity light emitting diode (RCLED) has wide applications in fields such as display lighting and optical fiber communication due to its superior features and lower cost compared with ordinary light emitting diodes (LEDs) and vertical-cavity surface-emitting laser (VCSEL). RCLED with an outgoing wavelength of 650 nm needs to be coupled with optical fiber for plastic fiber communication, the coupling efficiency is related to the far-field distribution of outgoing light of RCLED. In addition, the temperature change will affect the far-field distribution of outgoing light of RCLED. As an important component of RCLED, distributed Bragg reflectors (DBRs) have an important influence on the performance of RCLED devices. Therefore, it is of great significance to study the influence of temperature on DBR characteristics. In this paper, the DBR structure is designed and prepared based on RCLED of 650 nm. The effect of temperature change on the reflection spectrum of DBR is simulated, and the white light reflection spectrum of DBR is tested by the test equipment to verify the correctness of the simulation results.MethodsIn order to study the effect of temperature on DBR characteristics, the conclusion is drawn through theoretical simulation, and the experiments are used to verify the conclusion. First of all, the DBR structure based on RCLED of 650 nm is designed, and the material based on DBR must have the characteristic of a high and low refractive index material. In terms of material selection, by considering the absorption of red light and the oxidation of materials, the high and low refractive index materials are selected as Al0.5Ga0.5As and Al0.95Ga0.05As respectively. After determining the constituent material of the DBR, through the fitting function of the refractive index of AlxGa1-xAs material given in "the refractive index of AlxGa1-xAs below the band gap: accurate determination and empirical modeling", the relationship between the refractive index of AlxGa1-xAs and the incident wavelength, temperature, and the component of Al is obtained. Then we further determine the refractive index of Al0.5Ga0.5As and Al0.95Ga0.05As at room temperature at 650 nm and select the constituent log of DBR as 30 pairs. Later, the reflection spectrum of the DBR composed of 30 pairs of Al0.5Ga0.5As and Al0.95Ga0.05As at different temperatures is simulated, and the temperature characteristics of the theoretically simulated DBR are obtained. Finally, the designed DBR structure is prepared by the metal-organic chemical vapor deposition (MOCVD) experiment and tested, and the temperature characteristics of the experimental DBR are obtained and compared with the theoretically simulated results.Results and DiscussionsFirstly, for the RCLED of 650 nm-based DBR design, in terms of the selection of materials constituting DBR, based on the relationship between the band width of AlxGa1-xAs material and Al (Fig. 1), the material with higher refractive index is determined to be Al0.5Ga0.5As, and as the component of Al gets higher, the device oxidation is more likely to happen. The material with a lower refractive index is determined as Al0.95Ga0.05As. Then, by the fitting function of the refractive index of AlxGa1-xAs and the three variables, namely the component of Al, temperature, and incident wavelength (Eq. 3), the relationship between the refractive index of AlxGa1-xAs and these three variables is obtained (Fig. 2) at 293.15 K with the incident wavelength of 650 nm. The refractive indices of Al0.5Ga0.5As and Al0.95Ga0.05As are 3.4386 and 3.1215, respectively; the thickness of Al0.5Ga0.5As and Al0.95Ga0.05As is determined as 47.258 nm and 52.059 nm, respectively in room temperature. Later, the pairs of DBR are determined as 30 by the relationship between the reflectivity and pairs of the DBR in different material combinations (Fig. 3). Then, according to the theory of thin film transmission matrix, the reflection spectrum of the DBR at different temperatures is simulated (Fig. 4), and it is found that the reflection spectrum of DBR moves towards the long wavelength and then through the central reflection wavelength of DBR at different temperatures (Fig. 5). The temperature drift rate of the central reflection wavelength of DBR is 0.048982 nm/℃. Finally, the designed DBR is prepared through the MOCVD experiment, and the white light reflection spectra at different temperatures are tested (Fig. 6). The redshift of DBR with the temperature is obtained. According to the relationship between the central reflection wavelength of DBR and temperature (Fig. 7), the drift rate of the center wavelength with temperature is 0.049277 nm /℃.ConclusionsFor the far-field distribution of RCLED, the DBR structure based on RCLED of 650 nm is designed, and then the effect of temperature on DBR characteristics is analyzed. Temperature changes the optical thickness of each layer of the DBR by affecting the refractive index of the material AlxGa1-xAs of the DBR, thus affecting the reflection spectrum of the DBR. According to the theoretically simulated results, the reflection spectrum of DBR appears redshifted to the long wavelength as the temperature increases, and the temperature drift rate of the reflected wavelength of the DBR is calculated by linear fitting. From the experimental test results, as the temperature increases, the white light reflection spectrum of the prepared DBR also appears redshift phenomenon, and the temperature drift rate of the DBR central reflection wavelength calculated by linear fitting is not much different from the theoretically simulated results, which verifies the theoretical simulation. The analysis of the temperature characteristics of DBR makes the device designed at high temperature realize the wavelength matching between quantum trap and DBR, the conclusion has certain guiding significance for designing VCSEL devices with higher temperature sensitivity.
ObjectiveDue to its peculiar phase and intensity distribution, the vortex beam has attracted extensive attention in particle manipulation and communication. Interference of a vortex beam with a plane wave can generate a helix beam with peculiar helical intensity distribution, providing a potential research platform for studying nonlinear topological edge solitons and anomalous topological phases. Multiple vortex and helix beams arrange in a specific distribution to form the field of the optical vortex array (OVA) and optical helix array (OHA). The array has multiple phase singularities compared to a single beam, which has essential applications in multi-particle manipulation and multi-channel communication. The wide-ranging applications of array fields rely on generating high-quality optical fields. Currently, various methods have been proposed to generate OVA and OHA, such as using fractional Tabor effect, grating diffraction, or direct adoption of vortex lasers. In these methods, by employing the fractional Talbot effect, the field with the best contrast can only be obtained at a specific distance. The intensity distribution of the OVA generated by grating diffraction is not uniform, and the vortex laser suffers from low energy efficiency. Compared to the above-mentioned methods, the field generated by the multi-beam interference features propagation invariance and high efficiency and becomes one way to generate the OVA and OHA. Therefore, the adoption of multi-beam interference to generate OVA and OHA is of potential research significance.MethodsBased on the principle of multi-beam interference, a periodic orthogonal binary phase plate is designed for generating square optical vortex array (SOVA) and square optical helix array (SOHA) fields. After filtering the spectrum of the phase plate, four symmetric spots in the central region of the spectrum and eight symmetric spots in the subcentral region of the spectrum are modulated separately. Then, the corresponding beams of these spots are obtained by the Fourier transform, and they interfere with each other to generate a square beam array (SBA) and a SOVA. The interference superposition of SBA and SOVA results in SOHA.Results and DiscussionsThe designed binary phase plate has the same period and structure in two orthogonal directions. The difference in the phase modulation quantities of adjacent rectangular phase modulation units is π (Fig. 1). The central direct component of its spatial spectrum is 0. After filtering the spectrum, four spots of the central region and eight spots of the subcentral region are preserved (Fig. 2). First, phase modulation is performed on the four-point sources located in the central region (Fig. 3). After phase modulation, the SBA can be generated by four-point sources (Fig. 4). In the SBA, the beam is distributed in a checkerboard shape, and the phase difference between adjacent beams is π. Then, phase modulation is performed on eight points located in the subcentral region (Fig. 5). The SOVA can be generated by the phase-modulated eight points (Fig. 6). There are two kinds of staggered vortex beams with topological charge l=±1 in the array. The SOHA can be obtained by interfering with the SOVA and SBA, and the design parameters of the binary phase plate should meet b/a=1/6 (Fig. 7) to obtain SOHA with the best interference effect. Under such conditions, the SOVA and SBA have the same transverse distribution period. At the maximum amplitude of the vortex beam, the beams in SBA have the same amplitude value (Fig. 8). In this case, the phase change direction of adjacent helix beams in the SOHA obtained is opposite (Fig. 9). With the SOHA propagation, the intensity of helix beams presents a spiral distribution along the optical axis. The rotation directions of adjacent helix beams are opposite (Fig. 10). Finally, we build a 4f optical path for experimental verification (Fig. 11) and obtain experimental results consistent with the theoretical results (Fig. 12).ConclusionsIn conclusion, we propose a method of generating SOVA and SOHA fields by utilizing a periodic orthogonal binary phase plate. The phase modulation of each unit of the phase plate is 0 or π, and the central direct component of the spectrum of the phase plate is 0. By filtering and phase modulation of the phase plate spectrum, the SBA and the SOVA fields with propagation invariant characteristics can be generated by four spots in the central region and eight spots in the subcentral region respectively. There are two kinds of vortex beams with topological chargel=±1 in the array. The two square array fields have the same transverse spatial period, and the wave vectors of the two square array fields in the optical axis direction are different. Therefore, the SOHA in which intensity distribution rotates with the changing transmission distance can be obtained by the interference superposition of the SBA and the SOVA. The SOHA has two kinds of helix beams with opposite rotation directions. When the parameter of the phase plate is b/a=1/6, the SOHA with the best contrast can be generated. Simulation and experimental results demonstrate the feasibility of the proposed method.
ObjectiveAs a novel surface mode, Tamm plasmon polaritons (TPPs) can be directly generated by the incident light with any polarization on the interface between metal and a distributed Bragg reflector (DBR) because its dispersion curve lies inside the light cone. Significantly enhanced energy distribution on the metal-DBR interface makes TPPs a potential candidate for nanoscale sensor devices. However, highly localized energy also prevents TPPs from touching the outside medium. In order to improve the sensing sensitivity of TPPs to the ambient medium, a triple-layer combinative structure has been proposed in this study, which is constituted by a metal film sandwiched between a metal grating and a DBR section. In this configuration, TPPs can be effectively excited on the interface between DBR and the metal film with a proper thickness, and a fraction of the localized energy induced by TPPs can penetrate the metal film into the grating slits to produce the surface plasmon polariton (SPP) modes supported by the metal slits. A quasi-Fabry-Perot (F-P) resonance of SPPs can be generated by a proper incident wavelength, and the highly localized energy accumulated through the F-P resonance can be employed to sense the refractive index of the ambient medium.MethodsThe DBR section in this study is formed by the alternating dielectric layers of TiO2 with a thickness of 121 nm and ZnO with a thickness of 156 nm, which ensure a Bragg wavelength to be 1 μm. Meantime, the metal gratings and film are made of silver, and the corresponding frequency-dependent complex relative permittivity is described by the Drude-Lorentz model. Due to the periodicity of metal gratings and the uniform distribution of the proposed structure along the slit direction, the three-dimensional triple-layer structure can be simplified to a two-dimensional plane unit cell model combined with the periodic boundary condition. The modal distribution and transmission characteristics of the cell model have been calculated numerically by the finite element method. The transmittance spectra of the proposed model have been obtained by changing the incident wavelength successively. The influence of the film thickness on the peak transmittance, peak wavelength, and transmission bandwidth has been analyzed in detail by varying the film thickness from 4 to 20 nm. In addition, by changing the refractive index of the medium filled in the grating slits, the sensing performance of the proposed structure has been evaluated by calculating the transmittance spectra of the triple-layer structure with different structural parameters, such as film thickness, duty cycle, and grating height.Results and DiscussionsAt first, the transmittance spectra of the triple-layer structure with varied film thickness have been analyzed in detail by employing the finite element method. The numerical results demonstrate that the peak transmittance first increases for small values of the film thickness and then decreases when the film thickness is greater than 12 nm. As a result, a maximum transmittance of 0.712 is obtained when the film thickness equals 12 nm, which represents an improvement of nearly 29% in the peak transmittance compared with the filmless case [Fig. 3(a)]. Meantime, the full width at half maximum (FWHM) of transmission peak decreases monotonously with increasing film thickness, and the peak wavelength gradually approaches to the fixed value of 1040 nm, which is the central wavelength of the typical TPPs in the interface between the semi-infinite silver layer and DBR [Fig. 3(b)]. In addition, the sensitivity of the refractive index sensing has been calculated by changing the refractive index of the medium filled in the metal slits, and it is found that the sensitivity decreases monotonously with the increase in film thickness (Fig. 5). Therefore,a film thickness of 8 nm provides the most balanced performance in the transmittance enhancement and highly sensitive refractive index sensing, which can increase the peak transmittance by about 16% and the sensitive by nearly 50% compared with the filmless case. When the ambient media refractive index changes continuously from 1.0 to 2.2, the resonance order of the FP resonances occurring in the grating slits can be changed from third to fifth order (Fig. 6). Numerical results demonstrate that the detection range of the third, fourth, and fifth order resonances are 1.10-1.26, 1.49-1.65, and 1.86-1.99, respectively, and the sensitivity and FOM values associated with three resonant modes are monotonically increasing with the resonant order (Table 1). On this basis, by changing the duty cycle and height of the metal grating, the refractive index sensing performance of the transmission peaks corresponding to the third, fourth, and fifth-order F-P resonances in the grating slits is analyzed in detail. The results show that as the duty cycle decreases, the sensitivity will increase significantly, and the sensing sensitivities of the transmission peaks induced by the fourth and fifth-order resonances occurring in the grating slits are 171.2 nm/RIU and 178.35 nm/RIU, respectively, when the duty cycle of grating equals 0.6 (Fig. 7). Meantime, the refractive index detection range can be shifted by a nearly linear manner by adjusting the grating height. According to third, fourth, and fifth-order resonant modes in the grating slits, the detection range of the proposed structure can effectively cover the values ranging from 1.00 to 2.27 by tuning the height of metal grating from 900 nm to 1200 nm (Fig. 8).ConclusionsIn this study, a triple-layer composite structure has been proposed to detect the refractive index of the ambient medium based on the F-P resonance induced by the TPPs. Research results indicate that introducing a silver film between the metal grating and DBR can effectively improve the excitation efficiency of TPPs, thereby enhancing the field intensity of SPP modes within the grating slits and the amplitude of the transmittance peak. Especially when the duty cycle is reduced to improve the sensitivity, the introduction of silver films can avoid the signal degradation induced by the lower duty cycle. This configuration can thus assure the high sensitivity to the refractive index of the filling medium in the gratings slits and the satisfied excitation efficiency of TPPs in the metal film-DBR interface. Moreover, the proposed structure can adjust the detection range in a nearly linear manner by changing the grating height. In this study, the detection range of the refractive index can be extended from 1.00 to 2.27 by adjusting the grating height from 900 nm to 1200 nm. The research results of this study provide an effective design idea for the TPPs-based refractive index sensor.
SignificanceOptical tweezers have revolutionized the field of biological research with their unique advantages of non-contact and high-precision manipulation of various particles, including biomolecules. In 1986, Arthur Ashkin pioneered the development of optical tweezers by demonstrating their ability to capture microspheres in three dimensions, and his pioneering work had earned him a Nobel Prize in 2018. However, the optothermal effect and diffraction limit of lasers in traditional optical trapping techniques have restricted its wider applications. Nevertheless, in the past decade, researchers have turned the optothermal effect into a merit. With the synergy effect of optics and thermodynamics, one can perform high-precision nanoparticle manipulation in a large-scale range, which is called optical temperature field-driven tweezers (OTFT). This new type of tweezers can operate in rather low light density, which is two to three orders of magnitude lower than that of conventional optical tweezers. In addition, with the assistance of thermal energy, it greatly expands the categories of particles that can be manipulated, allowing for the large-scale manipulation of particles that limit the application of optical tweezers, such as opaque particles, metallic nanoparticles, and biomolecules. OTFT has become a useful research tool that enables researchers to study biological particles with high precision. Particularly in the detection of individual bio-nanoparticles, such as viruses, bacteria, proteins, and DNAs. The ability to detect single bio-nanoparticles enables observation of biological behavior on an individual level, which allows us to develop effective disease prevention strategies and expand our understanding of the biological world.ProgressIn this review, we systematically demonstrate the manipulation principles of OTFT and its applications in the biological field. In addition, the future development and challenges of OTFT are also discussed. Firstly, we provide a brief analysis of conventional optical tweezers (Fig. 1). Secondly, we demonstrate the basic principles of the common optothermal effects such as thermophoresis, thermoelectricity, electro-thermo-plasmonic flow, natural convection, thermal osmotic flow, depletion forces, and Marangoni convection (Figs. 2-6). Thirdly, we provide an in-depth analysis of OTFT's applications in biomedicine, such as manipulation of nanoparticles (Figs. 7-8), protein molecules (Figs. 9-10), nucleic acid molecules (Figs. 11-13), and sorting of other nano-bioparticles (Figs. 14-18), as well as the sensitizing effect of biosensing (Fig. 19). Notably, the study by Dieter Braun and Albert Libchaber regarding the capture of DNA through convection and thermophoresis in 2002 is often considered a pioneering study in using OTFT for biomolecule capture (Fig. 11). Lately, in 2015, Ho Pui Ho's group in The Chinese University of Hong Kong developed a series of optothermal manipulation schemes to capture nanoparticles or cells (Figs. 7, 15-17). In 2018, Zheng Yuebing's group in University of Texas at Austin utilized surfactants in OTFT to achieve precise manipulation and on-site spectroscopic detection of metal nanospheres (Fig. 8). In 2019, Cichos's group at Leipzig University developed a thermophoretic trapping and rotational diffusion measurement scheme for single amyloid fibrils, which may be useful for understanding neurodegenerative disorders (Fig. 9). In 2020, Ndukaife's group at Vanderbilt University combined OTFT with alternating electric fields to capture and manipulate individual protein molecules as small as 3.6 nm in diameter (Fig. 10). Furthermore, in 2021, Zheng Yuebing's group also accomplished the capture of nanoparticles via opto-refrigerative effect-induced temperature field, thereby avoiding the possible optothermal damage to the captured particles. In 2022, A method for biomolecule enrichment and interaction enhancement was developed by our team using flipped thermophoretic force (Fig. 19). This approach significantly boosted the sensitivity of conventional surface plasmon resonance imaging (SPRI) sensing methods by a factor of 23.6. These typical advances in OTFT technology mark a significant milestone, as they bring about notable enhancements in functionality and broaden the scope of potential applications for OTFT in areas such as nanotechnology and life sciences.Conclusions and ProspectsThe implementation of OTFT relies heavily on various hydrodynamic effects generated by the temperature field and still faces several challenges. Firstly, the temperature gradient may cause some biologically active targets to lose their activity during manipulation. Secondly, various factors, such as ion concentration, temperature, pH value, and type, can easily affect the direction and size of particles driven by the temperature field. As a result, some optothermal tweezers require the addition of surfactants to modify the manipulated targets and achieve controlled particle capture. However, most surfactants are not compatible with biologically active particles and may lead to chemical toxicity or changes in the spatial structure of protein molecules. Additionally, the adsorption of surfactants may change the surface electrical properties of manipulated targets, thereby affecting their physicochemical properties. Thirdly, while OTFT currently utilizes two-dimensional potential wells to capture particles, the construction of spatial three-dimensional potential well capture remains a significant challenge.In terms of future research directions for OTFT, efforts will be made on the development of biocompatible surfactants or the modulation of other environmental factors to achieve controlled and targeted particle trapping, especially in the field of biology. Furthermore, OTFT can be effectively integrated with other fields to address a broader range of issues. For instance, the combination of OTFT with dielectric microsphere-based super-resolution imaging enables large field-of-view imaging via microsphere scanning. OTFT can also be combined with surface Raman-enhanced scattering to enhance its chemical detection performance. In addition, OTFT is expected to be integrated with optical spanners to study the manipulation of the molecular orientation of liquid crystals. It can be anticipated that with the development of research on the light and matter interaction as well as surface chemistry, the optically-induced temperature field optical trapping technology will be further improved and will shine in the fields of biomedical and biochemical detection.
ObjectiveThermal emission is the most critical optical property in thermal radiation. Precise regulation of the thermal emissivity of materials is essential for practical applications of thermally related devices such as energy harvesting, chemical sensing, and dynamic camouflage. Designing micro- or nano-structured metasurfaces is an effective way to modulate spectral emissivity. All-dielectric metasurfaces supporting surface phonon polaritons (SPhPs) can achieve strong light-matter interaction with low optical loss and play an essential role in coherent thermal emission. Among them, silicon carbide (SiC) is a promising candidate due to its rich molecular vibrations and thermal phenomena. Numerous studies have successfully efficiently tuned the coherence of thermal emission by constructing SiC metasurface. However, the physical origin of SPhP emission modes in SiC and their coupling mechanism have not been clearly elucidated yet. In addition, temperature affects the emission properties of the material by changing its optical properties. Still, the current lack of data on the high-temperature dielectric function of SiC is not conducive to further expansion in this direction. Therefore, the physical mechanisms regulating the coherent thermal emission of hexagonal SiC (4H-SiC) all-dielectric metasurfaces are systematically investigated by adjusting the geometric period and temperature.MethodsIn this paper, the ellipsometric parameters ψ and Δ are obtained with the help of IR-VASE Mark Ⅱspectroscopic ellipsometry (SE), and the temperature-dependent dielectric functions (ε=ε'+iε″) of 4H-SiC are derived by fitting the B-spline optical model. The obtained dielectric functions are chosen as input for the finite element modeling (FEM) simulations in the form of interpolation functions. The FEM simulations investigate the emitting mode's quality and the metasurface's thermal emission potential in terms of temperature, incidence angle, and structural period. Absorption energy (W) calculations are used to investigate the absorption mechanism of the metasurface at different geometric periods.Results and DiscussionsFirstly, the dielectric functions of 4H-SiC are obtained experimentally, including anisotropic and temperature-dependent dielectric functions (Fig. 2). The results show that the high temperature reduces the polarization intensity of 4H-SiC. The excitation conditions of the metasurface's emitting modes are obtained with the help of FEM, where the SPhPs mode of the grating structure with a period of P=6.6 μm is excited at an incidence angle of about 7.5° [Fig. 3(d)], and the local surface phonon polarizations (LSPhPs) mode of the micron pillar array with a period of P=3 μm is excited at an incidence angle of about 3° [Fig. 3(e)]. When the period of the micron pillar is expanded (P>5 μm), both SPhPs and LSPhPs modes can be generated together. Figure 5 shows that W of the LSPhPs mode is mainly distributed on the top and bottom surfaces of the column. W tends to be more localized at the bottom as the period increases, and the substrate surface gradually shows the absorption distribution. It is caused by the reduction of inter-column coupling that allows the diffusion of W to be released. The large period increases the spatial coherence of the emissivity (Fig. 6) and the Q-factor of the LSPhPs mode [Fig. 8(a)], while the high temperature decreases the spatial coherence (Fig. 7) and Q-factor of both modes [Fig. 8(b)].ConclusionsIn summary, the effects of geometric period and temperature on the coherent thermal emission characteristics of the 4H-SiC all-dielectric metasurface resonator are systematically investigated by using SE and FEM. The experimental results show that the dielectric function εzof the parallel optical axis in anisotropic 4H-SiC has more robust polarization properties than that of the vertical optical axis εx, and high temperature significantly tunes the dielectric function of the material and reduces its polarization intensity. FEM results indicate that SPhPs induce coupling between optical modes and dominate the modulation of coherent thermal emission, while the zone-folded longitudinal optical phonon (ZFLO) modes contribute a higher Q-factor. In addition, the geometric period positively affects the excitation and coupling of each emission mode, which contributes to the spatial coherence of the emissivity but not the temporal coherence of the ZFLO and SPhPs modes. The high temperatures reduce the coherent thermal emission by weakening the excitation of SPhPs. It is concluded that the low effective propagation length of SPhPs at small periods and high temperatures is the direct reason for the low coherent ability of thermal emission. This work comprehensively reveals the emission characteristics of the 4H-SiC resonators from both geometric design and material properties and guides exploring potential applications of near-field thermal radiation and thermal imaging with high spatial resolution.
ObjectiveColor constancy is a fundamental characteristic of human vision that refers to the ability of correcting color deviations caused by a difference in illumination. However, digital cameras cannot automatically remove the color cast of the illumination, and the color bias is adjusted by correcting the image with illuminant estimation, generally executed by color constancy algorithms. As an essential part of image signal processing, color constancy algorithms are critical for improving image quality and accuracy of computer vision tasks. Substantial efforts have been made to develop illuminant estimation methods, resulting in the proliferation of statistical- and learning-based algorithms. The existing color constancy algorithms usually allow one to obtain accurate and stable illuminant estimation on conventional scenes. However, unacceptable errors may often arise on the low color complexity scenes with monotonous content and uniformly colored large surfaces due to the lack of hints about the illuminant color. To address these problems, this study proposes a color constancy algorithm with ambient light sensors (ALS) to improve the accuracy of illuminant estimation in scenes with low color complexity. This approach leverages the fact that most intelligent terminals are equipped with ALS, and can enhance illuminant estimation accuracy by using ALS measurements alongside the image content.MethodsThe color constancy algorithm proposed in this study comprises two steps. The first step involves evaluating the reliability of the ALS measurement using a confidence assessment model, based on which the illuminant estimation is performed using the appropriate method. The reliability of the ALS is affected by the relative position of the ALS and the light source. Therefore, a bagging tree classifier is trained to serve as the confidence assessment model, with the posture of the camera, the color complexity of the image, and Duv (distance from the black body locus) of the estimated illuminant chromaticity as input parameters. Two illuminant estimation methods are designed for different levels of confidence. When the confidence of the ALS measurement is high, the illuminant estimation is performed by color space transformation from the ALS response to camera RGB via a second-order root polynomial model. This model is trained by minimizing the mean angular error of the training samples. Furthermore, if the ALS measurement has low confidence and the base algorithm has high confidence, illuminant estimation is performed by extracting neutral pixels using a mask determined by the ALS measurement and illuminant distribution characteristics based on the results of the existing neutral color extracting methods (Fig. 2). Finally, if both the ALS measurement and base algorithm have low confidence, the illuminant color is obtained by averaging the results of the two methods mentioned above. To evaluate the proposed ALS based color constancy algorithm (ALS-based CC), a dataset was collected using a Nikon D3X camera mounted with TCS3440 ALS. The dataset includes both conventional and low color complexity scenes from indoors and outdoors (Fig. 5), illuminated by light sources with a wide range of chromaticity (Fig. 4). In each image of the dataset, a classic color checker was positioned as a label, which was masked out during the evaluation.Results and DiscussionsThe confidence assessment model of the ALS is trained and tested using 50 and 20 samples, respectively, collected using the aforementioned setup. It is demonstrated that the confidence assessment model correctly identifies all of the low confidence testing samples, but misjudges some of the high confidence ones (Table 2). The ALS-based CC, whose parameters were determined based on the performance evaluated by statistics of angular error, is executed with Grey Pixels (GP) as the base algorithm for neutral pixel extraction. The performance of ALS-based CC is compared with statistical-based counterparts using the established dataset. The results show that our proposed algorithm outperforms the counterparts in terms of the mean, tri-mean, and median of angular errors among the testing samples, indicating its overall high accuracy. Moreover, ALS-based CC achieves an angular error of less than 5° on the mean of the worst 25% of angular errors, demonstrating its excellent stability even in challenging scenes (Table 3). In terms of the visualization of typical scenes, ALS-based CC accurately estimates the illuminant most of the time, resulting in processed images that are largely consistent with the ground truth. However, all the counterparts perform poorly on some of the scenes with large pure color surfaces, resulting in quality degradation in their corrected images due to significant color bias (Fig. 6). Furthermore, the operation time of ALS-based CC is reduced to 66% of GP on MATLAB 2021b, suggesting its potential for real-time illuminant estimation applications.ConclusionsThis study proposes a color constancy algorithm that integrates the ALS with the camera to improve illuminant estimation accuracy in scenes with low color complexity. The algorithm consists of a confidence assessment model for the ALS and two illuminant estimation methods based on color space transformation and neutral pixel extraction, designed for different confidence levels. Furthermore, a dataset with ALS measurement was established to evaluate the algorithm, and the results show that mean, median, and mean of worst 25% angular errors of the proposed method decrease by 32%, 21%, and 41%, respectively, compared with the existing most accurate method. The proposed algorithm also has a potential for real-time illuminant estimation in both conventional and low color complexity scenes.
ObjectiveMulti-energy computed tomography (MECT) technology uses multiple energy X-rays to scan an object, facilitating energy resolution imaging for material attenuation distribution of the object. In addition, the MECT effectively suppresses hardening artifacts and quantitatively analyzes material components, suggesting its broad application prospects in the field of medical diagnosis. Currently, MECT imaging systems have mainly four scanning schemes: multiple scanning systems, fast rapid voltage switching systems, multi-source systems, and photon counting detector systems. However, these approaches are associated with incomplete data and noise caused by physical effects, such as photon scattering, pulse stacking, and charge sharing. Therefore, there is a need to design efficient and feasible reconstruction algorithms to effectively address the above issues. In this regard, this work proposes a dual plug and play (PnP) framework for MECT image reconstruction algorithm.MethodsIn order to optimize the model design, this work introduces L0 norm regularization in the image gradient domain and tensor weighted kernel norm regularization, which can effectively characterize the priori of MECT images. The regularization of the L0 norm in the image gradient domain expresses the sparsity of the gradient of a single channel image, while the tensor weighted kernel norm characterizes the correlation between multichannel images. Considering the flexibility and efficiency of the PnP framework in various imaging problems, this work proposes an efficient solution method based on the dual PnP framework and the alternating direction multiplier method. To verify the feasibility of the proposed algorithm, this work carried out multichannel photon counting simulation experiments. It also analyzed the performance of the proposed algorithm by adding random noise with different intensities to the projection data obtained under different sampling angles.Results and DiscussionsTwo sets of experiments were conducted on a simulation dataset to verify the performance of the proposed algorithm on incomplete data and noise interference issues. With respect to incomplete data, this work collects projection data from 90 angles within a 360-degree scanning range and adds low-intensity noise to the collected projection data. To address noise interference, this work collects 140 angle projection data within a 360-degree scanning range and adds higher intensity noise to the collected projection data. Considering the noise caused by physical effects, such as photon scattering, pulse stacking, and charge sharing, this work adds random noise to the projection data and sets two different intensities of noise, i.e., 0.024 and 0.055, respectively. To further demonstrate the advantages of the dual PnP spectral CT reconstruction algorithm proposed in this paper, several representative reconstruction algorithms were selected for comparative experiments, namely, SART, ASD-POCS, and SISTER. In case of incomplete data, the proposed algorithm obtains higher quality reconstruction results, which can suppress noise while restoring the precise area of the object with high accuracy; whereas in case of noise interference, the proposed algorithm restores most of the details of the image and achieves higher accuracy reconstruction results than other contrast algorithms. Our findings show that the proposed algorithm outperforms the SISTER algorithm under different sampling conditions and noise levels. In addition, this work further examines the key performance indicators of the proposed algorithm from both the iterative characteristics and computational efficiency. Moreover, the computational efficiency of the proposed algorithm is improved by about three times compared with that of the SISTER algorithm.ConclusionsIn this work, a dual PnP framework MECT image reconstruction algorithm is proposed to reduce radiation dose and improve imaging efficiency. The feasibility of the proposed algorithm was verified using research experiments on incomplete data and noise interference issues. In optimizing the model design, this work introduces L0 norm regularization in the image gradient domain and tensor weighted kernel norm regularization, which can effectively represent a priori of MECT images. The regularization of the L0 norm in the image gradient domain expresses the sparsity of the gradient of a single channel image, while the tensor weighted kernel norm can effectively characterize the correlation between multichannel images. In designing the solution algorithm, this work proposes an efficient solution method based on the dual PnP framework and the alternating direction multiplier method. This method can effectively integrate the tensor weighted kernel norm and the computational method for minimizing the L0 norm in the image gradient domain. Our results show that the proposed method has advantages in imaging quality compared to SART, ASD-POCS, and SISTER algorithms. It also has improved computational efficiency compared to the SISTER algorithm.
ObjectiveThe measurement of the chemical composition of rock and soil on planetary surfaces is of great significance to the study of the composition, geological history, and life information of planets, and it is a basic requirement for planetary exploration. In the deep space exploration missions carried out by humans in the past, chemical composition measurement mainly relies on the Alpha particle X-ray spectrometer (APXS) based on radioisotope activation technology. Although the APXS has been successfully applied, the technology also has shortcomings such as limited types of measurement elements, long spectrum measurement time, and high radiation leakage risks. In recent years, with the rapid development of miniature X-ray source technology, X-ray fluorescence analysis instruments using miniature X-ray tubes as excitation sources are becoming a new generation of in-situ elemental analysis technology in deep space exploration. NASA has successfully used a miniature micro-focus X-ray tube in the X-ray fluorescence spectrometer on the Curiosity Mars rover launched in 2020. In contrast, the research on miniature X-ray sources in China starts relatively late. Limited by the research progress of miniature X-ray sources, there is currently no space X-ray fluorescence spectrometer based on miniature X-ray tubes in China. In order to provide technical support for China's future deep space exploration program, an integrated miniature X-ray source is developed as the excitation source for X-ray fluorescence analysis.MethodsThe integrated miniature X-ray source includes a miniature micro-focus X-ray tube and a miniature high-voltage power supply (HVPS). In view of the requirements of resources and mechanical properties in the aerospace environment, the miniature micro-focus X-ray tube is designed as an end-window transmission-target metal-ceramic X-ray tube using heated tungsten filament. The miniature HVPS is a negative HVPS using a Cockcroft Walton voltage multiplier. Due to the demand for X-ray tubes, isolation transformers for filament power supply and high-voltage feedback circuits have been added. A new type of electrostatic focusing lens used for unipolar X-ray tubes is designed. The passive electron optics design is achieved by shaping of metal components of the tube. The structure of the electrostatic focusing lens includes an electron suppression groove and two orthogonal stacked focusing grooves. The electron suppression groove located under the tungsten wire can absorb the electrons emitted by the tungsten wire towards the bottom, so as to prevent these electrons that are difficult to focus from reaching the anode. The two focusing grooves are located between the filament and the anode. The focal spot size of the electron beam can be adjusted by changing the length and width of the two focusing grooves.Results and DiscussionsThe optimum shape of the metal components of the electrostatic focusing lens is simulated by using charged particle optical simulation software. Finally, when the high voltage is 50 kV, the simulated focal spot size, or the full width at half maximum (FWHM), of 60 μm×227 μm is obtained. The sealed X-ray tube is made after structural processing and vacuum sealing. After that, the X-ray tube and the HVPS are potted in a highly insulating material to prevent arcing (Fig. 5). The size of the developed miniature integrated X-ray source is 118 mm×76 mm×42 mm. An X-ray source performance testing platform is set up. The X-ray energy spectrum test results show that the working voltage of the miniature integrated X-ray source is adjustable between 2-50 kV (Fig. 6). The intensity stability test results show that the output X-ray intensity increases with time, which is mainly caused by the increase in temperature of the miniature X-ray source after working for a long time. During a test lasting for 45 min, the output X-ray intensity instability is 0.30% (Fig. 7). The high voltage instability is 0.21% (Fig. 8). In order to verify the performance of the new electrostatic focusing lens designed in this paper, the focal spot size of the miniature X-ray source is tested by using the pinhole imaging method. The variation of X-ray source spot size with high voltage is similar to the simulation results. When the high voltage increases, the focal spot size decreases. When the high voltage of the X-ray source is 50 kV, the focal spot size (or FWHM) is 177 μm×451 μm (Fig. 9). When the high voltage is 50 kV and the tube current is 50 μA, and the total power consumption of the X-ray source is 5 W.ConclusionsIn this paper, a new type of electrostatic focusing optical structure is proposed. On this basis, a miniature integrated micro-focus X-ray source is developed. The test results verify the performance of the new electrostatic focusing structure and the miniature integrated micro-focus X-ray source. The developed miniature integrated X-ray source can provide load technical support for China's future planetary exploration program. The development of the miniature integrated micro-focus X-ray source is of great significance for China to carry out in-situ analysis of planetary surface material composition. In the future, we will further reduce the size of the miniature integrated micro-focus X-ray source through structural optimization design to meet the needs of different space applications.