


Please enter the answer below before you can view the full text.
3-3=

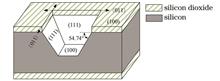
ObjectiveThe echelle grating, with a high spectral resolution and large angular dispersion, is the core component of high-resolution spectrometers. The main preparation method of echelle grating is mechanical holographic lithography combined with ion beam etching and wet etching. The gratings fabricated by the traditional mechanical method have a high cost, a rough groove surface, and a Roland ghost. The holographic lithography combined with ion beam etching can hardly fabricate echelle gratings and has a long production cycle. The wet etching method is a good supplement to the preparation method, and ultraviolet (UV) lithography combined with wet etching has the advantages of few equipment requirements, a low preparation cost, a short preparation period, little stray light, an accurate blazed angle, etc. At present, domestic research on echelle gratings is mostly on the design and application of instruments with echelle gratings. The research on the manufacturing technology of echelle gratings, especially wet etching technology, starts late and has few reports. The diffraction efficiency and groove quality of most silicon-based echelle gratings reported in the existing papers are low, and thus, they cannot be applied in practice. To meet the spectral requirement of the high-resolution spectrometer in near-infrared (NIR) bands (800-1100 nm), this paper chooses the wet-etched silicon echelle grating with an apex angle of 70.52° instead of the traditional echelle grating with an apex angle of 90°. In addition, the factors affecting the quality of the wet-etched grating are analyzed. It is necessary to develop an echelle grating that can meet the requirement of instruments and has high groove quality and practical application capability.MethodsAccording to the crystal characteristics of (100) silicon and grating working conditions given by optical design, the electromagnetic field distribution is solved by the finite-element numerical calculation method, and the diffraction efficiency of working orders is obtained. On this basis, the diffraction characteristics of the silicon echelle grating in the working bands can be analyzed theoretically to obtain the grating factors affecting the diffraction efficiency. In the experiment, the photoresist mask is prepared by UV lithography, and the mask patterns are transferred to the SiO2 layer by inductively coupled plasma etching. Finally, the grating grooves are made by wet etching. After the fabrication of gratings, the diffraction efficiency of gratings is measured by the tunable laser and detector. The roughness of groove surfaces is measured by the three-dimensional (3D) optical surface profiler. The spacing of the grating grooves and the blazed angles are measured by the scanning electron microscope.Results and DiscussionsThe mask collapse problem in wet etching is explained through experiments. It is proposed that during wet etching, samples can be periodically taken out for observation with an optical microscope to prevent the collapse of the mask caused by over-etching. In addition, the etching process can be controlled better by this method to maintain the consistency and repeatability of gratings. The method of pre-etching is applied to the fabrication of silicon echelle gratings, which can improve the precision of crystal alignment to 0.015° and is used to solve the problem of overly large sidewall roughness of silicon gratings. In this paper, the sidewall roughness of the gratings is less than 1 nm, measured by a 3D optical surface profiler in the range of 120 μm×3.5 μm. It lays the foundation for the fabrication of high-quality silicon gratings. Compared with other fabrication methods of echelle gratings, UV lithography combined with wet etching greatly reduces the production cost. Moreover, the fabricated echelle gratings have a smoother groove surface and a more accurate blazed angle.ConclusionsIn this paper, the diffraction characteristics of the silicon echelle grating with a groove density of 42 lp/mm and an apex angle of 70.52° are simulated and analyzed in NIR bands (800-1100 nm). It is known that the width of the platform is one of the main factors affecting the diffraction efficiency, and the diffraction efficiency curves of working orders in the free spectral range have good consistency. A symmetrical V-shaped groove grating with a groove density of 42 lp/mm, a blazed angle of 54.74°, and an effective area greater than 46 mm×28 mm is fabricated on a silicon substrate by UV lithography and the wet etching technique. The key factors affecting the quality of the silicon grating in the fabrication process are analyzed and discussed. The experimental measurement shows that the diffraction efficiency of the grating is 45%-55% at the corresponding blazed wavelength of working orders, which meets the requirement of the index. The main reasons why the measured diffraction efficiency is lower than the design value are discussed, and the value calculated by scanning electron microscope data is analyzed. The successful development of silicon echelle gratings in this paper can verify the feasibility of wet-etched gratings in the formal application.
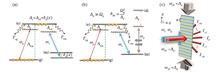
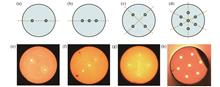
ObjectiveA system with non-Hermitian Hamiltonian commutative with the parity-time operator, proposed by Bander et al., has a real eigenenergy spectrum and some novel properties under certain conditions. Due to the similarity between Schrodinger's equation and the optical Helmholtz equation, the optical system with out-of-phase spatial modulation is a good platform to simulate a system with parity-time (PT) symmetry, which is named the non-Hermitian optical system. In recent years, non-Hermitian optical structures based on discrete systems such as optical waveguide, hybrid optical micro-cavity, electrical circuit resonators, and continuous optical media such as cold atomic ensemble with spatially periodic modulation, have been implemented successively in experimental and theoretical studies. Spectroscopic devices such as diffraction grating have been a significant branch of optical devices since Newton's era. Electromagnetically induced grating (EIG) based on electromagnetically induced transparency (EIT) makes it possible to tune the diffraction patterns dynamically. In recent years, combined with the non-Hermitian optical modulation, many schemes of one- or two-dimensional asymmetric optical diffraction gratings have been proposed successively. However, due to rigid realization conditions of PT symmetry or PT antisymmetry, there is still a great hindrance to realizing precise and flexible dynamic operation, especially for some special optical diffractions. In most previous schemes, dual spatial periodic modulation (via amplitude, detuning of coupling field, or atomic density) has been adopted to achieve two goals, including the realization of PT symmetry or PT antisymmetry and the construction of a grating structure. This results in the lack of accurate modulation capabilities with the protection of PT symmetry or PT antisymmetry. Therefore, a method for preparing non-Hermitian EIG with simple structures easy to analyze, dynamic control ability, and protection of optical non-Hermitian symmetry is necessary and desired.MethodWe consider an ensemble of cold 87Rb atoms driven into a three-level Lambda configuration by two coherent fields with frequencies ωp and ωc. The weak probe field ωp interacts with transition g?e, while the strong control field ωc acts upon transition m?e. The states g and e are coupled by the incoherent pumping Λicp additionally. By periodically modulating the coupling field detuning Δc(x), it is possible to get an asymmetric diffraction pattern in this system.Results and DiscussionsAccording to the study on far-field diffraction characteristics of probe field through the system, some results are as follows. 1) When the parameters are chosen as Δp=-2.27×2π MHz, Δc0=-0.1×2π MHz,δc0=1.0×2π MHz and ψ=0, we can get the PT symmetric susceptibility. Then the modulations for the real part and imaginary part of the susceptibility are out-of-phase, and the lopsided diffraction patterns are shown in Fig. 2(b). 2) When the parameters are chosen as Δp=Δc0=0, δc0=1.0×2π MHz, and ψ=0, we can get the PT antisymmetric susceptibility. The modulations for the real part and imaginary part of the susceptibility are still out-of-phase, resulting in the lopsided diffraction patterns shown in Figs. 3(b1) and 3(b2). 3) With increasing optical depth, the diffracted intensity is transferred from zero order to one order, while with increasing incoherent pumping, the diffracted intensity is transferred from one order to zero order in the PT antisymmetric grating as shown in Fig. 4. 4) The initial phase of coupling field detuning can modulate the diffraction in two ways. The first one is changing the diffraction direction from a negative angle to a positive angle by varying the initial phase of the coupling field detuning from 0 to π. The other one is tuning the diffraction symmetries of the grating. When ψ=mπ, we can get asymmetric diffraction patterns, and when ψ=(2m-1)π/2, we can get symmetric diffraction patterns shown in Fig. 5.ConclusionsWe propose a theoretical scheme of non-Hermitian electromagnetically induced grating based on incoherent pumping. The system consists of an ultra-cold atomic ensemble with the Lambda-type three-level structure and an incoherent pumping field. Combined with incoherent pumping, non-Hermitian symmetries of the system including optical PT symmetry and PT antisymmetry under the single spatial period modulation can be implemented. During the research on far-field diffraction characteristics of probe field through the system, we can draw the following conclusions. First, a switch between different non-Hermitian optical symmetries can be attained by controlling the detuning of the coupling field. Secondly, the diffraction efficiency is effectively modulated by incoherent pumping at a constant optical depth, which introduces a new degree of freedom of grating manipulation. In addition, tuning the initial phase of coupling field detuning can effectively modulate the diffraction symmetry and diffraction pattern of the system. The theoretical results not only can facilitate the research and development of non-Hermitian optics and scattering-type all-optical devices but also can be applied in quantum optics and quantum information processing.
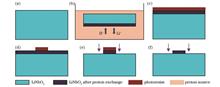
ObjectiveLithium niobate (LN), as a key material in the photonic industry, exhibits a strong electro-optic (EO) effect, a large nonlinear optical coefficient, and chemical stability. Traditional LN waveguides are usually prepared through titanium (Ti) diffusion or proton exchange. Ti diffusion exchange causes an increase of 0.001-0.04 in the refractive index, which depends on Ti density, diffusion time, and temperature. Proton exchange can give rise to a change in the refractive index of up to 0.12. These waveguides have the disadvantage of low refractive index contrast between waveguide and cladding, which leads to weak optical constraints, a large mode area, and a millimeter-level bending radius. This is the major limitation of conventional bulk LN for broad applications with a large amount and a small size of LN chips. Therefore, it is necessary to develop a method with a low-cost wafer and high-index-contrast waveguide, which is also the main objective of this work.MethodsThis study mainly presents the theory and simulation. The LN material is chemically inert, and therefore, it can hardly be etched without any pre-treatment. In addition, mechanical processing of the LN material is also difficult to proceed due to its high hardness and wear resistance. It is worth noting that during the proton exchange reaction, ions diffuse into the LN substrate to exchange ions, which leads to the occurrence of phase transition and structural defects, and thus, the proton exchange region can be easily etched. Therefore, we present a process scheme combining proton exchange technology with etching technology. The LN substrate is submerged in the proton source at a high temperature for a long time to assure that the depth of the proton exchange should be equal to the required height of the waveguide at least. After the proton exchange, samples are etched by methods such as wet etching and plasma etching, and the waveguide is retained. The feasibility of the process is verified by simulations. Moreover, the proton exchange depth, etching width, and sidewall angle are changed to optimize the waveguide width of the bulk LN platform.Results and DiscussionsThe experimental result demonstrates that the waveguide prepared with 1% diluted melt at 300 ℃ for 72 h can increase ne by 0.08 at 1550 nm. We initially set the Δne to 0.08. The effective mode area under different diffusion depths is shown in Fig. 2. The minimum area is about 14.5 μm2 when the diffusion depth is 2.4 μm. The etched waveguide shows its superiority in reducing width (Fig. 3), and the effective mode area in the waveguide can be reduced to 6.7 μm2 by etching. Although the waveguide is decreased to 4.2 μm, it is still large compared to that of other material platforms. We can further reduce the waveguide size by increasing Δne. Δne of LN after proton exchange is set to 0.1 at 1550 nm according to theoretical research. With the growth of the diffusion depth, the effective mode area also changes (Fig. 4). The minimum effective mode area is about 7 μm2 when the diffusion depth is 2 μm. To verify the advantage of the fabrication process mentioned above, we set the height of waveguides to 2.8 μm. Under the same temperature, the proton exchange depth we set can be realized by proton exchange time expansion. Considering the non-vertical sidewalls produced by the etching of LN, the angle of the tilted sidewall is 85°. When the width of the waveguide is 2.4 μm, the waveguide has the strongest ability to confine the light field (Fig. 6). Compared with the case of an unetched waveguide, increased etching can effectively reduce the width of the waveguide. In addition, as many parameters can be optimized, we use particle swarm optimization (PSO) to design the waveguide size reversely. A set of these parameters that can realize the strongest confinement of the optical field is selected with the assistance of PSO. Here, the figure of merit (FOM) is defined as the effective mode area. The optimization is conducted via Lumerical Mode Solutions. The simulations show that the lowest waveguide width is 2.5 μm, and the bending radius is reduced to the level of hundreds of microns, which greatly lessens the size of bulk LN devices. Wavelength-division multiplexing (WDM) devices are one of the key components for optical communications. As a planar waveguide component based on optical integration technology, an arrayed waveguide grating (AWG) has the advantages of high integration and low loss compared with the traditional dielectric filter. Hence, it is widely used in the optical interconnection of data centers. On the basis of the proposed process scheme, an AWG with a center wavelength of 1550 nm, four channels, and channel spacing of 400 GHz is designed. The footprint of the device is 850 μm×620 μm, and the transmission loss of the AWG is about 6 dB, as shown in Fig. 10. Since the waveguide spacing is set to be larger than 4 μm to avoid the crosstalk from the adjacent waveguides, light cannot enter the arrayed waveguides from the input coupler completely, which causes loss (Fig. 10). The crosstalk between adjacent channels is all lower than 22 dB, which further verifies the feasibility of this scheme.ConclusionsIn this paper, a method for fabricating AWGs over the bulk LN substrate is presented. The design of a four-channel CWDM AWG is investigated with a reduced cost due to the use of bulk LN, which proves that this process can reduce the size of the optical devices on the bulk LN platform.
ObjectiveThe popularization and application of multi-core fiber cannot be realized without integrated devices with various functions. Therefore, how to build micro-optical devices with higher integration, better performance, and richer functions in a single multi-core fiber has become a research hotspot in recent years. This paper proposes a diagonal core reflection coupler based on multi-core fiber, which can connect the optical path of the diagonal core with an arcuate shape frustum on the multi-core fiber tip.MethodsThe proposed diagonal core reflection coupler is suitable for multi-core fibers with centrosymmetric core distribution (Fig. 1). With seven-core fiber as an example, after the end of the fiber is fused with a short coreless fiber, a 45° frustum is prepared by precision grinding, as shown in Fig. 2 (a). The frustum can realize the connection of three pairs of diagonal core optical paths. For example, the light in the fiber core a can be reflected twice through the surface of the frustum with a base angle of 45° and then transmitted in reverse to the fiber core b, and vice versa. When the beam leaves the core a and enters the coreless fiber, diffraction diffusion will occur. Then a large part of the beam cannot be coupled into core b after it is reflected twice by the 45° frustum. To illustrate the diffraction divergence of the beam during reflection, this paper builds a three-dimensional optical model as shown in Fig. 2 (c) through the finite-difference time-domain method for core spacing d=38 μm, and five key monitors are constructed along the beam propagation path. The monitor can provide feedback related to the optical field distribution of the section at this position, and the results are respectively displayed in Fig. 2 (d)-(h). The monitor M3 shows the light field distribution of two symmetrical side core profiles in Fig. 2 (b). Serious diffracted beam does occur during transmission and reflection. The light field is matched as much as possible with the fundamental mode field of core b, the coupling efficiency when the beam is transmitted to core b is improved, and the 45° frustum at the fiber end is optimized by an arc melt-shaping method to improve the divergence effect of the beam in the xoz plane. As shown in Fig. 3 (a) and (b), if the reflecting interface of the frustum is arcuate, the beam emitted from core a will have a focusing effect after being reflected at point A. Since cores a and b are symmetrical, when the focusing and divergence effects offset each other, the beam can be efficiently coupled into core b after the second reflection. Paraboloid is selected as the optimized shape, and the general shape function Eq. (1) is obtained.Results and DiscussionsThe 45° frustum is prepared by precision grinding of the fiber end, and the arcuate shape frustum is prepared by the arc melting shaping method. Then the shape outline of the arcuate shape frustum is extracted and compared with the theoretical design. The tests indicate that the reflection coupling efficiency of the arcuate shape frustum is improved from 61.1% of the 45° platform before optimization to 72.6%, showing an obvious optimization effect. Finally, this paper discusses two important factors that affect the coupling efficiency in the preparation of a diagonal core reflection coupler, including the core shift of the multicore optical fiber and the base angle shift of the frustum. The results reveal that the arcuate shape frustum can provide greater tolerance in the preparation.ConclusionsIn this paper, a diagonal core reflection coupler on multi-core fiber tip is presented and optimized to realize the low loss connection of the optical path of multi-core fiber symmetric core. The device is designed to fabricate a reflection frustum at the end of a multi-core fiber by the precision grinding method. The surface shape of the 45° frustum is optimized by an arcuate shape frustum to improve the coupling efficiency of the diagonal core and reduce the insertion loss. Through the finite-difference time-domain method, the three-dimensional models of the 45° frustum and the arcuate shape frustum are built respectively. The results show that the optimized arcuate shape frustum has better preparation tolerance and performance than that before optimization. By precision grinding and arc melting optimization, the 45° frustum and the arcuate shape frustum are fabricated successfully, and the insertion loss test results are basically consistent with the simulation results. This kind of device realizes low loss connection of multi-core fiber diagonal fiber core, and the whole device is prepared on the fiber end of the fiber with a compact structure, which can be employed in Raman distributed temperature measurement, especially in the case of narrow space such as oil field and oil wells.
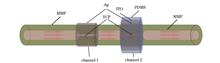
ObjectiveRefractive index (RI) measurement plays an important role in many fields, especially in medical diagnosis, industrial manufacturing, and food safety. The fiber-optic surface plasmon resonance (SPR) sensor has attracted much attention from researchers owing to its advantages of small size, compact structure, high sensitivity, and strong anti-electromagnetic interference. It is highly sensitive to changes in the external environment due to its high sensitivity. The cross-sensitivity of the fiber-optic SPR sensor to the RI and temperature limits the accuracy of the sensor. Therefore, research of a RI sensor with temperature compensation has certain practical significance. Some researchers used different grinding angles to produce different SPR phenomena and achieved temperature compensation by combining different grinding angles. Nevertheless, the sensors that they adopted were complicated to manufacture and could not be mass-produced. Others have proposed temperature compensation through fiber Mach-Zehnder (M-Z) interference, fiber Fabry-Perot (F-P) interference, and the combination of fiber Bragg Gratings (FBGs) with the SPR effect. However, this kind of SPR sensor with temperature self-compensation often needs two demodulation systems, and the demodulation process is relatively complicated. This study proposes and implements a cascaded fiber-optic SPR RI sensor with temperature self-compensation readily available for the simultaneous measurement of the RI and temperature to achieve the purpose of temperature compensation.MethodsIn the cascaded fiber-optic SPR RI sensor with temperature self-compensation, thin-core fiber is used to obtain a multimode fiber-thin-core fiber-multimode fiber (MMF-TCF-MMF) structure, and the cascade mode is adopted to achieve dual-channel sensing. When the light is transmitted from the MMF to the TCF, part of the light leaks to the TCF cladding due to fiber core mismatch. The evanescent wave generated immediately penetrates the metal film and reaches the interface between the metal and the medium to be measured, triggering electronic oscillation on the surface of the metal film. Surface plasma is thereby generated. In this process, a kind of transverse magnetic wave (p-polarized light), namely, a surface plasmon wave, propagates along the interface of the medium. As a result, the SPR phenomenon occurs. Channel 1 is obtained by coating the TCF with a silver film, while channel 2 is composed of another section of TCF coated with a composite film (Ag-ITO) and a thermosensitive polydimethylsiloxane (PDMS) film. The two channels are cascaded together by welding technology. The PDMS coating not only prevents the ambient RI from contacting the metal film but also has a thermo-optical effect. When the external temperature changes, the RI of the PDMS changes accordingly, causing a resonant wavelength shift. Temperature measurement can thereby be achieved. In summary, channel 2 is insensitive to changes in the RI, while channel 1 is sensitive to changes in both the RI and temperature. Finally, the sensitivity matrix is used to calculate the changes in the RI and temperature and study to achieve the purpose of temperature compensation. To verify the accuracy of the sensor matrix, this ultimately changes temperature and the RI simultaneously and obtains their changes from the changes in the two resonant wavelengths. The set standard values are used to analyze the errors in the experimental results. The analysis shows that the error of channel 1 under RI changes is 0.2%, and that of channel 2 under temperature changes is 1.3% (Fig. 7). Clearly, the sensor matrix has certain practicability.Results and discussionsAt the same temperature of 40 ℃, the ambient RI ranges from 1.333 to 1.357 RIU, and the transmission spectrum changes are tested (Fig. 6). As the ambient RI increases, the resonant wavelength corresponding to channel 1 gradually red-shifts, while the one corresponding to channel 2 is almost constant because the temperature remains unchanged. The RI sensitivities of channel 1 and channel 2 are 3 141.85 nm/RIU and 0 nm/RIU, respectively. After deionized water is dribbled onto channel 1 of the sensor, the sensor was placed on a small heating table to increase its temperature from 40 to 80 ℃, and the transmission spectrum is recorded every 10 ℃ (Fig. 6). Due to the high thermo-optical effect of the PDMS, its RI decreases as temperature rises. As a result, the resonant wavelength corresponding to channel 2 blue-shifts significantly. Moreover, since the RIs of water and optical fiber change with temperature, the resonance wavelength corresponding to channel 1 blue-shifts slightly. The temperature sensitivities of channel 1 and channel 2 are -0.07 nm/℃ and -1.74 nm/℃, respectively.ConclusionsThis study proposes and experimentally verifies a cascaded fiber-optic SPR RI sensor with temperature self-compensation. The proposed sensor can measure the RI and temperature simultaneously to achieve the purpose of temperature compensation. It has a dual-channel cascaded MMF-TCF-MMF-TCF-MMF-MMF structure. Channel 1 is obtained by coating TCF with a 50 nm Ag film and is sensitive to the ambient RI and temperature. Developed by coating TCF with a composite film of 50 nm Ag and 30 nm ITO and another layer of PDMS film, channel 2 is only sensitive to ambient temperature. The sensor measures RI and temperature simultaneously to achieve temperature compensation and reduce the temperature crosstalk in RI measurement. The length of the TCF is about 10 mm. The RI sensitivity is as high as 3141.85 nm/RIU in the RI range from 1.333 to 1.357 RIU, and the temperature sensitivity can reach -1.74 nm/℃ in the temperature range from 40 to 80 ℃. In addition, the experimental results reveal that the crosstalk between the two sensing channels is negligible. With the advantages of simple manufacture, low cost, and stable structure, the proposed sensor has potential practical value in the fields of environmental monitoring and biochemistry.
ObjectiveOFDM-OQAM involves special modulation and demodulation methods, owing to which offers several advantages, including flexible time-frequency lattice, very low out-of-band spectral leakage, and excellent spectral efficiency. Presently, it is widely applied in fields such as wireless communication and optic-fiber communication. In the past, several frequency-domain channel estimation methods have been proposed for CO-OFDM-OQAM. However, these methods are associated with various drawbacks. For instance, more guard intervals need to be inserted between the training sequence and payload to reduce the influence of inherent imaginary part interference (IMI), which can lead to excessive spectrum resources. Thus, this work proposes and studies an improved frequency-domain channel estimation method for PDM CO-OFDM-OQAM systems. The proposed method remarkably enhances the spectrum efficiency and does not severely degrade the power peak-to-average ratio (PAPR) of the signal.MethodsA fully-loaded training sequence was designed using real-valued pilots based on the demodulation principle of a polarization multiplexing system and the symmetry rules of an inherent imaginary interference. This method was combined with the interpolation method to ensure that number of frequency-domain symbols to be occupied by the training sequence on each polarization state was reduced to four. The training sequence and the payload at the transmitter's end form a data frame, which assist in generating a baseband transmission signal. The training sequences of x-polarized and y-polarized states occupied four frequency-domain symbols and the real-valued pilots were placed in the 2nd and 3rd frequency-domain symbols. All the odd-numbered subcarriers of the x-polarized state were zero, while the even-numbered subcarriers were not zero. In contrast, the odd-numbered subcarriers of the y-polarized state were not zero, while all the even-numbered subcarriers were zero. For convenience, we denoted the transmission training sequences in the x- and y- polarized directions as [z,px1,px2,z] and [z,py1,py2,z], respectively. These transmission sequences satisfy the given symmetry conditions. The channel frequency response coefficients at the receiver's end for a portion of the subcarriers were estimated using the analytical formula. Alternatively, the channel response coefficients for other even and odd subcarrier positions were calculated using the interpolation method. Finally, intra-symbol frequency-domain average (ISFA) was used to lessen the influence of noise and interference and to further improve the channel estimation accuracy. In addition, the PAPR values of PDM CO-OFDM-OQAM were calculated using different channel estimation methods.Results and DiscussionsIn this paper, a numerical simulator for a polarization multiplexing CO-OFDM-OQAM system is developed. By using the simulator, the spectral efficiency, peak-to-average power ratio, and channel estimation performance of the method have been verified under three scenes of back-to-back (BtB), 100-km, and 200-km fiber transmissions. Our findings reveal that E-IAM-C method has the greatest impact on the PAPR performance of the system, while the proposed method has the least impact. Furthermore, the investigation of channel estimation performance of the proposed method in the BtB case reveals that the BER of the proposed method after 10 cycles of ISFA shows better results than that of the interference approximation method using real-valued pilots (IAM-R) in the OSNR range under investigation (10 dB-30 dB). This work also focuses on the channel estimation performance of the proposed method in nonlinear fiber channels. Overall, our results demonstrate that the proposed method provides an efficient channel estimation capability in both linear and nonlinear fiber channels.ConclusionsThis work proposes and studies an improved frequency-domain channel estimation method for PDM CO-OFDM-OQAM systems. The main advantage of this method is that it only requires four frequency-domain symbols for the training sequence of each polarization branch. Compared with IAM-R and the E-IAM-C method that uses complex pilots, number of symbols occupied by the training sequence of the proposed method is reduced by 33.3% and 50%, respectively. Thus, the proposed method substantially improves spectral efficiency. In addition, in the proposed method, the real-valued pilot is a random sequence, which does not worsen the PAPR of the signal. The channel estimation capability of the proposed method is verified quantitively in an actual fiber channel by considering the effects of fiber dispersion, polarization mode dispersion, and nonlinearity. Moreover, the results show that the proposed method achieves better BER performance even for nonlinear fiber channels. The findings of this work provide useful insights into the research and development of short-distance fiber communication systems based on OFDM-OQAM.
ObjectiveWith the continuous progress in science and technology, the performance of time and frequency standards have been constantly improved, which brings about higher requirements for the accuracy of time and frequency transfer technology. Optical fiber has the advantages of low loss, large bandwidth, high stability, and resistance to electromagnetic interference, and optical fiber networks have spread all over the world. Optical fiber time transfer has been recognized as an effective solution to long-distance and high-precision time transfer. When optical fibers reach a certain length, the regeneration and amplification of signals must be installed for boosting the signals' amplitude. Additionally, optical amplifiers will lead to asymmetric bidirectional transmission delays, and complex delay calibration must be carried out to meet the requirements of high-precision time transfer. At the same time, the signal-to-noise ratio (SNR) will gradually deteriorate with the increasing transmission distance, which will reduce the stability of time transfer. Based on the high sensitivity of single photon detectors, this paper proposes a non-relay long-distance optical fiber time transfer scheme based on single photon detection. The scheme not only does not require link calibration, which reduces the complexity of the experiment, but also ensures the symmetry of bidirectional transmission delays to improve the accuracy of time transfer. The dynamically adjustable external trigger control system is designed and implemented to achieve the gating mode of single photon detectors with low dark counts. Consequently, the detectors can continuously detect the time signals without the effect of transmission delay variations of the optical fiber link.MethodsOptical fiber time transfer mainly includes one-way and two-way methods, and this paper adopts the two-way method to design the experimental scheme. The scheme employs the laser pulse sequence controlled by the local (remote) 1 pulse/s time signal as the transmission signal and utilizes single photon detectors with extremely high detection sensitivity to receive the signals arriving at the remote (local) site. It is unnecessary to install optical amplifiers or perform link calibration. The system adopts the bidirectional time-division multiplexing time comparison method over a single fiber with the same wavelength. According to the time-correlated single-photon counting method, the two-way variations at both the sites obtained per second are counted separately. Then the statistical values of the two-way variations with the maximum probability per second are obtained by the Gaussian fitting method. Finally, the time transfer stability (time deviation, TDEV) of the clock difference between both the sites is acquired. The ambiguity of the integer number of the pulse periods of the clock difference can be calibrated by other methods such as GPS or Beidou satellites. In addition, the gating signal is dynamically adjusted to ensure that the optical pulses arriving at the single photon detector always appear in the gating signal.Results and DiscussionsThe Gaussian fitted values of the variations for the two-way transmission delays of the optical link are obtained to verify the effectiveness of the trigger control system of the single photon detector, which proves that the system can work normally (Fig. 5). The changes of these values of the variations for two-way transmission delays during the test time of 47137 s have the same trends over time. Because the sending and receiving delays of signals between the local and remote sites are not exactly the same, there is a difference of about 6.7 ns between the two-way Gaussian fitted values at the same time (Fig. 6). The results of the bidirectional comparison and TDEV of the bidirectional comparison are acquired by the two-way Gaussian fitted values (Fig. 7). The peak-to-peak value of the fluctuation is no more than 30 ps. The TDEV of the bidirectional comparison, which is the TDEV of the clock difference between both the sites, is better than 1.5 ps@1 s (short-term stability) and 0.4 ps@8192 s (long-term stability). Since the symmetry of the bidirectional transmission delays can greatly reduce the effect of the environment on transmission delays of the optical fiber link, the long-term stability of the bidirectional comparison is optimized by three orders of magnitude compared with that of the free-running mode. However, the changes in the delay of the outside of the loop signal can bring about the asymmetry of the bidirectional transmission delays, thus resulting in slight deterioration of the stability after 2048 s.ConclusionsIn this paper, a long-distance optical fiber time transfer system is designed based on single photon detection and bidirectional time-division multiplexing transmission over a single fiber with the same wavelength. Owing to the extremely high detection sensitivity of the single photon detector, it is unnecessary to adopt optical amplifiers in the optical fiber link. While the high symmetry of the bidirectional transmission delays is guaranteed, the effect of the backscattering on the time signals transmitted is effectively suppressed, thus improving the received SNR. Experimental results of the optical fiber link of 350 km show that the TDEV of the bidirectional time comparison is better than 1.5 ps@1 s and 0.4 ps@8192 s, providing an effective solution for long-distance and high-precision optical fiber time transfer. In conclusion, the asymmetry of the bidirectional transmission delays caused by the delay changes of the outside of the loop signal affects the long-term stability. The noises accumulated during sending, transmitting, and receiving the time signals affect the short-term stability. The compensation effect of the dispersion compensation fiber, the width of the single photon Gaussian distribution received, and the time resolution of the single photon detector all influence the overall stability. The dispersion can be adjusted accurately by adjustable dispersion compensation fiber, thereby improving the system stability. The experimental results show that the time transfer distance of the scheme is much longer than that of quantum time transfer, and the stability is better than those of some traditional optical fiber time transfers with a similar or shorter transfer distance.
ObjectiveTunable diode laser absorption spectroscopy (TDLAS) plays a key role in non-contact gas measurement, particularly under harsh environmental conditions, such as at high-temperature, and high-pressure situations. The emission of a tunable diode laser in a typical TDLAS system usually propagates in the free space and reaches the measurement zone. Such configuration inevitably suffers the natural diffraction of laser beams, which leads to a dramatic decrease in signal-to-noise ratio for remote measurement. In this case, the application of optical fibers provides a flexible way of delivering laser beams for TDLAS measurement, indicating excellent adaptability. However, under the mid-infrared length of no less than 2 μm, phonon absorption of fused silica will increase the material loss of silica glass optical fibers and reduces their long-distance transmission ability. Benefiting from the low material absorption, fluoride glass fibers based on ZBLAN and chalcogenide glass fibers based on As2S3 have become the main optical fibers operating at mid-infrared wavelengths. Unfortunately, such soft glass fibers have disadvantages including poor thermal stability, unstable chemical properties, and difficult preparation. Additionally, nearly all commercial fluoride and chalcogenide fibers on shelves are multimode fibers (MMF), which results in modal interference and poor laser beam quality, thereby leading to degraded TDLAS measurement performance. As a kind of hollow waveguide developed early for transmitting mid-infrared to far-infrared wavelengths, Capillary waveguides have been employed instead of soft glass fibers in high-temperature flow field detection due to their advantages of high-power threshold, low nonlinearity, and no-end reflection. However, they usually suffer high leakage losses and bending sensitivity. Anti-resonant hollow core fiber (AR-HCF) is a new type of microstructure hollow core fiber that features low loss, wide transmission bandwidth, and single mode transmission. AR-HCF is a novel transmission medium suitable for low-loss single mode transmission in the mid-infrared wavelength range, which has been successfully applied in high-power laser energy transmission, gas fiber laser technology, and other fields. Currently, the quartz-based AR-HCF exhibits lower transmission loss in the 2-5 μm range compared with commercial multi-mode fluoride fibers, demonstrating its enormous potential in mid-infrared region transmission. Moreover, due to the inherent advantages of quartz materials, mid-infrared quartz-based AR-HCF features excellent mechanical strength, physical and chemical stability, and good environmental adaptability. This paper constructs TDLAS systems based on AR-HCF and ZBLAN fibers respectively to carry out a combustion diagnostic by the high-temperature water vapor absorption at 2.5 μm. Unlike commercial fluoride and chalcogenide optical fibers, the AR-HCF is characterized by low loss and single-mode transmission in a broad spectral window from deep ultraviolet to mid-infrared. The TDLAS system is demonstrated to be capable of avoiding inter-modal interference that degrades measurement accuracy.MethodsIn this paper, the stack-and-draw method is employed to fabricate the AR-HCF operating at mid-infrared wavelengths. Firstly, some thin-wall capillaries are drawn from a silica glass tube. Then, the capillaries are stacked into a jacket tube to form a pre-designed structure. Next, the stack is drawn into preforms and then fiber, and a cut-back method is adopted to measure the transmission loss of the fiber. The transmission characteristics of fiber are also investigated numerically by COMSOL and the ability of low loss and single mode transmission in the AR-HCF is confirmed. Two TDLAS systems are built based on the homemade AR-HCFs and ZBLAN fibers respectively. The beam and spectrum of the system are collected through a pyroelectric array camera and photodetector. Analysis of the beam quality and signal-to-noise ratio for both systems exhibits the advantages of the AR-HCF-based TDLAS system. Additionally, the accuracy of the system is improved by evacuating the water vapor inside the AR-HCF.Results and DiscussionsThe AR-HCF transmission band prepared in this paper is between 2.4-2.5 μm, and the loss at 2.5 μm is 0.06 dB/m (Fig. 3), which is lower than commercial fluoride glass fibers. Furthermore, COMSOL is adopted to build the AR-HCF mode. The simulation results show that the strong coupling between the second-order mode in the core and the modes in cladding holes results in energy leakage and high loss, thus enhancing the single-mode performance of the fiber (Fig. 4). With these advantages of AR-HCF, TDLAS system is preferred to be employed rather than free space. This paper leverages the homemade AR-HCF in the TDLAS system successfully to realize a signal-to-noise ratio of 31 dB (Fig. 9), which can output a collimated near-diffraction-limited beam with a measured diameter of 2.5 mm (Fig. 8 and Table 1) and divergence angle of 0.004 rad. The influence of residual water vapor in the hollow core of AR-HCF on the measurement of 4029.52 cm-1 absorption line is studied, and the accuracy of the system is further improved by vacuuming the AR-HCF (Fig. 10).ConclusionsThis paper presents an AR-HCF-based TDLAS system and compares the performance of self-developed AR-HCF and commercial ZBLAN fiber in the high-temperature water vapor absorption measurement by TDLAS. Simulation and experimental results prove that the AR-HCF can achieve long-distance, low-loss, and single-mode transmission at 2.5 μm. The TDLAS system based on AR-HCF fundamentally eliminates multi-mode interference and has the advantages of the small beam diameter, small divergence angle, and high signal-to-noise ratio. The impact of residual trace water vapor in the AR-HCF on the measurement of the 4029.52 cm-1 spectral line is also analyzed and the measurement accuracy of the system is improved by vacuuming it. This paper also designs and experimentally studies the mid-infrared TDLAS system based on AR-HCF. Finally, the system is confirmed to have the advantages of low transmission loss, long transmission distance, high laser beam quality, and high signal-to-noise ratio, which provides a new method for flow field detection in the mid-infrared band.
ObjectiveThe traffic on the data center network is mainly composed of intra-rack traffic, inter-rack traffic, and inter-data center traffic. The internal power consumption, equipment cost, and network congestion of the data center cannot be ignored. How to solve these problems has become a solution proposed by the main research. Using the interleaved filter range and subsequent received signal operation, a few fixed receivers (FFs) can receive multiple signals of arbitrary wavelengths at the same time, effectively reducing the cost. However, with the increase in the total number of wavelengths in the arrayed waveguide grating (AWG), the number (F) of FFs and receivers required by each node also increases, which will make a large number of receivers idle. Here we propose a scheme consisting of a tunable filter (TF) and a small number of FFs. This scheme can effectively reduce the number of filters and receivers required, save equipment costs, reduce equipment power loss, and improve signal demodulation efficiency.MethodsDue to the cyclic wavelength routing feature of N×N AWG, each node can send signals to any other node through the wavelength tunable transmitter (WTT), so multiple nodes may send data to the same destination node. The relationship between node and transmission wavelength λ(j-i)modN+1 is that node i sends data to node j. For example, node 1 sends data to node 2 (node N) through λ2 (λN) (Fig. 1). In the rack of the data center, one AWG is connected to N servers, and the remaining one interface is used for signal communication inside and outside the rack. At a certain time, if servers 1, N-2, N-1, and N want to send data to server 2 at the same time, they will adjust their laser wavelengths to λ2, λ6, λ5, and λ4. After the signal is modulated by the Mach-Zehnder modulator, it enters the AWG. By using the AWG wavelength routing characteristics, each wavelength signal will be routed to the receiving end of server 2. The receiver of server 2 filters a wavelength of λ2 through a TF and then sends the mixed signal of the remaining three wavelengths to the filter matrix for signal recovery (Fig. 2). The filtering range of each filter forms a receiver matrix. Whether each wavelength can be filtered corresponds to a column of the matrix, and the wavelength that each FF can filter corresponds to a row of the matrix. Specifically, 1 represents that the filter can filter the wavelength, and 0 indicates that the filter cannot filter the wavelength (Fig. 3).Results and DiscussionsWhen the transmission rate is 10 Gbit/s, the receiving sensitivity of the pure FF scheme (optical power of error-free transmission) is -7.1 dBm. The receiving sensitivity of the TF+FF scheme proposed in this study is -8.3 dBm, and the difference in optical receiving power is 1.2 dBm. When the transmission rate is 40 Gbit/s, the receiving sensitivity of the pure FF scheme is -3 dBm, and that of the TF+FF scheme is -3.8 dBm. The difference in optical receiving power is 0.8 dBm (Fig. 4). When pure FF reception is adopted, the receiving sensitivity of the scheme at a transmission rate of 10 Gbit/s is -8.2 dBm, and the receiving sensitivity of TF+FF scheme is -10.3 dBm. The optical receiving power difference between them is 2.1 dBm. When the transmission rate of 40 Gbit/s is adopted, the receiving sensitivity of the pure FF scheme is -4.7 dBm, and that of the TF+FF scheme is -6.3 dBm. The difference in optical receiving power is 1.6 dBm (Fig. 5). When the number of signals arriving at the same time is 2, and the transmission rate is 10 Gbit, the receiving sensitivity of the two schemes is -10.3 dBm and -15.4 dBm, and the difference in their optical receiving power is 5.1 dBm. When the transmission rate is 40 Gbit/s, the receiving sensitivity of pure FF scheme is -6.6 dBm, and that of the TF+FF scheme is -12.6 dBm. The difference in optical receiving power is 6 dBm. Our new TF+FF scheme can more effectively improve signal quality and reduce the bit error rate (BER). When the number of wavelengths arriving at the same time is less, the improvement of signal quality of the new scheme is more obvious (Fig. 6). When the second generation hard decision forward error correction coding (FEC) limit (BER is 3.8×10⁻³) is reached, for the combination of two, three, and four wavelengths, the receiving sensitivities are -22.3, -19.8, and -16.5 dBm, respectively. The differences in optical receiving power are 2.5 and 3.3 dBm. After equalization, the receiving sensitivities are -22.9, -21.6, and -19.0 dBm for the combination of different wavelengths, and the differences in optical receiving power are 1.3 and 2.6 dBm, respectively (Fig. 8).ConclusionsAn improved multi-wavelength reception scheme is proposed. On the basis of AWG optical interconnection, the data center adopts a scheme involving a TF and several FFs at one receiving end, which can optimize the simultaneous received wavelength signal from four channels (M=4) to three channels (M=3). The difference between the number of filters required for demodulation in these two cases increases with the increase in the total number of wavelengths in the data center. The simulation results show that the improved scheme proposed in this study can significantly improve the signal quality, especially when the number of wavelength signals arriving at the same time is small. By calculating the power loss, it is concluded that the improved scheme under 10 Gbit/s can support the transmission of up to 100 wavelengths in the data center. This scheme can significantly reduce the number of FFs and their connected receivers by adding only one TF and can effectively reduce the equipment cost and the number of idle filters and receivers.
ObjectiveMicrowave photonic channelization technology converts broadband microwave signals to the optical domain for processing, breaking through the bandwidth limitations of conventional electronics. In general, external intensity modulation based on the Mach-Zehnder modulator (MZM) is employed in microwave photonic channelized links. However, due to the intrinsic cosine response of MZM, several nonlinear distortions occur in the process of electro-optical conversion, including harmonic distortion, intermodulation distortion (IMD), and cross-modulation distortion (XMD). Since the harmonic components can be effectively removed by filters, the IMD and XMD will become the main factors limiting the system's performance. Numerous electronic and optical methods have been proposed to compensate for the IMD in conventional narrow-band links, but they are incapable of suppressing the XMD. In this study, we propose a nonlinear distortion compensation scheme based on digital domain iteration processing, which can suppress the IMD and XMD simultaneously. Moreover, compared with the previous linearization methods, the proposed scheme does not require the construction of complex compensation function models or the introduction of additional hardware devices.MethodsTheoretical analysis shows that an approximate equation can be established between the distorted intermediate frequency signal output and the linear one from each channel. The iteration process can be utilized to approach the linearized output. Specifically, the distorted output in each channel can be selected as the initial value for the first iteration. The initial value is first squared and processed by low-pass filtering. Then, it is split into two paths that are processed by different operators. Finally, the results of the different channels processed by the operator are multiplied, and the distorted output is divided by them to obtain the result of the first iteration. Similarly, the output result of the first iteration can be used for the second iteration. Therefore, the digital compensation algorithm based on iteration can gradually convert the distorted output into a linear result.Results and DiscussionsA simulation experiment is built to verify whether the simulation results are consistent with the theoretical derivation results. The signal spectra before and after the digital compensation algorithm processing are presented (Fig. 3). It can be found that rare times of iterations are sufficient to suppress the third-order intermodulation distortion (IMD3) and cross-modulation distortion (Fig. 4). With the increase in the fundamental signal power, the power of XMD and IMD3 increases with the slope of one and three, respectively [Fig. 5 (a)]. As the power of the out-of-channel signal increases, the power of the fundamental signal and IMD3 is almost unchanged, while that of XMD increases with the slope of two [Fig. 5 (b)]. According to the simulation experiment, the IMD3 and XMD can be completely suppressed [Fig. 6 (b)] when the parameter is accurate. When the parameter deviation is 5%, IMD3 and XMD have been suppressed by 15 and 16 dB, respectively [Fig. 6 (c)]. The ability of the digital compensation algorithm to suppress nonlinear distortion disappears as the parameter deviation approaches 18% [Fig. 6 (d)].ConclusionsThe linearity in microwave photonic channelized links is mainly limited by the IMD and XMD. In this study, a nonlinear distortion compensation method based on digital domain iteration processing is proposed, which jointly processes the intermediate frequency signal output from each channel in the digital domain and approaches the ideal result of linearization through iteration. It can effectively suppress the IMD and XMD in channelized links. The simulation results show that the method can completely suppress the IMD and XMD when the parameter is accurate. When the parameter deviation is 5%, the IMD3 and XMD can still be suppressed by 15 and 16 dB, respectively.
ObjectiveComputer-aided pneumonia diagnosis with chest X-rays based on convolutional neural networks (CNNs) is an important research direction. The presence of factors such as patient positions and inspiratory depth in chest X-rays images can lead to confusion with other diseases, and existing methods ignore the directional and spatial features of images in chest X-rays, such as the common onset of pneumonia in the middle and lower lobes of the lung. However, it is difficult to extract the directional information and global semantic information of pneumonia X-rays by a CNN. Additionally, the model is not sufficiently lightweight, and the time and space complexity is high. Hence, this paper proposes a lightweight directional Transformer (LDTransformer) model for pneumonia X-rays to assist in diagnosis.MethodsThe densely connected architecture of CNN combined with the Transformer is constructed. It is composed of cross-stacking local feature extraction and global feature extraction, and its dense connections are used to achieve the combination of local and global information in deep and shallow layers. Next, lateral, vertical, and dilated convolutions in parallel with the directional convolution are designed to capture spatial and directional information of different shape sizes. The directional convolution is used to compress feature scales in the Transformer and learn global features and directional features of images with low computational complexity. After that, the lightweight convolution in CNN is designed. It employs a dedicated convolution kernel for each sample feature, learns features in chunks, and fuses them by a channel-noted blender to reduce the number of model parameters and maintain efficient computation while effectively increasing the feature extraction capability of the network. Finally, a balanced focal loss function is constructed to increase the weight of small and misclassified samples and decrease the weight of overclassified samples.Results and DiscussionsThe LDTransformer model achieves high recognition accuracy with good robustness and generalization in all three X-ray datasets of number, category, and difficulty. Smaller datasets make it difficult for the high-performance CNN and Transformer models to learn sufficiently, while the lightweight model using a combination of both can obtain high recognition accuracy (Table 6). Compared with various lightweight models of CNN and Transformer (Table 4), the model in this paper has advantages in terms of the number of parameters, computation, and training time. In particular, its lightweight design with a dedicated convolution kernel for each sample feature makes the operation efficiency significantly better than that of existing models. Finally, the performance of each component of the model in this paper is tested separately by ablation experiments and loss function comparison experiments, and the region of interest and accuracy of the model are visualized by the heat map visualization in the ablation experiments (Fig. 4).ConclusionsConsidering the inadequate feature extraction and insufficient model lightweight, this paper proposes a model for X-ray-aided pneumonia diagnosis to combine local and global information in deep and shallow layers. The directional convolution learns spatial and directional information of different shape sizes. The lightweight convolution with a dedicated convolution kernel for each sample feature is designed to reduce resource consumption, and a balanced focal loss function is constructed to optimize training. The proposed model achieves the accuracy of 98.87% and an AUC value of 98.85% under a small number of model parameters (2.53×10⁵), the lowest model computation (3.98×10⁷), and the fastest total speed (12647 s) in the pneumonia X-ray dataset. It effectively extracts the directional features and global features of pneumonia X-ray images with a high degree of lightweight.
ObjectiveIn the two-dimensional deformation measurement of speckle images, the initial value estimation of the digital image correlation method exerts great influence on the computational efficiency and accuracy of algorithms. The calculation accuracy and speed of sub-pixel displacement iterative search algorithms in digital image correlation methods depend on whether the initial value estimation provided by the integral pixel displacement calculation is reasonable or not, and its convergence radius is generally in the range of several pixels. Therefore, the initial value estimation provided in the integer pixel displacement search phase should be as close to the real value as possible to ensure that the iterative algorithm can converge quickly and accurately, otherwise, it may converge slowly or even fail in the iterative process. The traditional initial value estimation methods including the human-computer interaction method, Fourier transform method, and feature matching method, have some problems such as slow calculation speed and low calculation accuracy in the face of large deformation measurement and unclear speckle image features. Recently, the optical flow estimation network models in deep learning feature fast calculation speed, high calculation accuracy, and strong generalization in predicting motion displacement. We introduce the optical flow estimation network model in deep learning into the digital image correlation method and employ the displacement field predicted by the optical flow network as the initial value of the sub-pixel iterative algorithm. Finally, the inverse compositional Gauss-Newton method is adopted to calculate the displacement field of speckle deformation images. We hope that the strategy of introducing deep learning into the digital image correlation method can provide a new idea for speckle deformation measurement.MethodsFirst of all, we compare the calculation accuracy of several optical flow network models of FlowNet2, PWC-Net, RAFT, GMA, SeparableFlow, GMFlow, and FlowFormer, which have excellent performance on MPI Sintel test datasets on speckle images. Considering the calculation time, model size, and calculation accuracy, the GMA network model is chosen to provide initial value estimation for sub-pixel iterative algorithms. Then, a feature sampling module is added to the model for solving the problem that the GMA network needs to occupy a lot of GPU resources in high-resolution speckle images, which can effectively reduce the occupation of GPU memory by adjusting the sampling step size. Additionally, the speckle images are utilized to generate many randomly deformed speckle datasets to retrain the model to enhance the generalization of the model in speckle deformation measurement. Finally, the GMA network is combined with the ICGN algorithm, and the performance of the algorithm is evaluated by simulated speckle deformation experiments and real wood block compression experiments.Results and DiscussionsAfter optimizing the sampling module, the computing resources needed in the model prediction continue to decrease with the increasing step size, and the sampling step can be reasonably selected by combining the hardware resources of the computer and calculation accuracy. After retraining in the speckle deformation dataset, the average endpoint error of the model in speckle images decreases by 14.76%. In large deformation measurement, the calculation accuracy of the proposed GMA-ICGN algorithm can still be kept at 0.01 pixel. Compared with the Fourier transform method and feature matching method in the initial value estimation algorithms, the computing speed of the GMA network has obvious advantages. In the wood block compression experiments, the GMA-ICGN algorithm successfully measures the displacement field and strain field of woodblock compression deformation.ConclusionsThe integral pixel displacement search algorithm in the digital image correlation method usually takes a long time. We propose a digital image correlation method based on GMA optical flow network. The reliable displacement initial value of speckle deformation images is obtained by the GMA network and then brought into ICGN iterative algorithm to accurately solve the displacement field, which can greatly improve the computational efficiency of the digital image phase method. At the same time, the GMA optical flow network is optimized and retrained, and the average endpoint error is reduced by 14.76%, which improves the prediction accuracy of the GMA network in the speckle images and reduces the GPU memory consumption by adjusting the step size of the network model. Through simulated speckle deformation experiments, a comparison between the calculation accuracy and efficiency of the proposed GMA-ICGN algorithm and the popular SIFT-ICGN algorithm, FFT-ICGN algorithm, Ncorr software, and DICe software proves that the proposed algorithm has higher computational efficiency. In addition, the proposed algorithm has similar accuracy to the SIFT-ICGN algorithm in large deformation scenes and can calculate the speckle deformation displacement field quickly and accurately. Furthermore, the proposed algorithm is applied to woodblock compression experiments, and the displacement field and strain field of woodblock compression deformation are measured successfully.
ObjectiveLithography is a key technique in the manufacture of very large scale integrated circuits. The imaging quality of the lithographic projection lens directly affects the critical dimensions of integrated circuits. The wavefront aberration of the projection lens reduces lithographic imaging quality and affects the lithographic resolution. Therefore, measuring the wavefront aberration of the lithographic projection lens is crucial for improving lithographic imaging quality. The wavefront aberration measurement technique based on principal component analysis of aerial images for the lithographic projection lens is characterized by fast process and in-situ measurement. However, this technique is affected by the illumination condition, scanning range, sensor, and other factors in practical engineering applications. It also faces a number of problems, such as image shift and noise. This study investigates the above engineering issues, proposes engineering application suggestions, and verifies the effectiveness of the proposed method by simulation and experiments.MethodsThe commercial lithographic simulation software Santaurus lithography of Synopsys is employed for simulation research. The influences of different factors on the performance of wavefront aberration measurement are studied. An actual sensor structure is adopted to examine the influences of sensor parameters on the accuracy of wavefront aberration measurement, and the validity of the sensor model is verified by aerial image reconstruction experiments. The influence of the centering error on the accuracy of wavefront aberration measurement is analyzed. Two centering methods are compared to determine their respective applicability. The effectiveness of the centering method is verified by aerial image reconstruction experiments and two sensor experiments. The effects of different denoising methods on aerial images are studied, and an average denoising method tailored to the unique noise type of aerial images is proposed.Results and discussionsThe simulation and experimental results show that illumination and the scanning range have a great influence on the accuracy of wavefront aberration measurement. The measurement accuracy is high when the partial coherence parameter of illumination is in the range of 0.5-0.8 and the sampling length of the aerial image along the focus (F) direction is above 5000 nm. In terms of centering, the centering accuracy of the six-term model is higher in the X direction. In the F direction, the three-term model is suitable for centering the 0° aerial image while the six-term model is applicable for centering the 90° aerial image. Regarding denoising, the average denoising method proposed in this study can significantly improve the accuracy of wavefront aberration measurement and can be applied in engineering. The simulation results prove that the proposed technique can be used to correct the short-term aberration drift of the scanner.ConclusionsThis study systematically investigates the wavefront aberration measurement technique based on principal component analysis of aerial images for the lithographic projection lens. Specifically, it analyzes the engineering problems of this technique and further presents some application suggestions. The simulation and experimental results show that the measurement accuracy of this technique can be effectively improved by selecting appropriate illumination conditions, scanning range, sensor model, and centering method. The proposed denoising method can effectively remove the noise in the aerial image and improve the accuracy of wavefront aberration measurement. The simulation results prove that the proposed technique can be used to correct the short-term aberration drift of the scanner.
ObjectivePolarization is a key parameter of light, accurate and rapid measurement of which plays a significant role in a variety of areas such as remote sensing technology, Mueller matrix measurement, and biological diagnosis. Stokes parameters directly reflect the light intensity of the polarization component of light, and all parameters can be directly determined by the measurement of light intensity. On this basis, the polarization distribution, vector quality factor, and intra-modal phase can be measured. The measurement methods of Stokes parameters mainly include the division-of-time and division-of-amplitude methods. The division-of-time method refers to the measurement of required intensities one by one, which is only applicable to static polarized light. The division-of-amplitude method can overcome shortcomings encountered by the division-of-time method, but it also faces many problems such as the complexity of the device, the uneven distribution of light intensity, and different propagation distances. In this study, a Stokes polarimetry method based on a polarization-insensitive Dammann grating is proposed. The Stokes parameters of the polarized beam can be calculated by the intensity spots in a single snapshot, and the polarization distribution, vector quality factor, and intra-modal phase of the polarized beam can be further obtained. This method has simple measuring equipment and does not need any rotating components. The measurement can be completed with a snapshot and has reliable accuracy.MethodsThe measurement principle of the proposed method is described in Fig. 1. Formulas for calculating Stokes parameters, the polarization distribution, the vector quality factor, and the intra-modal phase of the polarized light are derived. The experimental setup is built upon the measurement principle. In the experiment, different vector polarized beams, circularly polarized beams, and elliptically polarized beams are generated to measure the target polarized beam. The polarization-insensitive Dammann grating is used to divide the incident polarized beam into four identical beams in a spatially symmetrical position. After being collimated by a convex lens, four beams are modulated by wave plates and a polarizer and finally captured by a CCD. Via the captured intensity images, Stokes parameters of the measured polarized beam are calculated, and the polarization distribution, vector quality factor, and the intra-modal phase of the polarized light beam are obtained. Finally, according to the measurement principle, we analyze the influence of the phase retardation deviation and fast axis azimuth deviation of wave plates and the transmittance axis deviation of the polarizer on Stokes parameter measurement.Results and DiscussionsFirst, the generated radially polarized beam is used for the initial calibration, which is divided into four identical beams, as shown in Fig. 2. Four light spots recorded in Fig. 2 are used to calibrate the center position of the light spot, which is beneficial to the subsequent measurement. After that, the radially polarized beam is measured. On the basis of the four light spots recorded in a snapshot (Fig. 3), Stokes parameters of the radially polarized beam are calculated (Fig. 4), and then the polarization distribution is reconstructed (Fig. 5). The above experimental measurement results are all compared to the corresponding theoretical simulation results, and they have a good agreement. Then, more polarized beams are measured, and their experimental measurement results of reconstructed polarization distribution conform well to the theoretical simulation results (Fig. 6). The measurement results of the generated elliptically polarized beams are compared with those of the commercial polarimeter to verify the feasibility and accuracy of the measurement method. Table 1 shows the relative measurement errors of different elliptically polarized beams between the proposed measurement method and the polarimeter, and the average relative error is 6.97%, which indicates the feasibility and accuracy of the proposed method. Additionally, the vector quality factor and intra-modal phase of different polarized beams are measured. At last, the analysis of the influence of some existing errors on Stokes parameter measurement shows that the phase retardation deviation and fast axis azimuth deviation of wave plates and the transmittance axis deviation of the polarizer could bring about a maximum measurement error of around 9% to Stokes parameter measurement.ConclusionsThis study proposes a method of measuring Stokes parameters of arbitrary polarized beams based on a polarization-insensitive Dammann grating with a snapshot. The Dammann grating is used to divide the incident polarized beam into four identical beams in a spatially symmetrical position. After being collimated by the lens, the four beams pass through different wave plates and a polarizer and are eventually captured by a CCD. The Stokes parameters of the polarized beam can be calculated by a simple superposition of the intensity spots in a single snapshot, and the polarization distribution, vector quality factor, and intra-modal phase of the polarized beam can be further obtained. The experimental measurement results are in good agreement with the theoretical simulation results. The average relative error of elliptically polarized beams between the proposed measurement method and the commercial polarimeter is 6.97%, which verifies the feasibility and accuracy of this measurement method. The Dammann grating used in this method is designed according to the wavelength of the incident beam and the required separation angle. It can accept the spot diameter of the incident beam in a wide range and has no requirements for the polarization of the incident beam. Hence, the measuring device has certain universality. The proposed Stokes polarimetry method is simple and can obtain reliable results without all-digital devices, which effectively reduces the cost. The subsequent use of wave plates with higher precision of phase retardation and rotation mounts with higher precision of rotation can further improve the measurement accuracy.
ObjectiveOptical clocks have developed rapidly in the past 20 years and have achieved a systematic uncertainty of 9.4×10⁻¹⁹ and frequency stability of 4.8×10⁻¹⁷ @1 s. Except for the generation of standard time and frequency, optical clocks have many important applications, such as verification of general relativity, measurement of possible variation of the fine structure constant with time, detection of ultralight bosonic dark matter, quantum simulation, and relativistic geodesy. As more and more systematic uncertainty of the optical clock enters the order of 10-18, and the absolute frequency measurement accuracy of the optical clock is fundamentally limited by the systematic uncertainty of the 133Cs fountain clock, it has been proposed to use optical frequency transition to redefine the second in the international system of units. The 27th General Conference of Weights and Measures (CGPM) officially passed a resolution: The 28th CGPM will be held in 2026 to discuss the choice of optical clock types for redefining the second, and the optical frequency transition will be formally used to define the second expected in 2030. One of the main methods of absolute frequency measurement of optical clocks is to trace the international atomic time through a satellite link, and measurement uncertainty of less than 3×10-16 is a precondition for the redefinition of the second in the international system of units by the optical frequency transition. In this complex tracing link, the uncertainty caused by the measurement dead time of the hydrogen maser is one of the main sources of absolute frequency measurement uncertainty for most optical clocks. After removing the contribution of frequency drift of the hydrogen maser, the statistical uncertainty caused by the measurement dead time of the hydrogen maser can be obtained by numerical simulation. This method needs to know the relevant parameters of the noise model of the hydrogen maser accurately and then generate the relevant random noise sequences by software.MethodsIn this paper, the frequency comparison between the 87Sr optical lattice clock and hydrogen maser is made by using an optical frequency comb. By calculating the stability of the frequency ratio and fitting with the function of y(τ)=A12τ-2+A22τ-1+A32τ0+A42τ1 (τ is the measurement time, and A1–4 indicate the amplitudes of phase white noise, frequency white noise, frequency flicker noise, and random walk noise, respectively), the values of A1–4 are obtained. Finally, according to the noise model of the hydrogen maser, we use the software to generate random noise series of 86400×5 s, 86400×10 s, and 86400×30 s, respectively, and calculate the statistical uncertainty of optical frequency measurement under different effective operating rates (the measurement dead time of the hydrogen maser) and total measurement durations.Results and DiscussionsThe parameters of the noise model of the hydrogen maser are determined as A1=2.21×10⁻¹³ (τ/s)-1, A2=3.05×10⁻¹³ (τ/s)-0.5, A3=6.01×10⁻¹⁶, and A4=4.49×10⁻¹⁹ (τ/s)0.5, respectively after about 10-day measurement with an effective operating rate of 89% [Fig. 2(b)]. The frequency difference caused by the measurement dead time of the hydrogen maser is simulated 100 times by using the method of generating random noise sequences (using the software of Stable32) according to the noise model. Three types of random noise sequences are generated with a total measurement time of 86400×5 s, 86400×10 s, and 86400×30 s, respectively. The difference in the mean frequency from the total mean over partial times is calculated for the specific case. Each case is repeated by 100 times, and the measurement uncertainty caused by the measurement dead time of the hydrogen maser is represented by the 1 times standard deviation of these results. Figure 4 shows the calculation results of the measurement uncertainty as a function of the effective operating rate. The measurement uncertainty due to the measurement dead time decreases with the increase in the effective operating rate, and when the effective operating rate is less than 10% or so, increasing the total measurement time can significantly reduce the measurement uncertainty.ConclusionsIn this study, the frequency stability of the hydrogen maser is measured by comparing the 87Sr optical lattice clock (with an 89% effective operating ratio and a total measurement time of about 10 days) with the hydrogen maser for a long time. By fitting the data of the frequency stability of the hydrogen maser with the noise model function, the influence of each noise of the hydrogen maser is determined as 2.21×10⁻¹³ (τ/s) -1 for phase white noise, 3.05×10⁻¹³ (τ/s) -0.5 for frequency white noise, 6.01×10⁻¹⁶ for frequency flicker noise, and 4.49×10⁻¹⁹ (τ/s)0.5 for random walk noise. The calculation results indicate that the measurement uncertainty caused by the measurement dead time of the hydrogen maser decreases with the increase in the effective operating rate, and when the effective operating rate is less than 10% or so, increasing the total measurement time can significantly reduce the uncertainty. This work can be widely used to measure the absolute frequency of optical clocks by tracing the international atomic time and provide an important reference for selecting the effective operating rate of the optical clock to reduce the measurement uncertainty caused by the measurement dead time of the hydrogen maser.
ObjectiveTopography measurement is an indispensable part of mechanical processing, which has important guiding significance for processing quality evaluation and compensation. Topography measurement can be divided into on-machine measurement and offline measurement. Among them, offline measurement requires secondary clamping and repeated positioning, which will introduce machining errors and reduce the overall production efficiency and processing quality. However, on-machine measurement can avoid these problems. According to the measurement principle, on-machine measurement can be further divided into contact measurement and non-contact measurement. Contact measurement is not suitable for measuring optical precision structures due to the formation of scratches on the measurement surface and the destruction of microstructures. Therefore, how to realize accurate and efficient non-contact on-machine measurement has become an important research direction in the evaluation of optical components. Meanwhile, in optical design, the Fresnel structure has been widely used due to its smaller volume compared with traditional lenses. However, there is still a lack of effective on-machine non-contact evaluation methods for optical devices with Fresnel microstructures. The conventional chromatic confocal probe often used in on-machine measurement cannot effectively evaluate the Fresnel structure due to its small measurement angle and large focus spot. In this paper, an on-machine non-contact measurement system based on the point autofocus principle is established. With the developed temperature compensation and modified coordinate calibration algorithm, the accurate evaluation of Fresnel microstructures can be realized.MethodsIn traditional measurement, due to the inconsistency and uncertainty of the transformation matrix between the measurement coordinate and the workpiece coordinate, methods such as the iterative closest point (ICP) algorithm are often used to alternate the measured point cloud to coincide with the model point cloud. However, the ICP algorithm suffers from problems such as high computation complexity and sensitivity to initial values. Especially for a two-dimensional contour measurement problem, the transformed point cloud cannot be guaranteed to pass through the generatrix, which will cause undesired errors during evaluation. To solve this problem, this paper analyzes the relative position between coordinate systems based on the proposed on-machine measurement equipment first (Fig. 5). Then, an optimization model is established based on the measurement data and the sphere constraint by scanning a calibrated sphere through the on-machine measurement system. By solving the optimization problem, the coincidence of the measurement coordinate system and the workpiece coordinate system can be realized. In addition, in order to obtain more accurate measurement values, a temperature-based compensation algorithm is developed in this paper. First, according to the frequency analysis of the measurement results for an optical plane (Fig. 4), the correlation between the measurement error and the temperature of the sensor is validated. Then, the Gaussian process is applied to establish the implicit mapping relationship among the temperature, temperature variation rate, and measurement error. Finally, the effectiveness of the system and algorithm proposed in this paper is verified by the measurement results for the optical plane (Fig. 6) and the spherical Fresnel structure (Fig. 9).Results and DiscussionsThrough the measurement of an optical plane (Fig. 6), the temperature compensation algorithm proposed in this paper successfully reduces the measurement error by approximately 60%. Moreover, the spectrum analysis also verifies that the main peak of the spectrum due to the temperature variation no longer exists after compensation. The optimization method for pose calibration proposed in this paper reduces the deviation of calculation results under different optimization initial values to about 10% (Table 3 and Table 4), thus improving the accuracy of probe coordinate calibration. Finally, the on-machine measurement system proposed in this paper is comprehensively evaluated through the measurement of the spherical Fresnel structure. The deviation between the measurement result after compensation and optical design [Fig. 9(d)] is consistent with the offline measurement result [Fig. 9(b)] in terms of both value and morphology, with a maximum detection error of 210 nm. Additionally, the result provided by the conventional chromic confocal sensor is presented (Fig. 8), and there are significant defects. The possible causes of the defects are explained from the perspectives of local topography and reflected spectral intensity. Through comparison, the point autofocus on-machine measurement system manifests significant advantages while measuring the complex Fresnel microstructure.ConclusionsIn this paper, a highly precise on-machine measurement system is established based on a point autofocus instrument and an ultra-precision machine tool. Additionally, a temperature compensation method based on the Gaussian process and an optimized coordinate calibration method are developed. Through spectrum analysis, a positive correlation between the probe reading and its temperature is validated. Furthermore, the Gaussian process model is conducted to reduce the error to 39% before compensation. Meanwhile, the improved optimization method in this paper further improves the accuracy of the probe pose calibration. When measuring the spherical Fresnel structure, the system developed in this paper reveals an excellent consistency with the results of the offline point autofocus measurement system, and the maximum deviation is about 210 nm, which is significantly better than those of the offline white light interferometer and the traditional online confocal sensor. In summary, the on-machine measurement system constructed in this paper provides a feasible solution for the ultra-precise on-machine non-contact measurement of complex and high-steep optical microstructures.
ObjectiveThe ability to rapidly detect and identify hazardous materials, such as explosives and hazardous gases, is a critical technology that can facilitate security screening in the global effort against terrorism. Recent R&D works focus on technologies to perform standoff sensing of hazardous materials in the open environment without any sample preparation. In this work, a long-distance laser Doppler vibrometer developed by China is applied as a sensor to detect the photoacoustic signal on solid and gaseous chemicals.MethodsPhotoacoustic/photothermal (PA/PT) techniques can provide sensitive non-contact solutions to overcome this challenge at a meaningful standoff distance.Since the last century, PA spectroscopy (PAS) has been applied in many applications for solid, liquid, and gas evaluation. Conventional PAS requires prior preparation of analyte samples, and the measurement is conducted within a controlled environment, such as a well-isolated photoacoustic cell. The response signal is captured by a highly sensitive microphone or any other form of sensor located close to or in direct contact with the sample. Hence, commercial PAS equipment limits the technique in a laboratory environment. In recent years, research focuses on improving the excitation source and the detection technology in the open air. Two trends have been observed in the research area of standoff detection of chemicals and explosives: (1) Quantum cascade laser (QCL) becomes a more practical excitation source due to its high power, broadly tunable wavelength in the mid-infrared ray (IR) range, and compact size over other light sources such as optical parametric oscillators (OPOs); (2) non-contact optical detection techniques, such as thermal imaging and laser interferometry become generally accepted methods for standoff detection of PA/PT signals in the open air. Recently, a conventional and mature interferometric system, namely a laser Doppler vibrometer (LDV), has been applied to detect the photo-vibrational signal on solid and liquid due to the PA effect. The standoff distance of the LDV will influence the received power of the reflected beam only, but it will not affect the phase change detected due to the PA/PT effect.We apply a long-distance laser Doppler vibrometer developed by China (Fig. 3) to detect the photo-vibrational signal 200 m away. A QCL with a chopper is adopted as the excitation source. By scanning the wavelength of the QCL, we measure the amplitude of the vibration signals and obtain photoacoustic spectra. The results are compared with that of Fourier transform infrared spectroscopy (FTIR) and found to be highly consistent.Results and DiscussionsIn order to detect the vibration caused by the photoacoustic effect, a long-distance laser Doppler vibrometer is fabricated. Fig. 3(a) shows the optical design. Generally, it is a typical Mach-Zender interferometer. The light source used is a narrow linewidth laser at 1550 nm from Keopsys company. A fiber-coupled acoustic-optic modulator with frequency of 40 MHz is applied in the reference beam to introduce a carrier frequency. A motorized 4-inch beam expander is designed to focus the laser beam to a distance of 20-200 m. The reflected object beam interferes with the reference beam, and the output signal from a balanced detector is a frequency-modulated (FM) signal with a central carrier frequency of 40 MHz. A field programmable gate array (FPGA)-based demodulation system developed by China is used to demodulate the FM signal and retrieve the optical path length change due to the photoacoustic effect. The output is displacement or velocity that can be selected by the user. Generally, displacement is directly proportional to the phase change, and velocity is proportional to the frequency shift of the object beam. When the signal-to-noise ratio (SNR) of the interferometric signal output from the detector is more than 45 dB, the noise floor of the displacement measurement is < 5 pm. This means an amplitude vibration of 5 nm at a certain frequency will have a peak of 30 dB in the spectrum. For long-distance LDV, the SNR of the optical signal is fluctuating from 20 dB to 50 dB.Fig. 6(b) shows the photoacoustic spectrum of trace polytetrafluoroethylene (PTFE) powder obtained by the long-distance LDV. Compared with a standard FTIR of PTFE [Fig. 6(a)], it is found that they coincide very well. Fig. 7(b) is the photoacoustic spectrum of leaking acetone, and it coincides with FTIR [Fig. 7(a)] obtained by the PerkinElmer Frontier FT-IR/MIR spectrometer. It is worth noting the amplitude of the photo-vibrational signal obtained by LDV may fluctuate due to environmental factors. Longer integration time may stabilize the reading and eliminate the noise floor, but it may reduce detection efficiency in real applications.ConclusionsWe adopt a QCL as the excitation light source due to its high power, broadly tunable wavelength in the mid-IR range, and compact size over other light sources. The intensity of the QCL beam is modulated by an optical chopper, while the LDV is used to detect the vibration signals due to the photoacoustic effect. The photo-vibrational spectra obtained by plotting the normalized vibration amplitude against the QCL output wavenumber range are compared with standard FTIR spectra. The experiments demonstrate that the long-distance laser Doppler vibrometer developed by China can effectively detect photo-induced vibration signals from hazardous solid and gaseous chemicals at up to 200 m in an imperfect environment. It is a necessary first step in a series of developments to realize the proposed technology for standoff detection of hazardous materials in defense and security screening applications.
ObjectiveDue to the limitation of electronic bottleneck, the traditional switching networks based on electrical devices are challenging to meet the needs of large-scale data exchange in the big data era. As an alternative, emerging silicon-based optical switching networks can effectively increase network capacity and reduce energy consumption. In addition, taking advantage of wavelength division multiplexing (WDM) or mode division multiplexing (MDM) technologies, multiple optical signals can be transmitted simultaneously in one optical link, effectively improving the optical interconnection density and communication bandwidth. However, the current optical switching network usually uses only WDM or MDM, which can only partially develop the parallel advantages of optics. Thus, we propose a novel on-chip optical switching network architecture based on hybrid wavelength and mode division multiplexing (WDM-MDM) technology. By inputting data of different wavelengths and modes into a single optical waveguide to achieve parallel transmission, the switching network's capacity multiplies. In addition, the proposed architecture enables data transmission between all nodes in parallel and supports multicast communication. The proposed architecture is expected to address the challenges of high-capacity switching requirements faced by data center networks by scaling the number of multiplexed wavelengths and modes.MethodsWe propose an on-chip optical switching network architecture (Fig. 1) based on hybrid WDM-MDM technology. The architecture uses Benes topology as the core switching unit to achieve non-blocking features. Besides, we design a mode selection/multiplexing (MSM) module-based transmitting module [Figs. 2(a)-2(b)]. All nodes are divided into 2N groups at the transmitting module, with each containing W processor nodes. Each node is connected to a microring resonator (MRR)-based modulator array at the transmitter side to realize electro-optical conversion. The modulated optical signal is then transmitted to the MSM module. In the MSM module, one of the input fundamental mode signals will be converted into a higher-order mode signal. Then these two different mode signals will be multiplexed into a multi-mode waveguide and transmitted to the input port of the hybrid WDM-MDM switching unit of 2×2 (Fig. 3). The switching unit contains two passive mode multiplexers (demultiplexers) and two double-ring MRR-based single-mode optical switching units of 2×2. Each input port in the hybrid WDM-MDM switching unit of 2×2 includes two modes and W different wavelengths, so it supports data exchange of any combination of 2W input data channels. Finally, we use Benes topology to cascade the proposed switching unit of 2×2 to form a large-scale hybrid WDM-MDM optical switching network.Results and DiscussionsWe use the ANSYS Lumerical Solutions simulation platform to conduct device-level and system-level modeling and hardware parameter optimization for a 2-mode, 4-wavelength-based scale switching network of 16×16. The width of the single- and the multi-mode waveguide is 0.45 μm and 1 μm; the radii of the MRRs are 9.96, 9.98, 10, and 10.02 μm; the gaps 1-5 in CMR and SMR are 0.25, 0.2, 0.2, 0.47, and 0.2 μm, and the coupling length and gap in mode conversion region 1 are 15 and 0.20 μm, respectively. Figure 4 shows the transmission spectra and filed intensity distribution simulation results of the CMR switch, SMR switch, and asymmetric mode converter. Then, we analyze the transmission spectrum of the 16×16 switching network by choosing I1 as the input port and measuring the transmission spectra of 16 output ports (Fig. 6). Among the 16 switching links, I1→O16 has the maximum insertion loss of about 9.30 dB, and the path I1→O1 has the minimum insertion loss of about 8.95 dB. The difference between the maximum and minimum insertion loss is less than 0.5 dB, which indicates that the switching network has excellent fairness. The input signal of I1 is also modulated to four operational wavelengths, and the output signal is observed at the corresponding output port (Fig. 7), which verifies that the switching architecture is capable of multicast communication. In addition, we simulate the eye diagram with a single channel of 25 Gbps data rate and obtain the extinction ratio, rise time, and fall time results (Fig. 8). The results show that the detected eye diagram performance is better from I1-4 to O1-4, which means that reducing the number of MRRs turned on can effectively reduce the negative influence on the network performance. Finally, we compare the proposed architecture with traditional single-wavelength single-mode (SWSM) and multi-wavelength single-mode (MWSM) optical switching architectures. The results show that the proposed architecture can effectively reduce the insertion loss without increasing the wavelength cost, and this advantage becomes more obvious as the size of the network expands (Fig. 10).ConclusionsWe propose a scalable WDM-MDM-based on-chip optical switching network architecture and design an MRR-based wavelength/mode selection/multiplexing module and a WDM-MDM optical switching module of 2×2. As a proof of concept, a switching network architecture of 16×16 with 2-mode, 4-wavelength, and Benes topology of 2×2 has been simulated. Finally, the maximum insertion loss performance of the proposed architecture and the traditional SWSM-based and MWSM-based switching architectures are simulated and analyzed, and the superiority of the proposed architecture is proven. The proposed architecture can further increase the scale of wavelength multiplexing and mode multiplexing and reduce the insertion loss through structural optimization, which can help realize large-scale and high-capacity optical data center switching networks.
Objective905 nm multiple-active-region lasers are mainly employed as the signal source of vehicle lidars. By alternately growing lasers and tunnel junctions on the same epitaxial wafer, lasers will be cascaded in the same structure by the quantum tunneling effect of tunnel junctions. However, the heavily doped tunnel junction (about 1×1020 cm-3) leads to rather low resistance, and then the lateral expansion of current will increase here, causing more unnecessary heat loss. At the same time, the current injected into different active regions decreases successively, and it is more difficult to emit the next active region. This increases the threshold current of the device and even leads to the impossibility to emit the lasers. In the conventional laser process, the method of isolation channel is often adopted to suppress the lateral expansion of current. However, the conventional process is mainly aimed at lasers with single active regions, and it employs wet etching with shallow etching depth and low precision. We introduce the isolation channel into the structure of multiple-active-region lasers, and simulate and calculate the lateral current density at different positions. Based on the calculated results, the isolation channel with different depths and spacing is designed, and the device is made and tested to study the suppression effect of different structures on the lateral current and optimize the chip structures.MethodsThe layer stack grown on a GaAs substrate by metalorganic vapor phase epitaxy consists of n-Al0.4Ga0.6As cladding (donator density ND=1×1018 cm-3), p-Al0.45Ga0.55As cladding (acceptor density NA=2×1018 cm-3), n- and p-Al0.3Ga0.7As optical confinement layers without doping around the active regions and tunnel junctions. The two In0.08Ga0.92As quantum wells sandwiched between Al0.3Ga0.7As spacer layers are the active regions. The two GaAs TJs are placed between diodes for cascading. An asymmetric large cavity structure with thick n side is designed. By increasing the thickness of the waveguide layer, the effective spot size can be expanded and the COD level of the device can be improved. The asymmetric waveguide can also limit the high order mode and reduce the loss of optical field and carrier. To suppress the lateral expansion effect of the current, in terms of chip structure, we introduce isolation channels on both sides of the active region along the longitudinal direction of the laser (Fig. 3). This structure can be leveraged to isolate the lateral expansion current, reduce the threshold current of the device, and improve the slope efficiency. Additionally, an ICP device is utilized to etch the designed isolated channel structure.Results and DiscussionsFig. 5(a) shows the optical power-current (P-I) curve of the device under different etching depths. The threshold current and slope efficiency of wet-etched sample 1 are 1.52 A and 3.07 W/A respectively, and the channel depth of sample 2 is 4.0 μm. After etching through the first tunnel junction, the threshold current is reduced to 1.27 A and the slope efficiency is improved to 3.20 W/A. When the channel depth of sample 3 is 7.0 μm and the etched tunnel passes through the second junction, the influence of the current expansion effect is further reduced and the threshold current is reduced to 1.20 A, with the slope efficiency rising to 3.27 W/A. As the etching depth increases, the ability to isolate channels to suppress the current expansion effect becomes stronger. Fig. 5(b) shows the P-I curves corresponding to different channel spacing. For the device with cavity length of 1 mm, when the channel spacing of sample 5 is reduced from 180 μm to 125 μm of sample 4, the threshold current can be decreased from 0.91 A to 0.64 A, and the slope efficiency can be increased from 3.38 W/A to 3.58 W/A. This indicates that the current can be concentrated in the center of active regions and the lateral expansion effect of the current can be reduced by decreasing the distance between the two channels. Finally, sample 4 with the best initial performance is packaged and tested, driven by a special pulse drive. The P-I curve of the laser diode is measured under the current pulse width of 100 ns and repetition frequency of 10 kHz (0.1% duty ratio), as shown in Fig. 6(a). The peak power and working current are finally measured at 134 W and 38 A. The measured far-field divergence angle is shown in Fig. 6(b), where the vertical divergence angle is 33.3° and the lateral divergence angle is 5.1°.ConclusionsThe isolation channel structure of the 905 nm tunnel cascade semiconductor laser is optimized. To reduce the lateral expansion effect of the current, we introduce isolation channels with different etching depths and spacing on both sides of each laser to study the influence of different structures on the device performance. The epitaxial structure of double quantum wells with InGaAs/AlGaAs asymmetrical large optical cavity is selected, and the cascade is realized through heavily doped GaAs tunnel junctions. The devices with different depths and spacing channels are fabricated by wet and dry etching methods. The photoelectric performance of the devices is tested and compared, and proven by current expansion theory. The experimental results show that the introduction of the isolation channel can suppress the lateral expansion current effect of multiple-active-region lasers in the tunnel cascade. The deeper isolation channel leads to a shorter distance of the double channel and a better limiting effect. The final three-active-region laser with a channel etching depth of 7.0 μm and a spacing of 125 μm can reduce the threshold current to 0.64 A and slope efficiency to 3.58 W/A. The peak power is finally measured at 134 W under a 0.1% duty ratio.
ObjectiveWith the continuous development of science and technology, it is of scientific significance to construct a structural color with a special color effect and good stability based on the nanostructure. At present, various artificially prepared structural color tuning methods are put forward, such as traditional nanoimprint lithography, ultrafast laser direct writing, microfluidics, and inkjet printing. Although it is possible to produce nanostructures with good periodicity and various patterns, the cost and complexity of the process also restrict the development of technology. To this end, two-dimensional ordered templates with planar hexagonal close-packed structures are prepared by the gas-liquid interface assembly method on silicon wafers, and silicon wafers with a certain thickness of SiO2 in our study, and metal thin films with different thicknesses are prepared by the magnetron sputtering method. Then the deformation degree of the periodic surface is changed by post-treatment of 532 nm pulse laser to realize the modulation of structural color samples. Color modulation is carried out by regulating the changes in microstructure morphology.MethodsThe fabrication process of the periodic polystyrene (PS) microsphere substrate is divided into two steps. First, a polymer sphere monolayer is assembled at the gas-liquid interface and then transferred to the Si/SiO2 substrate. Second, the Au films with different thicknesses are deposited on the above-mentioned PS colloidal crystal template by a radio frequency (RF) magnetron sputtering technique. Then a 532 nm pulsed solid-state laser system (EP10-1, Changchun New Industries Optoelectronics Technology Co., Ltd.,) is employed to post-treatment the ordered surface with metal-coated colloidal crystal by changing different scanning speeds. The laser system generates a train of 5 ns laser pulses at a repetition rate of 1 kHz. The laser beam is focused by a convex lens with a focal length of 160 mm, and the diameter of the focused laser beam is about 180 μm at the focal plane. By adopting such a method, vivid colors such as cyan, orange, and yellow are experimentally obtained, and the saturation is also improved by adding a SiO2 layer.Results and DiscussionsWith Si as the substrate and the coating time fixed at 20 s, 80s, and 120 s, the peak positions of the reflectance spectrum shift gradually from 609 nm, 602 nm, and 593 nm to 485 nm, 519 nm, and 524 nm in the long-wave band, and from 420 nm, 416 nm, and 401 nm to 394 nm, 375 nm, and 368 nm in the short-wave band respectively, as the laser scanning speed decreases. At a fixed laser scanning speed of 50 mm/s, the peak positions of the reflectance spectrum of the sample first shift to short wavelength from 585 nm to 538 nm with the increasing coating time, and then turn to 559 nm in the long wavelength direction. When the laser scanning speed increases to 200 mm/s, with the rising coating time, the spectrum shows a slight blueshifted trend and Δλ=17 nm (Fig. 6). In addition, by adding the SiO2 layer, under the scanning speed of 50 mm/s, the spectral reflective ratio is improved significantly and the reflectance peak positions change from 537 nm and 394 nm to 411 nm and 492 nm, showing a clear blueshift. At the same time, the half-peak width becomes narrower and the color saturation is higher (Fig. 8). Observations on the microscopic surface morphology show that under the same substrate, the longer coating time leads to thicker gold films, while the smaller sample scanning speed results in a greater degree of surface deformation of microstructures. When the scanning speed is small enough, the PS microsphere structure is destroyed or even disappears. Under the same scanning speed, the deformation degree of thin gold films without SiO2 is greater, and nano gold particles stack at the edge of the microsphere to form a metal ring, which also influences the measurement in the macroscopic spectral reflectance of the sample (Fig. 9).ConclusionsIn this paper, a 532 nm pulsed laser system is employed as an efficient method to modulate structural colors on metal-coated PS microsphere surfaces by changing the scanning speed with different substrates. The color turning method is carried out by controlling the deformation degree of the morphology of periodic structures, and thus various colors are obtained. The results show that with the same coating time, the central wavelengths of structural colors shift blue towards the short-wave direction as the laser scanning speed decreases. At the same scanning speed, the peak position of the reflectance spectrum first shifts blue from the long-wave to short-wave directions and then shifts red towards the long-wave direction as the coating time rises. When the laser scanning speed increases, the peak position of the reflectance spectrum presents a gradual blueshifted trend. In addition, when the SiO2 layer is added to the substrate, besides obvious changes in hue, the color saturation of samples is also significantly improved, while other parameters remain unchanged. Our study proposes a new method of color tuning and explores a low-cost application in green printing and anti-counterfeiting.
ObjectiveMost computer vision applications, such as structure from motion and camera pose estimation, rely on the assumption of linear pinhole camera models. However, the pinhole assumption is invalid for most commercially available cameras, and distortion correction for digital cameras is necessary. Methods for distortion parameter estimation can be classified into three major categories: point correspondence-based methods, multi-view auto-calibration, and line-based methods. Point correspondence-based methods estimate the distortion parameters by using a known pattern such as a chessboard, and they are highly reliable and accurate in distortion parameter estimation. However, these methods have high requirements for working conditions. Multi-view auto-calibration aims to extract camera parameters automatically from a sequence of arbitrary natural images without any special pattern. The main limitation of the method is that it requires multiple images under camera motion, and it is inappropriate for fixed cameras and online distortion parameter estimation. In contrast to the point correspondence and auto-calibration methods, line-based methods estimate distortion parameters by using distorted straight lines from a single image or a small number of images and can achieve robust distortion parameter estimation. However, line-based methods require at least three or more distorted straight lines to estimate the distortion parameters. In our research, we find that two distorted straight lines can provide the constraints of distortion parameters, and the ranges of the distortion parameters can be determined via these constraints. Based on the above conditions, we present a novel method for distortion parameter estimation via two distorted straight lines, and experimental results demonstrate that the proposed method is robust and efficient in distortion parameter estimation and can be widely applied.MethodsAccording to the property that the straight lines in three-dimensional (3D) space projected to the two-dimensional (2D) image plane do not change, an estimation method of lens distortion parameters based on two lines is presented in this study. Firstly, two distorted edges, which correspond to two straight lines, are used to derive the equation satisfied by the distortion parameters, and the ranges of the distortion parameters are determined using the size of the real image. Then an optimization objective function, which contains the distortion parameters, is constructed according to the fact that there are deviations between ideal straight lines and distorted straight lines, and the optimal distortion parameters are obtained using the enumerating-search method. The simulation and real experiments show that although the proposed method only uses two lines, it can accurately and effectively estimate the distortion parameters, which has obvious advantages compared with the mainstream methods.Results and DiscussionsThe simulated grid images and real images are used to test the proposed method, and the following results can be obtained:1) The proposed method is extremely accurate in distortion parameter estimation (Table 1 and Table 2), and it is applicable for correcting pincushion and barrel distortions (Fig. 3).2) In order to ensure the reliability and accuracy of distortion parameter estimation, two distorted straight lines, which are far from the image center, should be selected to estimate the distortion parameters (Fig. 4 and Fig. 5).3) The proposed method is robust with respect to varying noise levels from 0.1 to 1 pixel for simulated images, and it is better than the mainstream methods (Fig. 6).4) The proposed method is accurate enough for correcting real distorted images (Fig. 7).ConclusionsWe propose a novel method based on two distorted straight lines to estimate the distortion parameters. This method works on a single image and does not require a special calibration pattern. Experimental results show that the proposed method is robust and accurate in distortion parameter estimation compared with the mainstream methods, and it is extremely useful in many applications such as self-driving and self-parking.
ObjectiveThe traditional design of metamaterial absorber depends on the experience of researchers to obtain excellent optical performance by modifying geometric parameters. The design pattern of trial and error leads to low efficiency but high cost. Therefore, deep learning is proposed as an inverse design method to improve design productivity and shorten the design circle of terahertz (THz) metamaterial absorber due to the powerful learning ability. It can map the relationship of structural parameters with its absorption performance to predict the optimum value of structural parameters. However, the response spectrum composed of multiple sampling points is employed as the input, which results in a complex network system with a large number of input nodes, output nodes, and hidden layers. Therefore, this paper puts forward a way to simplify the structure of the neural network and apply it to the design of a THz metamaterial absorber with a novel top pattern of the circular ring and double-opening resonance ring.MethodsThe whole design process is divided into four steps in Fig. 1: determining key structural parameters of the top layer, processing data sets, analyzing the structure of the neural network, and predicting structural parameters. Step 1 is determining key structural parameters. The absorber designed in this paper is composed of three layers. The copper with conductivity σ=5.71×10⁷ S/m, permeability μ=4π×10-7 H/m, and thickness of 0.2 μm is selected for the top layer and bottom layer. The intermediate medium layer is FR-4 with the dielectric constant εr=4.3 and thickness of 50 μm. The pattern of the top layer is shown in the upper right of Fig. 1. According to the theory of LC electromagnetic resonance, the resonant characteristics of the unit are easily affected by the width of the circular ring (r1-r2), the width of the double-opening resonant square ring (L1-L2), and the opening width G. Step 2 is processing data sets. With the quality factor and absorptivity as inputs, and the structural parameters including the inner diameter of metal ring r1, the inner side length of double-opening resonance ring L1, and opening width G as outputs, 1000 sample data sets are calculated through CST simulation and divided into training sets and test sets according to the ratio of 7∶3. Step 3 is analyzing the structure of the neural network. The Sigmoid function is employed as the activation function of neurons. The error rate fluctuates with the changing number of hidden layers but reaches a minimum of 0.9% at five layers. Thus, the hidden layer is set to five. The mean square error is smaller when the number of nodes m=6, 9, and 12, and the error rate has an obvious minimum value when the number of nodes m = 6, 9, and 12. Therefore, the number of hidden layer nodes is set to be 6, 9, or 12. Step 4 is predicting structural parameters. When the demand performance is set as A=100% and Q=23, the structural parameters calculated by the neural network are r1=42.5 μm, L1=37 μm, and G=19 μm. The optical performance calculated by CST simulation is 99.99% and the quality factor Q is 23.2. Thus, the error of target absorption performance is 0.9%. When the required performance is set as A=85% and Q=30, the structural parameters calculated by the neural network are r1=45 μm, L1=35 μm,and G=21 μm. The optical performance by CST simulation is 85.86% and the quality factor Q is 31.7. Therefore, the error of the target absorption performance is 1.05%.Results and DiscussionsThis paper analyzes the influence of structural parameters r1, L1, and G on the absorption performance of the absorber. When r1=45 μm, the change trend of absorbance and Q value with L1 and G is shown in Fig. 3. The absorbance increases and the Q value gradually decreases as L1 increases and G decreases. When L1=36 μm and G=25 μm, the change trend of absorbance and Q value with r1 is shown in Fig. 4. The absorption rate decreases and the Q value increases with the rising r1. Additionally, the electric field distribution and surface current distribution of the high absorption structure at the resonance frequency f0=1.192 THz are analyzed as shown in Fig. 5. The electric field is mainly distributed at the four parts of the circular ring and the double-opening resonant ring. For the double-opening resonant ring, the surface current flows down through the left and right sides respectively to generate electric dipole resonance. For the external ring, the current mainly converges at the four parts of the adjacent double-open resonant ring, as the upper and lower of the ring, thus producing electric dipole resonance. The two absorbers of Model A and Model B designed for the requirements of high absorptivity and high Q value respectively with the same top layer pattern can be produced by micro-nano fabrication. When the fabrication tolerance of Model A is -2%-2%, the absorption rate fluctuates between 97.40%-99.99%, the absolute error is -2.6%-0, and the maximum relative error is 2.6%. The Q value fluctuates between 22.5 and 24.3, with an absolute error of -0.7-1.1 and a maximum relative error of 4.7%. Table 6 shows that when the fabrication tolerance of Model B is -3%-3%, the absorption rate fluctuates between 84.98%~89.10%, the absolute error is -0.88%-3.24%, and the maximum relative error is 3%. The Q value fluctuates between 30.8 and 31.7, the absolute error is -0.9-0, and the maximum relative error is 2.8%. This indicates that Model A is within the fabrication tolerance of -2%-2%, and Model B is within the fabrication tolerance of -3%-3%, with good fabrication tolerance.ConclusionsIn this paper, an absorber structure with a top pattern of the circular ring and double-opening resonant ring is proposed, and the reverse design of THz metamaterial absorber is realized through neural networks. The input and output nodes are simplified by electromagnetic resonance theory and absorption performance characterization to reduce the complexity of the neural network. The maximum absorption rate of metamaterial absorber designed by the proposed neural network can reach 99.99% at the frequency of 1.192 THz, which is close to perfect absorption. The maximum Q value can be 31.7 at frequency of 1.22 THz. The maximum relative error should not exceed 4.7% within the fabrication tolerance of -2%-2%. Additionally, this paper analyzes the influence of three geometric parameters on the absorptivity and quality factor in detail and discusses the absorption mechanism of the absorber from three aspects of current, electric field distribution, and equivalent circuit. The proposed method can effectively improve the design efficiency of metamaterial absorber according to the performance requirements and has great application prospects in terahertz functional device design.
ObjectiveCurrently, the traditional biomarkers used for human in vitro diagnostic testing are divided into two categories: proteins and nucleic acids. Traditional protein biomarkers include prostate-specific antigen (PSA) for prostate cancer, CA125 for ovarian cancer, CA19-9 for pancreatic cancer, carcinoembryonic antigen (CEA) for colorectal cancer, and alpha-fetoprotein (AFP) for liver cancer. Nucleic acid biomarkers include DNA and RNA. MicroRNA (miRNA) is an endogenous, non-coding, single-stranded, and small RNA, with a length equaling approximately 18-22 nucleotides, and regulates over 50% of human protein-coding genes. miRNA plays a key role in cell differentiation, proliferation, apoptosis, metabolism, and immune response. Its abnormal expression is associated with major diseases such as cardiovascular disease, neurological disease, immune disease, rheumatoid arthritis, and various cancers. Abnormal expression of miRNA can be detected in almost all types of cancer diseases, such as let-7's high expression and miR-155's low expression associated with poor prognosis in non-small cell lung cancer; miR-103 promotes cancer cell migration by increasing vascular permeability in liver cancer; miR-21 serves as upregulation of an oncogene in lung and breast cancers. miR-21 is the most commonly upregulated miRNA in tumor cells and is associated with every aspect of cancer development, including genomic instability and mutation, cell proliferation, inflammation, metabolic abnormalities, evading apoptosis, immune destruction, and growth inhibition.Results and DiscussionsmiRNA is an important biomarker in the detection of major diseases such as cancer. While quantitative real-time polymerase chain reaction (RT-qPCR) suffers from amplification bias due to reverse transcription limitations. Northern blotting has limitations in sensitivity. Next-generation sequencing (NGS) and single-molecule array technology (SiMoA) have advantages in low detection limits and high sensitivity. However, amplification bias or a lack of simplified workflow will hinder the real-time point-of-care medical diagnosis, treatment, and prognosis. In this paper, we presented a miRNA detection method based on the single-molecule detection principle.ConclusionsTo begin with, a sandwich structure was formed by using the Poisson distribution to create a complex. The captured probe-coated magnetic beads bound to half of the base pairs of the miRNA, satisfying the binding rule, while the other half of the miRNA base pairs bound to biotinylated detection probes. The detection probe then bound to streptavidin-poly-HRP, forming a complex. In an H2O2 solution, streptavidin-poly-HRP bound to the tyramine-Alexa Fluor 488 molecule in a catalytic deposition manner to amplify the signal. Subsequently, the complex was immobilized by using fibrin hydrogel instead of microfluidic chips. The complex underwent Brownian motion in solution, continuously moving in an irregular pattern and randomly colliding with other suspended complexes. In order to immobilize the complex and facilitate single-molecule counting of miRNA, a simplified method for immobilizing the complex was designed by using fibrin hydrogel instead of microfluidic chips, which solved the design and manufacturing issues required by microfluidic chips. Fibrin hydrogel was generated by the polymerization of fibrinogen under the action of thrombin and catalytic factors. Fibrinogen was a glycoprotein synthesized and secreted from stem cells, and each fibrinogen molecule consisted of three pairs of different peptide chains, namely α, β, and γ, which were arranged symmetrically on both sides. The molecules were connected by disulfide bonds both between and within the molecules, and fibrinogen molecules existed in a polymeric form in solution through intermolecular interactions. Firstly, fibrinogen was converted to fibrin peptides by the action of thrombin, resulting in an unstable soft clot. Then, the inactive fibrin stabilizing factor (Factor XIII) was activated by the action of thrombin and Ca2+ to become an active fibrin stabilizing factor (Factor XIIIa). Finally, under the action of Ca2+, the fibrin stabilizing factor completed the cross-linking of peptides through transglutaminase activity, forming fibrin hydrogel. As a degradable material, fibrin hydrogel had the characteristics of biocompatibility, a certain degree of transparency, transmission spectra covering ultraviolet to near-infrared, and high transmittance. At last, single-molecule counting processing was performed. After the fibrin hydrogel immobilized the complex, images were acquired in bright and dark fields, and single-molecule counting algorithms were applied. The single-molecule counting algorithm consisted of four steps. First, spot addressing. In the bright field, the complement of the image was calculated to make the magnetic beads bright and the background dark. The uneven illumination distribution effect was removed based on top-hat transformation. In the dark field, contrast enhancement was applied, and the uneven illumination distribution effect was removed based on top-hat transformation. Second, spot screening. In the bright field, single magnetic beads were identified and screened by morphology processing. In the dark field, single bright spots were identified and screened by morphology processing. Third, image overlay. The images obtained in the bright and dark fields were overlaid, aligning the positions of magnetic beads and bright spots. Fourth, information extraction. Magnetic beads with bright signals were recognized and counted as positive spots. Finally, all positive spots were counted to achieve ultra-sensitive quantification of miRNA.In this paper, human miR-21 was used as the detection target, with a detection limit of 6 fmol/L (Fig. 5). This method has great potential application value for future in vitro diagnosis and detection of miRNA.
ObjectiveIt is of great significance to study the optical properties of biological tissue and simulate the distribution of light in tissue for light therapy and diagnosis. Therefore, a theoretical model of optical properties needs to be determined. Currently, the model commonly used in biological tissue is the radiative transfer equation. The most widely used one is the first-order approximation of the radiative transfer model, namely the diffusion equation. However, in the case of small detection distance and large absorption, the diffusion equation is not accurate. Therefore, some people have studied the third-order approximation P3 equation of the radiative transfer model. Compared with the diffusion equation, the P3 equation is more accurate and more widely applied, but it is more complicated to establish a mathematical model. At present, several P3 equation models are studied in one layer medium. In fact, biological tissue is a multilayer medium, so it is necessary to establish the P3 model of multilayer tissue. At present, there are several models in the diffusion equation that can solve the problem in a multilayer medium. In particular, Kienle et al. obtained the exact solutions of the diffusion equation in the steady state and frequency and time domains of light transmission in two semi-infinite thick media through the inverse Fourier transform. It is necessary to establish the P3 equation of light transmission in two or more layers. In this paper, the P3 time domain equation of light transmission in a two-layer slab medium is given and compared with Monte Carlo simulation and diffusion equation.MethodsOn the basis of the radiative transfer theory, the P3 equation is given. According to Fourier transform method, the frequency domain solution is established. Based on the Fourier transform in the frequency domain, the time domain solution of the P3 equation in a two-layer slab medium is given. Monte Carlo simulation is a statistical verification method, which can replace experiments to verify the correctness of the theoretical model. The P3 time domain equation and diffusion equation are calculated, and the Monte Carlo simulation program for the multi-layer medium is written. The P3 time domain equation of light transmission in a two-layer slab medium is verified by Monte Carlo simulation. The advantages of the P3 time domain equation and the diffusion equation in the case of low absorption coefficient at a long distance and high absorption coefficient at a short distance are compared.Results and DiscussionsThe P3 time domain equation of the two-layer slab medium is compared with the Monte Carlo simulation. The results show that the reflectance and transmittance of the P3 time domain equation for light transmission in the two-layer slab medium are in good agreement with the Monte Carlo simulation results, which indicates that the P3 time domain equation for light transmission in the two-layer slab medium correctly reflects the light migration in the medium. The P3 time domain equation is compared with the time domain diffusion equation of a multi-layer medium. When the absorption coefficient is low, and the detection distance is large, the results of the P3 equation are consistent with those of the diffusion equation. Near the peak value, the reflectance error of the P3 equation is about 3%, and that of the diffusion equation is about 7%. The transmittance error of the P3 equation is about 7%, and that of the diffusion equation is about 13%. In other words, when the diffusion equation is satisfied, the P3 equation is more accurate than the diffusion equation at the peak value. When the absorption coefficient is high, and the detection distance is small, the reflectance error of the diffusion equation is about 30%. The transmittance error of the P3 equation is about 10%, and that of the diffusion equation is about 20%. It is further indicated that the reflectance and transmittance of the P3 equation are more accurate than those of the diffusion equation when the absorption coefficient is larger near the source. So the P3 time domain equation in a two-layer medium has an advantage over the diffusion equation.ConclusionsThe P3 time domain equation of light transmission in a two-layer slab medium is given. The P3 time domain equation is consistent with the Monte Carlo simulation results and is more accurate than the diffusion equation. So the diffusion equation of the two-layer medium can be replaced by the P3 time domain equation. When the optical parameters of the two layers are the same, a one-layer model can be derived. Therefore, the P3 equation in a two-layer slab medium not only includes the P3 equation in a one-layer slab medium but also lays the foundation for the P3 equation in a multi-layer slab medium. At present, the diffusion equation is used to extract the optical parameters of biological tissue, and the P3 equation in the one-layer medium is used to extract the optical parameters of biological tissue. Therefore, the P3 time domain diffusion equation in a two-layer medium can be used to extract the optical parameters of multi-layer media.
ObjectiveIn the optimization design of optomechanical systems, polynomials can not only retain a significant amount of information but also provide a more compact representation of structural deformation and facilitate integration between mechanical structures and optical models. Zernike polynomials have been widely employed due to their orthogonality properties on a unit circle. However, the orthogonality of Zernike polynomials only applies to continuous data on a circular aperture, and it degrades for discrete interpolation and non-circular apertures. Non-orthogonality means that coupling exists among different terms of polynomials, and the number of polynomials cannot be arbitrarily increased or decreased, which can lead to accuracy and stability problems in surface approximation and optimization design. This study aims to propose a conformal orthogonal basis generated by the eigenmodes of the Laplace equation for utilization in the topology optimization of support structures for reflective mirrors, thus avoiding Zernike orthogonality loss. Additionally, due to the conformal properties of the Laplace eigenmodes in the domain, the obtained basis represents the deformed information along the surface normal. As the principal direction of deformation, the surface normal makes the eigenmodes a better fit for surface deformations.MethodsThe Laplace characteristic equation and Zernike polynomials both originate from the Sturm-Liouville problem. The solutions on the planar circular domain exhibit similarities with Zernike polynomials, and Trevino et.al.[10] have compared the characteristic modal functions (Bessel circle polynomials) and Zernike polynomials in eye surface fitting, which indicates that the former provides better fitting. This paper extends the planar domain to surfaces. The finite element solution of the Laplace equation and properties of the eigenvalue problem ensure the discrete orthogonality of the characteristic modal functions. The mathematical properties of this equation guarantee the completeness of analytical solutions of the characteristic modal functions, and the completeness is verified by combining function approximation theory and numerical experiments. In addition, a specific topology optimization example demonstrates that the characteristic modal functions not only yield similar results to Zernike polynomials on circular domains but also can be applied to non-circular apertures where Zernike polynomials are not suitable.Results and DiscussionsFirst, based on the Sturm-Liouville decomposition on compact Riemannian manifolds, the completeness of the eigenmodes under analytic conditions is demonstrated. Then, the feasibility of adopting eigenmodes to fit surface deformations is numerically validated by adopting function approximation theory as the basis (Figs. 4 and 5). Additionally, this paper applies the method of surface approximation using eigenmodes to topology optimization of circular mirror support structures and compares it with Zernike polynomial approximation. The comparative results indicate that the objective functions optimized through characteristic modal functions and Zernike polynomials are 4.40% and 4.43% of the original structure respectively. The root mean square (RMS) values are 4.40% and 2.55% of the original structure respectively, and the peak to valley (PV) values are 10.51% and 8.73% of the original structure respectively. Both methods prove comparable optimization effectiveness (Table 1). The curves of the objective and constraint values during the iteration show that both methods have consistent stability and can converge (Figs. 11 and 12). However, there are slight differences in the resulting structures (Figs. 9 and 10). After comparative experiments, this study applies the modal fitting method to a hexagonal mirror, thereby completing the topology optimization design of a hexagonal mirror support structure (Fig. 14) and extending its applicability to non-circular apertures.ConclusionsThis paper proposes to adopt a conformal orthogonal basis, which is the Laplace eigenmodes, for approximating surface deformations, and applies it to topology optimization of optical structures. It also demonstrates analytically and numerically that the Laplace eigenmodes are not only completed on circular domains but also on other irregular shapes. Surface eigenmodes can be employed to approximate smooth mirror surface deformations and achieve topology optimization of optical single mirror support structures with specific modal coefficients being the optimization objectives. Two optimization examples show the applicability of the proposed basis on circular domains and its extensibility on non-circular domains. However, compared to Zernike polynomials, the Laplace eigenmodes studied in this paper only exist in piecewise discrete numerical solutions, which means that the eigenmodes do not have an analytical representation like Zernike polynomials. When solving for the normal of a deformed mirror surface, it is necessary to pay attention to the continuity of the normal vector at the element boundary, which is a field that deserves further exploration in future work.
ObjectiveEconomic tolerance is characterized by meeting the image quality requirements and minimizing processing costs, and it thus achieves looser tolerances. In nature, it is the balance of the relationship between image quality and processing costs. At present, in the research related to the establishment of the relationship function between image quality and tolerance, the theory is macro, and modulation transfer function (MTF) is mostly used as the image quality evaluation standard for detailed study, which makes the image quality single. In the analysis based on ray tracing theory, only three structural parameters, namely the radius of curvature, thickness, and refractive index are included, with fewer types. In addition, in the current method, the differential ray tracing method cannot ensure the accuracy of the image quality function in some instances. In contrast, the Youngworth method results in excessive image quality traces. Therefore, we wish to enrich the image quality evaluation methods and improve the types of structural parameters. Meanwhile, we propose methods that have high precision and can reduce the number of image quality traces.MethodsThe functional relationship between the tolerance and the image quality is usually expressed by the form of the second-order Taylor formula. In the equation, the first-order derivative and the second-order derivative are called the first-order sensitivity coefficient and the second-order sensitivity coefficient, which can be collectively referred to as the sensitivity coefficient. The sensitivity coefficient effectively measures the sensitivity of the image quality to the structural parameters. The first-order sensitivity coefficient determines the trend of the image quality. Due to the analysis of the effect of two different structural parameters on the image quality, the second-order sensitivity coefficient ensures the accuracy of the image quality function. In this paper, wavefront aberration is used as the image quality evaluation criterion. The first-order sensitivity coefficients of eccentricity and decenter structural parameters with respect to wavefront aberration are deduced and improved based on ray tracing theory, which solves the shortcoming of a few types of structural parameters. In order to address the problem of excessive image quality traces, two methods of sequential derivation and formula transfer term are proposed to establish the mathematical model of the second-order sensitivity coefficient, so as to realize high-precision, simple, and fast establishment of function.Results and DiscussionsFirstly, a doublet optical system is optimized and designed for theoretical verification (Fig. 3, Table 1). Secondly, in order to verify the accuracy of the fitting of the function between the tolerance and the image quality established by using the theory of this paper, the fitting analysis is performed for single-parameter tolerance and two-parameter tolerance and compared with the existing Youngworth method (Figs. 4-7). The verification results reveal that both the formula transfer term method and the Youngworth method have basically identical fitting accuracy for single and two parameters. The residual sum of squares is in the range of 10-6-10-7, but the number of traces of the formula transfer method is far less than that of the Youngworth method, which requires a smaller amount of data. However, the sequential derivation method can only be used to analyze the optical back focal length and verifies that it is linearly with the wavefront aberration. Eventually, the economic analysis of the doublet lens is carried out according to the economic tolerance theory. The set of economic tolerances for wavefront aberration of -0.5λ is listed (Table 5), as well as a graph demonstrating the relationship between wavefront aberration and cost (Fig. 8).ConclusionsThe application of the tolerance and image quality relationship function proposed in this paper to establish the model can enrich and improve the variety of structural parameters, effectively reduce the number of image quality traces, and ensure the high accuracy of the fitting. The research results show that the first-order sensitivity coefficients can be solved by the formula transfer term method that can avoid the integration operation with the ray tracing theory. Although image quality tracing is applied to calculate the second-order sensitivity coefficient, the number of traces is significantly reduced compared with the Youngworth method, which relieves the pressure of data storage and maintains the high fitting accuracy of the function. This method can be used to efficiently assign economic tolerances of optical systems. The sequential derivation method requires no additional tracing image quality. However, this method involves complex solutions, difficult practice, and limited application. Currently, only the back focal length that is linear with the wavefront aberration can be effectively analyzed. In addition, the proposed tolerance wavefront aberration fitting methods have significance for other image quality evaluation methods and can promote the application of economic tolerance for optical systems.
ObjectiveScattering caused by the thickness of the absorber layer of the mask leads to deviations in deep ultraviolet (DUV) and extreme ultraviolet (EUV) lithography. Traditional lithography models are based on Hopkins' method and the thin mask approximation, wherein diffracted waves from the mask satisfy the Fourier transform of the mask patterns. As the aspect ratio of the absorbing layer on the mask increases, the mask thickness becomes a non-negligible factor in diffraction calculation. Thick absorbers change the diffracted waves, particularly along the edges of the pattern. To accurately predict the aerial image, a 3D mask model is proposed to correct the Hopkin's model using the mask near fields generated via rigorous electromagnetic simulation, such as the finite-difference time-domain (FDTD) method. The computational cost of rigorous electromagnetic simulations can be reduced using a fast mask near-field generation method based on rotation transformation and dimension reduction. By combining a 3D mask model with a fast near-field generation method, an accurate 3D mask lithographic model can be rapidly constructed. The 3D mask model offers the advantages of less runtime and high accuracy when dealing with cases involving complex source and any-angle mask patterns.MethodsFirst, a rotation transformation was applied to any given case. The source was decomposed by polarization, and each component of the source was rotated with the incident edge in such a way that the incident angle of the light remained unchanged on the vertical or horizontal incident edge. Next, a 2D FDTD simulation was implemented by reducing the dimension of the simulation area along the incident edge. This 2D FDTD simulation generates a 1D accurate electromagnetic wave distribution near the mask absorbers, with the 1D accurate wave distribution describing the diffracted wave on the line perpendicular to the incident edge. Subsequently, the FDTD-generated 1D wave distribution was expanded along the incident edge and used to modify the thin mask approximated results to obtain a correct mask transmission function. Finally, the modified mask transmission function calculated the aerial images involving mask 3D effects.Results and DiscussionsRigorous electromagnetic simulations are conducted via FDTD, wherein electromagnetic wave propagation is modeled by solving Maxwell's equations on Yee's grid. A 3D FDTD simulation is conducted with oblique incidence on a square with a 30-degree rotation angle (Fig.3). The mask absorber is set as MoSi with a 70 nm thickness and a refractive index of 2.2. The near fields after mask diffraction are calculated, with an emphasis on the fields on the marked line perpendicular to the edges. Subsequently, 3D FDTD simulations with a rotated source on Manhattan polygons are performed (Fig.4, 5). The incident angle of the wave on the observed edge is kept equal to that of the original case. Furthermore, near fields of y and z polarization components are calculated and weighted superposition is derived (Fig.6). Next, a series of 2D FDTD simulations with a rotated source and dimension reduction is conducted. Near fields along the line perpendicular to the observed edge are calculated, and superposition is applied. Finally, the 1D edge near fields extracted from 2D near fields generated via 3D FDTD is compared with the results generated directly via 2D FDTD (Fig.7). The agreement of the edge near fields demonstrates the applicability of the rotation and dimension reduction method. Furthermore, the 2D simulation shows advantages in runtime, taking 2 min, while the 3D simulation takes approximately 40 min.ConclusionsA novel mask 3D imaging model for lithography is developed in this study. The principles of the Hopkin's model are analyzed to reveal that the mask transmission function can no longer be derived directly from the Fourier transform by considering scattering caused by the thickness of the absorber layers. The FDTD method is applied to calculate the near fields of absorbers to implement rigorous electromagnetic simulation. Experimental results show that the near fields on the line perpendicular to the observed edge can be calculated quickly with high accuracy by applying rotation transformation and dimension reduction. Any incident angle on an any-angle edge can be converted to a Manhattan case, and near fields can be computed rapidly using 2D FDTD simulation. These near fields are then used to derive a correct mask transmission function, and the modified Hopkin's approach calculates aerial images on the wafer. The method used in this paper has a shorter runtime when handling complex or even freeform illumination sources and masks with any-angle polygons. Furthermore, because near fields can be generated in advance and the corrected mask transmission function can be reused in the entire layout, this method becomes more practical in 3D mask image models for full-chip prediction. This helps foundries save time in the production flow.
ObjectiveStructured light beams with controllable intensity distribution have received great interest recently. Many new-type beams exhibit unique physical properties including diffraction-free, self-bending, orbital-angular-momentum-carrying, and abruptly autofocusing. Particularly, non-diffracting beams can retain their intensities and shapes during propagation and have been widely used in laser micromachining, particle manipulation, and microscopic imaging. The first type of non-diffracting beam is the Bessel beam, which was first discovered by Durnin in 1987. It is a wave packet solution expressed as a Bessel function and derived from the Helmholtz equation in a cylindrical coordinate system. Additionally, Bessel beams have a doughnut-shaped intensity distribution and phase singularity at their center and also exhibit many unique optical properties. Most non-diffracting beams are associated with the known, exact solutions of the wave equation and match with special forms of the angular spectrum. It is the angular spectrum that determines the beam propagation dynamics, as well as the intensity profiles. To achieve diverse transverse shapes of non-diffracting beams, a traditional method is to solve the wave equation under different coordinates. For example, the cosine beam, the Mathieu beam, and the Weber beam were obtained by solving a wave equation in a rectangular coordinate system, an elliptic coordinate system, and a parabolic coordinate system, respectively. Later, more non-diffracting beams were constructed by superimposing the basic fundamental non-diffracting beams. Recently, the typical accelerating Airy beam also exhibits unique non-diffracting characteristics as well as self-acceleration and self-healing. However, current methods are limited to producing only a limited non-diffracting structured light beam, which greatly restricts their applications. Consequently, it is imperative to create a greater variety of non-diffracting beams with diverse transverse intensity distributions so that the capabilities of non-diffracting structured light beams can be enhanced. We demonstrate a universal method for designing and generating non-diffracting structured light beams with arbitrary shapes. Such light beams can be tailored by predefining appropriate spectral phases. Unlike conventional approaches, our method overcomes the traditional limitation that these non-diffracting beams are always constructed from wave equation solutions. The ability to produce non-diffracting beams with arbitrary transverse shapes offers potential benefits for manipulating particles along arbitrary transverse trajectories and could inspire new applications in optical micromachining, manipulation, and wavefront control.MethodsWe develop an efficient, simple, and universal optical caustic approach from the perspective of geometric optics. Concretely, our idea is to design a suitable spectral phase to produce a non-diffracting beam with the desired shape. Then, the relationship between the spectral phase and the beam structure is established based on the stationary phase approximation that relies on the cancellation of components due to rapid phase oscillation. Subsequently, the desired non-diffracting beams are generated by imposing the constructed spectral phase on a plane wave. Further, a modified algorithm is developed via spectral phase superposition. In this way, non-diffracting beams with arbitrary structures are generated. Experimentally, the non-diffracting beams with arbitrary shapes can be generated at the focal plane of a Fourier transform lens illuminated by a plane wave, as described in Fig. 4.Results and DiscussionsWe break through the traditional constraints of solving the Helmholtz partial differential equation to obtain arbitrary non-diffracting beams. The constructed non-diffracting beams exhibit diverse transverse structures, such as circular and parabolic shapes (Fig. 2), kidney-shaped and 8-shaped (Fig. 3), as well as heart-shaped (Fig. 5). The maximum intensity is always located in the predefined trajectory because the second derivative for the phase part described by Eq. (6) equals zero. The one-to-one correspondence between the transverse beam shape and the spectral phase is established (Eq. (5) and Eq. (7)), and this makes our approach possible to manipulate and generate various non-diffracting beams. Moreover, an improved algorithm is developed to generate non-diffracting beams with arbitrary transverse shapes (Eq. (8)) that can consist of both convex and concave trajectories. The numerical results are consistent with the experimental results (Fig. 6). The non-diffracting property is also discussed, as demonstrated in our numerical and experimental results which exhibit an obvious non-diffracting property. Such non-diffracting beams would also be advantageous for manipulating particles following arbitrary transverse shapes.ConclusionsIn summary, we develop an effective strategy and a practical technique to achieve non-diffracting beams with an arbitrary transverse intensity distribution. The proposed approach breaks the limitation that the classical non-diffracting beams are always constructed from the solutions of wave equations. The beam shape can be readily customized by the desired spectral phase constructed using optical caustics. The constructed non-diffracting beams with arbitrary shapes greatly enrich the family of structured light beams and would be beneficial to manipulating particles following such transverse shapes. They are likely to provide ideas for new applications in optical micromachining, manipulation, and wavefront control.
ObjectiveHigh harmonic is a crucial technology for generating bright and coherent light sources in extreme ultraviolet (EUV) and X-rays for a wide range of applications, including material science, chemistry, and biology. High harmonic is also used in attosecond science, which studies the ultrafast dynamics of electrons in atoms and molecules on their natural timescale of attoseconds (10-18 s). High harmonic has traditionally been studied in gases and solids, but recent research has shown that it can also be observed in liquids. High harmonic in liquids offers several advantages over traditional gas-phase and solid-phase high harmonic. Firstly, liquids have higher electron densities than gases. Second, liquids can withstand higher laser intensities and can repair damage automatically compare with solids. Thus, high harmonic in liquids is a promising candidate for a compact and brighter EUV source. Therefore, it is crucial to reveal the underlying mechanism of liquid-phase high harmonic. However, there are many fundamental questions in liquid-phase high harmonic. In theory, Zeng et al. conducted a study in 2020 to investigate liquid-phase high harmonic by using a disordered linear chain and proposed a formula that could quantify the cutoff energy. Subsequently, Xia et al. proposed a statistical two-level model and revealed the role of localized charge-resonance states in high harmonic from disordered liquids. In experiments, Luu et al. reported the observation and detailed characterization of high harmonic in the EUV region from liquid water. Here, we study the high harmonic from liquid water by solving the semiconductor Bloch equations (SBE) in length gauge and investigate the modulation of the spectral shift in harmonic spectra driven by two-color laser fields. Our findings indicate that manipulating the relative phase of two-color laser fields can control the frequency and yield of odd harmonics and allow for the fine tuning of the high harmonic spectrum. We believe that our primary findings will be helpful for future studies on strong-field and attosecond electron dynamics in liquids.MethodsFirst, by solving the SBE in length gauge, the high harmonic from water driven by two-color laser fields consisting of a fundamental field and its second harmonic is studied. Then, time-frequency analysis of the calculated high-order harmonic current is carried out by wavelet transform to gain more information about the high harmonic process. After that, the contributions from positive and negative half-cycles in the time domain are artificially separated and respectively transformed into the frequency domain to see how the inter-half-cycle interference affects the frequency shift of different harmonic orders. Next, the frequency shift of H9 and H10 from positive and negative half-cycles in different phase differences is calculated. Furthermore, the time of re-encounter in the positive and negative half-cycles dictated by the motion of electrons and holes in real space is calculated.Results and DiscussionsA typical high harmonic spectrum (Fig. 2) of water shows that the harmonic spectrum contains both odd and even harmonics. The generation of even harmonics is the consequence of the asymmetric two-color field. A clear sign of a plateau is shown, followed by a cutoff at the 23rd harmonic. Another important feature of the spectrum is that the harmonics are all blue-shifted. It can be attributed to the nonadiabatic effect. The time-frequency analysis (Fig. 3) shows that the high-order harmonics are mainly generated in the rising edge of the fundamental pulse. In the rising edge of the laser field, the high harmonic possesses a positive chirp and thus leads to a blue-shifted spectrum. Furthermore, it is shown that by changing the relative phase of two-color laser fields, the even- and odd-harmonics are periodically modulated (Fig. 4). As the relative phase is tuned from 0 to π, the redshift of odd-harmonics increases, and the odd-harmonics yield increases first and then decreases. As the relative phase is tuned from 0 to 0.5π(0.6π-0.9π), the contribution of the positive half-cycle to odd-order high harmonic is greater (less) than that of the negative half-cycle (Fig. 5). As the relative phase is tuned from 0 to π, high harmonic produced in the negative half-cycle is blue-shifted first and then red-shifted, while high harmonic produced in the positive half-cycle is always red-shifted (Fig. 6). According to the different contributions from different half-cycles (Fig. 5) and the phase difference results from the time interval between two adjacent half-cycles (Table 1), the interference between the positive and negative half-cycles (Eq. 8) is analyzed. In conclusion, these phenomena can be attributed to inter-half-cycle interference between positive and negative half-cycles.ConclusionsIn this study, high harmonic in liquid water driven by two-color laser fields consisting of a fundamental field and its second harmonic is investigated. Our analysis focuses on the spectral blueshift, and time-frequency analysis reveals that the high harmonics are mainly generated during the rising edge of the fundamental pulse, resulting in a blue-shifted harmonic spectrum. Besides, by tuning the relative phase of two-color laser fields, both the amplitude and the center frequency of high harmonic can be modulated. These phenomena can be attributed to the interference of high harmonic emitted from positive and negative half-cycles. This study might shed new light on the attosecond electron dynamics in liquids and the tuning of liquid-phase high harmonic.
ObjectiveThe high-order Bessel beam (HOBB) is a special kind of vortex beam that carries orbital angular momentum (OAM) and shows non-diffractive and self-healing properties. Thus, HOBBs exhibit great application potential in laser micro/nanofabrication, microparticle manipulation, optical illumination, and nonlinear optics. So far, HOBBs have been generated by several methods, such as traditional optical systems, spatial light modulators, and metasurface. These methods, however, are incapable of achieving both high integrity and high laser-induced damage threshold (LIDT). Based on femtosecond laser-induced birefringent nanograting, a novel method is proposed for the fabrication of integrated optical modulation elements with high LIDT in this work. Multilayer structures with variable phase distribution embedded in silica glass enable the superposition of multiple optical modulation functions for the desired wavelength. For instance, an integrated HOBB generator is fabricated, and the optical modulation characteristics are demonstrated to be consistent with the simulation results. In addition, the LIDT of the fabricated HOBB generator is as high as 28.5 J/cm2 (6 ns), which has considerable application potential for high-power laser modulation. Consequently, this method can be applied to the fabrication of further integrated optical elements with a high LIDT.MethodsThe laser-induced nanograting is an anisotropic structure with birefringent properties. First, the principle of geometric phase modulation is derived based on the birefringent nanograting. The birefringence characteristics of nanograting, including optical axis direction and phase retardance, can be employed to obtain the geometric phase modulation. Second, how the laser processing parameter affects the birefringence of the laser-induced nanograting in silica glass is explored. Then, two independent geometric phase optical elements (GPOEs), including a spiral phase plate (SPP) and a planar axicon, are fabricated and characterized individually. Within silica glass, a multilayer structure with spatially variable optical axis distribution is created by modifying the optical axis direction and phase retardance of nanograting. Finally, the phases of the two GPOEs are integrated. Two forms of nanograting (SPP and planar axicon) with different optical axis distributions are written in separate depths of silica glass. Thus, the incident Gaussian beam is transformed into a HOBB when passing through the multilayer structure. In order to evaluate the laser damage resistance of the prepared optical element, the LIDT is measured by the standard 1-on-1 method (based on the ISO 21254 LIDT test standard).Results and DiscussionsWhen the incident beam is circular polarization, and the retardance of nanograting is half-wave, the output cross-polarized beam will be encoded with a geometric phase change of twice the optical axis angle with high efficiency. The optical axis of the nanograting is perpendicular to the polarization direction of the femtosecond laser (Fig. 3). Therefore, by controlling the polarization direction of the laser, nanograting with spatially variable optical axis directions can be written inside the silica glass. The phase retardance of the nanograting is affected by laser processing parameters. When the laser pulse density is 100 pulse/μm, and the pulse energy is 0.3 μJ, the average retardance of the nanograting is 67.79 ± 1.47 nm at different focusing depths (Fig. 4). In this case, only four layers of the nanograting are required to provide a half-wave retardance of 532 nm. Then, it is demonstrated that the fabricated SPP and planar axicon have excellent optical modulation capability (Fig. 5 and Fig. 6) and that it is feasible to prepare other GPOEs by this method. The interference image shows that the SPP is capable of carrying the OAM of the target value. Over a transmission distance of 2 meters, the planar axicon maintains outstanding non-diffraction properties. After that, the HOBB generated by the integrated element is evaluated (Fig. 7). The light field is typically distributed as a black and hollow ring, with the central ring concentrating the majority of the light intensity. The HOBB carries a topological charge corresponding to its design value of 4. In the non-diffraction distance measurement, the HOBB maintains an almost constant spot size over a transmission distance of 4 meters (Fig. 8). It is noteworthy that the zero-probability LIDT of the prepared optical element is as high as 28.5 J/cm2 (6 ns) (Fig. 9), which presents significant benefits in high-power beam shaping applications.ConclusionsIn the present study, a method for fabricating an integrated optical modulation element with a high LIDT is proposed and verified. The nanograting is a subwavelength birefringent structure whose optical axis direction and phase retardance can be modified by the laser polarization direction and processing parameters, respectively. The nanograting with spatially variable optical axis distribution can be written inside the silica glass at different depths. The multilayer cascade structure modulates the phase of the incident beam to generate the target beam. Based on the femtosecond laser-induced nanograting, an integrated HOBB generator with an operating wavelength of 532 nm and topological charge of 4 is fabricated. The test results indicate that the optical field modulation performance of the generator is satisfactory. The HOBB generated by the prepared element carries the specified topological charge and keeps spot size constant over a long non-diffraction transmission distance (4 meters). It is crucial that the LIDT of the prepared optical element is as high as 28.5 J/cm2 (6 ns). This method enables the integration of optical elements with distinct functions, providing a novel concept for the integrated preparation of optical elements with high LIDT and complicated optical field modulation.
ObjectiveThe experimental realizations of collisionally inhomogeneous ultracold Bose gases have not only greatly broadened the research scopes of ultracold atomic physics but also provided an ideal platform to explore novel quantum phenomena. Especially, studies on the peculiar properties and the novel quantum states and their quantum control in collisionally inhomogeneous ultracold Bose gases have been hot topics in the fields of both ultracold atomic physics and quantum information. The bright solitons of ultracold Bose gases have potential applications in quantum information, atomic interferometers, and atom lasers. Gertjerenken et al. predicted that the bright-bright solitons could be used to generate Bell states. Helm et al. found that the division and fusion of bright solitons in the ultracold Bose gases trapped in the ring well could be used to implement the Sagnac interferometer. Furthermore, in the composite potential composed of harmonic trap potential and Rosen-Morse barrier, the collision of the bright soliton can also be applied to the interferometer. In addition, stable propagation of bright solitons can be used to achieve atomic lasers. The precise control of the bright soliton in ultracold Bose gases is particularly important for the application of ultracold Bose gases.Experiments have confirmed that the ultracold Bose gases can be controlled by adjusting the external potential and the interaction strength between atoms. With the development of experimental techniques, atomic interactions can be tuned by utilizing Feshbach resonance. In theoretical studies, several forms of time-dependent atomic interactions, such as the exponential function and the periodic function, have been proposed. The changed atomic interaction has an important effect on the properties of bright solitons in the ultracold Bose gases. For example, as atomic interaction increases, the amplitude of the bright soliton in the ultracold Bose gases increases, and its width decreases. When the atomic interaction exceeds a critical value, a transition behavior from oscillation to localization is observed in the ultracold Bose gases.MethodsFirstly, we use the Darboux transformation to obtain the analytical solution of solitons in ultracold Bose gases with the time-dependent atomic interactions. Then, we explore the dynamics of solitons in the ultracold Bose gases with spatiotemporally modulated interactions in an expulsive parabolic potential by Crank-Nicolson method.Results and DiscussionsFirstly, we obtain the analytical solution of solitons in ultracold Bose gases by Darboux transformation. It is found that the atomic interaction increasing (decreasing) exponentially with time has a drag (push) effect on solitons in ultracold Bose gases with an expulsive parabolic potential (Fig. 2). Then, the dynamics behavior of bright solitons is explored by Crank-Nicolson method. There is a critical initial speed of solitons in the ultracold Bose gases with unchanged atomic interaction. When the initial speed of solitons is less than the critical value, a reflection behavior of solitons can be observed (Fig. 3). When the initial speed of solitons exceeds the critical value, a transmission behavior of solitons can be found (Fig. 4). When the initial speed of solitons is equal to the critical value, a localization behavior of solitons can be observed (Fig. 5). In order to investigate the effect of expulsive parabolic potential on this localization behavior of solitons, we calculate localization behaviors of solitons at different trapping frequencies. It is found that the critical initial speed of solitons increases with the trapping frequency (Fig. 6).Subsequently, we consider the exponentially time-dependent atomic interactions. When the initial speed of solitons is equal to the critical value, a transition behavior from localization to reflection (transmission) is observed in the ultracold Bose gases with exponentially increasing (decreasing) atomic interactions (Fig. 7). When the initial speed of solitons is less than the critical value, the transition behavior from reflection to transmission is observed in the ultracold Bose gases with exponentially decreasing atomic interactions (Fig. 8). When the initial speed of solitons exceeds the critical value, the transition behavior from transmission to reflection can be found in the ultracold Bose gases with exponentially increasing atomic interactions (Fig. 9).Finally, we calculate the dynamics behavior of bright solitons in the ultracold Bose gases with spatially modulated interactions in an expulsive parabolic potential. The localization behavior of solitons in the ultracold Bose gases with an expulsive parabolic potential can also be found (Fig. 10). Compared with that in Fig. 6, the critical local speed of the soliton in Fig. 11 decreases. Even if the initial speed is 0, the soliton can also pass through the potential barrier (Fig. 12). It is mainly attributed to the position-dependent atomic interaction. Meanwhile, a periodic oscillation of solitons with an expulsive potential barrier is newly observed (Fig. 12). The oscillation period of solitons can be controlled by tuning the atomic interaction (Fig. 13) and the trapping frequency of potential (Fig. 14).ConclusionsIn this paper, we analyze the reflection, localization, transmission, and oscillation behaviors of solitons in ultracold Bose gases with spatiotemporally modulated interactions in an expulsive parabolic potential, and find that: 1) the atomic interaction increasing (decreasing) exponentially with time has a drag (push) effect on solitons in ultracold Bose gases with an expulsive parabolic potential; 2) there is a critical initial speed of solitons in the ultracold Bose gases with unchanged atomic interaction, and a localization behavior of soliton can be observed at the critical speed; 3) the localization-reflection and transmission-reflection transitions of solitons are obtained by tuning the atom interactions; 4) a periodic oscillation of solitons with an expulsive potential barrier is newly observed, and the oscillation period of solitons can be controlled by tuning the atomic interaction and the trapping frequency of potential. These results can provide some help for the application of ultracold Bose gases in quantum information.
ObjectiveAttosecond pulses are currently the shortest radiation pulses that can be obtained, and their ultra-fine temporal and spatial resolution has become an important tool to study ultra-fast electron dynamics in atoms and molecules. At present, the high-order harmonic generation from the interaction of femtosecond pulses with atoms or molecules is the only effective means to produce desktop attosecond pulse radiation sources. Thus, researchers have proposed many advanced techniques for generating isolated attosecond pulses in experiments and theories, such as few-cycle laser pulses, dual-color or multi-color fields, and polarization gating schemes. The orthogonally polarized dual-color fields, composed of two linearly polarized pulses with different wavelengths and perpendicular polarization directions, have become an effective way to control electron motion with the characteristics of polarization modulation and two-color field. By numerically simulating the interaction between helium atoms and orthogonally polarized dual-color fields composed of 4 fs/800 nm driving pulses and 8 fs/400 nm gating pulses, we obtain a 54 as high-intensity isolated attosecond pulse. The advantage of this scheme is that a single quantum trajectory (short trajectory) can be selected during a single atomic response. Additionally, the isolated attosecond pulse is less affected by the relative phase between the two pulses and by the change in the electric field intensity of the gating pulse.MethodsThe high-order harmonic generation from the interaction of the orthogonally polarized two-color field with helium atom is studied numerically by the strong field approximation theory. Attosecond pulses are synthesized by superimposing the super-continuum harmonic spectra. The ionization rate of helium atoms is calculated through the ADK tunneling ionization theory model, and the classical trajectory of electrons is calculated using the semi-classical three-step model theory proposed by Corkum.Results and DiscussionsAn orthogonally polarized bichromatic field consisting of a 4 fs/800 nm driving pulse and an 8 fs/400 nm gating pulse interacting with helium atoms is employed to obtain a super-continuous harmonic spectrum with high intensity and small oscillation amplitude. The supercontinuum harmonic range extends from 120th to 180 th order (Fig. 1), which is fully consistent with the calculation results of the semi-classical three-step model theory [Figs. 2(a) and (b)]. The electron trajectory shows that the platform harmonics mainly come from the contribution of short-orbit electrons. Due to its short motion time, less wave packet diffusion, and no interference with the harmonics generated by long-orbit electrons, the high-order harmonic spectrum in the direction of the driving pulsed electric field presents the characteristics of a super-continuous platform region with higher intensity and smaller modulation amplitude [Fig. 2(c) and (d)]. To further verify the rationality of the classic analysis, we adopt the wavelet transform method to calculate the time-frequency analysis diagram of the high-order harmonic emission when the orthogonally polarized two-color field irradiates the helium atom. The obtained results are consistent with the above supercontinuum harmonic spectrum range (Fig. 3). By superimposing the entire supercontinuum band in the spectrum, an isolated attosecond pulse with a duration of 54 as and an intensity of 3.2×10⁻⁶ is generated [Fig. 4(b)]. The results are three orders of magnitude stronger and shorter than the isolated attosecond pulse with a duration of 126 as and an intensity of 1.9×10⁻⁹ generated in a single 800 nm titanium sapphire laser pulse [Fig. 4(a)]. In addition, we find that under the current selected pulse laser parameters, the selection requirements of the relative phase among the combined pulses are not strict, and isolated attosecond pulses with shorter pulse widths can be obtained in the range of 0.3π. Additionally, controlling the change of pulse electric field intensity exerts little effect on the above numerical simulation results (Fig. 5). Furthermore, in terms of the cutoff position of the harmonic emission spectrum and harmonic conversion efficiency, the proposed orthogonally polarized bichromatic field scheme has obvious advantages over the parallel polarized bichromatic field scheme with the same parameters.ConclusionsWe obtain the broadband super-continuous harmonic spectrum with small oscillation amplitude through the orthogonally polarized bichromatic field synthesized by a titanium gemstone pulse and its second harmonic pulse interacting with helium atoms. The origin of the super-continuous harmonic spectrum is explained based on analyzing the electronic motion orbit, and it is attributed to a single contribution of short-track electrons with a short motion time and less wave packet dispersion. By performing Fourier transformation on the supercontinuum harmonic, a high-intensity isolated attosecond pulse with a duration of 54 as is obtained. The isolated attosecond pulse is less affected by the relative phase between the two pulses and by the change in the electric field intensity of the gating pulse.
ObjectiveThe application of stereoscopic display, virtual reality, and head-mounted devices requires research on binocular properties of the human vision system (HVS). Threshold measurement is one method to investigate the characteristics of visual perception. At the same time, there are some color vision phenomena related to binocular vision systems that cannot be explained. One of the phenomena is called hue cancellation, which can also occur in binocular vision. Thus, it is called binocular hue cancellation and is a special phenomenon in binocular color fusion. Currently, most studies on binocular color fusion focus on the reproduction of glossiness in binocular color fusion, quantitative measurement of the thresholds of binocular color fusion, and the distinction between binocular color fusion and rivalry. However, as far as we know, no particular studies on binocular hue cancellation have been reported. To investigate the color vision mechanism of this particular phenomenon, we design a psychophysical experiment. We also investigate the opposite color directions and hue cancellation thresholds within the binocular color fusion that can perceive gray in the CIELAB color space and represent the experimental results in the LMS, Macleod-Boynton, and DKL color spaces respectively to provide experimental data for exploring the visual properties of HVS and the mechanism of binocular color.MethodsWe research a Samsung 3D display (S23A950D) with 2D/3D switching capability, requiring the observer to wear specific 3D switching glasses to obtain binocular vision. Eight opposite color directions are selected at 22.5° intervals in the isoluminance plane of CIELAB color space, and color stimulus sample pairs are selected at equal intervals in each direction (Fig. 4). The experiment is conducted among five college students between the ages of 22 and 25 with normal vision, and each of them experiences at least 19800 color stimuli. We carry out the experiment in a dark room and first employ the adjustment method to determine the opposite color directions in which the binocular hue cancellation phenomenon could occur and the initial values of the binocular hue cancellation thresholds. Then the limit method is adopted to accurately determine the binocular hue cancellation thresholds.Results and DiscussionsThe experimental results show that binocular hue cancellation phenomenon could occur only when red-green (R-G), yellow-blue (Y-B), and yellow green-purple (YG-P) color pairs are combined (Fig. 6). The binocular hue cancellation thresholds of the five observers are expressed in the CIELAB, LMS, Macleod-Boynton, and DKL color spaces respectively. In the CIELAB color space, the range of binocular hue cancellation thresholds in the R-G color direction is 11.36-13.58, with a mean value of 13.03, and the range of thresholds in the Y-B direction is 8.14-10.07, with a mean value of 9.25. The range of thresholds in the YG-P direction is 11.26-15.55, with a mean value of 13.02. Among them, the Y-B combination has the smallest threshold, and the average thresholds of the R-G and YG-P combinations are almost equal (Table 2). After exchanging the colors viewed by the left and right eyes, the obtained binocular hue cancellation thresholds are similar, which indicates that the dominant eye does not affect the binocular hue cancellation phenomenon. Five observers are largely different in thresholds of the YG-P direction, and one of them has much smaller thresholds in the R-G direction than the others, showing individual differences in the binocular hue cancellation phenomenon (Fig. 7). In the LMS color space, the six color directions are uniformly distributed and almost divide the L-M plane into six equal parts. The color directions in the L-M plane and the L-S plane are symmetric about the S axis, and the thresholds in the L-M plane are shown as a straight line parallel to the S axis (Fig. 8). In the Macleod-Boynton chromaticity diagram, the binocular hue cancellation thresholds of six colors are close to the white point, indicating the saturation of the colors which can produce the binocular hue cancellation phenomenon is low (Fig. 9). In DKL space, the direction of YG-P overlaps with the cardinal direction S-(L+M), while the directions of R-G, Y-B, and the cardinal direction L-M are not close to each other (Fig. 10).ConclusionsThe binocular hue cancellation phenomenon is investigated through a visual psychophysics experimental method. The results show that the particular phenomenon can only occur in three color directions of red-green, yellow-blue, and yellow green-purple, which means observers can only perceive gray in the three directions. There are individual differences in binocular hue cancellation thresholds of the five observers, but the thresholds in the yellow-blue direction are all minimal. Because the study on visual mechanisms is strongly related to the choice of color space, the binocular hue cancellation thresholds of the five observers are expressed in the color spaces of CIELAB, LMS, Macleod-Boynton, and DKL respectively. The binocular hue cancellation directions are more uniformly distributed in LMS, Macleod-Boynton, and DKL color space approximately in six equal parts, implying the specificity of these six hues. The binocular hue cancellation threshold occupies only a small range in Macleod-Boynton color space, thus indicating that the binocular hue cancellation phenomenon not only occurs in the three color directions but also occupies only a small range within the color range that can be perceived by the human visual system.