


Please enter the answer below before you can view the full text.
4-3=

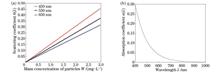
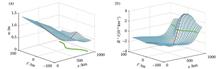
ObjectiveUnderwater quantum communication is of great significance to seabed exploration and global communication, whose quality is affected by the complex and changeable marine environment. The stable and high-quality transmission of optical quantum signals can ensure the accurate transmission of information. In the process of underwater quantum communication transmission, various marine environmental factors will inevitably lead to the attenuation of communication links, such as seawater molecules, algal suspended particles, and marine sediment particles. However, up to now, research on the effect of marine non-pigment agglomerated particles on the performance of underwater quantum channels has not been carried out. Non-pigment suspended particles in seawater mainly include suspended sediment particles, mineral particles, and excreta of marine organisms. During underwater quantum communication, the collision between non-pigment agglomerated particles and light quantum signals will cause the attenuation of optical signals, which can lead to the attenuation of communication links and reduce the reliability of underwater quantum communication. It is expected that the simulation results in this study can provide a reference for the design and optimization of quantum communication systems in the marine environment.MethodsMarine non-pigment suspended particles are agglomerated particle systems formed by multiple single particles. After linear superposition approximation treatment for marine non-pigment agglomerated particles of different sizes, they can still be regarded as spherical particles, similar to equivalent spheres. Firstly, Mie scattering theory and the Gordon model are used to analyze the absorption and scattering characteristics of marine non-pigment agglomerated particles. Then, the relationship model between mass concentration of marine non-pigment agglomerated particles and link attenuation is built, and simulation experiments are carried out. After that, a physical model for the quantum security key generation rate under the influence of marine non-pigment agglomerated particles is constructed, and the simulation experiment is conducted for the preparation and measurement quantum key distribution system. For quantum communication networks based on entangled states, the influence of marine non-pigment agglomerated particles on the establishment rate of underwater quantum channels is studied and analyzed. In addition, the capacity of the amplitude damping channel in a marine non-pigment environment is analyzed and calculated.Results and DiscussionsFor the same wavelength, the Mie scattering coefficient of marine non-pigment agglomerated particles is proportional to the mass concentration; for the same mass concentration, a shorter incident wavelength means a greater scattering coefficient. Moreover, the absorption coefficient of marine non-pigment agglomerated particles is exponentially related to the incident wavelength (Fig. 1). The link attenuation decreases with the increase in the wavelength of the incident light signal, and a larger mass concentration of marine non-pigment agglomerated particles is accompanied by a more significant decreasing trend of the quantum link attenuation (Fig. 2). When the optical signal wavelength is constant, the link attenuation shows an upward trend with the increase in the mass concentration of non-pigment agglomerated particles (Fig. 3). The generation rate of the quantum security key grows with the increase in the wavelength of the incident light signal and drops with the increase in the mass concentration of marine non-pigment agglomerated particles (Fig. 4). The establishment rate of quantum channels is greatly affected by fidelity. For the same fidelity, the establishment rate increases with the increase in the wavelength of the incident optical signal, but the overall upward trend is gentle (Fig. 6). The capacity of the amplitude damping channel shrinks with the increase in the mass concentration and transmission distance of marine non-pigment agglomerated particles (Fig. 9). Overall, a higher incident wavelength indicates better quality of underwater quantum communication when only marine non-pigment agglomerated particles are considered.ConclusionsIn the present study, the scattering and absorption characteristics of non-pigment agglomerated particles are analyzed according to the Mie scattering theory and the Gordon model. For different wavelengths of optical signals, the relationship models between mass concentration of marine non-pigment agglomerated particles and link attenuation, generation rate of the quantum security key, channel establishment rate, as well as the capacity of the amplitude damping channel are constructed and simulated. The experimental results show that for quantum communication using 510-nm optical signals, the link attenuation increases from 2.562 to 13.100 when the mass concentration of non-pigment agglomerated particles increases from 0 to 3 mg/L. When 580-nm wavelength signals are selected as the incident wavelength, the mass concentration of non-pigment agglomerated particles is 1.2 mg/L, and the transmission distance increases from 0 to 2 km, while the generation rate of the quantum security key increases from 2.17×10⁻⁴ to 8.30×10⁻⁵. When 540-nm optical signals are used for underwater quantum communication, and the fidelity increases from 0.60 to 0.99, the quantum channel establishment rate is attenuated from 93.61 to 7.39 pair/s. For underwater quantum communication with 580-nm optical signals, when the mass concentration of non-pigment agglomerated particles is 1.8 mg/L, and the transmission distance increases from 0.5 to 10 km, the channel capacity decreases from 0.726 to 0.040. When the transmission distance is greater than 7 km, and the mass concentration is greater than 2.1 mg/L, the capacity of the amplitude damping channel is less than 0.069, and the communication efficiency is extremely low.
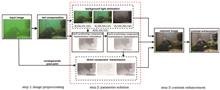
ObjectiveAs the primary means of exploring and transmitting ocean information, the acquisition and analysis of underwater video images have undoubtedly become a research hotspot for many scholars in recent years. To solve the problems of color shift, low contrast, and blurred edge details caused by absorption and scattering of light propagating underwater, researchers have clarified underwater images based on enhancement and restoration methods. By employing digital image processing techniques, enhancement-based methods improve the quality of images from the spatial domain or transform domain, such as histogram equalization, white balance, and wavelet transform. Recovery-based methods restore image clarity by solving the underwater imaging model. The main methods include improving the dark channel prior (DCP), fitting the background light scattering component, and suppressing inhomogeneous illumination. However, the above-mentioned enhancement methods do not consider the physical propagation properties of underwater light, resulting in localized over-enhancement of the images and poor subjective evaluation. The underwater imaging model adopted in the recovery method ignores the difference in transmittance between the direct attenuation component and the back scattering component, resulting in poor robustness of the model. In addition, during the parameter solution, the complex underwater environment tends to interfere with the correct estimation of the background light and transmittance parameters by these methods. Therefore, this paper builds a more robust underwater imaging model. To reduce the interference caused by the image distortion to the parameter solution, it preprocesses the original image for red channel compensation and completes the model solution through the preprocessing image, realizing the restoration of the underwater image.MethodsBased on the traditional underwater imaging model, this paper investigates the parameter dependence of transmittance in the direct attenuation component and the back scattering component and builds a dual transmittance underwater imaging model. In solving the model, firstly, a red channel compensation algorithm is designed for preprocessing the image through the pixel correlation among the three channels to reduce the interference of color distortion to the parameter solution. Then, based on the quadtree hierarchical search algorithm, three background light candidates are obtained using smoothness, color difference, and luminance features to search, and the background light values are selected for the color channels according to the input image's luminance and edge intensity. The transmittance of the back scattering component is obtained by improving the dark channel prior and adding the saturation component refinement, and degradation-free pixel points are employed to obtain the direct component transmittance. Finally, the recovered image is obtained by inversely solving the imaging model and using histogram stretching satisfying the Rayleigh distribution to eliminate the effect of inhomogeneous illumination on imaging.Results and DiscussionsThe test dataset is classified into color distorted images, fogged images, and images with artificial light by imaging scenes, and classified images as research objects. First, an ablation study is performed to verify the proposed model's validity. The results in Fig. 8 show that the dual transmittance can more accurately describe the underwater light attenuation characteristics, and the incident light attenuation term can improve the image's overall brightness and darkness difference. Then, the underwater color correction experiment of the color plate (Figs. 9 and 10) is further carried out and compared with the common underwater image restoration algorithm. Figs. 9 and 10 indicate that the proposed method accurately restores the colors of grayscale color blocks and color blocks. Finally, three sets of classified images are selected for testing (Figs. 11, 12, and 13), and the results of all methods are evaluated by UIQM, NIQE, and entropy metrics. The experimental results show that the proposed method can not only accurately correct the color distortion of the images in different scenes but also restore the detailed information more accurately, with precise edge contours.ConclusionsThis study builds a robust underwater imaging model with dual transmittance for the problem of color shift, blurred details, and low contrast in the images obtained in different underwater scenes. A red channel compensation algorithm is proposed to preprocess the source images based on this model which is solved through the preprocessed image to restore the underwater image. The experimental results of subjective and objective indexes show that compared with common underwater image clarification methods, the proposed method performs better in terms of color balance and more realistic detail information restoration when applied to images collected from different underwater scenes. In this paper, building the dual transmittance underwater imaging model plays a crucial role in image recovery. Before solving the model, the preprocessing means can improve the parameter estimation accuracy but will reduce the operational efficiency of the algorithm. It will be essential to work in the future on how to perform the noise reduction process for underwater images more quickly and accurately.
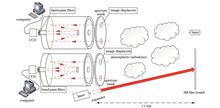
ObjectiveAtmospheric turbulence causes laser scintillation, beam wanders, beam spreading, and angle-of-arrival fluctuation. The atmospheric coherence length (r0) proposed by Fried is a parameter related to the wavefront-phase structure function, an important parameter for characterizing the intensity of atmospheric optical turbulence. Hence, ground-based in-situ measurement of r0 is of great significance for studying the optical wave propagation effect in the atmosphere. The differential image motion monitor (DIMM), a traditional measurement method of r0, has been widely studied in that it is capable of avoiding measurement errors caused by the vibration of the observation and the tracking equipment and unstable tracking. However, in the scene of long-distance optical turbulence measurement, DIMM needs a power supply and working staff to maintain light beacon images in the center of CCD image sensors. In this study, the original passive beacon is converted into an active illumination beacon to realize single-ended optical turbulence measurement inspired by DIMM. This lidar-style r0 measurement still faces the uncertainty of reflecting media in atmospheric turbulence. Therefore, this paper proposes a fold-path r0 measurement method based on laser-active illumination of a 3M reflective film. With the help of a large-area 3M film, the observed area and distance can be enlarged, and the laser source and CCD imaging system can be integrated into one single-ended unit. Upon the construction of this new layout experiment system, the results of the fold-path r0 measurement can help validate the fold-path optical wave propagation model and explore long-range single-ended optical turbulence telemetry.MethodsFirst, the theory of atmospheric coherence length on the fold path link is summarized. Then, the results of the all-day laser-active illumination imaging data are analyzed through the switching of the active illumination beacon and conventional 650 nm laser beacon for the measurement of r0. In addition, the comparative experiments of the traditional DIMM and fold-path DIMM are conducted on a 1.1 km optical propagation link. The system is mainly composed of the YSL-SC-PRO-M fiber laser, 3M microcrystal prism array, beam expander system, Meade ACF14F8 telescope (the receiver's aperture is Φ=355 mm, and its sub-aperture is Φ=120 mm), and Allied Vison GT 1920 CCD. One DIMM device is adopted to switch between different beacons to measure r0, so as to eliminate the measurement error caused by different DIMM devices. Echo beam wave wander experiments are carried out on the same 1.1 km optical link with an atmospheric coherence meter recording atmospheric optical turbulence conditions to validate the jitter turbulence inversion methods of the active illumination beacon. A CMOS camera (with a resolution of 1936 pixel×1096 pixel) coupled with a telescope (Φ=200 mm, f=1200 mm) is utilized to record the laser speckle images. A 10 nm optical filter is set up in front of the camera to reduce the sky background radiance. All the above units are mounted on a sturdy platform. A square 1 m 3M film pasted on a flat carbon fiber board is placed at a certain distance perpendicular to the laser beam. After that, turbulence-degraded laser speckle images are obtained by the fold path imaging method, and the multi-day laser-active illumination imaging data is analyzed.Results and DiscussionsComparative statistical analysis of fold-path DIMM and traditional DIMM measurement results is shown in Fig. 3. The data of the two different methods exhibit good consistency, and fold-path DIMM can also reveal the turbulence strength variation at the transition moment. The comparison with another traditional DIMM measurement result shows that the deviation of results obtained by the two methods is about 2.5%. The measurement result of fold-path DIMM is slightly smaller than that of traditional DIMM (Fig. 4), which means the laser speckle reflected by the prisms embedded in the film has been severely degraded. Thus, the backward transmitted laser speckle should be non-coherent differing from the coherent beacon employed in traditional DIMM. The comparison results of Cn2 inversion by centroid drift and DIMM under the circumstances of unfocused and focused beams indicate that the results of the focused beam are consistent with those of DIMM measurement (Figs. 5 and 6). The coefficient of determination R2 under the unfocused condition is 0.88 while that under the focused condition is 0.94. Therefore, this paper presumes that a large laser divergence angle results in laser energy missing at the observing termination COMS, which is not reflected by 3M films.ConclusionsIn this paper, the 3M reflective film is regarded as a reflective surface with a certain correlation length and root-mean-square height characteristics. With high reflectivity, fine particles, uniform reflection, and easiness of being spliced into a large-area array, the 3M reflective film is employed as a cooperative target of laser-active illumination imaging. Compared with the results of the traditional DIMM, those of fold-path DIMM have an average deviation of 2.5% throughout the day because backward transmitted laser speckles shall be considered non-coherent. The relative position of the laser emission system and the telescope receiving system is fixed, which simplifies the complexity of the experimental optical path aiming. The results show that the coefficient of determination of the image motion method is ca. 0.94, which allows the system to be further simplified for the telemetry of optical turbulence. Additionally, this transceiver method can eliminate the influence of platform vibration. Combined with a pulsed laser and a high-sensitivity camera, it can be applied to measure the atmospheric coherence length at different distances. Relevant experimental results are conducive to validating the fold-path optical wave propagation model and exploring long-range single-ended optical turbulence telemetry.
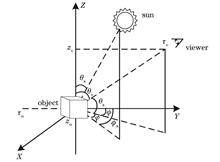
ObjectiveAtmosphere visibility is an important and popular indicator for evaluating the atmosphere quality and is of great significance for our daily life and traffic safety. According to the observation paths, visibility can be defined as horizontal visibility and slant-range visibility. In some cases, slant-range visibility may be different from horizontal visibility to some degree. In civil aviation, horizontal visibility or ground visibility is normally measured by ground-based equipment called transmissometer. Reported horizontal visibility is employed for air traffic management. However, slant-range visibility is more important for pilots during flights. Thus, far slant-range visibility has not been applied in air traffic management, which is due to the absence of feasible methods for deriving or measuring slant-range visibility. The space-borne lidar CALIOP carried by the sun-synchronous satellite CALIPSO is capable of obtaining the atmosphere properties along the vertical direction, and therefore, it is a good candidate for deriving the slant-range visibility. We aim to develop a sufficient method of deriving slant-range visibility with high accuracy based on the aerosol data provided by CALIPSO and the theory of atmosphere radiative transfer.MethodsWe successfully derive the slant-range visibility for North China through the aerosol data provided by the CALIPSO satellite and the atmosphere radiation transfer model of SBDART. Firstly, the aerosol optical properties are characterized by optical depth, single scattering albedo, and scattering phase function provide by the CALIPSO aerosol products. They are leveraged in solving the atmosphere radiative transfer equation using the SBDART model. As the result, the spatial sky background radiance is obtained. The target-background brightness contrast is hence obtained, which is adopted to determine the slant-range visibility based on the visibility definition. Consequently, the atmosphere layer is determined for the desired brightness contrast. Finally, the δ-two-stream approximation is utilized to estimate the sky background radiation with high spatial resolution within the specific atmosphere layer. The slant-range visibility is hence derived with high accuracy.Results and DiscussionsThe radiance on the ground obtained by the proposed method is shown to have a relative difference of 12.3% from that obtained by the MARRA-2 dataset (Fig. 7). The results show that the sky background radiance obtained by the proposed method is accurate and can be applied for deriving the slant-range visibility. The slant-range visibility obtained with and without the help of δ-two-stream approximation is compared (Table 1). The results show that the invisibility under the two conditions is significantly different for low-visibility weather and small observation pitch angle, while it tends to be consistent with each other as the atmosphere visibility and pitch angle increase. When the slant-range visibility is less than 1 km, the average relative error of slant-range visibility with and without the help of δ-two-stream approximation is about 15.0%, while the average relative error is about 6.2% with the slant-range visibility of less than 10 km. For low-visibility weather and small pitch angle, the slant-range visibility obtained by the proposed method is expected to have higher accuracy because the sky-background radiance is derived with higher spatial resolution. On the other hand, slant-range visibility is obtained through the empirical expression for slant-range visibility. The results of slant-range visibility for low-visibility weather are shown to have a good correlation with the correlation coefficient of 0.928 (Fig. 10). Meanwhile, under the assumption that the slant-range visibility is less than 1 km, the average relative error of slant-range visibility retrieved by this method is about 7.1% compared with that of the empirical expression. Nevertheless, the empirical expression is valid only for air-to-ground observation angles smaller than 15° (Table 2). The proposed method is sufficient for deriving slant-range visibility with high accuracy under a wide range of observation angle.ConclusionsWe propose a new method of deriving slant-range visibility based on the aerosol products provided by the CALIPSO satellite and the atmosphere radiative transfer model SBDART. The δ-two-stream approximation is first introduced in solving the atmosphere radiative transfer equation using the SBDART model. As a result, the sky-background radiance is obtained with high spatial resolution, which enables us to derive the slant-range visibility with high accuracy. We successfully derive the slant-range visibility of North China. The results show that in certain circumstances the derived slant-range visibility obtained by the proposed method has good consistency with that obtained without employing δ-two-stream approximation, and the average relative error between them is about 15.0%. It is also the case when the derived slant-range visibility using the proposed method is compared with the slant-range visibility obtained by the empirical expression. When the slant-range visibility is less than 1 km, the average relative error of slant-range visibility is about 7.1%, which verifies the reliability of the slant-range visibility calculation results. This indicates that the proposed method also has excellent performance and solves the problems of the standard SBDART model under small pitch angles. Additionally, the proposed method exhibits higher accuracy of slant-range visibility and may be applied for extensive weather and observation conditions.
ObjectiveThe risk of spacecraft damage caused by space debris is increasing. The ground-based laser space-debris removal (GBLSDR) is an effective method for removing centimeter-scale space debris in the low-earth orbit region. However, the problem of high-power laser beam propagation through the atmosphere will be encountered by the GBLSDR. For the application of GBLSDR, the beam power is well above the critical power of the self-focusing effect in the atmosphere. Until now, several studies have been carried out to analyze the influence of the self-focusing effect in the atmosphere on the beam quality at the debris target. It is shown that the intensity at the debris target decreases because of the self-focusing effect in the atmosphere. It is found that uniform irradiation at the debris target may be achieved because of the phase modulation caused by the self-focusing effect in the inhomogeneous atmosphere. In addition, the influence of the beam spatial coherence and the beam order on the self-focusing effect in the inhomogeneous atmosphere is also studied. However, these studies are restricted to the steady-state self-focusing effect in the inhomogeneous atmosphere, and they fail to consider the quasi-steady-state self-focusing effect. It is known that a pulsed beam is more suitable for the application of GBLSDR than a continuous wave (CW) laser beam. When the response time of media to the field is much shorter than the pulse width, the self-focusing effect can be called the quasi-steady-state self-focusing effect. Therefore, it is important to study the influence of the quasi-steady-state self-focusing effect in the inhomogeneous atmosphere on the beam quality at the target surface for the application of GBLSDR.MethodsIn general, under the standard paraxial approximation, the propagation of a high-power laser beam propagating from the ground through the atmosphere to space orbits can be described by the nonlinear Schr?dinger equation. In addition, the B integral is an important characteristic parameter to quantitatively describe the beam quality degradation due to the self-focusing effect. Based on the B integral of a high-power laser beam propagating vertically from the ground through the atmosphere to the debris target, the beam propagation model can be simplified as two stages, i.e., nonlinear propagation in the homogeneous atmosphere and linear propagation in a vacuum. According to the simplified beam propagation model, the influence of the quasi-steady-state self-focusing effect of a partially coherent light pulse (PCLP) propagating in the inhomogeneous atmosphere on the beam quality at the target surface is studied analytically.Results and DiscussionsIn this study, the analytical expressions [Eq. (9), Eq. (10), and Eq. (12)] for the beam width, curvature radius, and actual focal length of a PCLP propagating from the ground through the atmosphere to the space orbit are derived, respectively. It is shown that the focal shift will take place because of the quasi-steady-state self-focusing effect, which results in an increase in the spot size on the debris target (Fig. 1). In order to suppress the quasi-steady-state self-focusing effect, the quasi-steady-state and steady-state modification methods are proposed. Furthermore, the analytical expression [Eq. (13)] for the modified focal length of the quasi-steady-state and steady-state modification methods is derived, and the applicable condition of the modified focal length is given [Eq. (15)]. It is shown that the spot size on the space-debris target decreases under the quasi-steady-state and steady-state modification methods, and smaller spot size on the space-debris target can be achieved by the quasi-steady-state modification method (Fig. 5).ConclusionsIn order to reduce the spot size and increase the laser intensity on the space-debris target (i.e., improve the beam quality on the target), the influence of the quasi-steady-state self-focusing effect of a PCLP propagating in the inhomogeneous atmosphere on the beam quality at the target surface is studied analytically in this study. The analytical expressions for the beam width, curvature radius, and actual focal length of a PCLP propagating from the ground through the atmosphere to the space orbit are derived, respectively. The focal shift takes place because of the quasi-steady-state self-focusing effect, which results in an increase in the spot size on the debris target. The quasi-steady-state and steady-state modification methods are proposed to suppress the quasi-steady-state self-focusing effect. It is found that a smaller spot size on the space-debris target can be achieved by the quasi-steady-state modification method. However, in practice, the steady-state modification method is easier to be performed than the quasi-steady-state modification method.
ObjectiveThe mesosphere-lower thermosphere (MLT) region is an important space region in the earth's atmosphere. As a significant parameter of atmospheric thermodynamics in the MLT region, the temperature is of great academic significance and application value. Since it is not affected by weather and geographical conditions, satellite-borne temperature detection can perform all-weather and long-term observation on a global scale. Thus, it becomes an important detection method to obtain the three-dimensional distribution and spatio-temporal evolution in the mid-upper atmospheric temperature. Previous satellite payloads, such as the wind imaging interferometer (WINDII) and the high-resolution Doppler interferometer (HRDI) on the UARS satellite, and the sounding of the atmosphere using broadband emission radiometry (SABER) on the TIMED satellite, have made contributions to the distribution detection of the mid-upper atmospheric temperature field. However, the MLT region still suffers from problems including incomplete space coverage or low detection accuracy. In October 2019, the Michelson interferometer for global high-resolution thermospheric imaging (MIGHTI) on NASA's ionospheric connection (ICON) explorer measured the radiation intensity of the O2-A band through five discrete wavelength channels and obtained three years of continuous observation data. Based on the onion peeling algorithm and the theory of the O2-A band airglow spectrum, this paper retrieves the atmospheric temperature profile in the 92-140 km area via the O2-A band airglow radiation intensity measured by MIGHTI. In addition, comparisons with the observation results of the SABER satellite, the simulation data of the NRLMSIS-00 atmospheric model, and the temperature product of MIGHTI obtained by the ICON team using an optimization algorithm are conducted systematically to verify the rationality of MIGHTI temperature retrieval.MethodsThe relative radiation intensity of each spectral line in O2-A band airglow which follows the Boltzmann distribution is affected by temperature. MIGHTI samples the O2-A band signal through five channels, and the strength of signals in the B and D channels increases with the rising temperature, whereas the strength of the signal in channel C is just the opposite. The ratio of signal channels with different temperature responses is independent of the emission rate, and also changes monotonously with the temperature. Therefore, the atmospheric temperature can be accurately retrieved by measuring the ratio of channel signal strengths. The relative radiance of O2-A band on the line of sight obtained from the limb-viewing observation of MIGHTI is stripped by the onion peeling algorithm to obtain the relative intensity of the target layer. Then, according to the relative intensity of the target layer of channels B, C, and D, the atmospheric temperature profile information is retrieved through combining the functional relationship between the channel strength ratio calculated by the MIGHTI instrument parameters and the temperature.Results and DiscussionsTo evaluate the rationality and reliability of the MIGHTI temperature retrieval results obtained by the onion peeling algorithm, this paper verifies the MIGHTI retrieval results by comparing the measured data of SABER and simulation data of atmospheric model NRLMSIS-00. The results show that MIGHTI temperature retrieval is in good agreement with SABER at 92-100 km, and the temperature distribution of MIGHTI is basically consistent with that of the empirical model in the altitude range below 130 km, which shows the overall retrieval reliability of MIGHTI on a global scale. According to the characteristics of annual mid-upper atmospheric temperature changes, the detected temperature ratio of MIGHTI and SABER to the model temperature is calculated in one day of four seasons respectively. In the altitude range of 92-100 km, the temperature ratio profiles of MIGHTI and SABER are similar and very close to 1, which proves that MIGHTI has a strong temperature retrieval rationality in this altitude range. It is also compared with the temperature profile obtained by the optimization algorithm adopted by the ICON team to further evaluate the rationality of the onion peeling algorithm for retrieving MIGHTI temperature. Within the height range that can be retrieved by the optimization algorithm, the difference between the temperature values retrieved by the two algorithms differs slightly within ±5%, which further verifies the rationality of the temperature retrieval by the onion peeling algorithm.ConclusionsThe O2-A band airglow measured by MIGHTI is retrieved and the atmospheric temperature distribution in this region is calculated by the onion peeling algorithm. By comparing the observation results of the SABER satellite, the NRLMSIS-00 atmospheric model data, and the MIGHTI temperature products obtained by the ICON team using the optimization method, the paper verifies the reliability and rationality of MIGHTI temperature retrieval. By measuring the shape of the O2-A band airglow radiation spectrum, MIGHTI can detect the atmospheric temperature profile between 92-140 km, which covers the MLT area effectively. The minimum temperature error is 1 K at 90 km, and the maximum temperature retrieval error is 13 K at 140 km.
ObjectiveThe surface of the object which in nature is rough relative to the wavelength of light beams is a rough target. When the light is incident on the rough target, the beam will be scattered, and the receiving end will receive the light intensity pattern of alternating light and dark waves, which is called speckle pattern. The echo scattering characteristic of the light field is one of the key technologies for the integration of underwater laser communication and detection in the future. In ocean detection technology, underwater scattering technology, and underwater wireless optical communication technology, the transmission characteristics of beams through oceanic turbulence and echo characteristics of beams through the rough surface play a crucial role in turbulent conditions. The physical characteristics of the rough target surface (surface roughness, coherence length, deformation degree, motion velocity, and rotation velocity) play an important role in influencing echo characteristics. The current studies mainly adopt the fractal method, wavelet transform, deep learning, and other methods to process the laser speckle pattern collected at the receiving end. The surface roughness, deformation degree, translation velocity, and rotation velocity of the rough target can be identified. The current underwater detection technology is mainly laser, but the laser loss during detection is serious, thus resulting in limited rough target information reflected by the received speckle. Since the vortex beam features hollow intensity distribution, phase helix, and orthogonality of orbital angular momentum (OAM), it can carry more information than the Gaussian beam. Laguerre-Gaussian (LG) beams are typical vortex beams with significant advantages in light scattering and target recognition. At present, there are two aspects to study the scattering characteristics of light beams through rough targets. The first is the speckle characteristics of light beams through the rough surface in free space, and the second is the speckle characteristics of light beams through the rough surface in atmospheric turbulence. The propagation theory of vortex beams through oceanic turbulence is very mature, but the scattering characteristics of vortex beams through Gaussian random rough surface in weak oceanic turbulence are rarely studied.MethodsSpatial coherence property is a part of the echo scattering property, which can reflect the coherence of the echo field between two points in space. The spatial complex coherence degree of the beam is utilized to represent the spatial coherence property of the echo field. The spatial distribution of the speckle is related to the surface coherence length of the rough target. We build a double-path transmission model of LG beam through Gaussian random rough surface in weak oceanic turbulence by referring to the scattering characteristics of vortex beams through the rough surface in atmospheric turbulence. Based on the generalized Huygens-Fresnel diffraction principle, the intensity of the echo speckle field of LG beams reflected by a rough surface with Gaussian distribution in oceanic turbulence is derived. The influences of the LG beam's light source parameters, oceanic turbulence intensity, and rough surface roughness on speckle field complex coherence degree are investigated.Results and DiscussionsThe effects of light source parameters, oceanic turbulence, and rough target surface parameters on the complex coherence of the echo speckle field are analyzed numerically. Figs. 4-10 show that complex coherence decreases with the increasing topological charge, waist radius, and wavelength of LG beams, decreases with the increase in oceanic turbulence intensity, and rises with the increasing coherence length of the rough surface. Additionally, when the coherent length of the rough surface is larger than that of spherical wave propagating in oceanic turbulence, the complex coherence degree does not change significantly. This shows that the influence of rough surfaces on complex coherence is much less than that of oceanic turbulence.ConclusionsThis study is based on the generalized Huygens-Fresnel diffraction principle and the relative advantages of vortex beams in suppressing turbulence effect due to the special helical phase characteristics of the beams. Then the analytical expression of the scattering intensity of LG beams through the rough surface in oceanic turbulence is innovated, and the theoretical expression of the complex coherence of the scattering field at the receiving end is obtained. The results indicate that the complex coherence decreases with the increasing topology charge, waist radius, and wavelength of the LG beam, decreases with the rising oceanic turbulence intensity, and rises with the increasing dry length of the rough surface. However, when the coherent length of the rough surface is larger than that of the spherical wave propagating in oceanic turbulence, the complex coherence degree does not change significantly. This shows that the influence of rough surfaces on complex coherence is much less than that of oceanic turbulence. The analytical expression of the light field scattered by LG beams through the rough surface and the complex coherence of the light field of the back wave derived in this paper provides a theoretical basis for underwater target detection.
ObjectiveVehicle exhaust contains gases such as NH3 and CO2 and is becoming an essential source of air pollution and greenhouse effect. The intracavity absorption gas sensing technology based on fiber ring laser has many advantages, which are very suitable for real-time detection of toxic and harmful gases in environmental protection. However, when the gas sensing system based on a thulium-doped fiber laser is applied for quantitative analysis of mixed gas, the gas detection accuracy is often affected by cross interference caused by overlapping spectral absorption lines between component gases, and a nonlinear shift led to by changes in temperature and pressure at the experimental sites. As a small sample machine learning method, support vector machine (SVM) based on statistical theory has high accuracy and good generalization ability. It can be combined with infrared spectrum analysis to build a mixed gas volume fraction regression prediction model and correct nonlinear interference, thus greatly improving the accuracy and reliability of the gas quantitative analysis.MethodsIn this paper, an active intracavity gas sensing system based on a thulium-doped fiber laser is built to collect the absorption spectrum data of NH3 and CO2 gases. The system is mainly divided into an adjustable light source (part A), a sensing part (part B), a data acquisition and processing part (part C), and a gas distribution part (part D). Before collecting the gas spectrum, sufficient nitrogen is introduced into the gas chamber to eliminate the interference of water vapor and CO2 in the gas distribution instrument. The experimental environment is 0.1 MPa under normal pressure, and the sampling rate of the acquisition card is 20 kHz, with 20 groups of data being collected and 12 samples for each group of data. Before building the model, spectral data should be preprocessed to reduce the impact of background noise and improve the signal-to-noise ratio. However, it is inappropriate to do too much preprocessing to avoid losing some important spectral information. We also preprocess the spectral data through the methods of denoising, baseline correction, and smoothing. With an aim to improve the modeling speed, principal component analysis (PCA) is employed to project the multi-dimensional linear transformation of the original gas absorption spectrum data into a high-dimensional space to obtain the principal components corresponding to the maximum variance. The principal components at this time are leveraged to replace the eigenvalues in the original data, reduce the data dimension, and prevent the correlation between variables from affecting the extraction of these components and the prediction accuracy of the regression model. The standard particle swarm optimization (PSO) algorithm has fast convergence and short optimization time, whereas it features premature convergence of the model, low accuracy of optimal solution search, and low efficiency of later iteration. Therefore, we propose an improved algorithm, which is adaptive mutation particle swarm optimization (AMPSO). By introducing an adaptive mutation operator, the updated particle positions are randomly mutated so that particles can enter other regions of the solution space to continue searching, thereby improving the ability of particle swarm optimization to jump out of the local optimal solution and avoid premature convergence of the algorithm model. The optimal combination of parameters obtained from the NH3-SVM model and the CO2-SVM model optimized by the AMPSO algorithm is input into the support vector machine to obtain the corresponding volume fraction regression model. The prediction results of training set samples and test set samples of the NH3-SVM model and the CO2-SVM model can be obtained (Fig. 8). The determination coefficient R2 is adopted to evaluate the fit between the predicted volume fraction and set volume fraction.Results and DiscussionsAlthough the optimization time of the standard PSO algorithm is the shortest, due to premature convergence, the mean square error is large, and the regression prediction of the model is not good. The mean square error of the grid search method is close to that of the AMPSO algorithm and both errors are small. However, since the grid search method is a non-heuristic algorithm, each optimization needs to traverse all points in the grid, resulting in long optimization time. Compared with the two algorithms, the AMPSO algorithm can obtain the best mean square error at a more appropriate optimization time, with higher efficiency. When regression predictions on the volume fraction of the training set samples are conducted, the mean square errors of the volume fraction set point and the volume fraction prediction value of the NH3-SVM model and CO2-SVM model are 0.000087 and 0.000128 respectively, and the determination coefficients R2 are 0.9997 and 0.9999 respectively. When volume fraction regression prediction for the test set samples is carried out, the mean square errors of the volume fraction set point and the volume fraction prediction value of the NH3-SVM model and CO2-SVM model test set are 0.000088 and 0.000170 respectively, and R2 is 0.9998.ConclusionsAn active intracavity gas sensing system based on a thulium-doped fiber laser is built to collect the absorption spectrum data of NH3 and CO2 gases. The predicted volume fraction of the regression prediction model of NH3 and CO2 gas volume fraction is in good agreement with the actual volume fraction, with sound prediction ability and effect, and small error. The built AMPSO gas volume fraction regression model has high prediction accuracy and strong accuracy and can be applied for mixed gas volume fraction regression prediction.
ObjectiveIn the satellite coherent laser communication system, the signal modulation format is mainly phase-shift keying (PSK), which is not compatible with the coherent reception of on-off keying (OOK). In view of the problem that the satellite coherent optical communication receiver is incompatible with various modulation formats, a coherent communication receiver compatible with OOK and binary PSK (BPSK) is built experimentally. At the communication rate of 1 Gbit/s, when the modulation format is OOK, and the signal optical power is -54.6 dBm, the bit error rate (BER) is 10-3, and there is a distance of 3.3 dB from the shot noise limit; when the modulation format is BPSK, and the signal optical power is -57.95 dBm, the BER is 10-3, and there is a distance of 4.2 dB from the shot noise limit. The multi-system compatible coherent receiver shares a common structure with many coherent receiver hardware at present and has high receiving sensitivity. It verifies the feasibility of the multi-system compatible technology of satellite coherent laser communication and is of great significance.MethodsAs the current mainstream satellite communication modulation formats, BPSK and OOK will exist for a long time. Therefore, this paper experimentally builds a coherent receiver compatible with OOK and BPSK. Firstly, the optimal local optical power of the balanced detector used in this experiment is measured by the experimental setup shown in Fig. 4. When the optical modulation format of the signal is OOK, the in-phase (I) and quadrature (Q) signals are firstly complexed, then the modulus of the complex signal is calculated, and finally the threshold judgment method is used for verification. When the optical modulation format of the signal is BPSK, the real-time carrier phase difference is calculated by the complex digitization and IQ arctangent method, and the baseband signal can be obtained after the carrier recovery of the BPSK signal. The demodulation of the overall signal relies on offline processing, and Fig. 8 shows the specific flow of offline processing.Results and DiscussionsAfter the experiment in Fig. 4, we finally set 12.8 mW as the optimal optical power of the local oscillator in this experiment. In this paper, when the optical frequency of the local oscillator and the signal is small, the high-speed oscilloscope is used to demodulate the OOK signal. The recovered baseband signal and eye diagram are shown in Fig. 7. When the optical power of the signal close to the shot noise limit is measured, the BER is calculated through offline processing. When the signal optical modulation format is BPSK, the baseband signal will be recovered, and the BER will be calculated after the I and Q signals are directly collected for offline processing. In this experiment, the communication rates of OOK and BPSK are both 1 Gbit/s. With the multi-system compatible coherent detection technology applied, the receiving sensitivity of the OOK signal is 3.3 dB away from the shot noise limit. The main reasons are as follows. The responsivity of the detector used is 0.85 A/W, and the ideal responsivity is 1.25 A/W when the quantum efficiency is 1 in the 1550 nm band, which will cause a loss of 1.67 dB. The output of the optical 90° bridge goes into the detector fiber, and there is a connection flange, which will cause a loss of 0.3 dB. The remaining loss of 1.33 dB may be caused by the following reasons: energy lost due to the transmittance of the detector window, imperfect heterodyne efficiency, and ADC quantization loss. With the help of the multi-system compatible coherent detection technology, the receiving sensitivity of the BPSK signal is 4.2 dB away from the shot noise limit, which is 0.9 dB higher than the distance between the receiving sensitivity of the OOK signal and the shot noise limit. The loss may be caused by an inaccurate phase-locking error from the inaccurate phase difference calculation at a low signal-to-noise ratio due to an extremely low signal optical power.ConclusionsIn this paper, a multi-system compatible coherent detection device for satellite laser communication is built experimentally, and the corresponding demodulation algorithm and offline processing method are given. When the communication rate is 1 Gbit/s, and the BER is 10-3, the receiving sensitivity of the multi-system compatible coherent detection device is only 3.3 dB away from the shot noise limit for the OOK signal, and that for the BPSK signal is only 4.2 dB away from the shot noise limit, which realizes high-sensitivity and multi-system coherent reception. It is worth mentioning that an advantage of coherent OOK is that in the PSK coherent communication system, when the carrier recovery algorithm or the phase-locked loop cannot achieve carrier synchronization for some reason, the coherent reception of OOK can be used as an important alternative method, with only a slight loss of sensitivity. In addition, multi-system compatibility is not limited to OOK and BPSK. For quadrature PSK (QPSK) modulated signals, we only need to change the square operation of eliminating the communication term to the fourth power operation. After carrier synchronization, both I and Q signals become baseband data. Multi-system compatible coherent reception can greatly improve the flexibility and interactivity of satellite laser communication networks in the future, so it is of great significance.
ObjectiveOptical wireless coherent communication employs optical hybrid to complete the mixing of signal light and local oscillator light, and balance detectors to complete photoelectric conversion. Optical fiber hybrid has been widely applied in optical wireless coherent communication systems due to its advantages such as high integration and compact structure. It is necessary to efficiently couple spatial light into the optical fiber. Adaptive optical technology can improve the coupling efficiency from spatial light into optical fiber by correcting the distorted wavefront, and it is applied to optical wireless coherent communication systems. The existence of non-common optical path aberration between the wavefront sensing branch and the coupling branch leads to the distorted wavefront in the communication branch after the closed loop of the adaptive optical system. The stochastic parallel gradient descent algorithm to correct the non-common optical path aberration is easy to fall into the local optimum, and the phase difference algorithm employed to correct the non-common optical path aberration is only applicable to the field of imaging systems. We propose a reverse transmission calibration algorithm to measure the non-common optical path aberration for the initial calibration of adaptive optical systems in optical wireless coherent communication.MethodsThe adaptive optical system in wireless optical coherent communication is shown in Fig. 1. After the laser beam is transmitted through the atmospheric turbulence, the beam is fully reflected by the deformable mirror. The reflected beam is divided into two collimated beams with a power ratio of 1:1 by the beam-splitter. One transmitted beam is to act on the wavefront sensor to monitor the current distorted wavefront. The other reflected beam is directly coupled into a single-mode fiber after being converged by a coupling lens for optical hybrid, coherent detection, and communication. Reverse transmission is sending the same beam from the receiver to the transmitter. A laser beam identical to the transmission source is supposed to be connected to the coupling optical fiber, as shown in Fig. 2. At the same time, the deformable mirror command in this state is cleared so that the deformable mirror is in a completely flat reflection state. The beam output by the coupling fiber is reflected by the beam-splitter and then reflected by the deformable mirror directly into the wavefront sensor to measure the wavefront information. At this time, the measured wavefront information includes both the wavefront phase that can maximize the coupling efficiency and non-common optical path aberration. The coupling efficiency can be improved when the measured wavefront information is converted to the closed-loop control of adaptive optics.Results and DiscussionsThe local oscillator light in the optical wireless coherent communication system is connected to the coupled single-mode optical fiber by the reverse transmission calibration algorithm. The peak-to-valley value of the non-common optical path aberration (Fig. 7) measured by the wavefront sensor is 3.71 μm, with the root mean square value of 1.34 μm. This error is enough to exert a significant impact on coupling efficiency. When the wavefront information is converted into the adaptive optical closed-loop control, coupling efficiency increases from the initial 9.04% to the closed-loop 45.21% (Fig. 8). The self-noise inside the wavefront sensor causes some synaptic data in the wavefront slope measurement and wavefront reconstruction, but does not significantly affect the fluctuation of coupling efficiency (Fig. 8). In turbulent environments, the coupling efficiency increases from 19.72% under uncorrected state to 36.93% under closed-loop state (Fig. 13), and that in complex environments increases from 3.91% in an uncorrected state to 9.13% in the closed-loop state (Fig. 16). This shows that with the increase of communication distance, the influence of atmospheric turbulence on adaptive optical correction effect is more significant than non-common optical path aberration.ConclusionsBased on the reversibility principle of optical paths, we propose a reverse transmission calibration algorithm to measure and correct non-common optical path aberration for adaptive optical fiber coupling systems in optical wireless coherent communication. This algorithm converts the non-common optical path aberration into closed-loop control and improves coupling efficiency while correcting the distorted wavefront phase. Compared with conventional stochastic parallel gradient descent algorithms, this scheme will not fall into the local optimum, and will not be affected by the external turbulent environments. It can also assist in the position alignment of optical paths, which is simple, feasible, and easy to realize in engineering. Finally, reference significance and practical value are provided for the optical fiber coupling technology of the optical wireless coherent communication system.
ObjectiveClear microscopic images of algae are the basis of accurate identification. However, the microscopic images of algae located outside the depth of field are blurred due to the limited depth of field of the high-power microscope. On the one hand, some algal cells are large or filamentous in morphology. For example, the length of Anabaena sp. can reach hundreds of microns, and the depth distance of the algal cells can easily exceed the depth of field range of the microscope during microscopic imaging, and thus the area outside the depth of field range in the microscopic image is blurred due to defocus. On the other hand, the length of algal species with small cell size such as Scenedesmus sp. is only about seven microns, and the depth distance between multiple algal cells in the same field can easily exceed the depth of field of the microscope, which results in blurred algal cells in the collected microscopic algal images. Therefore, it is of great value to collect multi-focus microscopic images of the same field at different heights of the objective table and use the multi-focus image fusion method to realize multi-focus image fusion of algal cell images, so as to obtain clear images with panoramic depth.MethodsIn this paper, the focus area, defocus area, and background area of the microscopic images of the algal cell are detected, and then the multi-focus microscopic images are fused by using a spatial domain image fusion method. First, Laplacian energy and guided filtering are used to measure the local focus degree of algal cell images, and the focus area of microscopic algal cell images is determined after binarization, as shown in Eq. 4. Because the area where the algal cell is located can be detected by the S channel of HSV color space of the microscopic algal cell image, the defocus area of the microscopic image can be detected by combining the S channel with the focus area. The remaining parts are defined as background areas. Then the multiple microscopic images are fused in the spatial domain (Eq. 8), or in other words, the output pixel value is selected from the focus area with a larger focus degree. The defocus area does not participate in the fusion, and the average value of the background area is taken as the fused output, so as to realize the spatial domain fusion of the multi-focus microscopic algal cell images.Results and DiscussionsOne microscopic image of algal cells is acquired by moving the precision displacement objective table every 1 μm in the direction of the depth of field. Anabaena sp., Scenedesmus sp., and Pediastrum sp. are used as experimental objects. The multi-focus microscopic images of Anabaena sp., Scenedesmus sp., and Pediastrum sp. are continuously acquired by moving 7, 7, and 15 μm in the direction of the depth of field of the objective table, respectively. There are different clear areas and defocus areas in each microscopic image due to the limitation of the microscope's depth field. The fusion effects of the wavelet transform, Laplacian pyramid, and pulse coupled neural network (PCNN) methods are compared with the proposed method in terms of subjective vision and objective quantitative evaluation. It can be seen from Fig. 5 and Fig. 6 that the proposed method can better transfer the focus area in the source image to the fusion image in subjective vision and has a better fusion effect. In terms of objective quantitative evaluation, Table 1 shows the edge information retention, spatial frequency, and average gradient of the fused images of Anabaena sp. (0.3529, 8.9654, and 0.0055), Scenedesmus sp. (0.3778, 7.0558, and 0.0023), and Pediastrum sp. (0.2940, 1.5445, and 0.0005), respectively, which are better than those of the compared methods. The proposed method effectively fuses the multi-focus microscopic images of algae and provides a method for obtaining the microscopic images of algae with panoramic depth.ConclusionsIn order to solve the problem of image blurring caused by the defocus diffusion effect in obtaining microscopic algal cell images, a spatial-domain multi-focus image fusion method is proposed in this paper. Laplace energy and guided filtering are used to detect the focus area of microscopic images, and obvious color characteristics of algal cell images are used to detect the defocus area by combining the S channel of HSV color space with the focus area. Then, the output image is selected according to the focus degree of the focus area in the spatial domain image fusion process. The experimental results show that the proposed fusion method can effectively fuse multi-focus microscopic images of algal cells. The fused image has better clarity, and the edge information of the source image is more effectively transmitted to the fused image. This work proposes a new method for obtaining microscopic images of algal cells with panoramic depth and provides technical support for the development of automatic monitoring instruments for algal cells.
ObjectiveShip detection plays an important role in military and civilian fields such as defense security, dynamic port monitoring, and maritime traffic management. With the rapid development of space remote sensing technologies, the number of high-resolution optical remote sensing images is increasing exponentially, which lays the data foundation for research on ship detection techniques. Meanwhile, it is required that detection systems should have real-time accuracy to match the growth rate of the number of remote sensing images. Traditional methods for object detection are mainly accomplished by the construction of mathematical models or the use of object saliency. However, most of these algorithms rely on the prior knowledge of experts and have certain limitations, which cannot cope with the complex and variable background and the multimodal and heterodyne objects. Recent years have seen the rapid development of deep learning technology. The object detection method based on convolutional neural networks (CNNs) is widely used because of its strong learning ability and high detection accuracy. Currently, mainstream object detection models based on deep learning are mainly divided into two categories, i.e., two-stage networks and single-stage networks. In general, two-stage network detection has high accuracy but is difficult to deploy on embedded devices due to a large amount of computation and huge time consumption. The YOLO series, single-stage network detection algorithms, have received extensive attention and applications due to their simple network structure and consideration of both detection accuracy and detection speed. However, due to the poor computing power and limited memory resources of embedded devices, it is difficult to directly apply single-stage detection models to embedded devices to detect objects in real time. Hence, we expect to deploy a high-performance model to detect ships in optical remote sensing images on equipment terminals with limited resources and space and achieve a lightweight ship detection network for complex remote sensing scene images to promote the landing of the model.MethodsAs the existing lightweight object detection algorithms based on deep learning have low detection accuracy and slow detection speed for ships in complex remote sensing scene images, a lightweight real-time ship detection algorithm STYOLO is proposed for embedded platforms. The algorithm uses YOLOv5s as the basic framework. First of all, considering the high memory access costs in the backbone network, the efficient network architecture ShuffleNet v2 is used as the backbone network to extract image features, which reduces memory access costs and improves network parallelism. Secondly, the Slim-neck feature fusion structure is used as the feature enhancement network to fuse the detailed information in the lower-level feature maps to enhance the feature response to small objects. In addition, the coordinate attention mechanism is applied in the multi-scale information fusion region to strengthen object attention and thus improve the ability to detect difficult samples and resist background interference. Finally, a learning strategy combining cross-domain and in-domain transfers is proposed to reduce the difference between source and target domains and improve the transfer learning effect.Results and DiscussionsAfter 100 training iterations with ShuffleNetv2-YOLOv5s, YOLOv5s, MobileNetv3-YOLOv5s, and YOLOv5n on the same test and validation sets, all the evaluated metrics have good performance (Fig. 11), which verifies the effectiveness of the proposed algorithm. On the basis of the YOLOv5s framework, ShuffleNet v2 is used as the backbone network, and Slim-neck is used as the feature enhancement network; the two detection models are trained by cross-domain transfer learning. Compared to the YOLOv5s model, the lightweight model has reduced the detection accuracy, the number of floating points, and the number of parameters by 2.12 percentage points, 62.02%, and 62.05% (Table 2), respectively. To improve the detection accuracy of difficult samples and the ability to counter background interference, we employ the coordinate attention mechanism at the intersection of different information scales in the feature enhancement network. Compared with the results of the detection model without the coordinate attention mechanism, the mAP of the proposed algorithm is improved by 4.94 percentage points, and the number of parameters is raised by 0.75% (Table 3). When different attention mechanisms are applied at the intersection of different information scales in the feature enhancement network, it is found that the model applied with the coordinate attention mechanism has the highest mAP of 90.46% at a shrinkage rate of 32, an increase of 4.94 percentage points (Table 4). A learning strategy that combines the cross-domain transfer with the in-domain transfer is proposed to reduce the discrepancy between source and target domains and improve transfer learning. The mAP of the proposed algorithm with the above learning strategy is 94.33%, which is 3.87 and 14.17 percentage points higher than that with the training methods of cross-domain transfer learning and in-domain transfer learning, respectively (Table 5). The proposed algorithm is compared with ShuffleNetv2-YOLOv5s, YOLOv5s, MobileNetv3-YOLOv5s, and YOLOv5n on desktop computers and the Jetson Nano terminal. The proposed algorithm achieves a good trade-off between detection speed and detection accuracy in the optical remote sensing ship detection task, and the overall performance is good (Table 6 and Fig. 12).ConclusionsTo address the problem that existing lightweight object detection algorithms cannot achieve real-time accurate detection of ships in complex remote sensing scenes, we propose a lightweight real-time algorithm to detect ships in optical remote sensing images for embedded platforms, called STYOLO. Compared to current mainstream detection algorithms used in embedded systems, STYOLO can effectively improve detection speed while ensuring high accuracy. On the Jetson Nano terminal, it has a detection speed of 102.8 frame/s, which is approximately 2.21 times faster than YOLOv5s, 1.36 times faster than ShuffleNetv2-YOLOv5s, 1.70 times faster than MobileNetv3-YOLOv5s, and 1.50 times faster than YOLOv5n. The precision reaches 94.33%, 2.7 percentage points higher than YOLOv5s, 4.19 percentage points higher than ShuffleNetv2-YOLOv5s, 7.27 percentage points higher than MobileNetv3-YOLOv5s, and 24.61 percentage points higher than YOLOv5n, which can meet the requirements of accurate and real-time detection of ships in optical remote sensing images on embedded platforms. In the detection tasks of ships in remote sensing images, visible images are vulnerable to the natural environment, which leads to the weakening of the target features and difficulty in improving the accuracy of the algorithm. Hence, improving the accuracy of weak object detection by combining infrared and visible images for fusion detection is a key research direction.
ObjectivesThe receiving array composed of single-photon avalanche diodes (SPADs) can effectively improve the sensitivity of the receiving end, which has important application value in the field of remote detection and imaging. For moving targets in the air, it is difficult to obtain stable target echoes due to the limited single-pixel acquisition time. In particular, in long-distance conditions, the laser energy attenuates significantly in the channel transmission process, which makes the number of echoes detected by the SPAD array in imaging lessen. As the detector does not fully accumulate the echoes, the difficulty of target recognition rises due to the lack of target image features in its imaging results. For the accurate detection of such targets, target recognition methods are required to make full use of limited echo information. Through the method of image reconstruction, the image quality can be optimized to a certain extent, so as to improve the system's ability to recognize the measured target. However, image reconstruction requires a long processing time, which is difficult to meet the real-time requirements of moving target monitoring. For timely and effective identification of moving targets in the air, the detection system should have the ability to quickly process image information.MethodsUnder the condition of array imaging with low resolution, few features, and serious noise interference, traditional image processing methods and contour processing methods can hardly ensure timeliness and accuracy due to a large amount of data and great time consumption. When the weak imaging result of the SPAD array is directly used for target recognition, it does not require high-quality reconstruction of the target shape and texture. Hence, it can effectively reduce the data requirements of image reconstruction and the complexity of algorithms and is of great significance for realizing real-time monitoring of long-distance moving targets in the air. For a common low-altitude aircraft, its deformation rate is far lower than its displacement change during the movement, and thus, it is not necessary to recognize the target synchronously during target tracking. Therefore, the following solution is proposed: the detection process can be divided into two parts, i.e., target tracking and target recognition. On the basis of target positioning and tracking in a single imaging frame, multiple imaging frames are used for target recognition to neutralize the contradiction between recognition effect and processing speed. Upon the above considerations, this paper proposes an optical flow method based on clustering analysis and optical flow features.Results and DiscussionsThe method proposed in this paper can accomplish real-time tracking and recognition of moving targets in the air without any a priori information (Figs. 1-2). Considering the complexity of the moving mode of the airborne flying target, it is necessary to simulate three-dimensional motion information with a two-dimensional optical flow field. Since dimensions are reduced by the direct removal of depth information, the overlapping problem of multiple targets occurs. Therefore, this paper uses the projection method of aperture imaging to convert motion information to optical flow information (Figs. 3-5). To verify the effectiveness of the proposed method, this paper obtains more effective classification criteria through the statistics and analysis of the optical flow angle data of "low, slow, and small" targets and verifies the feature recognition results of optical flow angles according to the change in the value of the optical flow mode (Fig. 8). Upon the removal of the imaging frames with abnormal moduli, the experimental statistical results of the overall optical flow angle vector are consistent with the theoretical analysis results (Fig. 9). In target classification, this method uses the essential motion characteristics of the flying target, which is free from the interference of various types of shape camouflage and has a wide application scope.ConclusionsUnder the condition of array imaging with low resolution, few features, and serious noise interference, it is difficult to consider real-time detection and accurate target recognition by traditional target recognition methods due to the massive data to be processed and the huge time consumption. To alleviate the contradiction between timeliness and accuracy, this paper proposes an optical flow feature recognition method on the basis of the flight characteristics of different targets, which overcomes the recognition difficulty caused by poor array imaging effects. Due to limited time, this paper only conducts experiments and analysis on typical targets such as fixed wing UAVs, rotary wing UAVs, and birds. In the future, it is expected that the optical flow recognition method will be extended to more targets such as airships, balloons, and gliders to prove the universal applicability of this method in long-range aerial target detection. As the hardware processing capability is enhanced, the method of image feature recognition will have more advantages in real-time target detection, which should be the focus of future research.
ObjectiveUnmanned aerial vehicle (UAV) shows extraordinary superiority on the battlefield with high mobility, low cost, no casualties, and other advantages, which has changed the form of modern war and made unmanned intelligent war mainstream. For example, using UAVs for reconnaissance provides helpful information for commanders on the battlefield, which has excellent intelligence support value and operational command function. It should be noted that high-precision and real-time target localization is a necessary condition for UAV reconnaissance and target strikes. The airborne electro-optical platform is equipped with high-resolution imaging equipment to recognize the target at a long distance so that the ground target can be tracked and measured without entering the target area. However, in the case of limited observation conditions, such as large inclination angles and small rendezvous angles, the traditional localization method can no longer meet the accuracy requirement. At present, most of the target localization methods to improve accuracy under limited observation conditions can be divided into two basic types. One is based on image matching, and the other is based on geometry. But under the condition of a large inclination angle, the localization method based on image matching is seriously affected by the perspective transformation. Moreover, the results show that limited observation conditions make the design matrix ill-conditioned, and the condition number of the least square method is very large, which seriously affects the accuracy of the geometric localization method. Therefore, improving the target localization accuracy under limited observation conditions is of great significance.MethodsThe laser range finder has high measurement accuracy. It is not affected by the limited observation conditions such as a large inclination angle and small rendezvous angle, which makes laser ranging have tremendous application value in the field of ground target localization. In order to improve localization accuracy under limited observation conditions, this paper proposes a global optimization method for ground target localization based on the platform's location and laser ranging. In this method, first, according to the continuous observation data of the static ground target, the weighted error equation in the earth-centered and earth-fixed (ECEF) coordinate system is established. Second, the nonlinear problem is transformed into the problem of the eigenvector solution. Third, all stationary points are found by enumerating seven eigenvectors. Finally, the actual location of the ground target is calculated according to the actual situation. In fact, the critical point of this method is to transform the nonlinear problem into an eigenvector problem through data centralization, singular value decomposition, and other steps. This not only accurately finds the global optimal solution of the equation without iteration or optimization procedure but also improves the efficiency and stability of ground target localization.Results and DiscussionsThe ground target localization system is mainly composed of an airborne electro-optical platform, integrated global position system (GPS) and inertial navigation system (INS), and laser range finder. Furthermore, the platform flies in a circle over the ground target, obtaining the UAV's longitude, latitude, and height in the world geodetic system-1984 coordinate system, as well as the distance between the UAV and the static ground target at different time. The simulation experiment results based on the Monte Carlo method show that the localization accuracy is affected by location error of the airborne electro-optical platform, distance error of laser ranging, and data size of continuous observation (Fig. 5, Fig. 7, and Fig. 8). Furthermore, the flight test results show that the proposed method is feasible and effective under limited observation conditions. The target localization error is less than 30 m when the platform is 5 km away from the target, and the observation angle is 66.42°. Moreover, the operation time can be controlled within 10 ms when the quantity of continuous observation data is within 300 (Table 3 and Table 4).ConclusionsIn view of limited observation conditions such as large inclination angles and small rendezvous angles, this paper proposes a global optimization method to improve the accuracy of ground target localization. According to the location information provided by the integrated navigation system and the distance information provided by the laser range finder, the corresponding measurement model and weighted error model are set up. A fast closed-form solution for nonconvex optimization problems is obtained by deriving equivalent eigenvectors. The simulation and flight experiments results show that the proposed method has the advantages of high localization accuracy, computational efficiency, and robustness compared with the traditional localization method under limited observation conditions, which is of great significance to the reconnaissance and attack of targets on the battlefield.
ObjectiveThe space-based full-Stokes imaging polarimeter places the polarizing beam splitting prisms and retarders in front of the focal plane of the objective to achieve simultaneous polarimetric measurement. It can obtain not only the light intensity information of the target but also the degree of polarization, azimuth of polarization, and external contour and thus is used to enhance ground target detection and restore haze images. In order to meet the needs of high spatial resolution, large field of view, and wide spectrum, the telescope objective adopts a silver-coated off-axis three-mirror system. The metal reflective film makes the objective to exhibit diattenuation and retardance effects, which affect the ideal measurement matrix of the imaging polarimeter. For the sake of the accuracy of the imaging polarimeter measurement, the Mueller matrix of the objective needs to be measured accurately.MethodsIn this study, the Muller matrix of the off-axis three-mirror telescope objective is measured by a dual-rotating retarder. To begin with, the transmission axis of the Glan-Taylor prism as a polarizer is adjusted to horizontal with a theodolite. Then the optical axis of two waveplates and an analyzer are adjusted horizontally based on the Glan-Taylor prism. After that, two waveplates rotate one cycle at an angular rate of 1∶5. The Fourier amplitude is measured by performing a discrete Fourier transform of the light intensity, and 16 elements of the Mueller matrix are determined. Specifically, the test is divided into two stages. Firstly, the straight-through device measures five system parameters, including the retardation of two waveplates, the azimuth of the two waveplates, and the analyzer relative to the polarizer. The straight-through device is operated with no sample, and five system parameters are deduced through the identity matrix. By changing the ambient temperature, the retardation of two waveplates is measured by equations of the temperature. Secondly, the V-structure device measures the Mueller matrix of the objective. The polarizer, two waveplates, and analyzer are moved to the V-structure device. The temperature of the waveplate is monitored during the measurement of the dual-rotating waveplate, so the retardation at the current temperature of the waveplate is obtained through the equations. Finally, the five system parameters and Fourier amplitude are used to calculate the Mueller matrix of the objective.Results and DiscussionsA Mueller matrix measurement system for a large-aperture reflective objective is built, and a mathematical model of the temperature effect of the measurement system is established. The equations for the retardation of the waveplates and temperature are obtained by least squares fitting (Fig. 3), and the accuracy of Muller matrix measurement of the objective is improved obviously. When the temperature changes by 1 ℃, the accuracy of Mueller matrix elements m12, m21, m22, and m33 increases theoretically by 0.0014, 0.0016, 0.0030, and 0.0030, respectively. The experiment shows that the measurement error of Mueller matrix elements m12, m21, m22, and m33 of the objective is no more than 0.0011 after temperature compensation. The measured results are basically consistent with the theoretical values of CODE V simulation, with the diattenuation and retardation of the objective having a difference of 0.0002 and 0.5211°. The extended uncertainty of the measured Mueller matrix of the objective is 0.0006 at a confidence of 95%, which has an effect of ≤0.0038@p=1 on the accuracy of the degree of polarization, degree of linear polarization, and degree of circular polarization (Fig. 7). It can be used as a high-precision polarization calibration method.ConclusionsIn this paper, a Mueller matrix measurement system for a reflective objective is designed and established based on the dual-rotating retarder method, which solves the requirements for large-aperture and full-Stokes measurement for the polarization calibration of an off-axis three-mirror objective. In terms of measurement principle, the temperature characteristics of the waveplates are considered and added to the measurement model. The temperature compensation of the waveplate retardation is carried out by the Mueller matrix measurement formula. The equations of the retardation of waveplates with temperature are obtained during the calibration of the five system parameters. After temperature compensation, the measurement error of Mueller matrix elements m12, m21, m22, and m33 of the objective is no more than 0.0011. By pole decomposition of the Mueller matrix, the diattenuation and retardation are basically consistent with the CODE V simulation results, with a difference of 0.0002 and 0.5211°, respectively. The Mueller matrix elements m12 and m13 obtained by rotating the polarizer differ from the dual-rotating retarder method by 0.0002 and 0.0001. The uncertainty of the Mueller matrix measurement results and the influence on the accuracy of polarization measurement are also evaluated. The polarization measurement accuracy is better than 0.0038@p=1 when the incident light is input under the condition of different degrees of polarization, azimuths of polarization, and angles of ellipticity. In conclusion, the measurement method shows excellent polarization calibration accuracy.
ObjectiveCalibration is the process of describing the parameters needed to understand and quantify the expected application performance of a sensor. In the prelaunch radiometric characterization and calibration, the on-orbit environment should be simulated as much as possible, and the tests are performed in a controlled environment using a standard source of known radiation. The measurements made during the prelaunch radiometric calibration are used to verify whether the instrument status is correct, quantify the calibration equation and radiometric measurement model parameters, and estimate the measurement uncertainty. The measurement performance and limitations are determined, and whether the sensor meets the mission requirements are verified. By identifying and characterizing unique sensor performance characteristics, the influence of sensor behavior on expected measurement is minimized. The Geostationary High-speed Imager (GHI) is one of the main payloads of Fengyun-4B (FY-4B) satellite, the research in this paper is an important basis of the on orbit quantitative application for long wave infrared (LWIR) band of GHI.MethodsThe commonly used radiometric calibration methods in the laboratory are the distant small source combined with the collimator method and the near extended source method. The distant small source combined with collimator method is to place the point source blackbody at the focal plane of the collimator to realize the beam expansion and collimation of the calibration beam, so that the calibration beam can fill the instrument's entrance pupil and field of view. The near extended source method can provide a standard calibration source with good stability, uniformity, Lambertian and large aperture, and does not require expensive low-temperature collimators and accurate collimator calibration parameters. In this paper, the large-area and near extended source blackbody calibration method is used, which can realize the full field of view and full aperture radiometric calibration of GHI. GHI, external blackbody, deep low temperature cold screen and other equipment are placed in the vacuum tank. The cold screen and external blackbody are placed along the direction of the sub-satellite point, directly above the optical aperture of the instrument, and the blackbody is placed behind the cold screen (Fig. 2). The vacuum in the tank is better than 1.3×10⁻³ Pa, the heat sink temperature is lower than 100 K, and the effective emissivity of the tank wall surface is better than 0.9. The effective emissivity of the external blackbody is about 0.99, and the temperature control range is 180-330 K. Within this range, the radiance levels of 16 temperature points are set (Table 2). During the experiment, the on-board blackbody observation will be performed simultaneously. The cold screen is used to simulate the 4K space view in orbit, as the "zero radiation" standard for instrument observation, the temperature of the cold screen is lower than 85 K, and the effective emissivity of the surface is better than 0.9.Results and DiscussionsThe quadratic polynomial can be used to describe the radiometric response model of GHI LWIR, and the calibration equation has good goodness of fit (Fig. 4 and Table 3). At the typical temperature of 300 K, the fitting accuracy of radiometric response model is better than 0.23 K (Table 4). The analysis and evaluation of various error values in the calibration process show that the prelaunch calibration uncertainty is better than 0.670 K (coverage factor is 2) at 300 K (Table 5). The spatial noise characteristics are measured and studied, and the relationship between the fixed pattern noise (original signal, dark current and response signal) and the radiance is analyzed (Fig. 5). For the problem of unavailable detector on LWIR focal plane, GHI adopts 256×4 to realize mutual backup of 4 line arrays and select the best imaging detector (Fig. 6). Through the research and analysis of the experimental data, two kinds of the best imaging detector selection criteria are proposed, namely, the principle of maximizing the signal-to-noise ratio and the principle of minimizing the fixed pattern noise of response signal. Thus, two kinds of the best imaging detector combination line arrays are given (Fig. 7). The detection sensitivity at a typical temperature of 300 K is measured (Fig. 10). The detection sensitivity of the two new line arrays mentioned above meets the mission requirements (better than 0.2 K). In particular, for the new line array based on maximizing the signal-to-noise ratio, the overall detection sensitivity at 300 K is better than 0.1 K, and the average level is about 50 mK. The on-board blackbody reference standard is validated according to the full dynamic range (180-330 K) radiometric calibration equation obtained from the external blackbody (Fig. 11). Linear fitting between the true brightness temperature and the nominal brightness temperature at the five temperature points (290, 295, 300, 305, 310 K) of the on-board blackbody is performed (Fig. 12 and Table 6). The nominal brightness temperature of the on-board blackbody is slightly lower than the true brightness temperature. At the typical temperature of 300 K, the nominal brightness temperature is about 0.42 K lower than the true brightness temperature (the average value of the line array). Through the preliminary analysis and judgment of the structural components around the on-board blackbody of GHI and the calibration correction algorithm of the on-board blackbody of similar remote sensing instruments, the main reason why the nominal brightness temperature of the on-board blackbody is lower than the true brightness temperature is that the blackbody is not an ideal blackbody (emissivity is less than 1). When the instrument observes the non-ideal on-board blackbody, the radiation received is not only from the blackbody, but also includes the thermal radiation from the surrounding structural components reflected by the blackbody.ConclusionsIn view of the mission requirements and design characteristics of the LWIR band of the FY-4B GHI, the prelaunch calibration and radiometric characteristic measurement methods based on the large-area and near extended blackbody radiation source are studied, and the corresponding calibration device is built to achieve calibration parameter measurement and radiometric characteristic characterization. Through the effective control of the error source of the prelaunch calibration process, the calibration uncertainty is better than 0.67 K@300 K. The spatial noise characteristics and detection sensitivity are measured and studied. According to the characteristics of spatial noise and temporal noise, two methods to select the best imaging detector are proposed, which are based on maximizing the signal-to-noise ratio and minimizing the fixed pattern noise of response signal. Through the selection of the best imaging detector, the problem of no non-effective detector imaging on the satellite image of the long linear focal plane array can be solved. At the same time, the temperature detection sensitivity (average) can reach 50-60 mK@ 300 K. According to the full dynamic range radiometric calibration equation obtained from the external blackbody measurement, the accuracy of the on-board blackbody reference standard is evaluated. The nominal brightness temperature of the on-board blackbody is slightly lower than the true brightness temperature, approximately 0.42 K lower at the typical temperature of 300 K. It is preliminarily analyzed and judged that this phenomenon may be caused by the reflection of thermal radiation from the surrounding structural components by the on-board blackbody. Subsequently, the research on the calibration correction algorithm of the on-board blackbody will be performed according to the on-orbit data.
ObjectiveThe development of space-based air target detection against sea surface is conducive to improving the country's ocean sensing capability and providing an effective way for the refined detection and identification of distant sea targets. The traditional infrared detection method is greatly affected by environmental factors and is prone to problems such as target submersion in the background. In the case of low contrast between target and background infrared radiation intensity, the combination of polarization characteristic difference with infrared intensity detection can significantly improve the detection and identification capability of the system. With the continuous development of infrared multi-band imaging and guidance technology, how to use the polarization characteristics and select the band to be used to improve the target detection capability has become a difficult issue in space-based air target detection against sea background. In order to improve the infrared target detection performance, in this study, we model the infrared band polarization detection link of airborne targets in the sea surface background, combine the polarization calculation principle, compare the difference of polarization between target and sea surface in different bands, and analyze the effect of target temperature, height, and detection pitch angle on improving the contrast of target/sea surface polarization. The research results can be helpful to improve the infrared polarization detection capability of space-based sea surface air targets.MethodsIn this study, simulations are performed to compare and analyze the target and background in the band of 0.7-12.0 μm in combination with polarization. Firstly, the radiation transmission link of the space/sea-based airborne target detection system is established by combining the reflection model and spontaneous radiation model, and the relevant environmental parameters are obtained by using MODTRAN software simulation. Then, the Sellmeier formula is combined with the reflectivity calculation method to calculate the polarization of the target and the sea surface and explore the relationship among the polarization and wavelength, temperature, detection pitch angle, and height. The difference between the polarization of the target and the sea surface is further calculated to evaluate the detectability performance of the air targets against sea surface. The optimal detection band is clarified by simulation experiments on aircraft target and sea surface. Finally, based on the calculation model of the infrared polarization characteristics, the sensitivity of the wide-band polarization degree of the target and the sea surface to the target temperature, height, and detection pitch angle is explored at a solar altitude angle of 30°, a detection azimuth angle of 0°, and a flight speed of 272.24 m/s. The relationship among the vertical polarization component, the horizontal polarization component, and wavelength is analyzed by combining the variation law of polarization of the target and the sea surface. In addition, the parameter settings to improve the detection performance at the best wavelength are clarified by considering the atmospheric path, solar azimuth, and other factors.Results and DiscussionsAccording to the infrared characteristics of the target and the background change, it is found that there are two peak intervals of differential polarization between the target and the sea surface. By considering the influence of the atmospheric window on the radiation intensity, the atmospheric transmittance at 5-8 μm is low, which is not conducive to detection. By using the 2/2 peak position as the detection band selection criteria, the detection band of 8.56-10.08 μm is conducive to improving the contrast between the polarization of the target and the background and enhancing the polarization detection performance (Fig. 2). The effects of the target temperature, target height, and detection pitch angle on the detection performance are explored in different wavebands. Firstly, as the temperature difference between the target and the sea surface gets larger, the target/sea surface differential polarization degree becomes greater. In addition, the sensitivity of target/sea surface differential polarization degree to temperature is different in different wavelength bands (Fig. 4). Secondly, as the target height gets higher, the polarization gets smaller (Fig. 5). The sensitivity of target/sea surface differential polarization degree to target height varies in different wavelength bands (Fig. 6). Thirdly, the polarization degree of the target and the sea surface decreases when the detection pitch angle decreases, although the space-based detection platform is closer to the target and the sea surface in terms of distance (Fig. 7). The detection pitch angle increases in the narrow band of 8.56-10.08 μm, which makes the detector close to the ground-skimming state and is conducive to improving the polarization detection effect. In the actual detection, the atmospheric path, solar azimuth, and other factors should also be taken into account to ensure that the selection of the appropriate large angle in the narrow band of 8.56-10.08 μm can achieve good detection results (Fig. 8).ConclusionsFor the problem that the best detection band of air target infrared polarization detection against sea surface is unknown, the influence of wavelength on polarization degree is theoretically verified and analyzed, and the simulation experiment of wide-band space-based polarization detection imaging against sea surface is carried out. The influence law of target temperature, target height, and detection pitch angle on target and background polarization characteristics is explored in combination with the polarization degree calculation method. On the basis of the significant variation of the infrared polarization characteristics of the target and the background in each band, the best detection band can be determined to be 8.56-10.08 μm, and the vertical polarization component dominates. In the best detection band, increasing the temperature difference between the air target and the sea surface, reducing the flight height of the target, and selecting a larger angle of detection pitch are conducive to enhancing the polarization detection capability of space-based air targets against sea surface. This study provides a useful reference for studying the geometric sensitivity of infrared polarization radiation characteristics of air targets against sea surface and promoting the development of multi-band target stealth and identification technology.
Aerosols are an important part of the global atmosphere and have a great effect on global climate change and human health. Polarization detection technology has important applications in the monitoring of atmospheric aerosols. Traditional polarization measurement instruments use the time-sharing measurement method to obtain the polarization information of the target by changing the relative positions of the analyzer and modulator multiple times. It is difficult to accurately determine the polarization information of the target by the time-sharing measurement approach when the target to be measured and the instrument are in the state of rapid relative motion. This study reports a polarization measurement method based on spatial amplitude modulation, which modulates the polarization information of the incident light to the spatial dimension through a polarization modulation module composed of a combo wedge and a polarizer. The module is combined with the dispersion module to disperse the incident light, and thus, the polarization information and spectral information of the target can be obtained simultaneously in a single measurement. In addition, the structure is stable without moving parts.MethodsFirstly, the measurement principle of the system is introduced, and the modulation and demodulation equations of the system are derived. Then, the system's ability to distinguish incident light with different polarization states is demonstrated through the analysis of the demodulation equation, and the effect of the analyzer angle on the uncertainty of the measurement results is evaluated. After that, the effect of the amount of demodulated data on the overall modulation efficiency of the system is analyzed, and the effect of the analyzer angle on the modulation efficiency of Stokes parameters is evaluated. Finally, the system's calibration method of spatial and spectral dimensions is given, and the polarization measurement experiment is carried out with the system's principle prototype.Results and DiscussionsThe uncertainties of the Stokes parameters Q and V reach the minimum value of 0.000124 at the analyzer angle of 15.9° and 74.1°, respectively, and the uncertainty of the Stokes parameter U reaches the minimum value of 0.00014 at the analyzer angle of 45° (Fig. 5). The overall modulation efficiency of the system is greater than 0.99 when the amount of demodulated data is greater than 130 (Fig. 6). The impact of the analyzer angle on the modulation efficiency of Stokes parameters is analyzed at the wavelength of 546.07 nm. The modulation efficiencies of Stokes parameters Q, U, and V reach the maximum values of 0.791, 0.662, and 0.841 when the analyzer angles are 15.9°, 45°, and 74.1°, respectively (Fig. 7). The effect of wavelength on the modulation efficiency of Stokes parameters is analyzed at the analyzer angle of 45°, and the modulation efficiency of the Stokes parameters U is always higher than those of the Stokes parameters Q and V in the wavelength range from 500 nm to 600 nm (Fig. 8). The experimental results show that the measurement error of the degree of polarization of the system is less than 0.060, and the measurement errors of the Stokes parameters Q, U, and V are less than 0.052, 0.035, and 0.057, respectively (Table 4). The measurement results illustrate the correctness of the theoretical analysis.ConclusionsThe article introduces the basic principle of the polarization measurement technique based on spatial amplitude modulation and gives the modulation and demodulation equations of the system. The system's ability to distinguish incident light with different polarization states is demonstrated through demodulation equation analysis, and the effect of the analyzer angle on the uncertainty of the measurement results and the modulation efficiency of the system is evaluated. An experimental device is built for polarization measurement experiments, and the system's calibration method of spatial and spectral dimensions is given. The experimental results are accurate to a certain extent and illustrate the correctness of the theoretical analysis. The work proves the feasibility of spectral polarization measurement technology based on spatial amplitude modulation. It is expected to be applied to atmospheric aerosol detection tasks in the future.
ObjectiveAs the optical technology develops, in order to adapt to complex and changeable battlefield environments, composite guided modes have received more and more attention. Long-wave infrared (LWIR)/laser dual-mode seeker can provide complementary benefits such as all-weather operation, anti-electronic interference, and high hit accuracy. Currently, common-aperture dual-band systems with a laser of 1.064 μm and an LWIR of 8-12 μm mostly use a half-reflecting mirror to realize beam splitting. The image space resolution and field of view of the infrared optical system still need to be improved. Aiming at improving the feature resolution ability and all-weather working capability of the guidance structure, this paper proposed a new dual-mode guided optical system based on a secondary mirror splitting method. The passive infrared module was used to search for the target, and the active lidar module was utilized to lock the target and realize guidance accurately, and thus the high-precision scanning and patrol in a compact structure could be realized.MethodsThe Ritchey-Chretien (R-C) structure was used as a common component to address the issue of the seeker's limited optical system size, and the secondary mirror was coated with a beam splitter film to combine the long-wave infrared reflection optical module with the laser transmission optical module. In addition, the paper studied the initial structure solution method of the catadioptric system, as well as the effect of various optical obscuration conditions on the diffraction limit of the modulation transfer function of the incoherent imaging system. An illustration of a common-aperture dual-mode guided system with an optical obscuration ratio of 1/3 and an F-number of 0.98 was presented. The residual aberrations of the primary and secondary mirrors were compensated for by using several refractive lenses, and an optical passive athermalization method was used to complete the long-wave infrared athermalization in the range of -40-60 ℃. By using Monte Carlo analysis, the assembly tolerance and optical component tolerance were simulated. The resulting tolerance distribution was reasonable and workable.Results and DiscussionsAccording to the optical transfer function (OTF) of the annular obstructing optical system (Fig. 4), a reasonable obstruction ratio was determined, and the lens aperture of the system with a small F-number and large aperture was weighed against the light-gathering ability of the optical structure. First, the secondary imaging structure was used to reduce the light height of the edge field of view, and the optical aperture after being obstructed was fully utilized. The long-wave infrared imaging structure, with good image quality, consists of two reflectors and five refractive lenses (Fig. 6), and the MTF of this structure at 42 lp/mm is higher than 0.32 (Fig. 7). The reflectivity in the long-wave infrared band exceeds 90%, and the transmittance in the laser band exceeds 80%, which allows for high-precision target scanning and precise guidance. Then, through the selection of optical and structural materials and the distribution of optical power, the athermalized design of the long-wave infrared module in the temperature range of -40-60 ℃ was realized, which shows good thermal stability (Fig. 11 and Fig. 12) and processability (Table 3). Finally, this paper kept the infrared optical module's common aperture part, used the left side of the secondary mirror as a refracting material, and optimized the design of the laser-receiving optical module. The light in the receiving system with a laser of 1.064 μm was parallel after optimization (Fig. 9), and a narrow-band filter was added to avoid wavelength shift caused by large-angle incidence. The light of all fields of view was focused within 0.5 mm of the detector target surface (Fig. 10), which can enhance the signal-to-noise ratio of the laser module.ConclusionsA design method for the dual-mode guided optical structure was proposed and demonstrated in this paper. In addition, the effect of different obscuration ratios on the MTF diffraction limit of the catadioptric optical structure was studied, and a dual-mode guided imaging system with a small F-number and a common aperture of an LWIR of 8-12 μm and a laser of 1.06 μm was designed. The method of secondary mirror splitting simplifies the system structure effectually, and the secondary imaging structure increases the field of view and reduces stray light. In order to enhance the signal-to-noise ratio effectively, a narrow-band filter was introduced into the laser module's small-angle light. The long-wave infrared optical module has good imaging quality in the 4°×3° field of view, and the modulation transfer function (MTF) at 42 lp/mm is higher than 0.32. The optical obstruction ratio is only 1/3. Through the combination of different materials, an athermalization design under a temperature of -40-60 ℃ was achieved. The overall size is reflected by only 98 mm (length)×70 mm (width)×70 mm (height), and the structure is compact, which meets the application requirements of lightweight and engineering and can provide a certain reference for the design of multi-mode guided optical structures.
ObjectiveInfrared (IR) imaging technology has become a research hotspot in different countries because of its advantages such as not being limited by day and night, being able to work all day, strong ability to penetrate smoke, and good detection concealment. In recent years, with the development of high-performance and high-resolution large-array IR detector technologies and the requirements of remote observation tasks such as border and coastal defense, various advanced IR imaging systems have emerged. The IR continuous zoom optical system is widely used in military and civilian fields. It can search for targets with a large field of view and observe distant targets with high resolution. In order to improve the IR system's ability to identify distant targets at long focal lengths while ensuring target search with a large field of view at short focal lengths, it is hoped that IR zoom optical system has a longer focal length and large zoom ratio. However, the longer focal length makes the diameter of the zoom optical system increase sharply. In addition to the inherent secondary spectrum, a large number of chromatic aberrations and advanced spherical aberrations in optical systems with long focal lengths will be introduced, which makes it difficult to design mid-wave infrared (MWIR) continuous zoom system with a large zoom ratio. Some scholars have also carried out relevant research and design work, but at present, the long focal length of the MWIR zoom system is less than 1000 mm; the detector resolution is mostly 640×512, and the optical path structure of the MWIR zoom optical system is complex and large. It is hard to meet the urgent demand of the new generation of photoelectric pods for high-definition MWIR zoom imaging systems with compact sizes.MethodsIn order to realize a compact design of IR zoom lens with a large zoom ratio, we propose a design idea and method which adopt secondary imaging, positive group mechanical compensation of zoom lens, and smooth root replacement and introduce a warm shield by switching the rear group of the zoom lens to change F-Number of the optical system at long focal length. The optical path of the MWIR zoom lens is ingeniously folded by two mirrors. First, the IR zoom optical system adopts a kind of optical path structure form with intermediate image planes and uses the zoom differential equation to solve the initial structure of the zoom lens to meet the required zoom ratio (Fig. 1); second, pupil aberration, especially pupil coma, is controlled in the optimization of the optical system to minimize the diameter of the front group; third, the optical system adopts positive group compensation zoom lens. It has a negative zoom group and a positive compensation group. The magnification of the zoom group and compensation group at a certain focal length position during optimization is controlled to keep zoom group magnification and compensation group magnification at -1, so as to reduce zoom travel length and overall length of the MWIR zoom optical system as much as possible. Finally, two mirrors are cleverly used to fold the optical path, and by switching the rear group of the zoom lens, a warm shield is introduced to change F-number at a long focal length, which further reduces the diameter of the front group and keep IR zoom lens more compact.Results and DiscussionsBased on the proposed design method of a compact MRIR zoom lens, this paper uses a high-resolution MWIR-cooled detector with a resolution of 1280×1024. The pixel size is 15 μm, and an MWIR continuous zoom optical system with a zoom ratio of 48 times and focal length from 25 mm to 1200 mm has been designed (Figs. 2 and 3). While ensuring 100% efficiency of cold shield, the compact IR zoom lens is realized. The optical system has good imaging quality within the operating temperature range of -40-60 ℃ (Fig. 6), and the maximum optical diameter of the front group is 230 mm. The total optical length after folding is only 350 mm. This compact MWIR zoom optical system has many advantages, such as a compact structure, large zoom ratio, long focal length, high resolution, and good imaging quality, which can meet the requirements of the new generation of IR imaging systems (Fig. 9).ConclusionsIn this paper, an MWIR continuous zoom optical system with a large zoom ratio and long focal length is designed. The secondary imaging, positive group mechanical compensation, and smooth root replacement are used, and a warm shield by switching the rear group of the zoom lens is introduced to change F-Number of the optical system at a long focal length. The optical path is ingeniously folded by two mirrors, which realizes the compact and miniaturization design of the MWIR continuous zoom system with a focal length from 25 mm to 1200 mm. The MWIR continuous zoom lens has excellent imaging quality within the operating temperature range of -40-60 ℃. The optical diameter of the front group is 230 mm, and the overall length after folding is only 350 mm. The overall size of the zoom thermal imager based on this optical system is less than 360 mm (L)×238 mm (W)×290 mm (H). This compact MWIR zoom optical system has many advantages, such as a compact structure, large zoom ratio, long focal length, high resolution, and good imaging quality, which can be used in the new generation of high-performance photoelectric pods.
ObjectiveThe current synthetic aperture radar (SAR) image change detection still faces the following two challenges. (1) Robustness of difference image (DI) generation. The existing DIs are blurred, and there are more interfering pixels with the same gray value as the change pixels in the DIs. The change regions are influenced by the background information. (2) Effectiveness of DI analysis. In recent years, DI-based unsupervised machine learning or deep learning methods for change detection usually use image sample blocks for spatial feature extraction of pixels to be classified, which lose the detailed information characterizing change information, and there are many false alarms in the classification results, which is not efficient. If we can make full use of various features, reduce false alarms, and improve efficiency, the performance of detection will be greatly improved. Therefore, both robust DIs and diversity feature extraction should be considered to build a robust and fast SAR change detection model. Therefore, this study proposes a new unsupervised change detection method based on the DI of the log-hyperbolic cosine ratio (LHCR) and multi-region feature convolution extreme learning machine (MRFCELM), namely, LHCR_MRFCELM, to solve the problems of poor quality, low detection accuracy, and long detection time in SAR image change detection.Results and DiscussionsIn this study, four methods are experimentally compared and analyzed with the proposed method on four datasets to demonstrate the performance of LHCR_MRFCELM. Figure 5 shows the images of the final detection results of the five methods. Except for the method proposed in this study, all the detection results have many white false alarms. The Kappa value of the LHCR_MRFCELM method (86.44%) as shown in Table 2 is significantly better than that of the rest comparison methods, and the method also takes very little time (20.7 s). In addition, the necessity of each step in the generation process of DIs is discussed. Figure 9 shows the analysis of each step of the DIs generated from the original images, and the situations when one, two, or three steps are missing in the generation process are compared. Among them, the complete DI of LHCR achieves the largest Kappa value in each dataset, which illustrates the necessity of each step of DIs. The neighborhood size r in multi-region feature extraction is also discussed and it is demonstrated that the proposed method has the best performance on four datasets when r is set to 5.ConclusionsIn this study, we propose an unsupervised change detection technique using LHCR_MRFCELM. The method uses the speckle reducing anisotropic diffusion filter, LHCR, and median filtering to generate robust DIs and a fast and efficient MRFCELM to improve the accuracy and efficiency of classification. The log-hyperbolic cosine transformation is a contrast enhancement function used to enhance the contrast between change region and background region in an image, especially the edges where the contrast is not obvious. After DI generation, the HFCM results generated from the DI are used as labels to select sample blocks from the dual-temporal SAR images and the DI, and an MRFCELM is designed to automatically perform feature extraction and classification. Experiments validate the effectiveness of the method, which has better performance than unsupervised change detection methods such as NR_ELM, GaborPCANet, CWNN, and DDNet. The proposed method has no complicated feature extraction steps and no excessive parameter settings, which is easy to use, fast, and stable and has potential for engineering applications.
ObjectiveSea-land breeze (SLB) circulation is a mesoscale process induced by the thermal difference between land and sea. After sunrise, the land surface is heated faster than the sea surface, which leads to a pressure gradient force and the air flow from sea to land to form a sea breeze. At night, there is a contrary thermal difference, and the air flows from land to sea to form a land breeze. SLB circulation plays an important role in the generation and transportation of air pollutants, which impacts the weather, climate, and air quality of coastal areas. Lying on the south of Liaodong Bay, Huludao is easily influenced by SLB. In recent years, regional pollution characterized by ozone (O3) and particles have become increasingly serious under the impact of chemical industry production and automobile exhaust emissions in Huludao. SLB circulation will change the temperature and humidity structure in the coastal boundary layer which determines the photochemical reaction conditions. Meanwhile, it impacts the transport of pollutants in coastal areas. Influenced by local circulation, solar radiation, precursor concentration, and other factors, the O3 concentration on SLB days is more complicated, which has important research significance. Coherent Doppler wind lidar (CDWL) has a high spatiotemporal resolution and continuous observational ability. It can obtain the complete SLB and detailed structure of the atmospheric boundary layer, which is of great significance for understanding the horizontal and vertical transport characteristics of pollutants during SLB circulation.MethodsFrom March 1st to April 30th in 2021, wind profile observation was carried out with CDWL in Juehua Island, Huludao, Liaoning (120.78° E, 40.48° N). The obtained meteorological parameters include wind speed/direction and temperature in the Huludao area and O3 concentrations measured by ground-based instruments during observation. Three main factors should be considered in SLB identification: 1. large-scale background wind field; 2. temperature difference between sea and land; 3. near-surface wind direction change. We identified the SLB days during observation depending on these three conditions and the coastline direction in the Huludao area. We gathered the temporal and spatial distributions of SLB circulation in Huludao, including arrival time, prevailing speed, main direction, and the height of the sea breeze. The impact of SLB on O3 concentration was analyzed, with the ground air quality monitoring data taken into account. Weather Research and Forecasting (WRF) modeling was performed to investigate SLB and its impact on O3 concentration.Results and DiscussionsA total of 11 SLB days were identified with the data from CDWL and automatic meteorological stations in Huludao, accounting for 18% of the observation days. The results show that the sea breeze started at 08:30 averagely. During 14:00—17:00, it developed stronger, and the average speed exceeded 7.0 m·s-1. The height of the sea breeze was 0.3-0.5 km during 10:00—16:00 and reached above 0.9 km after 18:00. As the main direction was east, the sea breeze showed a tendency to deflect in a clockwise direction over time (Figs. 2, 3, and 4). The WRF model presents the sea breeze circulation in the vertical section on April 4th. Sea breeze moved to the Huludao area at 10:00, and a strong wind convergence zone formed along the coastal line at 12:00 (Fig. 5). Pollutants accumulated at the intersection of sea and land breezes and transported to the ground surface by cold air sinking at the sea breeze head simultaneously. The data from the environmental monitoring station shows that O3 concentration rose faster and had a higher peak on SLB days (Fig. 6). The surface wind speed on SLB days was lower than on non-SLB days, and the difference was more than 2 m·s-1 at the same time point (Fig. 7). Land breeze carried O3 from inland to sea at night, and the sea breeze during daytime blew pollutants back to the land, causing the cyclic accumulation of pollutants. With April 4th as an example, the O3 concentration rose faster after the sea breeze arrived at Huludao and peaked at 106 μg·m-3 (Fig. 9). The local recirculation index of horizontal wind in Huludao was only 0.049 on April 4th (Fig. 10), indicating that the transmission capacity of wind field was weak, and thus pollutants were not easy to spread.ConclusionsAccording to the criteria at home and abroad, we identified the SLB days during spring, 2021 in Huludao with the wind data from CDWL and ground stations. In addition, we analyzed the temporal and spatial distributions of SLB circulation in Huludao, including the arrival time, prevailing speed, main direction, and the height of the sea breeze. The result shows that sea breeze forms later at a high altitude than on the surface, and the wind direction changes clockwise. The mesoscale WRF model was used to analyze the development of the sea breeze circulation on April 4th, which proved the results observed by CDWL. The O3 concentration rises faster and has a higher peak on SLB days. The study case shows that the local recirculation of horizontal wind under SLB is low, indicating that it is not conducive to the spread of pollutants. Pollutants will recirculate to the inland area after moving away from the coast during the shift of sea breeze and land breeze, which causes the cyclic accumulation of pollutants.
ObjectiveAs an important chemical raw material, phenol is widely used in the industrial production of pesticides, dyes, plastics, etc. However, phenol is also a major pollutant in environmental groundwater and surface water. Therefore, the development of online sensors for selective and accurate detection of phenol concentration in water is crucial to protect the water environment and human health. In order to realize online detection of the concentration of phenolic compounds in water, electrochemical, photoelectrochemical, and fiber-optic sensors have been widely studied. Among them, the fiber-optic sensor is one of the most promising sensors for online detection of the concentration of phenolic compounds due to its advantages of long-distance transmission, anti-electromagnetic interference, quasi-distributed measurement, etc. However, fiber-optic sensors with photocatalyst or oxidase have low selectivity for the catalysis or oxidation of phenol, which makes the sensor not selective for the detection of phenol in water. In addition, there is no report on the development of horseradish peroxidase (HRP)-coated fiber-optic phenol concentration sensor. Therefore, it is necessary to develop an HRP-coated fiber-optic sensor with high sensitivity and selectivity for detecting phenol concentration by using silica optical fibers.MethodsTo increase the sensitivity and selectivity of the fiber-optic sensor for phenol concentration, a novel surface plasmon resonance (SPR) fiber-optic biosensor composed of horseradish peroxidase (HRP)-coated SPR optical fiber and phenol permeable membrane was created. In order to obtain HRP-coated SPR fibers, first, a layer of polydopamine was polymerized on the surface of the optical fibers, which was used to adsorb gold nanoparticles to form a gold film to stimulate the SPR effect, and then the polydopamine was polymerized on the surface of the gold film to immobilize HRP. Second, the phenol permeable membrane prepared with PEBA2533 and β-cyclodextrin was sealed on the HRP-coated fiber. Third, an online analytical platform for detecting the phenol in water was constructed by using polymethyl methacrylate (PMMA) plates. Fourth, the principle of phenol detection by the sensor was analyzed. Fifth, scanning electron microscope (SEM) and energy dispersive spectroscopy (EDS) were used to characterize the surface morphology and elements of the samples. Furthermore, the influence of the preparation conditions of the sensor on its performance was studied experimentally. Lastly, the output spectrum, sensitivity, response time, selectivity, and detection limit of the sensor were tested.Results and DiscussionsThe experimental results highlight that when the HRP-coated fiber-optic biosensor was prepared under the optimum conditions and the sampling time of the biosensor was set to 300 s, the sensitivity and lower detection limit (LOD) of the prepared sensor reached 224.84 pm·mmol-1·L and 159 nmol/L, respectively (Fig. 9). The optimum conditions were set as follows: 1) the polymerization time and temperature of the polydopamine were 20 min and 25 ℃, respectively (Fig. 6); 2) the adsorption time of gold nanoparticles was 3 h (Fig. 7); 3) the concentration and fixation time of HRP were 0.10 mg/mL and 3 h, respectively (Fig. 8); 4) the thickness of the phenol permeable membrane was 30 μm. The good sensitivity and LOD of the prepared biosensor were generated by the strongest SPR resonance intensity caused by the formed gold film and oxidized products (insoluble polymer) with a higher refractive index than the phenol (the products were produced during the reaction between the phenol and HRP with the assistance of H2O2). The prepared phenol biosensor also showed high selectivity in the 4-chlorophenol, 4-fluorophenol, 2, 4-difluorophenol, 2, 4-dichlorophenol, 2, 4, 6-trichlorophenol, 2, 3, 5-trifluorophenol, NaCl, urea, and glucose solutions. The good selectivity of the biosensor can be attributed to the fact that the phenol permeable membrane prepared with PEBA2533 and β-cyclodextrin shows high phenol selectivity and permeability.ConclusionsIn this paper, a novel SPR fiber-optic biosensor with high sensitivity and selectivity for detecting the concentration of phenol in aqueous solutions was developed. The sensor used HRP to catalyze H2O2 to oxidize phenol, so as to produce an insoluble polymer that adheres to the surface of the optical fiber, make the refractive index on the surface of the optical fiber change, and increase the shift of the SPR wavelength and sensitivity of the sensor. At the same time, the phenol permeable membrane prepared with PEBA2533 and β-cyclodextrin was sealed on the HRP-coated fiber, which promoted the sensor to achieve selective detection of phenol in water. The research in this paper will promote the development and engineering application of optical fiber sensing technology and phenol concentration online detection technology.
ObjectiveThe atmospheric boundary layer is the lowest layer of the troposphere, which is directly influenced by the surface. The atmospheric boundary layer height (ABLH) is an important parameter of the atmospheric boundary layer, whose value ranges from several hundred meters to thousands of meters. It plays an important role in analyzing the heat radiation transmission process in the boundary layer, acquiring the air pollution status, and formulating pollution control strategies. Lidar is an active remote sensing tool, which has high spatial and temporal resolutions and can continuously and automatically measure ABLH. The methods of estimating ABLH based on lidar data mainly include the threshold method, the gradient method, the wavelet covariance transform method, and the variance method. However, these methods are only suitable for specific meteorological conditions, and the interference of clouds or a suspended aerosol layer can easily lead to the misjudgment of ABLH. A highly robust ABLH estimation method combining K-means and entropy weight method, i.e., EK-means, is proposed to solve the problem of erroneous detection by commonly used lidar-based ABLH estimation methods under complex atmospheric structures. The proposed method improves the performance of ABLH estimation based on cluster analysis in terms of initial parameter selection and distance calculation. Compared with commonly used lidar-based ABLH estimation methods, the proposed method has a strong anti-interference ability. It can well track the diurnal variation process of the boundary layer under complex atmospheric structures. Under clear sky and cloudy weather or a suspended aerosol layer structure, the ABLH estimated by the proposed method is basically consistent with that measured by a radiosonde, and the correlation coefficient is 0.9718 and 0.9175, respectively. The proposed method has high robustness and can reliably estimate ABLH under different conditions.MethodsThe proposed method integrates K-means and entropy weight method to improve the ABLH estimation performance based on cluster analysis from two aspects of initial parameter selection and distance calculation. Firstly, a sample dataset is constructed depending on the characteristics of the boundary layer, the free troposphere, a cloud layer, and a suspended aerosol layer. Then the utility function is introduced, and the entropy weight method is used to calculate the weight attributes of sample features. Next, the initial parameters of K-means are determined. The number n of intervals in the same direction is obtained by analyzing the gradient of the lidar backscattering signal, and the number of clustering categories (k=n+1 or k=n+2) can be obtained for different conditions. The initial center of clustering is selected as the position of the maximum signal intensity in the intervals in the same direction. Two centers are evenly selected in the first negative interval, and the Davis-Bouldin index is used for fine tuning. Finally, the ABLH is estimated with category features, which is located at the category boundary seeing the first decrease in the clustering strength from bottom to top.Results and DiscussionsTo assess the validity of the proposed EK-means, this paper uses the lidar data over Atmospheric Radiation Measurement (ARM) Southern Great Plains (SGP) central facility (C1) to estimate ABLH under various conditions. Experiments show the comparison results of the diurnal variation of ABLH tracked by four methods under the conditions of clear sky, polluted weather, and cloudy weather or a suspended aerosol layer structure (Figs. 5-7). The improved K-means and the proposed EK-means can reliably track the diurnal variation process of ABLH under these three conditions, and the proposed EK-means has the best performance (Figs. 5-7). The gradient method and the wavelet covariance transform method are susceptible to complex atmospheric structures such as clouds or a suspended aerosol layer, and the tops of clouds or the suspended aerosol layer is estimated as the ABLH, which has a large error (Fig. 7). Experimentally, the paper also compares the ABLHs estimated by the four lidar-based methods and by the radiosonde under clear sky and cloudy weather or a suspended aerosol layer structure (Figs. 8-9). The ABLH estimated by the proposed method under clear sky and cloudy weather or a suspended aerosol layer structure is consistent with that measured by a radiosonde, and the correlation coefficients are 0.9718 and 0.9175, respectively [Fig. 8(d) and Fig. 9(d)]. The improved K-means also yields good experimental results with correlation coefficients of 0.9522 and 0.7986, respectively [Fig. 8(c) and Fig. 9(c)]. The ABLHs estimated by the gradient method and the wavelet covariance transform method are significantly different from that measured by a radiosonde under cloudy weather or a suspended aerosol layer structure, and the correlation coefficients are both less than 0.5 [Fig. 9(a) and Fig. 9(b)]. The proposed method has high robustness and can reliably estimate ABLH under different conditions (Table 1).ConclusionsThe experimental results show that the proposed method is a highly robust ABLH estimation method compared with other commonly used lidar-based ones such as the gradient method and the wavelet covariance transform method. The proposed method can better track the diurnal variation of ABLH under clear sky, polluted weather, and cloudy weather or a suspended aerosol layer structure. Under the conditions of clear sky and cloudy weather or a suspended aerosol layer structure, the ABLH estimated by the proposed method has better consistency with that measured by a radiosonde, having a higher correlation coefficient and a smaller mean absolute error.
ObjectiveThe booming shipping industry leads to ever increasing emissions of ship exhaust pollutants. Sulfur dioxide (SO2), the main component of pollutants in ship exhaust, causes the most serious air pollution. Effective monitoring of its emissions is the key to controlling ship exhaust pollution. In recent years, the imaging detection technology of SO2 ultraviolet (UV) cameras has been developed rapidly due to its strong practicability and high reliability and has been applied in ship exhaust monitoring. However, calibration is still the main factor that limits its measurement accuracy and application. There are three calibration methods (calibration cells, DOAS, and spectral calibration) for SO2 UV cameras. The calibration cell method is simple and most employed early in calibration. However, the frequent switching of calibration cells exerts adverse effects on the real-time detection of SO2 UV cameras. Although DOAS is suitable for long-distance monitoring, it has the disadvantages of small field of view (FOV) and poor matching. The accuracy of spectral calibration is significantly improved compared with the first two methods, but the complexity and cost of the camera system are rising with the adoption of an outlay UV spectrometer. With a focus on the self-calibration method, this paper carries out research based on the working mechanism of the SO2 UV camera imaging detection technology, the UV radiation transfer theory, and the simulation of the entire system. Comparison between the advantages of the self-calibration method and the three traditional calibrations proves that the self-calibration method not only has accurate, simple, and practical technical advantages but also shows its great application prospect in the UV imaging remote sensing monitoring of mobile pollution sources.MethodsThe signal channel (filter A) is greatly affected by the changing ozone optical path length, but the reference channel (filter B) is relatively less affected. This difference is the source of the basic principle of self-calibration. The theoretical analysis shows that the calibration coefficient is approximately a monotone function of the logarithm of the intensity ratio, and the relationship between them is hardly affected by atmospheric conditions. The inversion process is as follows. First, the signal images of the two channels are obtained through UV cameras. Second, two channels of artificial background images are obtained by the 2-IM method. Before artificial background generation, the dark noise should be deducted from the raw image, and image correlation must be optimized through translation and rotation operations for the best match. Third, the average of the corresponding background intensities of the two channels is employed as the input parameter for self-calibration. The calibration curve of UV cameras can be determined by the logarithmic relationship between the calibration coefficients and the intensity ratio of the two-channel images. The feasibility of the self-calibration method is assessed by the validation experiment. In addition, an outfield experiment is conducted to characterize its accuracy.Results and DiscussionsThe principle for self-calibration is the fact that the two channels of sky background images are affected differently by changes in ozone concentration and the solar zenith angle. The average optical path of solar scattered through the ozone layer increases with the rising solar zenith angle, which makes the ozone absorption worsen the incident light intensity which reaches the cameras system (Fig. 5). As the absorption cross-section of ozone increases significantly towards deep UV wavelength, the signal channel is particularly influenced by variations in ozone optical path length, which is greater than that of the reference channel. Therefore, the functional relationship between the two channels of sky background image intensity ratio and the calibration coefficient can be confirmed (Fig. 7). The validation experiments show that the slope of the calibration curve fitted by the self-calibration method is similar to that obtained by the conventional calibration method with a little difference of about 1.4% (Fig. 9). In addition, the colormap of the SO2 image of the ship plume retrieved from the UV cameras (Fig. 12) is compared with the data collected by the spectrometer. The results show that the error of the two calibration methods is about 6% (Fig. 13), which demonstrates the feasibility of adopting the self-calibration method to invert the exhaust concentration of movable and low SO2 concentration pollution sources.ConclusionsThis paper proposes a real-time self-calibration method for UV cameras, with full consideration of the imaging mechanism of UV cameras and UV radiation transfer theory. Regarding the shortcomings of three traditional calibration methods in practical applications, the theoretical basis of the self-calibration method is proposed. The new method can determine calibration curves for retrieving SO2 concentration by employing the intensity ratios of two channels obtained directly from UV cameras. The self-calibration method is compared with the conventional calibration method, and the error is reduced to 1.4% after filter transmittance correction. To verify the accuracy of the proposed theory, this paper measures the SO2 emission concentration of the ship at Shanghai Port and compares the measurement difference between the self-calibration method and DOAS approach on time series. The error of the two methods is about 6%, which shows good consistency. This study proves that the self-calibration method can overcome the distance limit and adapt to complex environments, with widespread applications in mobile pollution sources.
ObjectiveWith the development of optical photogrammetry technologies, there are more and more means to perceive three-dimensional (3D) point clouds that describe the same object or scene. Through satellite photogrammetry, we can quickly obtain dense urban point clouds in a wide area, but the surface information of the target is not clear because the sensor is too far away, and even the data collected by the close-range platform has fine structure and texture information. However, when there is no precise positioning system or absolute control points, the generated point cloud is in an arbitrary model coordinate system. The rapid and high-precision registration between large-scale point clouds of close-range images and point clouds of satellite images has great potential for applications such as smart city construction, disaster relief, and emergency response. However, there are many problems in this task, which makes it difficult to achieve efficient registration between the two. For example, the resolution of satellite images and close-range images is different, which leads to a large difference in the point density between the two point clouds. As the sensor's line of sight is blocked, there are many holes in point clouds of images. The scale difference in the coordinate system between the close-range point cloud and the satellite point cloud is arbitrary. The image point cloud contains a large number of noise points and outliers because of defects in the dense image-matching algorithm. To this end, an efficient cross-source image point cloud registration method is proposed on the basis of graph theory, which is automatic, fast, and robust. It is believed that the proposed basic registration strategy and graph-matching method can be helpful for the data fusion and reconstruction of large-scale satellite image point clouds and close-range image point clouds.MethodsFirst of all, the ground plane direction in the point cloud is found through the geometric features of the point cloud. The rotation angle of the planar normal vector with respect to the vertical direction of the satellite point cloud is calculated so that the close-range point cloud is roughly aligned with the satellite point cloud on the ground. Then, the centers of the buildings are taken as the nodes, and the layout relationship of buildings in the point cloud is constructed into a graph, which transforms the point cloud registration problem into a graph-matching problem. Afterward, kernel triangles are constructed according to geometric constraints as registration primitives, and higher-order similarity information is used to find the global optimal match of graphs. Finally, the ICP algorithm is adopted for fine registration to obtain high-precision and cross-source point cloud registration results.Results and DiscussionsThe point cloud of the Gaofen-7 satellite images and the point cloud of UAV close-range images in three regions of Henan Province are selected for experiments to verify the effectiveness of the proposed method. There are 22 pairs, 13 pairs, and 11 pairs of nodes that are matched in the three experiments (Fig. 3). In the three experiments with different numbers of holes and noise points, the graph with higher-order similarity information can accurately obtain a sufficient number of matching nodes, overcoming the density and scale differences. Upon the application of the ICP algorithm, the integrated point clouds are obtained, which not only show rich geometric structure and texture details but also have real geographic coordinates (Fig. 4). The coarse registration algorithm based on graph matching enables the ICP algorithm to avoid falling into a local optimal solution, which has good registration accuracy on three datasets of different scales, densities, and noise. The root-mean-square errors of the three experiments are only 5.16 m, 6.39 m, and 9.02 m (Table 2). Finally, the existing four algorithms are used to register three experimental datasets in this paper (Fig. 5) for the performance comparison with the proposed registration method. The experimental results show that the proposed method is independent of noise points and outliers. It can overcome the density differences of different point clouds and eliminate coordinate scale differences of about 939 times. The overall registration speed is improved by a factor of 51-184 compared to that of the comparison methods, and the proposed method is automatic, robust, and efficient.ConclusionsThis paper mainly studies the scale differences, density differences, noise points, and outlier problems in the registration of satellite-image point clouds and close-range image point clouds. A novel point cloud registration method is proposed, which transforms the point cloud registration problem into a graph-matching problem according to graph theory. The centers of buildings are taken as the nodes, and the layout relationship of buildings in the point cloud is constructed into a graph. Kernel triangles are constructed pursuant to geometric constraints as registration primitives. Then, a graph-matching method using the higher-order similarity information of the graph is presented to obtain the spatial transformation model, and the ICP algorithm is used for fine registration. Finally, experiments are conducted on high-resolution satellite-image point clouds and close-range image point clouds in three different regions of Henan Province. The close-range point cloud containing structure and texture details is successfully converted to the spatial coordinate system of the satellite point cloud, and a refined 3D point cloud with real geographic coordinates is obtained. Multiple sets of experimental data show that the proposed method can robustly and quickly register cross-source image point clouds in contrast with other methods.
ObjectiveDeep convective cloud has high, stable, and reliable reflectivity in the visible-near infrared (VIS/NIR) band, which is suitable for radiometric calibration. In addition, the development of deep convective clouds is deeply located at the top of the troposphere and is less affected by water vapor absorption and aerosols. The deep convective cloud is mainly distributed in the equatorial region, which is suitable for the calibration of polar orbit and geostationary satellites. However, the deep convective cloud is not a real Lambertian target. When the satellite detects from different observation angles, the anisotropy characteristics of the deep convective cloud make the satellite observation biased, which leads to calibration errors. Therefore, it is necessary to analyze the directional reflectance characteristics of deep convective clouds and establish an effective bidirectional reflectance distribution function (BRDF) to correct the directional reflectance and improve the calibration accuracy. The operational Hu model is not only inapplicable to the shortwave infrared channel but also has a slight influence on the data stability in the VIS/NIR channel when the eigenvalue is selected as the mean reflectivity. Since the previously constructed model has been relatively long compared with the current one and may be affected by human activities, the anisotropic reflection factors of deep convective clouds will change to some extent. The operational Hu model and CERES thick ice cloud model are broadband models. Therefore, we use the latest data to model the BRDF characteristics of deep convective clouds, which can better characterize the directional characteristics of deep convective cloud reflectivity. Modeling each channel separately can make up for the deficiency that the Hu model and CERES thick ice cloud model are broadband models. For the modeling of the shortwave infrared channel, it can fill the gap that the Hu model used by the current business is not applicable to the shortwave infrared channel, and it is of great significance to improve the calibration accuracy of the deep convective cloud target.MethodsThe BRDF modeling of each channel of deep convective clouds in this paper classifies the deep convective cloud reflectivity data into angle intervals and establishes a look-up table method. In view of the low attenuation of the instrument itself and in order to maintain sufficient data to make the interval of the look-up table established more smoothly, the data from 2016 to 2020 are used. With regard to the selection of normalized objects, it does not affect the relative value of the BRDF factor but only the absolute value of the BRDF factor. It affects the absolute rather than relative quantity of corrected reflectivity value and does not affect the relative calibration and attenuation analysis. The BRDF modeling normalization object in this paper selects a solar zenith angle of 35°, observation zenith angle of 0°, and relative azimuth direction reflectivity of 0° as standard observation geometry. The reasons why they are used as the normalized objects are as follows: 1) for BRDF measurement of objects, since the albedo requires directional integration of data from all angles, which is too complex, the reflectivity in the vertical direction corresponding to the zenith angle is often used as a substitute; 2) the data volume of the interval deep convective cloud corresponding to this angle is the largest. As a normalized object, it can make the BRDF model more evenly distributed. Theoretically, as the interval division gets detailed, the anisotropy of the deep convective cloud target can be explained better. However, according to the principle of statistical model, in order to ensure that each angle interval has a certain amount of data distribution, for each channel, the zenith angle is classified as interval data of 5°, and an interval look-up table of 5° is constructed based on the existing data. In other words, the solar zenith angle is taken as 0°-5°, 5°-10°,…, and 45°-50°, and the observation zenith angle is taken as 0°-5°, 5°-10°,…, and 45°-50°. The data of every interval of 10° of the relative azimuth angle are classified into one category, that is, 5°-15°,…, 165°-175°, which is divided into intervals of 10×10×17=1700 in total, and the mean value, standard deviation, and number of pixel points within each interval are calculated and counted.Results and DiscussionsThe results show that the BRDF characteristics of the VIS/NIR channels are almost the same. The lowest reflectivity appears at the larger observation zenith angle, and the highest reflectivity appears in the perigee direction. On the contrary, the lowest reflectivity of the shortwave infrared channel appears near the perigee, and the highest reflectivity appears at the location where the zenith angle of the forward scattering observation is large (Fig. 1). Hu BRDF model chooses 17.5° between 15°–20° of solar zenith angle to normalize the anisotropy factor corresponding to different observation zenith angle and relative azimuth, with solar zenith angle of 35°, observation zenith angle of 30°, and relative azimuth of 135°. The results are plotted as a polar image (Fig. 2) and compared with the modeling results. Compared with that of the Hu model, in the VIS/NIR band, the overall anisotropy of the proposed model shows a high consistency, which proves the reliability of the model. In the shortwave infrared channel, the Hu model shows a great difference, which is related to the inapplicability of the Hu model to the shortwave infrared channel. For the VIS/NIR band, the reflectivity of deep convective clouds is related to the cloud optical thickness, while the shortwave infrared channel is related to the absorption characteristics of particles, which is the fundamental reason for the large difference in anisotropy between the shortwave infrared channel and the VIS/NIR channel.ConclusionsIn this paper, BRDF feature modeling of deep convective clouds is realized. The extracted data of deep convective clouds during 2016-2020 are divided into intervals by angles, and the BRDF characteristics are characterized by calculating the mean reflectivity of each interval. The experimental results show that the BRDF characteristics of the VIS/NIR band are basically the same. The lowest reflectivity appears at the location of the larger observation zenith angle, and the highest reflectivity appears in the perigee direction. For the shortwave infrared channel, the situation is the opposite. The lowest reflectivity appears near the perigee, and the highest reflectivity appears at the location of the larger forward scattering observation zenith angle. The BRDF characteristics of different bands in the shortwave infrared channel are quite different. When the model and Hu model are normalized to the same angle, the difference is compared. The results of the Hu model in the VIS/NIR band are similar to those of modeling, and the shortwave infrared channel is quite different. The effect of the BRDF model on reducing the standard error of deep convective cloud responses is further analyzed. Compared with the model without BRDF correction, the Hu model and the proposed model both reduce the standard error of the response in the VIS/NIR band. For the shortwave infrared channel, the Hu model is not applicable, and the standard error of this model can be reduced by 31% at most. Compared with the Hu model, except for the poor correction effect of the model in the band of 460 nm, other bands show a better correction effect. Finally, the model in this paper is used to correct the direction of deep convective cloud reflectivity data based on Himawari-8 from 2016 to 2022, calculate its attenuation, and compare it with the attenuation results of the calibration coefficient method. It is found that it has a high consistency in the VIS/NIR band, and there are differences in the shortwave infrared band, which is related to the low attenuation rate of deep convective clouds in the shortwave infrared channel and its large fluctuations. This thus proves the reliability of the model in this paper.
ObjectiveThe refined target classification has always been a research hotspot in remote sensing and is also a prerequisite for studies on biomass calculation, global carbon cycle, and energy flow. With the continuous expansion and refinement in remote sensing detection, more effective and accurate target classification is becoming more complex and difficult. 3D spatial information and rich spectral information are typical attributes of a target, which is significant data support for target classification. Hyperspectral lidars have been successfully designed and structured for target classification to achieve the integrated acquisition of 3D spatial information and spectral information. With an aim at this new type of remote sensing data, how to develop and exploit its potential in target classification is of research significance. Therefore, to realize high-precision recognition and classification under complex scenes, we propose a target classification process of spatial-spectral feature optimization selection dependent on the hyperspectral lidar. This method can not only reduce feature redundancy and select the optimal feature combination for target classification but also reduce computational efficiency and save costs, thereby providing new research ideas for refined target classification with hyperspectral lidar.MethodsWith the continuous expansion of remote sensing detection, detection targets become more diversified and complicated. Constructing various spatial-spectral features based on spectral information and spatial information is a mainstream method to improve the accuracy of target classification. Based on the technological advantages of the integrated imaging detection of high spatial resolution and hyperspectral resolution, we construct spectral index features of the vegetable index and color index, and geometric features for target classification. Extracting lots of spatial-spectral classification features can enhance the classification accuracy, yet it may produce feature redundancy, increase the calculation cost, affect the classification efficiency, and even lead to declining classification accuracy. Therefore, we put forward a target classification process of spatial-spectral features optimization selection dependent on the hyperspectral lidar. In the feature space built by the hyperspectral lidar, these spatial-spectral features with the best classification significance are determined based on the marine predator algorithm by iterative search and selection to minimize the classification error. Finally, considering the feature heterogeneity of the selected feature combination, the feature correlation is calculated to eliminate feature redundancy and determine the optimal feature combination, thereby improving classification accuracy.Results and DiscussionsTo further explore the technological advantages of hyperspectral lidar for target classification under complex scenes, and to compare and verify the feasibility and universality of the proposed method, we design six different classification strategies with different feature combinations. Classification results of these feature combinations are determined by a random forest algorithm. Total accuracy, average accuracy, Kappa coefficient, accuracy rate, and recall rate are adopted to evaluate the classification results of each category. Table 4 shows that the six different classification strategies yield sound classification results with the total accuracy higher than 89%, the average accuracy of more than 68%, and Kappa coefficient greater than 0.85. Compared with the results of the first three classification strategies, the classification results of the fourth strategy which integrates original spectral information, elevation value, index features, and geometrical features, have been greatly improved. Additionally, the overall accuracy can reach 95.57% with the average accuracy of 84.37% and the Kappa coefficient of 0.9380, whereas the elapsed time is the longest at 5.16 s. The predicted result of target labels is shown in Fig. 6(d). Based on the spatial-spectral feature optimization selection method, the optimal feature combination could be determined to eliminate feature redundancy and enhance classification accuracy. The overall accuracy and average accuracy are increased by 1.56% and 4.36%, respectively, and the elapsed time is reduced by 1.55 s. The predicted results of target labels are shown in Fig. 8(f). The classification results demonstrate that this method can determine the optimal spatial-spectral features for target classification, and provide a new research idea for refined target classification with hyperspectral lidar.ConclusionsAs a new active remote sensing technology, the hyperspectral lidar can combine the technology advantages of passive hyperspectral imaging and lidar scanning imaging and has great application potential in refined target classification under complex scenes. Therefore, we propose a target classification process of spatial-spectral feature optimization selection dependent on the hyperspectral lidar. The index features constructed by the spectral band optimization and geometric features constructed by the local neighborhood surface fitting are extracted and employed to target classification. Finally, the optimal feature combination is determined by the proposed method to achieve high-precision target classification under complex scenes with the scanning scene of 14 different targets. Based on the spatial-spectral feature optimization selection to determine the optimal spatial-spectral feature combination, it can effectively eliminate the characteristic redundancy. This increases the overall classification accuracy by 1.56% and the average classification accuracy by 4.36%, and the elapsed time is reduced by 1.55 s. However, there is a certain degree of misclassification because the spatial structures of some targets are so complex that the laser irradiates to the edge of targets or only part of the laser irradiates to the surface of a target, thus leading to a large deviation in spectrum acquirement. The classification results could be smoothed by the boundary algorithm or conditional random field algorithm to eliminate the salt and pepper noise and improve the classification accuracy.
Objective Synthetic aperture radar(SAR) can actively obtain surface information, has a wide image coverage, is less affected by natural conditions, and can conduct all-weather and all-day ground reconnaissance. Change detection based on SAR images can obtain target change information in the same airspace and different time domains. It plays an important role in both military and civilian fields, and can provide support for emergency and rapid decision-making by relevant national departments. SAR image contains rich multi-dimensional and multi-domain information, and its processing can improve image utilization. With the development of SAR, difference map generation in SAR image change detection plays a key role in subsequent processing. Spatial domain filtering takes into account the correlation between pixels and their neighbors, and directly denoises the space of pixels in the image. The frequency domain low-pass filtering is the operation of the image in the frequency domain, reducing the sharp edge contour part and highlighting the smooth part. The existing difference map construction method mainly focuses on spatial domain filtering, which cannot retain the change information well, and has less consideration for the frequency domain filtering method. In the difference map generation, only a single spatial domain filtering method is used, ignoring the information in the frequency domain of the image. In order to improve the model generalization ability and detection accuracy of SAR image change detection, we propose a SAR image change detection method based on dual-domain filtering.MethodsFirstly, we filter the original SAR image in the spatial domain, and filter the dual temporal SAR image in different ways. We construct a logarithmic ratio operator after the adaptive median filter, and we construct a difference operator after the mean filter. Then, Laplace fusion algorithm is used to fuse the difference map in the spatial domain and synthesize the feature information of different difference operators. Afterwards, the fused image is transformed into the frequency domain for low-pass filtering in the frequency domain. Finally, the change detection result graph is obtained by using clustering algorithm.Results and DiscussionsIn order to verify the effectiveness of the proposed method, four datasets of Bern, Ottawa, San Francisco, and Yellow River are used for experiments. In the hidden line elimination experiment, the difference operator proposed in this paper is used to improve the accuracy of the basic algorithm, which has significantly improved in the objective indicators (Figs. 9-16). It can be seen that the noise points in the detection results after the dual-domain filtering are the least, and the degree of detail in the detection results is well preserved, and the number of missed detections and false alarms are reduced to varying degrees, which are relatively balanced. The results of the two clustering algorithms are close (Fig. 17). At the same time, in order to compare the performance of the registration methods proposed in this paper, we use the existing five algorithms to test on the four experimental datasets in this paper (Fig. 18). The proposed Dual Domain-K method is the best in Bern and Ottawa datasets. Compared with the depth learning method, the accuracy of Dual Domain-K method is lower, but the calculation time cost is greatly reduced, and the accuracy is also guaranteed. Finally, the influence of the experimental parameters manually adjusted in this method on the result indicators is given (Fig. 19, Table 10 and Table 11). Four sets of data from Bern, Ottawa, San Francisco, and Yellow River are used for experimental verification, and the experimental results show the effectiveness of differential images after dual-domain filtering in the clustering.ConclusionsThis paper mainly studies the high noise problem of difference operator in SAR image change detection. The feature representation of difference operator is studied. Under the condition of ensuring certain accuracy, the calculation time of depth learning algorithm is reduced, and the operation efficiency is improved. A new change detection algorithm is proposed, which deals with difference operators in frequency domain. We fuse the features of different operators in the spatial domain, and use Laplace for fusion to retain the features in the spatial domain to the greatest extent. Then, Fourier transform is used to transform the SAR difference operator to the frequency domain for low-pass filtering, and the main part of the transform is retained. Finally, experiments are carried out with real SAR image data, and change detection results with high accuracy are obtained. Several groups of experimental data show that, compared with other methods, the proposed method has strong robustness on different datasets and can quickly generate binary mapping of change detection results.
ObjectiveDue to the high spectral resolution, hyperspectral remote sensing imaging technology can describe rich spectral features of ground objects, which is of great significance for the fine classification and recognition of ground objects. In the feature extraction and classification of hyperspectral images, the traditional deep learning network model employs the deep network structure to improve the classification accuracy. However, with the superposition of the convolution layer and the pooling layer, the phenomenon of gradient vanishing and gradient explosion appears in the model, which exerts adverse effects on the classification. Although some scholars have proposed the residual network with the identity link to solve the model degradation caused by the deepening of the network model, it still has the shortcomings of large reference quantity and high time cost. To this end, a lightweight multi-scale residual network model (DSC-Res14) based on depthwise separable convolution is designed and built in this paper, which not only ensures the high classification accuracy of the model but also improves the model training efficiency. This innovative study provides a new solution to further promote the intelligent information extraction of hyperspectral remote sensing images.MethodsIn this paper, a lightweight residual network (DSC-Res14) is proposed based on three-dimensional depthwise separable convolution instead of the traditional two-dimensional convolution, so that the long training time caused by large parameters in feature extraction and classification of hyperspectral images by traditional depth residual network is solved, and the performance of object classification using hyperspectral images is improved. For the proposed model with the input using image blocks after reduction dimensionally by principal component analysis, a convolution layer is first employed for initial feature extraction, and both spectral and spatial features of the image blocks are further extracted by three residual layers, each of which contains two residual structures. Finally, a full-connected layer is adopted to provide an input of one-dimensional feature vector for a classifier for pixel-to-pixel classification of hyperspectral images. To reduce network training parameters, this paper leverages the depthwise separable convolution for each residual structure in the residual layer. For the depthwise separable convolution operation, two-dimensional grouping convolution is utilized to extract spatial features from each channel, and then one-dimensional point convolution is employed to extract spectral features. After each convolution layer, batch normalization layer is added to keep the same distribution of input features, and the ReLU activation function is adopted to accelerate the network convergence speed and alleviate gradient disappearance.Results and DiscussionsTo verify the classification accuracy and speed of the proposed DSC-Res14 model, the paper compares this model with other three similar models and the Res14 model which employs the traditional 3D convolution kernel but has the same network structure as the proposed model. In terms of classification accuracy, the overall accuracy of Res14 on two public standard datasets has reached more than 99.5%, indicating the rationality of the network structure in this paper. For the categories with a small number of samples in the Indian Pines dataset, the classification accuracy of the DSC-Res14 model after introducing depthwise separable convolution is slightly decreased compared with Res14, but it still has obvious advantages over other similar models. In the Pavia University dataset, the accuracy indexes of the DSC-Res14 model proposed in this paper are all superior to Res14. The overall accuracy (OA) is 0.04% higher, the average accuracy (AA) 0.02% higher, and the kappa coefficient 0.04% higher, which shows the best performance among the similar models involved in the comparison. Under the conditions of relatively balanced and sufficient samples, the proposed DSC-Res14 model not only avoids a decline in classification accuracy with a reduction of the network parameters and an optimization of network structure, but also slightly improves the classification accuracy, compared with the traditional 3D convolution residual network. In contrast to similar models likely with depthwise separable convolution, the parameter number of the proposed model is smaller and the deep residual structure also leads to higher classification accuracy. For the three categories with fewer training samples of the Indian Pines dataset, the classification accuracy of other models is poor, but the classification accuracy of each category in the proposed model becomes better and more balanced with an average accuracy of 99.03%, which indicates the ability to deal with uneven sample probability distribution.From a comparative analysis above, the conclusions are as follows. The introduction of depthwise separable convolution makes the parameter number of convolution layers and floating point operations (FLOPs) of the proposed DSC-Res14 model in the paper only 1/7 of that of the Res14 model, and the training time is about 1/3 of that of the Res14 model with ensuring high classification accuracy. The proposed model is proven to be a lightweight and efficient depth residual network.ConclusionsIn this paper, a lightweight deep residual network model based on depthwise separable convolution is proposed to address the issue of large parameter size and longer training time caused by a deep network structure for improving classification accuracy using hyperspectral remote sensing images. Firstly, both spectral and spatial features of dimensional-reduced hyperspectral images by principal component analysis method are extracted through a three-dimensional convolution layer of the proposed network. Then, three 3D depthwise separable convolution residual layers with different spatial scales are introduced to extract deep semantic features of the given images. This reduces the number of training parameters of the network and enhances the expression ability in high-dimensional and multi-scale spatial features of the image. Experiments on the public Indian Pines and Pavia University datasets show that the classification accuracy of the proposed model is 99.46% and 99.65%. Compared with similar models, this model guarantees high classification accuracy and has fewer parameters and lower computation costs, shorter training time, and better robustness.
ObjectiveGaofen4 (GF4) is China's first high-resolution geostationary optical satellite equipped with planar array, which is employed for remote sensing monitoring of China and its surrounding areas. The panchromatic planar array sensor on this satellite collects images with a complementary metal oxide semiconductor (CMOS) of 10240×10240 detectors. It can perform time-sharing imaging on five spectral bands through rotating filters and simultaneously obtain panchromatic and multi-spectral images with a spatial resolution of 50 m. Essential in data processing of GF4, on-orbit geometric calibration should be performed to correct the systematic geometric errors in its imaging models and ensure the geometric quality of its images. At present, on-orbit geometric calibration is also usually performed based on such an imaging model to fit the rigorous geometric imaging model adopted in the processing system of remote sensing satellites. However, although the on-orbit geometric calibration is only a simple resection in photogrammetry, the satellite is a complex imaging and measuring system integrating attitude, orbit, and time observations. The building of its rigorous imaging model involves complex processing for auxiliary data such as attitude, orbit and time and ephemeris data, as well as transformations among multiple coordinate systems. Additionally, each calibration task requires separate production of these auxiliary data in the daily operational data processing system. Therefore, the geometric calibration based on the rigorous imaging model is not only complicated in modeling but also time-consuming and laborious. Thus, this paper proposes an on-orbit geometric calibration based on the unified rational polynomial coefficient (RPC) model for the panchromatic planar array sensor on the GF4 satellite.MethodsThis paper proposes a simple on-orbit geometric calibration method based on a priori RPC model, in which the calibration is performed on the current calibration parameters and the RPC generates based on these calibration parameters. The essence is to employ the geo-positioning residual determined by the current RPC to correct the current calibration parameters. Firstly, it is still necessary to match a certain number of evenly distributed ground control points (GCPs) from the high-precision digital ortho map (DOM) and digital surface model (DSM) in the image coverage area. Secondly, the virtual image points corresponding to the GCPs are obtained by back projection of the RPC. Thirdly, based on the current calibration parameters, the on-orbit geometric calibration model is built with the virtual and real image points of GCPs. Finally, the adjustment model of the calibration parameters is built, and the least square optimization is adopted to solve the calibration parameters together to compensate for the systematic geometric errors in the planar array sensor. The sensor calibration accuracy is verified based on correcting low order errors. This method only utilizes L1B image data with an RPC instead of needing attitude, orbit, and time auxiliary data and building a complex rigorous imaging model. It has the advantages of simple and convenient processing and can obtain almost the same accuracy as traditional calibration methods.Results and DiscussionsThe viewing angle of the detectors determined by this method is almost the same as that from the calibration based on the rigorous imaging model, and the maximum difference between them is only 0.01 pixels (Table 2). For the calibration image, the initial imaging model of the image has a large geo-positioning error before calibration, and there is an obvious radioactive geometric error gradually increasing from the image center to the edge. The mean square errors of comprehensive geometric residuals in the row and column directions are 1.54 and 1.85 (Table 3), but up to 3-4 pixels at the image edge (Fig. 5), which seriously affects the performance in subsequent image registration and fusion. After the proposed calibration, the absolute geo-positioning accuracy and internal geometric accuracy of the image have been significantly improved. The absolute and relative residuals of the checkpoints tend to be the same, and the direction has good randomness (Fig. 5). For the verification image, the proposed calibration has improved the internal geometric accuracy of the single image from about 1.5 pixels to about 0.8 pixels in both directions. The calibration accuracy of this method is consistent with that of calibration based on the rigorous imaging model (Table 4), which directly shows that the proposed calibration method is effective and reasonable.ConclusionsThis paper proposes a simple and practical on-orbit geometric calibration method for the panchromatic planar array sensor on the GF4 satellite. Different from traditional methods, this method does not need to build a complex rigorous imaging model based on multiple auxiliary data. The current calibration parameters and the corresponding generated RPC are enough to estimate the accurate calibration parameters, and such parameters can be directly adopted in the ground processing system. Compared with traditional methods, this method does not need complex auxiliary data processing and transformations among various coordinate systems, and its approach and modeling are both simple. Therefore, it is extremely suitable for satellites such as GF4 that need high-frequency on-orbit calibration. The effectiveness of this method is verified through a group of experiments and compared with traditional methods based on a rigorous imaging model. Experimental results show that this method can obtain calibration results that are almost consistent with traditional methods, and can effectively compensate the systematic geometric errors in the imaging model of a planar array satellite sensor.
ObjectiveBuilding contours play an important role in urban planning, urban change analysis and three-dimensional city modeling. Extracting accurate building information from multi-source data is a necessary guarantee for building model reconstruction. The building contours extracted from historical raster maps, remote sensing images and LiDAR point cloud data have errors in position, direction, size and shape due to the influence of original data quality and algorithm performance. However, most of the traditional contour optimization methods are aimed at a class of data, which have the problems of low universality and accuracy. In this study, a new building contour optimization method which is applicable to multi-source data is proposed, which can effectively improve the regularity and accuracy of the initial building contours. We hope that the proposed method can enrich the existing contour optimization methods and contribute to further automatic regularization of building contours.MethodsThe method proposed in this paper mainly consists of five steps. Firstly, the modified Douglas-Peucker (D-P) algorithm is used to simplify the contour. The convex hull method is used to obtain the starting and ending points of the contour, and the vertical distance method is used to obtain the distance threshold of simplifying the contour. Secondly, the least square method is used for line fitting, and then to find the intersection points of lines to further optimize the contour. Subsequently, the defined feature edges and feature angles are regularized. Then, rectangular processing is carried out according to the angle relationship between the main direction of the building and each contour edge. Finally, a method based on the maximum area overlap degree is designed to improve the precision of contour position. Furthermore, the accuracies of experimental results are evaluated with four indexes including position similarity, direction similarity, size similarity and shape similarity.Results and DiscussionsIn this paper, we carry out experiments by using multi-source vector data of building contours. The results show that the proposed method is effective, and has high building contour accuracy and strong universality. For the initial building contour extracted from the historical raster map, the proposed method has high accuracy for both complex building contours and simple building contours (Fig. 10). The accuracies of the experimental results are above 0.95 (Table 2). For the initial contours of buildings extracted from remote sensing images, compared with method A, the contour optimization results of the proposed method are more accurate (Fig. 11), especially for the results of non-rectangular buildings, the accuracy is improved significantly (Table 3). For the initial building contours extracted from LiDAR point cloud data, the results of the proposed method are basically consistent with those of Method B (Fig. 12), which have high accuracy (Table 4). The optimized contours are close to the real building contours (Fig. 13). In addition, the time complexity of each stage is analyzed (Table 5), and experiments and discussions on special buildings are conducted with circular arc structures (Fig.14).ConclusionsTo improve the accuracy and universality of building contour optimization method, a new multi-source data oriented building contour optimization method is proposed in this paper. The main innovations and contributions of this paper include: the improved D-P algorithm is designed to simplify the building contour, in which the convex hull method and vertical distance method are used to effectively overcome the difficult problems of the selection of starting and ending points and the selection of the simplified distance threshold, which enhances the adaptability of the threshold value and improves the accuracy of the simplified results; the location precision method based on the maximum area overlap degree is designed, which improves the accuracy of the building contour to a certain extent; different from the existing literatures which only focus on the contour optimization for a class of data, the method proposed in this paper carries out optimization experiments on building contours extracted from common three types of data, which verifies the effectiveness and universality of the proposed method. Compared with some existing literatures, the method designed in this paper has the advantages of high precision and strong universality. However, the proposed method also has some limitations. For example, this method is not suitable for the optimization of the contours of buildings with curved structure and topologically adjacent buildings, and manual thresholds (such as angle thresholds during right-angle) are also needed in some links of the contour optimization process. In addition, the optimization results of building contours largely depend on the quality of initially extracted contours. In order to further improve the accuracy and universality of the contour optimization method, the deep learning-based building contour prediction method should be explored in the next step.
SignificanceOptical properties of atmospheric turbulence play an important role in atmospheric sciences, astronomy, and applications of optical engineering, such as adaptive optics, imaging, remote sensing, and optical communication in free space. Real atmospheric turbulence presents great spatial and temporal complexity. Practical light propagation experiments in a real atmosphere usually cost much and encounter many difficulties. Although these kinds of experiments have been carried out, it is usually difficult to obtain favorable results because of the non-homogenous and uncontrollable atmospheric conditions.Thus, some controllable and size-limited atmospheric turbulence simulators in the laboratory have been built for light propagation effect study in scientific research and engineering applications. A typical laboratory turbulence simulator is a tank or chamber of meter size filled with a turbulent medium under a heating mechanism. The turbulent medium is usually water or air. An unstable vertical temperature gradient is produced to simulate turbulence. Some instruments for status monitoring are used to measure the temperature, velocity, and turbulence strength. Adjusting the gradient can change the turbulence strength. These artificial turbulence simulators have been proven to be useful facilities.Much work has been done on these turbulence simulators. For example, the relationship between the phase compensation efficiency of an adaptive optics system and the Fried parameter r0 of simulated turbulence was obtained through experiments with such laboratory turbulence simulators. Some light propagation effects were investigated. However, there were few laws for light propagation effects based on the results of experiments on such simulators.ProgressWith the development of light propagation and imaging in marine media, new optical engineering in earth environments, and special optical beam propagation in the atmosphere, artificial turbulence simulators are employed more widely. The experiments carried out in the simulated turbulent media can qualitatively or semi-quantitatively present light propagation effects similar to those effects in real atmospheric turbulence.In many applications of optical engineering, the light propagation distance is several kilometers or even longer. In order to simulate the light propagation effects, the turbulence strength in the laboratory simulators must be much stronger than the real atmospheric turbulence. This requirement for turbulence strength has been fulfilled in most laboratory simulators. However, less attention has been paid to the similarity of spatial and temporal properties of the simulated turbulence with real atmospheric turbulence.A favorable laboratory turbulence simulator with excellent performance should provide turbulence with stable properties that can be adjusted quantitatively. The properties of the simulated turbulence should be similar to those of the real atmospheric turbulence. The inertial range of turbulence should cover the scale range from millimeter to meter, and the temporal spectrum should cover a range from 0.1 Hz to 100 Hz or several kHz.It must be reminded that only a small portion in the inner of the flow media of the simulator can present locally isotropic homogeneous turbulent status, and thus it is not suitable to employ propagation theory for a homogenous turbulent path to analyze the experimental results of these simulators.Conclusions and ProspectsMore and more investigations on the optical properties of atmospheric turbulence at different places and time reveal that real atmospheric turbulence is very complicated, and in many cases, the real turbulence cannot be simply treated as locally homogenous and isotropic and described by Kolmogorov theory. It is very difficult in the laboratory to reliably simulate turbulence with properties of real atmospheric turbulence.If we want to study light propagation effects quantitatively by using a simulator, we should design a simulator providing optical similarity with practical propagation conditions and obtain simultaneously detailed information about the structure of optical properties in the simulated turbulent media with the light propagation experiment. As more and more laboratory turbulence simulators are constructed, it is necessary to emphasize the physical similarity requirements. The first physical similarity is the fluidity similarity which concerns geometry, dynamics, Reynolds's number, etc. The second physical similarity is the light propagation condition. Some key spatial scales must be considered, including the scale of the light source, light wavelength, and propagation distance, the Fried parameter r0, and the inner and outer scales of turbulence. When these similarity requirements are fulfilled, the turbulence strength should be created high enough to achieve the most severe propagation condition characterized by the Rytov index.In order to make more proper use of a laboratory turbulence simulator in the scientific study of atmospheric optics and the system design of optical engineering, the spatial and temporal properties of the laboratory turbulence simulator should be investigated in detail by both measurements and numerical simulation of the fluid field. On the basis of these investigations, better laboratory turbulence simulators with more suitable geometry can be designed and constructed.
ObjectiveThe lightning locations of tall buildings are relatively predictable with high occurrence probability, and the lightning of tall buildings does not need a larger cost compared with artificially triggered lightning. Therefore, tall buildings can provide a good observation platform for lightning research. Additionally, with the rapid development of urbanization, the probability of lightning striking tall buildings is increasing. Thus, the study on the lightning of tall buildings can provide practical references for the lightning protection design of tall buildings. With deepening research on the physical characteristics of lightning discharge, the spectral diagnosis of lightning plasma has become an important tool for measuring lightning properties. At present, the observations and research of lightning spectra mainly focus on natural lightning and artificially triggered lightning, but there are few studies on lightning spectral observations of tall buildings. In addition, the optical thickness of the lightning channel is an important prerequisite for quantitative analysis of the lightning spectrum. Due to the lack of spectral resolution in previous experimental systems, the experimental verification of the optical thickness of lightning NI and OI radiation in the near-infrared spectrum is rare. This paper employs the spectra of one lightning with three return strokes on the 600-meter-high Canton Tower obtained at the Tall Object Lightning Observatory in Guangzhou (TOLOG) to analyze the evolution and variation characteristics of the spectra with the time and the channel height in detail. Experimental verification of the optical thickness of lightning near-infrared radiation is also presented by comparing the measured intensities of spectral lines of NI [856.8 nm, 859.4 nm, 862.9 nm] multiplet with the theoretical values. This study hopes to deepen the scientific understanding of the microcosmic physical process of lightning discharge and provide an experimental basis for the quantitative analysis of the near-infrared lightning spectrum.MethodsThe TOLOG with six stations is established by Chinese Academy of Meteorological Sciences and Guangdong Meteorological Service. Spectral observations are set up at Station 1 and recorded by a slitless spectrograph with a high-speed camera. The splitting system of the spectrograph is a plane transmission grating, which is placed tightly in front of the objective lens of the camera. Based on the spectra of one lightning with three return strokes on the 600-meter-high Canton Tower, the evolution and variation characteristics of the spectra with the time and the channel height are analyzed. In addition, the influence of opacity on the spectral line intensity of lightning plasma can be determined with the intensity ratio of the spectral lines, and one way to determine the optical thickness is to compare the intensities of several lines with the same upper energy level within the same multiplet. Thus, after comparing the measured intensities of spectral lines of NI [856.8 nm, 859.4 nm, 862.9 nm] multiplet with the theoretical values, this study presents the experimental verification of the optical thickness of lightning near-infrared radiation.Results and DiscussionsThe results show that the discharge channels of three return strokes on the Canton Tower have stronger luminescence below 200 m (Fig. 6). In the initial discharge stage of the return stroke, when the upward current wave does not reach the top of the channel, the radial spectral radiation at the bottom of the channel is composed of stronger ionized lines and weaker neutral lines. Meanwhile, the radial spectral radiation at the top of the channel mainly depends on the downward leader and is composed of weaker ionized lines and stronger neutral lines (Figs. 4-5). When the current wave is transmitted to the top of the channel, the whole channel radially radiates strong ionized lines and strong neutral lines, and the total intensities of ionized lines and neutral lines all decrease with the increasing channel height (Figs. 4-5). After 70 μs discharge, the total intensities of ionized lines and neutral lines remain basically unchanged with the channel height above 200 m (Figs. 5-6). This observation directly confirms that the lightning channel consists of a hot core radiating ionized lines and a cold peripheral corona radiating neutral lines. Additionally, intensity ratios of the spectral lines and the theoretical optically thin limit within the NI [856.8 nm, 859.4 nm, 862.9 nm] multiplet show that the measured ratios of NI lines within this multiplet are basically unchanged with the time (Fig. 7), which means that the near-infrared spectrum of the lightning channel meets the optically thin condition.ConclusionsBased on the spectra of one lightning with three return strokes on the 600-meter-high Canton Tower obtained at the TOLOG, the evolution and variation characteristics of the spectra with the time and the channel height are analyzed first in detail. Experimental verification of the optical thickness of lightning near-infrared radiation is also presented by comparing the measured intensities of spectral lines of NI [856.8 nm, 859.4 nm, 862.9 nm] multiplet with the theoretical values. The results show that the discharge channels of three return strokes on the Canton Tower have stronger luminescence below 200 m. In the initial discharge stage of the return stroke, when the upward current wave does not reach the top of the channel, weak neutral lines in the near-infrared band are radiated by the channel when the ionized lines in the visible band just appear in spectrum at the bottom of the channel. When the intensity of ionized lines in the visible band peaks, the intensity of neutral lines in the near-infrared band also peaks. This is different from previously reported observations, which directly confirms that the lightning channel consists of a hot core radiating ionized lines and a cold peripheral corona radiating neutral lines. In the initial discharge stage of the return stroke, the total intensities of ionized lines and neutral lines all decrease with the increase in the channel height. After 70 μs discharge, the total intensities of ionized lines and neutral lines remain basically unchanged with the channel height above 200 m.