


Please enter the answer below before you can view the full text.
5-3=

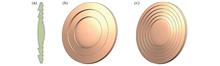
ObjectiveAs science and technology develop by leaps and bounds, requirements for the comprehensive performance of optical systems are getting higher. Optical systems are developing towards lightweight, simple structure, excellent optical performance, and low manufacturing cost. Due to its good optical properties, thermal stability, and flat field characteristics, the diffractive optical element is applied to the achromatic field. It can not only increase the degree of freedom of optical design but also break through many limitations of traditional optical systems. It has incomparable advantages in improving the image quality and reducing the volume and weight of the system, whereas its dispersion characteristics limit the application in the wide band. In this paper, a combination of multiple-order diffractive elements (MODs), refractive elements (ROEs), and diffractive Fresnel elements (DFLs) is proposed to realize the achromatism of the system, which greatly enhances the practicability of diffractive lenses under the wide band. In the field of wide band, the achromatic and apochromatic refractive-diffractive hybrid optical system can be realized. After analyzing and comparing surface shapes, the results which can optimize the imaging quality of the optical system are obtained. The proposed design can promote the application of the refractive-diffractive hybrid optical system in the field of achromatic and be conducive to the application of multiple-order diffractive element combination system in the field of achromatic.MethodsThis paper analyzes the optical system composed of multiple-order diffractive elements, refractive elements, and diffractive Fresnel elements. Under the guidance of scalar diffraction theory, the combined optical system is mathematically expressed based on the Seidel third-order aberration theory. Firstly, according to the achromatic and apochromatic characteristics of the system, the focal power of the system is expressed, and the expression relationship is obtained. Then, according to the third-order aberration theory of the thin lens, the third-order aberration coefficients of the three elements after gluing are obtained, and the conjugate parameters and bending parameters of the system are expressed by the definition and relational expression of the conjugate angle of the thin lens. By the given specific parameters, an achromatic and apochromatic system based on the proposed design concept is obtained, and the spherical aberration and coma aberration of the system are corrected. A better surface is selected after the three optical elements and comparing their different surface morphologies are analyzed. The achromatic and imaging quality of the three elements are compared mainly from the three modes of planar, spherical, and aspheric surfaces.Results and DiscussionsThrough the mathematical derivation of the system, the Seidel aberration coefficients of the spherical aberration and coma of the system are set to zero respectively. Via the given parameters, a three-element glued optical system with corrected spherical aberration and achromatic and apochromatic aberration is obtained (Fig. 3). Then, the system is placed under the base surface of planar, spherical, and aspheric surface respectively, and some of its parameters are controlled to be the same (Table 1). By changing its aspheric coefficient and radian coefficient (Table 2), a comparative analysis is carried out under the optical system with a focal length f=20 mm, a field of view of 3.5°, an F number of 4, and a working band of 400-700 nm in the visible light band. It is concluded that the system has a better quality under spherical and aspheric surfaces (Fig. 5), smaller axial aberration, and a more obvious achromatic effect (Fig. 6), which is markedly better than under the plane surface. The modulation transfer function and the encircled energy of the spherical and aspheric surfaces are compared. It is concluded that when the system is an aspheric surface, the modulation transfer function of the system is 0.6683, which is much higher than that of the system with the spherical surface (0.3653), and the encircled energy is also higher (Fig. 7). Therefore, the three-element combined system is more suitable for achromatic requirements and has a better imaging quality when the aspheric surface is used.ConclusionsIn this paper, the optical system composed of MOD, ROE, and DFL is analyzed based on the third-order aberration theory of Seidel. In the given working band of 400-700 nm, the expression and calculation of the system bending parameters, conjugate parameters, and lens curvature are utilized to simultaneously correct the spherical aberration and coma aberration of the three-element glued refractive-diffractive hybrid achromatic system. The surface shape of the system is analyzed, and the achromatic situation and the imaging quality of the system with the planar, spherical, and aspheric surfaces are compared. It is found that the imaging quality of the system is better, the diffraction energy is more, and the achromatic effect is more obvious when the system is aspherical. The imaging optical system with spherical, aspheric, or free-form surface has a higher design freedom and a stronger aberration correction ability than that with the traditional planar surface. It also undertakes more tasks of balancing aberrations in the system and is easier to achieve the design goal of miniaturization and lightweight of the system. The designed system designed has small size, lightweight, and simple structure, which has broad application prospects in the field of space optics.
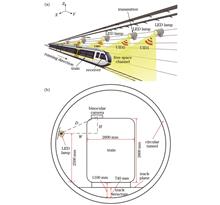
ObjectiveThe communications-based train control (CBTC) systems play a vital role in ensuring the safe and effective operation of urban mass transit, which can further improve headway and reduce the number of wayside equipment. The emergence of vehicle-to-vehicle(V2V) communications in railway signaling industry has made it crucial that metros ensure safe train separation with a moving block, where a train determines its location, direction, and speed by itself. Therefore, identifying the accurate location of trains becomes a tremendous challenge for CBTC using V2V communications. To determine its location on the rails, many devices including tachometers, accelerometers, transponders (or tags), radar, wireless local area network (WLAN), and long-term evolution (LTE) are utilized by a train. There are still some intrinsic drawbacks to train positioning in existing CBTC systems, which are characterized by the low standard of precision, discontinuity, and vulnerability to jamming attacks in wireless networks. In recent years, however, the technology of visible light communication (VLC) has been gaining increasing attention as it has a wide range of application scenarios such as indoor localization, traffic lights management, and sensing, which can provide both illumination and data communications to address the urgent problems of spectrum crunch, wireless jamming and so on. Moreover, the VLC technology has great potential and can also be applied to determine the train location for new CBTC systems via light-emitting diode (LED) lamps, which are usually installed on the tunnel walls of metros. In the present study, the needs of train localization through the combination of VLC and binocular stereo vision are satisfied to achieve autonomous train positioning, particularly in tunnels. Hopefully, the basic strategies and findings obtained can be conducive to autonomous train positioning for CBTC systems adopting V2V communications.MethodsIn the present study, LED lamps installed on the tunnel walls of metros are used as the transmitter of VLC, while the binocular stereo vision system fixed on the top of a cab serves as the receiver of VLC. In this way, the autonomous train positioning in CBTC systems is realized. Firstly, the receiver captures the images of LED lamps and transmits them to the on-board equipment. In light of differences in frequencies from highly flickering LED lamps, a running train can acquire the unique identification (UID) of the corresponding LED lamp in real time and the location of the lamp can be precisely pinpointed in world coordinate system through on-board database. Then, the center coordinates of LED bright spots on the image of LED lamps can be extracted based on the gray weighted centroid algorithm and ordinary least squares as a single feature point for stereo matching to calculate the relative distance between the train and the LED lamp. Next, in terms of the principle of binocular stereo vision, the initial train location can be determined through coordinate conversions. Finally, to obtain the actual conditions of train running, the Wiener filter and inertial measurement unit (IMU) have been adopted to compensate for the train positioning error caused by motion blur of images and mechanical vibration from the receiver respectively, and realize autonomous train positioning at different speeds. In addition, an experimental platform of VLC and binocular stereo vision for autonomous train positioning are established and the experimental results of static and dynamic train positioning are analyzed by MATLAB. The results are combined with the real line date and equipment information in Chengdu Metro Line 1 to demonstrate the feasibility and effectiveness of the proposed method.Results and DiscussionsA series of experiments on static and dynamic train positioning within a range of 20 test points are carried out as well as train running direction. For static train positioning, 90% of train location errors can be controlled within 20 cm and the maximum error is 29.73 cm (Fig. 11). The proposed method shows less deviation from the actual train location in terms of the train positioning results compared with the train positioning method based on VLC and monocular vision, when a train is running at the edge of a positioning unit and far from the LED lamp (Fig. 12). As to dynamic train positioning, the course angle error of the binocular stereo vision system is reduced from 7.5° to 0.5° after the compensation of motion blur using IMU when a train is running at the speed of 20 km/h, and the maximum train location error is decreased from 35.24 cm to 32.09 cm (Fig. 13). Moreover, the maximum train location errors are 32.09 cm, 33.05 cm, 34.25 cm, 34.75 cm and 36.11 cm at the speed of 20 km/h, 40 km/h, 60 km/h, 80 km/h and 100 km/h, respectively (Fig. 14). In addition, 75% of the dynamic train positioning errors are less than 18 cm, 19 cm, 22 cm, 23 cm and 23.5 cm, respectively (Fig. 15), and the maximum time of train positioning is 51.32 ms (Table 2). Overall, the results of static and dynamic train positioning can meet the requirements of the IEEE 1474.1—2004 standard for train positioning.ConclusionsIn the present study, a novel kind of train positioning method, combining VLC and binocular stereo vision, is specifically provided to achieve the autonomous train positioning of CBTC systems in metro tunnels, which can be taken as a supplement to traditional train positioning methods. According to the above empirical study, the maximum errors of static train positioning and dynamic train positioning are 29.73 cm and 36.11 cm and the maximum time of train positioning is 51.32 ms, demonstrating the real train location ultimately. Meanwhile, the standard of train positioning precision has dropped slowly when a train is gradually picking up speed. Additionally, the precision of train positioning can reach the centimeter level in the proposed method, and the maximum error and the maximum time of train positioning are much smaller than ±10 m and 2 s, respectively, which are in line with the strict IEEE 1474.1—2004 standard. This study shows that the proposed method can satisfy the needs of autonomous train positioning in tunnels and provide some alternative approaches to train positioning of CBTC systems with V2V communications.
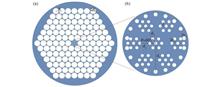
ObjectiveAs an ideal transmission medium of terahertz (THz) wave, THz photonic crystal fiber (THz-PCF) has attracted extensive attention. The structure of THz-PCF is usually composed of periodically arranged air holes whose size is in the same order of the THz wavelength. Therefore, the transmission of THz wave in PCF can be flexibly controlled by adjusting the size and shape of the air hole. However, when the THz wave is transmitted in ordinary PCFs, birefringence caused by stress and other factors is inevitable, which will result in polarization crosstalk, polarization dependent loss, and polarization mode dispersion in THz link, leading to the degraded performance of the entire THz system. High birefringence optical fiber can ensure that the polarization state of the incident THz wave remains unchanged when it is transmitted in the fiber. The birefringence of the THz fiber can be greatly improved by changing the symmetry of the cross-section structure of the fiber, which is of great value for achieving polarization maintaining transmission and polarization manipulation of THz wave in PCFs.MethodsTopas is usually employed as the substrate material of porous core THz-PCF in present study. Firstly, an initial PCF structure is designed. Then, the characteristics of the proposed PCF are numerically analyzed based on the finite difference time domain (FDTD) method. Next, the control variable method is adopted to investigate the polarization characteristics of THz-PCF through the following three ways: optimizing the core structure, adjusting the cladding structure, and changing the parameters of the core and cladding at the same time to obtain the optimal structure. Meanwhile, the crucial performance parameters of PCF are analyzed to evaluate the performance of the designed THz-PCF, which include birefringence, confinement loss, effective absorption loss, bending loss, power fraction, waveguide dispersion, and polarization mode dispersion.Results and DiscussionsAccording to available literature, this paper leverages cyclic olefin copolymer as the substrate and employs the FDTD method to design and analyze a high birefringence THz-PCF based on a porous core structure. The anisotropy and high polarization characteristics of THz-PCF are introduced by changing the arrangement of the air holes in the core area. The specific description is as follows. By adjusting the structural parameters of the fiber core and cladding air holes, the paper designs the porous core high birefringence THz-PCF with Ferris-wheel-like and calculates the birefringence characteristics numerically. The results show that when the Ferris-wheel-like porous core fiber structure parameters are r1=1.7 μm, r2=2.3 μm, d1=27 μm, d2=24 μm, d3=35.5 μm, l=8 μm, Λ=79 μm, and R=38.5 μm (Fig. 2) at f=4 THz, an ultra-high birefringence of 0.1085 (Fig. 3) and an ultra-low confinement loss of 10-16 dB/cm (Fig. 4) are obtained. The porous core PCF structure has achieved an ultra-high birefringence (Fig. 3), low confinement loss (Fig. 4), low bending loss (Fig. 6), and near-zero flattened dispersion (Figs. 8 and 9) in THz technology, which provides important reference value for the design of high birefringence and low loss THz-PCFs in the future.ConclusionsIn this paper, a THz-PCF with Ferris-wheel-like porous core is proposed. The Topas is adopted as the substrate material of the designed PCF. The FDTD method is employed to numerically analyze the birefringence, loss, and dispersion of the proposed optical fiber. After structural optimization, the THz-PCF can provide a birefringence of the magnitude of 10-1 in the 3-6 THz operating frequency band. Ultra-high birefringence of 0.1085, low confinement loss of 10-16 dB/cm, and low bending loss of 2.4×10⁻¹⁴ dB/cm are achieved at 4 THz, which is very competitive even compared with the previous results: the reported PCF does not achieve 10-1 order of magnitude high birefringence and low confinement loss at the same time. Additionally, the proposed THz-PCF exhibits a low and flattened dispersion in the range of 3-5.5 THz, and the dispersion value is within ±0.11 THz-2·cm-1. The study shows that such kind of PCF with high excellent birefringence and low confinement loss can be obtained through the optical fiber structure design, which combines multi-layer cladding and novel Ferris-wheel-like porous core structure. The excellent properties of the proposed THz-PCF will promote the development of THz optical devices and polarization sensing.
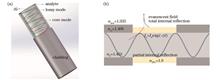
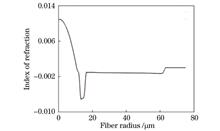
ObjectiveThe detection of the refractive index has important practical significance and application value in national defense, aerospace, industry and agriculture, food safety, and other key fields. The optical-fiber lossy mode resonance (LMR) sensors have been widely used in the design and development of refractive index sensors due to their label-free measurement and high detection sensitivity. In addition, the optical-fiber LMR is different from surface plasma resonance (SPR), which is mainly manifested in the following aspects. The excitation of LMR does not depend on the polarization of light, and the film material is widely available and inexpensive. In addition, the resonance wavelength and sensing sensitivity of LMR can be adjusted by changing the thickness of the sensing film. However, most LMR sensors based on multi-mode optical fiber usually have low detection sensitivity. As a kind of semiconductor metal oxide, TiO2 not only has the basic performance of a semiconductor but also shows the characteristics of a large specific surface area, loose porosity, strong adhesion, and stable chemical properties. Therefore, in this paper, based on the excitation of optical-fiber LMR refractive index sensing with ITO, TiO2 nanoparticles are electrostatically assembled on the ITO film to improve refractive index sensitivity. The promising application of metal oxide nanoparticles in LMR refractive index sensing is further validated.MethodsThe investigation is based on the theory of optical-fiber LMR sensors. The attenuated total reflectance method of the Kretschmann configuration is used to calculate the optical-fiber LMR spectrum. According to the theoretical model of the optical-fiber LMR refractive index sensor, the relationship between ITO thickness and resonance wavelength of LMR sensor is analyzed by numerical calculations. Besides, the theoretical simulations illustrate its feasibility as a refractive index sensor. The ITO film and TiO2 nanoparticles are prepared by magnetron sputtering and electrostatic self-assembly method, respectively. At first, the performance of the optical-fiber LMR refractive index sensor with a single ITO film structure is investigated, and the change in LMR resonance wavelength is observed by dipping the sensor into a glycerol solution with different concentrations. Next, the refractive index sensing performance of the optical-fiber ITO-LMR sensor based on the assisted enhancement of TiO2 nanoparticles is elaborately investigated. By comparing the refractive index sensing performance of the two sensors, the conclusion is drawn.Results and DiscussionsThe designed optical fiber LMR sensor with ITO film and TiO2 nanoparticles exhibits deserved refractive index detection performance. Fig. 6 shows the LMR resonance spectrum of the structure with magnetron-sputtered ITO film on the side wall of the optical fiber. The resonance wavelength appears to be red-shifted as the refractive index of the external analyte to be measured increases. Specifically, as the external refractive index changes from 1.3333 to 1.3840, the sensitivity of the optical-fiber LMR sensor is 407.062 nm/RIU with a fitting coefficient of 0.995. The TiO2/PSS bilayer film is electrostatically self-assembled based on the ITO-LMR sensing probe. The LMR refractive index sensing performance with ITO film and TiO2 nanoparticles is shown in Fig. 7. With the increase in the solution refractive index, its resonance wavelength shifts significantly toward the long wavelength direction. The refractive index sensitivity of the sensor reaches up to 1651.659 nm/RIU. Due to the advantage of the large specific surface area of TiO2 nanoparticles, the sensitivity is improved by a factor of 3.058 compared with the LMR sensor coated with only a single ITO film. The detection resolution of the TiO2-ITO-LMR refractive index sensor is higher than 8.89×10⁻⁴ RIU.ConclusionsIn this paper, an LMR refractive index sensor based on the assisted enhancement of TiO2 nanoparticles is designed. The sensor activates the LMR effect based on the phase matching of the lossy mode wave and the evanescent wave of the multimode fiber to carry out refractive index sensing. The effect of TiO2 nanoparticles on the optical-fiber ITO-LMR sensor is experimentally investigated. The ITO film and TiO2 nanoparticles are plated by magnetron sputtering and electrostatic assembly. The results of the refractive index sensing experiments show that in the refractive index variation range of 1.3333-1.3840, the sensitivity of the TiO2-ITO-LMR sensor can reach 1651.659 nm/RIU due to the advantage of the large specific surface area of TiO2 nanoparticles. For the ITO-LMR refractive index sensor, the sensitivity is improved by 3.058 times. In addition, the TiO2-ITO-LMR sensor has a resolution of more than 8.89×10⁻⁴ RIU for refractive index detection.
ObjectiveWith the rapid development of technologies, such as the Internet and artificial intelligence, there has been an exponential increase in the demand for data from all areas of life. However, the capacity of traditional single-mode fiber (SMF) networks is approaching the Shannon limit. Consequently, several multiplexing technologies, including wavelength division multiplexing (WDM), polarization division multiplexing (PDM), and mode division multiplexing (MDM), have been explored to meet the growing data demand. In MDM, using few-mode fiber (FMF) for long-distance transmission is more cost effective than using multimode fiber (MMF) because of the lower nonlinear impairment. Moreover, MDM introduces severe crosstalk between different modes, which must be compensated for by advanced DSP algorithms on the receiver side. In China, most ongoing studies on MDM transmission employ the intensity modulation direct detection (IMDD) method, which is suitable for only short-distance transmissions. The number of modes that can be effectively exploited is also too small, making it difficult to achieve "ultrahigh-capacity" communication. In this study, we developed a high-capacity long-distance FMF transmission system that combines WDM, PDM, and MDM technologies. Eighty channels that satisfy the ITU-T standard are generated, and 32-GBaud 16QAM signals are transmitted up to 1000-km FMF on dual polarization and two modes (LP11a and LP11b). Multiple input multiple output(MIMO) equalization demultiplexing algorithms based on time domain (TD) and frequency domain (FD) are adopted, which can greatly improve system performance. For a transmission distance of 1000 km, the net data rate reaches 32.768 Tbit/s, which is the highest recorded rate in China.MethodsIn this experiment, we used strong coupling graded-index FMF that can support the transmission of six modes and we chose two degenerate modes, including LP11a and LP11b. At the transmitter side, 80 external cavity lasers generate 1530-1562 nm light waves with a 50-GHz frequency spacing. The digital baseband signal is generated with Matlab and then loaded into an arbitrary waveform generator to modulate the optical carriers through an IQ modulator. Polarization-beam splitters and combiners are used to conduct PDM so that the signal can be divided into two parts with orthogonal polarization of X and Y. After being boosted by an erbium-doped optical fiber amplifier (EDFA), two independent dual polarization signals are modulated into LP11a and LP11b modes through a mode multiplexer and then transmitted over a reel of 50-km FMF. Thereafter, mode demultiplexing is performed so that single-mode EDFAs can compensate for the transmission loss for each mode. Wavelength selective switches (WSS) are employed to solve the problem of the uneven gain of EDFAs. We adopted a loop structure to realize long-distance transmission. Thus, the output of WSS is sent back into the mode multiplexer to perform MDM and 50-km FMF transmission again until the total transmission distance meets our requirement. At the Rx side, the coherent optical receiver conducts homodyne detection on the selected signal after wavelength division demultiplexing. In the offline DSP, the captured electrical signal is mainly processed by dispersion compensation, clock recovery, MIMO equalization demultiplexing based on the least mean square (LMS) algorithm, carrier recovery, detection-directed least mean square algorithm, and, finally, BER calculation. Among them, MIMO-TDLMS and MIMO-FDLMS are the core parts. MIMO equalization creates a filter between each input and output. Since our proposed system uses three multiplexing technologies, every path of the received signal can contain information from other paths due to the crosstalk between different polarizations and modes, which well fits the characteristics of the MIMO model. The coefficients of the filters are trained using the LMS algorithm. For MIMO-FDLMS, fast Fourier transform is applied to the TD signal so that the algorithm can perform block processing in the FD, which is more efficient.Results and DiscussionsFig.5 shows the optical spectrum of the received signal in BTB circumstance. It shows that 80 channels with a 50-GHz frequency spacing were successfully generated, and the optical signal-to-noise ratio (OSNR) difference between the adjacent channels is below 1 dB. The BER performance of the LP11a and LP11b modes under different OSNR values was evaluated, as shown in Fig.6. With an increase in OSNR, the crosstalk between different polarization and modes became the dominant factor of noise, and the performance of our system still differs from that of theoretical AWGN channels. Furthermore, we calculated the BER of the 80 WDM channels after 1000-km FMF transmission, and all of them are below 2×10⁻². Due to the uneven spectrum after several times of loop transmissions and EDFA amplification, the BER of different channels was unstable. Meanwhile, the BER values of different modes in the same channel were slightly different. This is because the refraction indices of LP11a and LP11b are comparable. Finally, Fig. 8 shows the BER performance under different FMF transmission distances. The BER increased with an increase in fiber length. After 500/1000-km FMF transmission, the BER of the LP11a and LP11b modes can meet the 7% HD-FEC threshold of 3.8×10⁻³ and the 25% SD-FEC threshold of 4.2×10⁻², respectively.ConclusionsIn this study, we developed a WDM-PDM-MDM transmission system, in which 32-GBaud 16QAM signals can be transmitted over 1000-km FMF on dual polarization and LP11a and LP11b modes in 80 WDM channels. Using MIMO-TDLMS and MIMO-FDLMS algorithms in the offline DSP, the dispersion effect and the crosstalk between different polarizations and modes can be effectively compensated for. At an FMF transmission distance of 500 km, the BER can meet the 7% HD-FEC threshold of 3.8×10⁻³, and the corresponding net data rate is 32×4×2×2×80/(1+0.07)=38.28 Tbit/s. At an FMF transmission distance of 1000 km, the BER can meet the 25% SD-FEC threshold of 4.2×10⁻², and the corresponding net data rate is 32×4×2×2×80/(1+0.25)=32.768 Tbit/s. This is a record-breaking result in China for both the net data rate and the transmission distance in an FMF MDM system. The proposed system is, thus, a promising candidate for future "ultrahigh-capacity, ultralong-distance" communication.
ObjectiveThe optical fiber interferometer is a very important optical device, which has been widely used in the fields of physics, chemistry, medicine, and biological environment monitoring. By changing the substrate material of the inserted optical fiber, the performance of the Sagnac optical fiber sensor has been effectively improved. However, limited by the inherent characteristics of optical fiber (such as photoelastic effect and photothermal effect), the sensitivity improvement of optical fiber sensors based on Sagnac interference is hindered. Therefore, improving the sensitivity of the Sagnac sensor is of important research significance. The Sagnac sensors with metal-filled photonic crystal fiber (PCF) can obtain higher sensitivity. However, manufacturing metal-filled PCF requires more stringent technology and costs. The manufacturing of functional liquid-filled PCF is simpler than that of metal-filled PCF. At present, most optical fiber sensors are used for single-element detection, which greatly limits the application of optical fiber sensors. In order to realize two-parameter detection in complex environments, a two-parameter optical fiber sensor based on the Sagnac interference principle is designed to detect temperature and strain.MethodsThe polarization-maintaining PCF (PM-PCF) model selected in the experiment is LMA-PM-10. The PM-PCF's core diameter is about 9.9 μm. The diameter of the air hole cladding is about 54.3 μm. The diameter of PM-PCF's cladding is about 235 μm. The PM-PCF has a strain-sensitive material that is the strain-applying part of the PM-PCF. Therefore, strain detection can be effectively realized through the shift of the Sagnac spectrum. Moreover, the material of the fiber itself and the strain-applying part have a good photothermal effect and thermal expansion effect. Therefore, the PM-PCF is also extremely sensitive to ambient temperature. The sensor can be used for temperature detection because the change in the outside temperature will cause an obvious shift in the interference spectrum. The temperature transformation can be calculated by the movement of the interference spectrum. In addition, by using the nitrogen pressurization device, the ethanol solution is filled into the air hole of PM-PCF. By extending the filling time, each air hole of the optical fiber is filled with ethanol. The filling of temperature-sensitive materials can greatly improve the temperature sensitivity of optical fiber sensors, which is the reason for filling ethanol in the PM-PCF. Experiments have proved that the sensing performance of the sensor has been improved.Results and DiscussionsFirst of all, the strain sensitivity of the sensor is tested. Before connecting the optical path, the PM-PCF is welded into the Sagnac ring. The clamp is used to fix the optical fiber in the strain test device. The strain is gradually increased according to the principle of screw micrometer. The strain sensitivity achieves 35.35 pm/μ? in the strain range of 0-900 μ?. During repeated measurements, the sensor shows excellent hysteresis. Then, the temperature sensitivity of the sensor is detected. The whole sensor is placed in the temperature control box for temperature detection. The sensor achieves a temperature-sensing sensitivity of -1.72 nm/℃ within the temperature range of 26-50 ℃ when the PM-PCF is not filled with ethanol. The PM-PCF is placed in a closed air chamber, and each air hole is filled with ethanol by a nitrogen pressurization device. After the temperature detection, the sensor temperature sensitivity reaches -2.66 nm/℃, which is 1.55 times that of the raw PM-PCF. This phenomenon effectively proves the importance of filling ethanol. During repeated temperature detection, the sensor shows excellent hysteresis. The Sagnac interferometric sensor for temperature and strain detection has outstanding stability.ConclusionsIn this paper, an optical fiber sensor based on the Sagnac interference principle is reported, which is used to detect temperature and strain in the environment. In the experiment, the PM-PCF is selected as the sensing unit. First, the PM-PCF without ethanol is fused into the Sagnac interference loop. The sensor relies on the photothermal effect and photoelastic effect of PM-PCF substrate material to achieve a temperature sensing sensitivity of -1.72 nm/℃ within the temperature range of 26-50 ℃ and achieve a strain sensitivity of 35.35 pm/μ? in the strain range of 0-900 μ?, respectively. The sensing performance of the Sagnac interferometer can be enhanced by using the external field's tuning effect of functional materials. In this way, ethanol is filled into the air hole of PM-PCF cladding by a nitrogen pressurization device. The temperature sensitivity is -2.66 nm/℃, which is 1.55 times that of the raw PM-PCF. The Sagnac interferometric sensor for temperature and strain detection has a simple structure and excellent hysteresis, which can be used to improve the sensing sensitivity.
ObjectiveAs high-precision and ultra-precision structural components are widely applied in high-end precision manufacturing, biomedicine, aerospace, and other high-end fields, their quality inspection becomes particularly critical. White light interferometry and confocal microscopy are the most widely employed in micro-nano detection, and the first measurement step is to focus on the surface of the measured sample. As the core of the focusing process, the performance of focusing evaluation functions directly affects the focusing accuracy. Therefore, it is of great theoretical significance and engineering value to study the focusing evaluation algorithm of anti-light intensity, anti-reflectivity unevenness, and high resolution to improve microscopic measurement accuracy. At present, methods for focusing evaluation are mainly image sharpness evaluation algorithms, which can be divided into three categories according to the principle of different algorithms. The first category is based on the gray value of images, which is mainly judged by calculating the gray value or gray gradient of the images. However, in the axial micro-step scanning of microscopic measurement, the gray difference between adjacent images is subtle, which can easily cause misjudgment of the focal plane. The second is the evaluation method based on the machine learning model. This kind of method mainly realizes the ambiguity judgment of images by training the network model. Although better performance in the public dataset can be realized, it is limited by the image type of the training set and network model framework in practical application. The third is the method based on the calculation of image quality, the most representative of which is the double fuzzy theory of images. The first blur is camera defocused blur, and the second is artificially added blur. The reference image is constructed by artificially blurring the image to be detected, and then the difference between the images to be detected and their blurred images are calculated to realize the clarity evaluation of the images to be detected. However, the existing methods are based on specific image boundary or gray distribution under macroscopic measurement conditions, and they are subjective and lack positioning and quantification of axial positions. In microscopic measurement, the surface texture of the tested sample is more complex, and its different and irregular edge directions make the traditional boundary judgment method easy to fail. Additionally, it is more sensitive to illumination intensity changes, uneven illumination distribution, and changes in sample surface reflectivity. Therefore, we propose a microscopic image focusing evaluation method with anti-light intensity, anti-reflectivity unevenness, and sub-micron accuracy.MethodsBased on the principle of imaging technology, we design a microscopic image focusing evaluation method based on double blur. To address the problems in existing methods, we adopt the combination of image spatial domain and image frequency domain information and employ the local variance to calculate the difference between an original image and its blurred image. As a result, the problem that previous focusing evaluation methods are insensitive to illumination intensity changes, uneven illumination distribution, and changes in sample surface reflectivity is solved. With an aim at the selection of artificially blurred standard deviation, the concept of effective standard deviation is proposed, and the range of effective standard deviation is determined through theoretical and experimental analysis. DB-FEM includes the following steps. The first is to obtain the axial scanning image of the microscopic imaging device. In the second step, the obtained axial scanning image is artificially blurred by the Gaussian kernel function with a known standard deviation. The third step is to calculate the difference between the spatial edge information and the Haar wavelet frequency domain information of the image and its blurred image by local variance. The difference degree includes spatial edge, low-frequency texture, and high-frequency edge. The fourth step is to multiply all the differences to get the focus evaluation curve based on the difference and complete the focus evaluation.Results and DiscussionsThe experimental results show that the proposed microscopic focusing evaluation algorithm based on double blur has an excellent focusing evaluation ability. At the focal plane of ±0.5 μm, the DB-FEM′ axial resolution is better than 0.3 μm. The axial resolution of DB-FEM is better than 0.2 μm during leaving the focal plane ±0.5 μm (Fig. 10). In the experiment of illumination amplitude variation, compared with other focusing evaluation methods, the DB-FEM has a performance improvement of more than three orders of magnitude in clarity ratio, an improvement of one to two orders of magnitude in peak sensitivity, and certain multiple improvements in steepness (Fig. 11 and Table 1). In the uneven reflectivity experiment, the sensitivity ratio of DB-FEM is at least three orders of magnitude higher than that of Sobel, SML, SMD, SMD2, DCT, Robert, Energy, and Brenner, and the peak sensitivity value is 2.18, 1.90, 2.28, 2.27, 1.88, 2.17, 2.15, and 1.71 higher than that of Sobel, SML, SMD, SMD2, DCT, Robert, Energy, and Brenner, respectively. The steepness values are 0.29, 0.34, 0.35, and 0.37 higher than that of the SML, DCT, Energy, and Brenner respectively [Fig. 14(a), Table 2]. In the double focal plane experiment, DB-FEM has better axial positioning ability and convergence than other focusing evaluation algorithms [Fig. 14(b)].ConclusionsIn this paper, a double blur micro-images focusing evaluation method (DB-FEM) based on double blur theory is proposed, which is resistant to light intensity, uneven reflectance, and submicron precision. The concept of artificially fuzzy effective standard deviation is studied, and a better value is found through the theory and experiments. The experimental results of plane mirrors and piezoelectric ceramics show that the axial resolution of this method is better than 0.3 μm under the condition of 20×/0.65 objective lens. The sharpness ratio, peak sensitivity, and steepness of the focusing evaluation can be increased to vary degrees on the traditional focusing evaluation method under different illumination amplitude conditions and uneven reflectivity conditions. Under the same curve threshold, the full width at half maximum of the proposed method is less than that of the compared focus evaluation method. In addition, in the complex focusing environment with double focusing surfaces, DB-FEM can well determine the focusing positions of two different indications, which plays a significant role in advancing the development of high-precision microscopic measurement systems.
ObjectiveThe photoelectric early warning system is equipped with infrared detectors of distinct wavebands, and with high detection sensitivity to the target temperature, it realizes real-time monitoring and early warning of suspicious targets in the air by means of continuous weekly scanning. The technology of image stitching is required for panoramic video imaging in photoelectric early warning systems, and image registration is the first step to determine the effect of panoramic imaging. Currently, the mainstream registration methods in the field of image stitching are based on template matching and feature matching. Nonetheless, when mainstream registration methods are applied to the panoramic image stitching of circumferential-scanning photoelectric early warning systems, numerous issues arise. The method based on template matching predominantly carries out registration according to the gray correlation of the image in the overlapping area. It is prone to the issue of incorrect matching when applied to the real-time stitching of panoramic videos, and the non-uniqueness of the registration between frames easily causes instability and discontinuity in panoramic video imaging. The method based on feature matching has high registration accuracy, and yet it is highly dependent on the extraction of the feature points of images. Nevertheless, the early warning areas are mostly simple backgrounds such as the sky and Gobi. The overlapping area is small, and the image features are not obvious, which easily leads to registration failure. Additionally, such algorithms have high computational complexity and generally cannot meet the real-time requirement. In view of the above shortcomings, we propose a new real-time stitching method for panoramic videos on the basis of a three-dimensional spherical model. This method is feasible, with a good panoramic stitching effect, and can effectively compensate for the deficiencies in mainstream registration methods. It features good applicability and real-time performance even for panoramic stitching of areas with inconspicuous features such as the sky.MethodsIn this study, a real-time stitching method for panoramic videos based on a three-dimensional spherical model is proposed. In this method, the registration problem of a two-dimensional plane image is converted into an intersection issue of a three-dimensional space plane, and the registration problem of an early warning image is solved only by computation. In the first place, the panoramic reconstruction of three-dimensional space is carried out according to the operation pattern of the circumferential-scanning photoelectric early warning system, and the three-dimensional spherical model is constructed. By modeling, we locate the spatial position of the pixels of the images collected by the detector at different pitch and azimuth angles. Subsequently, we search the optimal registration line of the overlapping field of view in the three-dimensional space of distinct pitch angles predicated on the basis of the three-dimensional spherical model and accordingly deduce the registration formula of the overlapping area of the early warning image. Finally, the seamless stitching of panoramic images is realized by a line-by-line weighted fusion algorithm and image straightening method.Results and DiscussionsIn this paper, the proposed method is compared with five mainstream registration methods in four scenarios at pitch angles of 0°, 5°, and 20°. In terms of registration accuracy, the experimental results demonstrate that template matching-based methods (NCC and DDIS) have the risk of wrong matching, which can cause image information loss, as displayed in Figs. 8(b) and 9(d). The non-uniqueness of matching between adjacent frames is not conducive to the continuity and stability of panoramic video imaging. The methods based on feature matching (PSO-SIFT, CAO-C2F, and MS-HLMO) are highly dependent on the extraction of matching pairs; incorrect matching pairs may result in stitching failure, as depicted in Figs. 7(g), 7(h), 8(g), 8(h), 9(g), 9(h), 10(g), and 10(h), or dislocation, as illustrated in Figs. 8(f) and 9(f). Therefore, they are not suitable for the real-time panoramic video stitching described in this paper, but the proposed method is feasible. Regardless of the complex background or the single wall background of the early warning image, it displays high registration accuracy at the stitching point and can achieve the seamless stitching of panoramic images, as illustrated in Figs. 7(i), 8(i), 9(i), and 10(i). As for algorithm complexity, MS-HLMO and PSO-SIFT have a long running time and high computational complexity, while the running time of CAO-C2F and DDIS is normal. NCC and the proposed method have a shorter running time, which can meet the real-time requirements of panoramic video stitching. In conclusion, the proposed method effectively compensates for the drawbacks of mainstream registration methods and solves the registration problem of early warning images only by computation. It maintains better registration accuracy and stitching quality and has greater stability, which is of great practical value for panoramic stitching of photoelectric early warning systems.ConclusionsA real-time stitching method of panoramic videos on the basis of a three-dimensional spherical model is proposed to solve the issue of the limited applicability of mainstream registration methods in panoramic image stitching of circumferential-scanning photoelectric early warning systems. The registration problem of a two-dimensional plane image is converted into an intersection problem of a three-dimensional space plane by this method. Moreover, a three-dimensional spherical model is constructed according to the imaging characteristics and working pattern of the circumferential-scanning photoelectric early warning system. Modeling yields the registration formula of the early warning system and enables the seamless stitching of panoramic images. In comparison with the registration results of five mainstream registration methods at pitch angles of 0°, 5°, and 20°, the experimental results demonstrate that the proposed method has great advantages in registration accuracy, stitching quality, and scene applicability. It not only has better imaging quality but also fully guarantees the continuity and stability of panoramic video imaging. Additionally, the primary factors influencing the registration performance of the proposed method are thoroughly analyzed. It is fully proved that the accuracy of the modeling parameters is a prerequisite to ensure the registration effectiveness of the proposed method. The proposed method has been successfully applied in the infrared search system. In the future, it is anticipated to be widely utilized in the security monitoring of borders, cities, islands, and other vital areas.
ObjectiveThe sparse aperture optical system employs multiple discrete sub-apertures to replace the full aperture and achieves the resolution equivalent to that of the full aperture optical system while reducing the volume, quality, and costs. The sub-aperture's wavefront aberrations of the sparse aperture optical system exert impacts on the imaging performance of the whole system. In most studies, the system's field of view is not taken into account during the analysis of the imaging performance and sub-apertures' wavefronts of the sparse aperture optical system. Starting from the generalized pupil function, this paper develops the sparse aperture imaging model considering the system's field of view, thereby providing a theoretical basis for predicting the imaging performance and image restoration of the sparse aperture optical system under different fields of view.MethodsThe generalized pupil function of the sparse aperture optical system considering the field of view is derived on the theoretical basis of double Zernike polynomials (DZPs). The modulation transfer function (MTF) of the system is obtained by the Fourier transform. The Golay3 sparse aperture imaging system designed by the ZEMAX optical software is taken as an example. According to the design results, the coefficients of double Zernike polynomials are fitted. The theoretical calculation results and optical design results are compared to verify the sparse aperture imaging theory considering the field of view. The Wiener filter is constructed according to the optical transfer function (OTF) for image restoration to improve the imaging quality of the system under different fields of view.Results and DiscussionsAccording to the theoretical model, the results show that when the field of view is 0°, the imaging of the sparse aperture optical system approaches the diffraction limit as shown in Fig. 3(a). Figs. 3(b)-(e) indicate that under the same field of view, the main lobe and side lobe of MTFs decrease rapidly, and the main lobe shows different divergent directions corresponding to the directions of the incident light. As the field of view rises, the main lobe of MTFs further narrows, and the imaging performance of the optical system decreases significantly. MTFs calculated by DZPs are similar to those obtained by ZEMAX software.The contrasts of each line pair in the image simulated by the sparse aperture optical system are calculated under different fields of view. The images are processed by the Wiener filter, and the contrast curves are drawn, as shown in Figs. 9 (a)-(d). The figures demonstrate that the image contrasts of each field of view in horizontal and vertical directions can be greatly improved by the Wiener filter. Under the same field of view and different directions, the restored image has different contrasts in the horizontal and vertical directions. As shown in Fig. 9(b), when the field of view is (0.05°, 0°), the contrast ranges in the horizontal and vertical directions are 0.84-0.99 and 0.62-0.99, respectively. In Fig. 9(c), when the field of view is (0°, 0.05°), the contrast ranges in the horizontal and vertical directions are 0.44-0.84 and 0.89-0.99, respectively. As the field of view further increases, the contrasts of the image processed by the Wiener filter gradually decrease. In Fig. 9(d), when the field of view is (0.1°, 0°), the contrast range in the vertical direction of the image before and after restoration is 0.13-0.26 and 0.30-0.43, respectively.ConclusionsThe sub-aperture's wavefront of the sparse aperture optical system under a non-zero field of view is represented by the DZP. When the generalized pupil function is constructed, the MTFs of the system under different fields of view are calculated by the Fourier transform, and the optical design of the system is carried out by ZEMAX software. Upon the fitting of the DZPs, the calculated MTFs of the system are proven to be consistent with those of the ZEMAX software, which verifies the method of utilizing DZPs to describe the wavefront of the sparse aperture imaging system under different fields of view. The Wiener filter related to the field of view is constructed on the basis of the OTF of the optical system. The image restoration using the Wiener filter effectively improves the imaging quality of the sparse aperture optical system under different fields of view.
ObjectiveAutomotive intelligence is an unstoppable process, and as a key display system in the intelligent cockpit, augmented reality head-up display (AR-HUD) is becoming more and more important. AR-HUD presents the vehicle's sensor information, driving speed information, navigation information, and other enhanced image information integrated with the real environment to the driver, thus improving the driving experience and safety. Large field of view and eye box are very important for AR-HUD. However, for an AR-HUD system based on traditional geometric imaging methods, AR-HUD systems with a large field of view and large eye box require a larger-scale volume of the optical system, which is determined by the Rach invariant of the imaging system. The only display method that can break the limitation of Rach invariant is optical waveguide display technology, including relief grating optical waveguide, geometric optical waveguide, and volume holographic optical waveguide. The relief grating optical waveguide has high production cost and is difficult to be used for large-scale volume optical waveguide displays, while the geometric optical waveguide has low production efficiency and is not suitable for large-scale volume optical waveguide displays. Volume holographic optical waveguides are manufactured by laser exposure, which has the potential advantage to realize the display of large-scale volume waveguides. However, the preparation of traditional volume holographic optical waveguides requires the use of coupling prisms. Filling refractive index matching solution between the holographic photosensitive material and the coupling prisms will lead to troublesome manufacturing problems and is not conducive to automatic manufacturing.MethodsIn this paper, a complete theoretical derivation method of exposure volume holographic grating under the condition of non-total reflection is realized. Starting from the exposure parameters of holographic optical waveguides, this paper gives the parameter design method of large-scale volume holographic optical waveguide exposure under non-total reflection conditions based on grating degeneracy theory in the vector sphere. It is concluded that the transmitted-volume holographic grating and the transition grating used for two-dimensional pupil expansion are not valid to be exposed under the condition of non-total reflection, and the reflective volume holographic grating waveguides can only be manufactured under the condition of non-total reflection. Based on the theoretical derivation, a fully automatic splicing and exposure system of volume holographic optical waveguides is designed and built, which successfully realizes the manufacturing of large-scale volume holographic optical waveguides.Results and DiscussionsBased on the exposure angle parameters obtained by theoretical calculation, a large-scale volume holographic optical waveguide splicing exposure system is built, and a large-scale volume holographic optical waveguide with a size of 130 mm×270 mm is fabricated through 18 splicing. The projector is used as the image source for display, and the AR display results are obtained. Although we realize monochrome display, the exposure angle parameters are wavelength independent, which means that this set of parameters can be used to make three primary color waveguides using three color lasers for color display. In addition, a two-dimensional pupil expansion waveguide can be composed of two one-dimensional pupil expansion waveguides, so the method in this paper can be applied to the development of a two-dimensional pupil expansion waveguide for AR-HUD applications.ConclusionsStarting from the exposure parameters of holographic optical waveguides, this paper gives the parameter design method of large-scale volume holographic optical waveguide exposure under non-total reflection conditions based on grating degeneracy theory in the vector sphere. A large-scale volume holographic optical waveguide automatic exposure system is designed and built. The large-scale volume holographic optical waveguide with a size of 130 mm×270 mm is demonstrated, and the AR display results are obtained. The successful breakthrough of this technology has laid a solid foundation for the mass production and wide application of large-scale volume holographic optical waveguide AR-HUD.
ObjectiveThe limited depth of field (DOF) is a common problem in imaging. It is typically desired to obtain images with a large DOF, and many methods have been reported in this regard, for example, wavefront coding, optical toe cutting, and focus scanning. However, changes in the aperture of a lens degrade image quality and increase the exposure time, and movements of detectors reduce the sharpness of the obtained images. Extended DOF images can also be realized by wavelet, contour wave, and focus area fusions of images captured with different focal lengths. The focus change is typically realized by the position changes of lenses. However, mechanical movements may shorten the life cycle and increase the volume and weight of an imaging system. Bai et al. found that a liquid crystal (LC) lens preserves their properties during state switching, which has been used to acquire video frames during the switching process to obtain high-quality extended DOF images. In this process, images can be easily acquired, but it takes a long time to calculate the DOF. Each frame in a video has a corresponding DOF that overlaps with other DOFs of the same video. It is not necessary to use all images for fusion, providing us with an idea to improve image acquisition efficiency by extending the DOF. In this study, aiming at the disadvantage that the existing method of acquiring extended DOF images by LC lenses requires a long time, a method for improving the efficiency of extended DOF imaging using the focus tuning property of LC lenses is proposed, which can significantly reduce the image acquiring time of extended DOF imaging.MethodsThe imaging system consists of a polarizer, an LC lens, a lens module, and a CMOS sensor. The DOF of the system can be calculated using the focal length of the main lens, the focal length of the LC lens, the F-number of the lens, the allowable speckle radius, and the object distance. First, the structure of the LC lens used in our experiment is described. The preservation of the lens property of the LC lens when it is driven to switch between positive and negative states is used to acquire images for the calculation. The voltage of the LC lens was scanned and measured. The power of the Lens is a function of time, and then, the relationship between the focus position of the system, DOF, and calculation time can be obtained. Then, by considering the DOF of each image, the DOF corresponding to each selected frame does not overlap. The number of images used can be significantly reduced, and the image processing time can be shortened. In this study, the complex value wavelet extended DOF fusion method is used to adaptively map the input image stack from color scalar and variance to a single-channel grayscale image, ensuring that channels with more details contribute more to the grayscale image. Finally, the difference between the images obtained using the proposed method and existing methods is compared in terms of the average gradient (AG), and the efficiency improvement performance of our algorithm is analyzed.Results and DiscussionsThe camera module used in this study is Ming Mei MD50-T3, and the acquisition resolution is 1920×1080. 77 images were acquired during the state switching of the LC lens. Fig.10 shows the images focused on each object. With the proposed method, the number of images required for expanding the DOF is 24. Fig.11 shows the expanded DOF images fused with all 77 images and 24 images. There are a few subjective differences between the two image types. AG is used to evaluate the fusion effect of expanded DOF images. As shown in Fig.12, the same region of interest was selected for the fusion of the two image types and the corresponding source images. Image sharpness is sacrificed in the expanded DOF images obtained by fusing all images, and the AG of S1 degrades by approximately 2%-6.5% relative to the source image. Although the clarity of the fusion image is reduced, the degree of degradation is acceptable compared with its significant advantage of DOF, and there is no obvious ambiguity phenomenon compared with the source image. The AG difference between S1 and S2 is mostly between 1% and 2%, which can be ignored. S1 and S2 can be thought to be equivalent to the visual effect. Image S2, acquired by the fusion of the 24 selected images, achieves the same effect as the fusion of the 77 images. In this experiment, the number of images used for fusion is reduced to 31.2% of the original method, and the calculation time is reduced to 34.38% of the original method. This significantly improves the efficiency of image fusion and reduces the computation time.ConclusionsA method of extending the DOF of images is proposed based on an LC lens. The preservation of the lens property of the LC lens when it is driven to switch between positive and negative states is used to acquire images for computation. The number of images used is significantly reduced by considering the DOF of each image, which shortens the image calculation time. Compared with existing DOF fusion methods based on LC lenses, the number of images used in this experiment is reduced to 31.2%, the calculation time is reduced to 34.38%, and the fusion efficiency is significantly improved. According to the experimental results in both subjective and objective evaluations, the extended DOF images have high quality.
ObjectiveViscosity and interfacial tension of fluid are key thermophysical properties, which influence the flow, as well as heat and mass transfer of fluid, and they are crucial parameters for studying and controlling multidisciplinary processes in the field of energy, chemistry, and life sciences. The surface light scattering (SLS) method can accurately access the viscosity and interfacial tension of Newtonian fluid in the full viscosity range. It has been rigorously supported by the theory and confirmed by experiments. Since the theory is developed in the frequency domain, it is necessary to convert the collected correlation data concerning the scattered light intensity from the time domain to the frequency domain by fast Fourier transform, and therefore a high signal-to-noise ratio of the time-domain data is crucial. For the sensing interfacial properties of fluid by the SLS method, it is necessary to guarantee both measurement accuracy and speed. In order to achieve the target, it is crucial to apply a small scattering angle and then correct the instrumental broadening effect. We thus develop an algorithm for the correction of the instrumental broadening effect in the frequency domain with an assumption of Gaussian distribution broadening instrumental function. We also check the theory with a low-viscosity refrigerant R1336mzz(Z) and high-viscosity fluid ethyl myristate with SLS apparatus at the small scattering angle. This paper aims to reduce the single-point measurement time of viscosity and interfacial tension of fluid by the SLS method to 2-5 minutes and will promote the further development of SLS sensors.MethodsThe frequency-domain data evaluation scheme of SLS is addressed in this paper. Under the assumption of a Gaussian intensity distribution of the laser beam, a modified frequency-domain model is established by considering the instrument broadening effect at the small scattering angle as well as the fluctuation-dissipation theory of capillary waves in the critical damping range. The spectrum model considers a series of collected wave vectors around the pre-defined q0. Firstly, the intensity correlation data in the time domain at the specific q0 are obtained by the SLS apparatus, and the zero-channel data are added by evaluating the fitted normalized intensity correlation function at τ=0, and then the whole data are folded. The repeated data at the last channel are deleted, and a Fourier transform is applied to generate the frequency-domain data for subsequent fitting of the regression model. For the fitting process, an appropriate discrete component number d and integral interval variable n should be considered to represent the real wave vector distribution. Subsequently, the discrete spectrum model is fitted to the spectrum data, and the viscosity and interfacial tension are accessed with other thermophysical properties in the model as input data. In addition, the algorithm that considers multiple wave numbers simultaneously as well as the instrumental broadening effect is developed and manifests excellent performance.Results and DiscussionsSince the small angle measurement scheme is adopted in this paper, the signal-to-noise ratio is greatly improved, and the measurement time is significantly reduced to 2-5 minutes (Fig. 2). In view of the instrument broadening effect at small angles, the weighted spectrum model [Eq. (11)] with Gaussian instrumental function is adopted. By collecting the thermophysical properties of the reference fluid R1336mzz(Z) at a temperature of T=373.05 K and incident angle Θi of 1.0-3.2°, the discrete component number d, integral interval variable n, and mean broadening constant Δq are determined to be 10, 5, and (4507.46±223.34) m-1, respectively (Fig. 5). The low-viscosity refrigerant R1336mzz(Z) and the high-viscosity ethyl myristate are used as two reference fluids to verify the correctness of the Gaussian modified spectrum model in two typical cases, where the capillary waves evolve as oscillatory damped modes far away from the critical oscillation point (Y'?1) and purely damped modes in the critical oscillation region (Y'→1), respectively. For low viscosity cases with Y'?1 (Fig. 6), the interfacial tension and viscosity in both the time domain and frequency domain agree well for both large and small scattering angles after the instrumental broadening correction. For high viscosity cases with Y'→1 (Fig. 7), the viscosity data obtained by the frequency-domain method considering the dissipation effect in the bulk phases underneath surface waves are sufficiently larger compared with those obtained by the time-domain based method, especially close to the near-critical oscillation region. However, the data obtained by the frequency-domain approach are in good agreement with the literature values, and the instrumental broadening correction has no influence since the frequency ωq of surface waves tends to be zero at this time, and the spectrum broadening ΔωI is negligible as shown in Eq. (7).ConclusionsTo improve the accuracy and speed of SLS measurement, we have applied small scattering angles and modified the line-broadening effect simultaneously. An algorithm is theoretically developed for correcting the instrumental broadening effect in the frequency domain with the assumption of Gaussian distribution of scattering light. With the reference fluids, the integral interval variable n and discrete component number d are obtained to be 5 and 10 to represent the distribution of the wave vectors, and the mean broadening constant Δq is determined to be (4507.46 ± 223.34) m-1 for the present SLS apparatus. We also check the theory with a low-viscosity refrigerant R1336mzz(Z) and high-viscosity fluid ethyl myristate with SLS apparatus, and the results show that the measuring speed is improved, and only 2-5 minutes for a single measurement point are required for the same accuracy as the large scattering angle scheme. This paper will facilitate the further development of SLS sensors and other applications in connection with complex interfacial property measurement.
ObjectiveThree-dimensional (3D) laser Doppler micro-vibration measurement technology is widely applied in the research on dynamic characteristics of microstructures. Its two off-axis optical paths are employed to receive signal light containing in-plane vibration information. The optical fiber coupling efficiency in optical paths will directly affect the vibration measurement accuracy of the system. At present, the factors affecting the coupling efficiency of optical fiber mainly include optical system aberration, atmospheric turbulence, amplitude distribution type of signal light and local light, and optical system parameters. The effect of gravity, temperature, or mechanical deformation of optical elements during installation on the coupling efficiency is not considered. In addition, most of the current research focuses on one-dimensional laser Doppler detection system, and there is a lack of research on 3D laser Doppler micro-vibration measurement system, especially the off-axis optical path. To this end, based on the diffraction propagation theory and the fiber coupling principle, the optical transmission and coupling model of the off-axis signal receiving optical path in the 3D micro-vibration measurement system is built in this paper. The mechanical deformation of typical optical components in the system is analyzed, and the influence of these mechanical deformations on the fiber coupling efficiency is studied. In addition, the maximum tolerances of different mechanical deformations are given. The research is of guiding significance for the design and installation of 3D laser Doppler micro-vibration measurement system.MethodsThe detection optical path of the 3D micro-vibration measurement system includes the main axis optical path and off-axis optical path. The main axis optical path is overlapped with the z axis. Its function is to incident the laser onto the object to be measured and receive the reflected signal light containing the vibration component information of the object in the z direction. The two off-axis optical paths are in the y-z plane and the x-z plane respectively, and the angle between them and the main axis optical path is 40°. They are employed to receive the reflected signal light containing the information of the vibration component of the object in the x and y directions. The object plane is inclined to the off-axis coupling lens plane, so the diffraction propagation between the two inclined planes needs to be considered. In this paper, the optical transmission model of the off-axis signal is built. Firstly, the optical field of the original object plane signal is projected onto the reference plane parallel to the coupling lens plane by the frequency domain coordinate rotation transformation method. Secondly, the optical field distribution of the reference surface is propagated to the coupling lens plane through diffraction, and then to the fiber plane through the phase modulation of the coupling lens. Subsequently, the optical field distribution on the fiber plane can be obtained. Finally, the ideal fiber coupling efficiency can be calculated by the mode field matching method combined with the mode field distribution of single-mode fiber. The relationship between different mechanical deformations and the coupling efficiency of optical fiber is obtained by analyzing the change of parameters in the coupling model of off-axis signal caused by different mechanical deformations.Results and DiscussionsThe relationship between mechanical deformation and fiber coupling efficiency is obtained by the coupling model of off-axis signal optical transmission. Firstly, the relationship between the eccentricity of the coupling lens and the coupling efficiency is studied (Fig. 4). When the coupling efficiency is better than 40%, the maximum allowable range of the offset is about ±1.5 μm. When the beam passes through the tilted coupling lens, the wavefront changes caused by the tilt of the lens near the front and rear surfaces cancel each other out. Therefore, the tilt of the coupling lens exerts no effect on the coupling efficiency if the aberration of the coupling lens is ignored. Next, the influence of the fiber misalignment and the fiber misalignment angle on fiber coupling efficiency is studied. The fiber coupling efficiency is more sensitive to the optical fiber misalignment in the x-y direction [Fig. 6(a)] and less sensitive to the optical fiber misalignment in the z direction [Fig. 6(b)], and the change with the optical fiber misalignment angle is less obvious (Fig. 8). In addition, the out-of-plane vibration caused by the object under test will also affect the fiber coupling efficiency of the off-axis optical path (Fig. 10). When the out-of-plane vibration displacement is within the range of ±3 μm, the coupling efficiency slowly decreases from 76.5% to about 60.0%, which is acceptable in the actual utilization of the system.ConclusionsA coupling model of optical transmission and transmission of off-axis signals in a 3D laser Doppler micro-vibration measurement system is built. The effect of mechanical deformation on the optical coupling efficiency of off-axis signals in the system is further studied. The simulation results show that the off-axis optical coupling efficiency is sensitive to the coupling lens offset and the optical fiber misalignment. Under the micron displacement error, the off-axis coupling efficiency decreases sharply. Therefore, the two mechanical errors should be avoided first during the system design. The optical coupling efficiency of the off-axis signal is less sensitive to the defocus of fiber and the fiber misalignment angle. When the actual system is adopted, if the out-of-plane vibration range of the object to be measured is ±3 μm, the coupling efficiency of the off-axis signal light slowly decreases from 76.5% to about 60.0%, which has little influence on the system. When the aberration of the coupling lens is ignored, the coupling efficiency is not affected by the coupling lens tilt. This study is of guiding significance for the design of off-axis detection optical path of 3D laser Doppler micro-vibration measurement system. The diffraction propagation calculation and the construction and analysis of the coupling model can be further extended to other single-mode fiber imaging systems.
ObjectiveBiodiesel is a type of renewable fuel designed to mimic the properties and performance of conventional diesel. Thus, biodiesel can be used to partly replace conventional diesel without modification to the existing combustion devices. At present, biodiesel is widely used as a transportation fuel mostly by blending with fossil diesel. However, due to the diversity of feedstock used in biodiesel production, the physico-chemical properties of biodiesel may vary, which results in unexpected emissions and combustion performance. Driven by increasingly stringent environmental regulations, the research on particulate matter emissions from the combustion of biodiesel and its blends has attracted much attention. In the present work, the soot emission characteristics of different biodiesels produced from vegetable oils and animal fats are investigated. The chemical composition of the biodiesel is characterized before the biodiesel is burnt in a well-controlled flame environment, so as to examine the soot characteristics. In this study, we apply the laser-induced incandescence (LII) method calibrated by the extinction method to quantify the soot volume fraction produced by the neat oxygenated biodiesel and the blends and then assess the effect of the fuel chemistry on soot formation. Subsequently, the morphology and particle size of soot particulate matters produced from the fuels are compared.MethodsAn open pool flame combustion device is utilized to establish the laminar pool flame of the biodiesel and blends. The crucible used has a diameter and depth of 20 mm and a wall thickness of 2.5 mm. A co-flow of air is supplied at a constant speed of 18.2 cm/s to shroud the pool flame from air entrainment. At the bottom of the crucible, a ceramic heating plate is installed to maintain a constant heat supply to the liquid fuel and a constant evaporation rate. The fuel crucible is connected to a fuel tank to replenish the fuel, which thus enables the fuel to stay at a fixed level from the crucible rim and not be unaffected by the fuel consumption rate. In order to measure the soot volume fraction, the non-intrusive laser diagnostic method of planar two-dimensional (2D) LII is employed. The measured LII signal is quantitatively calibrated via absorption, and signal trapping is corrected. The dependence of the LII signal on the energy intensity per unit area of the laser sheet is also examined. The peak laser fluence (about 0.16 J/cm2) is used to conduct the LII measurement because the LII signal is less sensitive to the local laser energy fluctuations. The soot produced from the flames is collected using the thermophoretic deposition method. A quartz plate cooled to 0 ℃ is placed in the flames to collect the soot. The soot's morphology and size are examined via a scanning electron microscope. Five different types of biodiesel, produced from palm, waste cooking oil, duck fat, goose fat, and rice bran, respectively, are tested and compared against the baseline diesel.Results and DiscussionsImages of the pool flames show that the flame height decreases with the increase in biodiesel blends. The diesel pool flame appears to be the sootiest, but the tendency decreases with the increase in biodiesel fraction owing to the oxygen molecules assisting in soot oxidation. This implies that biodiesel, regardless of the feedstock type, is effective in suppressing the formation of soot. From the LII result, the peak value of the soot volume fraction of pure oxygenated biofuel is 7.1%-30.5% lower than that of conventional diesel. The soot formation decreases with the increase in the biodiesel blending ratio, which is similar to the trend exhibited by biodiesel/diesel blends. Oxygenated fuels with a high degree of unsaturation level tend to emit a higher amount of soot. Palm and rice bran biodiesels with the highest degree of unsaturation among all the biodiesels tend to emit a large amount of soot due to the presence of the double bond promoting the formation of soot. On the basis of Roper's model, the predicted diffusion flame height decreases with the diffusion flame temperature, with palm and duck biodiesel producing the tallest flames among all fuels. The soot particle morphology of the biodiesel and diesel is similar, which is spherical and clustered. Overall, the particle size of biodiesel is relatively 9.5%-41.3% smaller than that of traditional diesel. The soot particle size produced by highly unsaturated biodiesel is relatively larger in spite of lower particle number density.ConclusionsIn the present work, the soot volume fraction produced from five types of biodiesel, biodiesel blends, and conventional diesel is measured by using the LII technique calibrated by the extinction method. The pool flame height is not visibly different among the tested neat biodiesels, but the flame appearance varies with different biodiesel blend fractions in the diesel. The flame height reduces with the increase in biodiesel fraction, and the soot emission is reduced. The LII measurement shows that biodiesel with a higher degree of unsaturation is more prone to emit a large amount of soot. The emission of soot decreases linearly with the increase in biodiesel fraction in the diesel. The peak value of the soot volume fraction of the neat oxygenated biodiesel is 7.1-30.5% lower than that of the conventional diesel. Oxygenated fuels with a higher degree of unsaturation are inclined to emit more soot, which can be explained by the fact that unsaturated C-C double bond is more prone to generate acetylene or benzene during the oxidation process and thus provides precursors for the formation of soot. In general, biodiesel produces soot size that is about 9.5-41.3% smaller than that of diesel. The generated soot is clustered and spherical. Biodiesel with a higher degree of unsaturation tends to produce more fuels in spite of a lower particle number density.
ObjectiveAs optical systems become increasingly complex, miniaturized, and integrated, complex surface micro-lenses have been widely used in lighting, imaging, and other fields. Freeform micro-lens measurement is beneficial to the evaluation and processing of high-precision micro-lenses. However, the micro-lens has front and rear surfaces, and the large dynamic range characteristics of the surfaces and the requirement for high-precision inspection limit the versatility and efficiency of the existing micro-lens measurement techniques. Since the two surfaces of the micro-lens on freeform surfaces fail to be simultaneously measured with high accuracy during the detection, we propose a method based on deflectometry to solve the above problem.MethodsIn order to address the problem that the front and rear surfaces of the micro-lens cannot be measured simultaneously with high accuracy, a numerical iterative optimization algorithm for the simultaneous double-surface reconstruction of the micro-lens based on the high-precision transmission wavefront by deflectometry has been proposed. First, it is necessary to obtain the high-precision transmission wavefront aberration of the micro-lens to get the correspondence between the transmission aberration and the front and rear surfaces of the micro-lens under test. Then, wavefront aberrations with micro-lens surface information are obtained by tracing the ideal model of the measurement system through ray. After that, with the minimum wavefront aberration as the objective function, the numerical iterative optimization is performed with the two surfaces to be measured as the optimization variables to achieve the high-precision simultaneous reconstruction of the front and rear surfaces of the micro-lens. In addition, in order to solve the problem that the front and rear surfaces affect each other during the solution process, the error of each surface of the micro-lens under test is measured by changing the position of the tested element in the experiment and measuring the same tested element several times, so as to increase the number of effective equations in the optimization process. The flow chart of the surfaces of the micro-lens testing is given in Fig. 2.Results and DiscussionsIn this paper, the proposed surface measurement method is simulated and experimentally verified. Experimental validation is carried out by testing a convex lens with an aperture of 6 mm through the Zygo interferometer, and the results are similar to the root-mean-square (RMS) errors of less than dozens of nanometers. In the simulation validation section, we design a freeform micro-lens with a diameter of 1 mm as the element to be tested, and the freeform surface is characterized by 37 coefficients of Zernike polynomial. According to the structure of the freeform micro-lens measurement system shown in Fig. 1, the corresponding ray tracing model of the inverse optical path is established in the ray tracing software. The ideal point light source is replaced by the pinhole CCD camera, and the imaging plane is replaced by the projection screen as shown in Fig. 3. The peak-to-valley (PV) values are 92.646 μm and 90.834 μm, respectively, as shown in Fig. 4(e) and Fig. 4(f) of the surfaces set on the front and rear surfaces. The measured freeform micro-lens is placed in four different positions, including the initial position [Fig. 4(a)], position after rotation of 10° around the x-axis [Fig. 4(b)] and y-axis [Fig. 4(c)] (denoted as Tx10° and Ty10°), and flip [Fig. 4(d)]. The wavefront reconstruction is performed for the micro-lens in the four positions to obtain the wavefront information of the four simulations. The PV values of the reconstruction of the front and rear surfaces shown in Fig. 4(g) and Fig. 4(h) are 92.072 μm and 91.241 μm, respectively. The nominal surface and the reconstructed surface have great consistency, and the RMS values are within a few tens of nanometers of error, which achieves sub-micron accuracy. In the experimental section, Fig. 5 shows the photo of the experiment system and micro-lens. The obtained wavefront information of the four positions of the micro-lens with calibrated structural errors is used to reconstruct the front and rear surfaces simultaneously by using the numerical iterative optimization algorithm of the freeform micro-lens, and the reconstructed front and rear surfaces are shown in Fig. 6(i) and Fig. 6(j). The reconstructed PV values of the front and rear surfaces are 0.308 μm and 0.096 μm, respectively. The RMS deviations from the results measured by the Zygo interferometer are 17 nm and 7 nm, respectively. Table 1 shows that most of the Zernike coefficients (Z5-Z15) are within an error of 5% and have great consistency.ConclusionsIn this paper, in order to realize high-precision and simultaneous inspection of the front and rear surfaces of the micro-lens, a numerical iterative optimal simultaneous reconstruction method of the surfaces of the freeform micro-lens based on deflectometry is proposed. The experimental results show that the numerical iterative simultaneous reconstruction method of the two surfaces of the micro-lens can achieve sub-micron measurement accuracy and realize the high-precision measurement of the front and rear surfaces of the micro-lens at the same time. The measurement method is characterized by a simple system structure, large measurement dynamic range, and high accuracy, and it can achieve simultaneous high-precision detection of various complex optical and industrial double-surfaces of micro-lenses.
ObjectiveSurface plasmon is a new technology that can break the diffraction limit and manipulate light on a sub-wavelength scale. It is considered one of the most promising means to shrink traditional optoelectronic devices to the micro-nano level. Surface plasmonic waveguides are fundamental components for miniaturized and compact optoelectronic devices and integrated optical circuits. Terahertz (THz) plasmonic waveguides are fundamental components for transmitting THz signals and constructing various THz functional devices, such as optical switches, optical modulation, filtering, and near-field imaging. This is of significance for realizing high-density integration of terahertz functional devices and high-speed ultra-wideband terahertz communication. Graphene features excellent optoelectronic properties and tunability. In the terahertz to the mid-infrared band, graphene plasmons (GPs) with low loss, strong confinement, and tunability provide a platform for the realization of miniaturized, highly integrated, and dynamically tunable terahertz waveguides and devices. Although various graphene-based hybrid plasmonic waveguides (GHPWs) have been proposed, the optical confinement properties of these structures still need to be improved. Additionally, it is necessary to systematically evaluate the waveguide performance because of the mutual restriction between confinement and loss. We propose a graphene V-groove hybrid plasmonic waveguide and study the influence of geometric structure parameters on the characteristics and transmission characteristics of hybrid plasmonic modes. In addition, the behavior of hybrid modes caused by changes in the chemical potential of graphene is analyzed, and the crosstalk between two adjacent hybrid structures is discussed in detail. This study provides theoretical references for the design and research of dynamically tunable terahertz sub-wavelength photonic devices.MethodsFinite element analysis method is adopted to calculate the eigenmode of the graphene-based V-groove hybrid waveguide system. In the convergence analysis, the calculation regions in x- and y-direction are assumed to be large enough to ensure an accurate eigenvalue. The mode effective index and propagation length are determined by the real and imaginary parts of the eigenvalue, respectively.Results and DiscussionsThe proposed graphene V-groove hybrid plasmonic waveguide features excellent mode confinement by optimizing the groove geometry and adjusting the chemical potential of graphene. First, the effect of GaAs height on the mode properties of fundamental hybrid plasmons guided by the graphene V-groove hybrid plasmonic waveguide is discussed. In Fig. 4, when the groove height hw=4.9 μm and the GaAs height is reduced from 30 μm to 6 μm, the normalized mode area Aeff/A0 is as small as 2.0×10⁻³; the corresponding propagation length is 63.4 μm; the figure of merit is 50.4. Second, the effect o f the groove size on the mode properties of fundamental hybrid plasmons is studied. In Fig. 5, when the groove height hw=4.9 μm and the groove angle is increased from 30° to θmax, the normalized mode area Aeff/A0 is as small as 1.7×10⁻³; the corresponding propagation length is 81.2 μm; the figure of merit is 69.5. Third, we discuss the effect of the chemical potential of graphene on the mode properties of fundamental hybrid plasmons. In Fig. 6, when the groove height hw=4.9 μm and chemical potential of graphene is reduced from 1 eV to 0.2 eV, the normalized mode area Aeff/A0 is as small as 8.6×10⁻⁵; the corresponding propagation length is 24.5 μm; the figure of merit is 93.5. Finally, the crosstalk between two graphene V-groove hybrid plasmonic waveguides is discussed by changing the groove size and chemical potential of graphene. In Fig. 8, when the angle of the groove is 90° and the chemical potential of graphene is 0.3 eV, the minimum distance without crosstalk between the two graphene V-groove hybrid plasmonic waveguides could be reduced to 22 μm. This can be attributed to the decreasing chemical potential, which leads to the decrease in the mode field area of hybrid plasmons (consistent with results in Fig. 6). Finally, the overlapping area of the optical field is decreased and the coupling effect between the two hybrid waveguides is weakened, thus resulting in crosstalk decrease.ConclusionsIn this paper, a graphene V-groove hybrid plasmonic waveguide is studied, and the influence of geometric parameters and graphene chemical potential on the fundamental hybrid plasmon mode supported by the hybrid structure is analyzed. The effective area of the hybrid mode can be effectively compressed by increasing the groove and reducing the chemical potential of graphene, and the effective mode area is reduced by two orders of magnitude compared with the structure without grooves. Although the transmission length is reduced, the figure of merit is increased by 34.5%-88.5%. In addition, the crosstalk between two graphene-V-groove hybrid plasmonic waveguides placed side by side is analyzed, and the minimum distance without crosstalk between the two waveguides could be reduced to 22 μm by optimizing the groove geometry and adjusting the chemical potential of graphene. This paper provides a theoretical reference for the development and performance optimization of dynamically tunable terahertz subwavelength waveguides.
ObjectiveAt present, the Inconel690 nickel-based alloy and SUS304 stainless steel are widely used in nuclear power, aerospace, and petrochemical fields owing to their excellent performance in thermal strength, corrosion resistance, and specific strength. Compared with traditional welding methods, laser welding is characterized by higher energy density, smaller welding deformation, and a narrower heat-affected zone. Compared with laser welding, laser welding with filler wire achieves the purpose of changing the metal composition of weld seams and thereby improving the mechanical properties of the welded joints. Different materials have different laser absorptivity, linear expansion coefficients, specific heat capacity, thermal conductivity, and microstructure evolution during solidification. These factors further affect the performance of the welded joints of dissimilar materials. The current research on stainless steel and nickel-based super-alloys mainly focuses on the mechanical properties of the welded joints under the influence of precipitates. In this study, laser welding and laser welding with filler wire are carried out under different heat inputs, and mechanical properties are investigated.MethodsThe thickness of the SUS304 and Inconel690 used in this experiment is 4.5 mm. Inconel ERNiCrFe-7A is used as the filler wire. The welding equipment used in this study is a 10 kW TRUMPF lasers TruDisk 10002. In addition, 99.99% pure argon gas is used as the shielding gas with a gas flow rate of 25 L/min. After welding, the ZEISS Axio Observer A1m metallurgical microscope is used to observe the surface morphology, and energy dispersive spectroscopy is employed to test the precipitates in the weld seams. The CMT4303 electronic universal testing machine is applied to test the tensile strength of the welded joints. The HVS-30 Vickers hardness tester is utilized to test the microhardness of the welded joints.Results and DiscussionsThe cross-sections of the welded joints are in the typical goblet shape with no crack defects. In the weld zone S2 (1.5 kJ/cm), many white particles are observed near the grain boundary, and they can be further confirmed as a titanium-containing phase. After the ERNiCrFe-7A filler wire is added, an irregularly shaped white precipitated phase is observed in the weld seam, and it can be determined as a chromium-rich phase. The X-ray diffraction (XRD) results suggest that this chromium-rich phase is Cr0.19Fe0.7Ni0.11 phase. The tensile strength of S2 (1.5 kJ/cm) is 9.7% higher than that of S1 (2.6 kJ/cm). After the filler wire is added, the tensile strength of S3 (1.5 kJ/cm) is 683 MPa, which is 16.2% higher than that of S1 (2.6 kJ/cm). Owing to the decrease in heat input, the grain size in the weld seam becomes smaller, which improves the plastic toughness and average hardness of the weld seam. When the heat input are 2.6 kJ/cm and 1.5 kJ/cm, the average hardness of the weld seam are 176.8 HV and 190.4 HV, respectively. After the filler wire is added, the average hardness of the weld seam in weld zone S1 (2.6 kJ/cm) is 216.7 HV.ConclusionsIn this study, laser butt welding of Inconel690 nickel-based alloy and SUS304 stainless steel is carried out. The influences of heat input and filler metal on the microstructure and mechanical properties of joints are studied. The results indicate that the cross-section of the weld seam is in the classical goblet shape after laser welding. The weld width of S1 (2.6 kJ/cm) is larger than that of S2 (1.5 kJ/cm). As the heat input increases, the grain size in the weld seam becomes larger. A titanium-containing phase is diffusively distributed in the weld seams of all welded joints. After the ERNiCrFe-7A filler wire is added, a chromium-rich phase appears, and it is speculated to be Cr0.19Fe0.7Ni0.11 phase according to the XRD results. The grain size of S2 (1.5 kJ/cm) is 40% smaller than that of S1 (2.6 kJ/cm), and the mechanical properties of the joints are improved.
ObjectiveDual-wavelength lasers are widely used in lidar, microwave photonic systems, and optical sensing systems. Traditional dual-wavelength lasers usually consist of two discrete lasers. Due to the influence of external temperature and environmental vibration, the operation stability of traditional dual-wavelength lasers is poor, which limits their application. To solve the above problems, multiple integrated dual-wavelength distributed feedback (DW-DFB) lasers have been developed, including integrated Y-waveguide DW-DFB lasers, multi-section DW-DFB lasers, and transverse coupling DW-DFB lasers. Monolithic integrated DW-DFB lasers boast a compact structure and stable performance. However, they usually require complex manufacturing processes and control circuits, which indicate high costs. Therefore, a dual-wavelength laser with a simple structure and good stability is urgently needed.MethodsIn this paper, a monolithic integrated two-section DW-DFB (TS-DW-DFB) laser is proposed experimentally. The TS-DW-DFB laser consists of a DW-DFB laser section and a grating reflector (GR) section. The two sections use the same epitaxial layer structure and share the same waveguide. Both facets of the TS-DW-DFB laser are deposited with anti-reflection coatings. The total length of the TS-DW-DFB laser chip is 1000 μm, and the lengths of the DW-DFB laser section and GR section are both 500 μm. There is also an electrical isolator between the two sections. The gratings of the two sections are fabricated by the reconstruction-equivalent chirp (REC) technique with the same seed grating. The grating in the DW-DFB laser section is a linearly chirped sampling grating with two π-phase-shifts at its 1/3 and 2/3 length, and the chirp ratio of the grating is 50 nm/mm. The grating in the GR section is a uniform sampling grating, and the sampling period of the grating is equal to the sampling period at the center of the grating in the DW-DFB laser section. To eliminate the side lobes in the reflection spectrum of the GR section and to decrease their reflection to the side modes of the DW-DFB laser section, we equivalently apodize the sampling grating in the GR section by changing the sampling duty cycle. As a consequence, the two main modes of the DW-DFB laser section are symmetrically located at the stop-band center of the reflection spectrum of the sampling grating in the GR section, while the side modes lie outside of the stop-band. The reflectivity of the grating in the GR section for the main modes is much higher than that for the side modes, which can lead to a much higher side-mode suppression ratio (SMSR). Due to the reflection of the GR section, the threshold current and power difference of the main modes (PDM) of the TS-DW-DFB laser are reduced.Results and DiscussionsUsing the transfer matrix method, the output characteristics of TS-DW-DFB lasers with different grating structures are analyzed. The simulated results show that the proposed TS-DW-DFB laser has a lower threshold current and higher output power [Figs. 4 and 5(a)] compared with the single-section DW-DFB laser. The PDM can also be optimized by changes in the length of the GR section [Fig. 5(b)]. Given these results, the TS-DW-DFB laser is fabricated. In contrast, a single-section DW-DFB laser with the same structure of the DW-DFB laser section as the TW-DW-DFB laser is also fabricated. The optical spectra of the single-section DW-DFB laser and TS-DW-DFB laser are measured under the same biased currents (Fig. 7). It is obvious that the TS-DW-DFB laser has a smaller PDM and a larger SMSR than the single-section DW-DFB laser. The influence of the biased current of the GR section on the PDM and SMSR of the TS-DW-DFB laser is also discussed (Fig. 8), and the current of the GR section is adjusted to optimize the PDM and SMSR simultaneously. In addition, the operation stability is a figure of merits for dual-wavelength lasers. When the temperature of the TS-DW-DFB laser is tuned from 16 ℃ to 40 ℃, both the wavelengths of the main modes shift toward long wavelength [Fig. 10(b)]. However, the PDM, SMSR, and wavelength spacing of the TS-DW-DFB laser are not changed significantly (Fig. 11). Their changes in one hour are observed when the operation temperature is kept at 24 ℃, and the bias currents of the DW-DFB laser section and GR section are set at 80 mA and 12 mA, respectively. The results reveal that the PDM, SMSR, and wavelength spacing remain stable within an hour.ConclusionsThe in-cavity mode competition of dual-wavelength lasers is fierce, and thus, mode stability is a key figure of merit for dual-wavelength lasers. To reduce the power difference between the two main modes and improve SMSR, we propose a DW-DFB laser integrated with GR. The grating structure in the dual-wavelength laser is simulated by the transfer matrix method. The influence of GR on the threshold and PDM of the laser is analyzed. After that, a monolithic integrated TS-DW-DFB semiconductor laser is fabricated and experimentally demonstrated. The measured results show that the proposed method can improve the operation stability, enhance the SMSR, and reduce the PDM of the DW-DFB laser. In a stable operation state, the PDM of the dual-wavelength laser is less than 0.3 dB, and the SMSR is larger than 35 dB.
ObjectiveThe chirped pulse amplification technology improves the peak energy of the pulse and greatly promotes the development of the ultrafast laser. However, high-order dispersion will be introduced in chirped pulse amplification technology, which leads to the oscillation of pulse waveform in the petawatt laser system and affects the signal-to-noise ratio (SNR) of the petawatt laser. To optimize the SNR characteristics of the petawatt laser and improve the efficiency of laser accelerating electrons, protons, and other particles, a new third-order dispersion control method based on birefringent crystal for the active control of SNR is proposed. The needs of petawatt laser cannot be well satisfied by conventional high-order dispersion compensation methods including grating pairs, prism pairs, and acousto-optic programmable dispersion filters due to their complex optical paths or limited dispersion adjustment. The active control method of the third-order dispersion based on the birefringent crystal is simple to operate. On the basis of the original optical path, the residual third-order dispersion in the system can be changed only by rotating the in-plane rotation angle of the birefringent crystal to realize the active control of SNR.MethodsWhen an incident beam with a certain spectral width passes through a birefringent crystal, it will follow different optical paths due to the inconsistent principal refractive indices of wavelengths for the crystal, introducing a specific frequency-domain spectral phase. In polarized optics, The Jones matrix is often employed to describe birefringent crystals. In front of and behind the birefringent crystal, polarizers are placed to control the polarization state of incident light and outgoing light and thus select the matrix elements of the Jones matrix. The complex amplitude of the outgoing light field in a specific polarization state can be obtained by calculation, and then the spectral phase expression introduced by the birefringent crystal and the high-order dispersion expansion are obtained. For the laser system with determined central wavelength, the high-order dispersion introduced by the birefringent crystal is a function of the crystal thickness and the in-plane rotation angle of the crystal. Therefore, the key parameters such as crystal thickness and crystal in-plane rotation angle in high-order dispersion introduced by crystal are simulated respectively. The results show that the crystal thickness affects the magnitude and the spectral width of the flat change of third-order dispersion, and the in-plane rotation angle of the crystal affects the specific value. When the crystal thickness is determined, the required third-order dispersion can be introduced by changing the in-plane rotation angle of the crystal. The possible additional group delay dispersion introduced by the birefringent crystal is also analyzed in this paper. It is shown that as the scheme is designed for the picosecond laser system, the introduced group delay dispersion has little effect on the pulse width which can be ignored. Additionally, Dazzler in optical paths can be adopted to compensate for the group delay dispersion according to the change in pulse width, which is monitored by the autocorrelation instrument after the dispersion control module.Results and DiscussionsFirstly, the theoretical model for describing the dispersion control of birefringent crystal is built (Fig. 1), and an optical axis parallel to the crystal surface is considered. On this basis, with the TM polarization of the incident beam and the outgoing beam as an example, the expression of the spectral phase introduced by the birefringent crystal is obtained, the Taylor expansion of which is the expression of the high-order dispersion. The effects of several critical parameters on the introduction of high-order dispersion into birefringent crystal are analyzed, including the central wavelength of the incident beam, crystal thickness, and in-plane rotation angle of the crystal. In this paper, the influence of the residual third-order dispersion on SNR is analyzed for the picosecond petawatt laser system (central wavelength of 1053 nm and spectral width of 3.4 nm). It is concluded that the SNR can be changed with different values of the residual third-order dispersion. According to the fitting results of the OPCPA pre-compression SNR state curve of the SHENGUANG Ⅱ ninth picosecond petawatt laser system (Fig. 7), a birefringent crystal with a thickness of 2.35 mm can be selected to compensate for the residual third-order dispersion. At the same time, according to the simulation results of the in-plane rotation angle and third-order dispersion (Fig. 6), the angle can be rotated to around 23° or 32° to compensate for the residual third-order dispersion of the system. Then, the dispersion modulated beam is imported into Sequoia to measure the SNR, and the control effect of third-order dispersion is judged according to the measured results.ConclusionsIn this paper, the models for analyzing second-order and third-order dispersion of the birefringent effect are built. According to the central wavelength and spectral width of the picosecond petawatt laser system, the special crystal thickness and in-plane rotation angle are designed, which introduce the third-order dispersion with sufficient magnitude and adjustable positive and negative. In addition, a small group delay dispersion is also ensured to avoid the influence on pulse width. On this basis, combined with the SNR measurement data of the ninth picosecond petawatt laser of SHENGUANG Ⅱ, the influence of third-order dispersion on the SNR of the petawatt laser pulse is simulated and analyzed, and an active SNR control scheme based on birefringent effect is proposed. Employing birefringent crystals to change the residual third-order dispersion of the petawatt laser system is of great significance to realize the numerical simulation analysis of SNR control. The results can provide a theoretical basis for the optimization of the SNR of laser systems.
ObjectiveCompared with traditional techniques, magnetic resonance imaging using hyperpolarized inert gas as the contrast agent has greatly improved the quality of lung images. The hyperpolarized inert gas is obtained by means of spin-exchange optical pumping, and pumping the alkali metal rubidium is the key to this process. However, the bandwidth of commercial high-power semiconductor lasers is wide, while the Doppler broadening linewidth of alkali metal atoms is narrow, which leads to low pumping efficiency. To match the pump spectrum width and atomic absorption spectrum width, researchers mainly use the surface grating or volume Bragg grating (VBG) as an external cavity feedback element to develop external cavity semiconductor lasers. In this way, the spectrum width can be narrowed, and the pumping efficiency can be improved to a certain extent. In the existing reports, however, few studies have realized the simultaneous output of lasers with narrow spectrum width and high power. Moreover, under the high power demand, most studies use the laser bar as the internal gain chip, which is exposed to problems such as poor beam quality and great coupling difficulty. Therefore, this work proposes an external cavity semiconductor laser based on a single-tube gain chip. The output performance of the laser can satisfy the narrow spectrum width and have high power in the meanwhile.MethodsVBGs have the characteristics of a high damage threshold and polarization insensitivity. Therefore, this study uses a VBG as the external cavity feedback element and designs the external cavity structure given the performance characteristics of the element. The diffraction efficiency of the VBG is affected by the incident wavelength and the angle of the incident light. According to the diffraction efficiency diagram of the VBG (Fig. 2), a single-tube semiconductor laser with a suitable wavelength is selected as the gain chip. Meanwhile, the front cavity surface of the gain chip can resist reflection after treatment to suppress the influence of the internal cavity mode, and two lenses are added to the external cavity structure to collimate the beam for the best diffraction efficiency of the VBG. Secondly, the completed laser structure is tested, and the laser spectrum and power are monitored and recorded simultaneously. For the understanding of the wavelength stability of the external cavity semiconductor laser, the performance of the laser under different working currents and temperatures is monitored, and the data is analyzed.Results and DiscussionsThe proposed VBG-based external cavity semiconductor laser can achieve the output power of 6.36 W and a spectrum of 0.036 nm at the operating current of 10 A and the operating temperature of 16 ℃ (Fig. 4), and the external cavity coupling efficiency reaches 88.5%. Compared with the single-tube semiconductor laser, the proposed semiconduction laser has significantly higher wavelength stability. The drift coefficient of the wavelength to current decreases from 1 nm/A to 0.01 nm/A (Fig. 6), and the temperature drift coefficient decreases from 0.350 nm/℃ to 0.005 nm/℃ (Fig. 7). In the experiment, it is found that when the difference between the central wavelength of the gain chip and that of the VBG feedback is within the tolerance range, the output from the external cavity semiconductor laser meets the characteristics of narrow spectral width, high power, and stable wavelength. Therefore, for the narrow spectral width and wavelength stability of the proposed laser in a wider operating current and temperature range, it is necessary to improve the maximum tolerance between the central wavelength of the gain chip and that of the volume Bragg grating feedback. The maximum tolerance of the proposed semiconductor laser is related to the feedback efficiency of the external cavity. It is affected by the reflectance of the front cavity surface of the gain chip, the diffraction efficiency of the VBG, the alignment position of each optical element, the reflectance of the lens, etc.ConclusionsOn the basis of the characteristics of VBGs, the structure of the external cavity semiconductor laser is designed in this study. The laser can output high power and narrow spectral width lasers, which solves the difficulty of matching spectral width with atomic absorption spectrum width in the pumping process and improves the pumping efficiency. The wavelength stability of the laser is tested under different operating currents and operating temperatures, and the results show that the laser has good wavelength stability within a certain operating current and temperature range. The relationship between the maximum tolerance between the central wavelength of the gain chip and that of the VBG feedback and the laser performance are presented. The research provides a theoretical and experimental basis for ensuring the stability of the external cavity semiconductor laser in a higher output power range, a larger operating current, and temperature range.
ObjectiveHigh-power nanosecond ultraviolet (UV) lasers have been widely applied in laser lift-off, laser annealing, laser transfer, and other fields, but their output is usually partially coherent light with nonuniform intensity distribution. To meet the high requirements of beam uniformity for precision machining, a homogenizer with microlens arrays is proposed. The microlens array homogenization technology based on the principle of beam splitting and superposition has attracted extensive attention due to its advantages of high energy utilization, insensitivity to wavelength, and good availability of unstable multimode beams. However, the current research on the homogenization technology of microlens arrays mostly adopts the ray tracing method of geometric optics, ignoring the diffraction effects that seriously affect the performance of homogenized beams, such as multi-beam interference and the finite aperture effect. Therefore, we design the microlens array homogenizer following the partially coherent diffraction principle and perform the quantization analysis of the influence of homogenizer parameters on the performance of output laser beams.MethodsPartially coherent light can be described by the cross-spectral density function (CSD), but direct application of CSD to the simulation involves quadruple integral calculation, which takes a long time. Therefore, the pseudo-mode representation of CSD is used to simplify the numerical process and reduce computational time. By combining the pseudo-mode representation of partially coherent light and coherent light diffraction theory, we build a numerical simulation model of a microlens array homogenizer for high-power UV lasers and quantitatively analyze the parameters of the homogenizer. Specifically, an excimer laser source with different spatial coherence along the horizontal (short axis) and vertical (long axis) directions is represented as an incoherent superposition of mutually uncorrelated pseudo-modes, i.e., the coherent plane-wave modes obtained from the Gaussian Schell-model (GSM). Then, the diffraction field of each mode passing through the microlens array homogenizer is calculated according to the angular spectrum diffraction theory and superimposed to achieve a uniform output laser beam. Moreover, the influence of parameters such as laser coherence, defocus, array spacing, and misalignment on the uniformity and edge steepness of output laser beams is discussed comprehensively. Through the simulation optimization, a high-quality microlens array homogenizer is provided, which can output a sharp square laser beam with uniformity of less than 1.5%. At the same time, the reliability of the theoretical design and the accuracy of parameter impact analysis are verified by experiments.Results and DiscussionsFirstly, the intensity distributions of excimer laser-homogenized beams on different axes (Fig. 1) are compared, and it is found that for short-axis beams with high spatial coherence, the multi-beam interference effect is stronger, which can produce obvious interference fringes and results in a decrease in beam uniformity. For long-axis beams with low spatial coherence, the beam uniformity is higher due to negligible interference effects, and the beam edges are not as sharp as short-axis beams. To meet the precision machining requirements of beam uniformity less than 1.5%, the method of increasing the defocus distance is used to reduce the effect of interference on the homogenized beam so that the short-axis uniformity is reduced from 5.3% to 0.17% (Table 1). The reason is that the size of discrete spots formed by interference becomes larger with the increase in defocus distance, and these spots overlap each other to smooth the periodic oscillation of the homogenized beam. In addition, simulations show that the sharpest-edged homogenized beam can only be obtained when the spacing between two microlens arrays is equal to the focal length of the second lens (Fig. 5). Furthermore, the condition of microlens array misalignment is discussed (Fig. 7). When the decenter or tilt is small, the oscillation effect of the homogenized beam is gradually enhanced as the decenter or tilt increases owing to the incomplete superposition of sub-beams from the microlens array. When the decenter or tilt increases to a large value, such as a decenter equal to 0.4 mm, the homogenized beam will split into multiple beams due to the energy leakage of the adjacent sub-apertures of the microlens array. If both decenter and tilt exist, the effect of misalignment will be intensified, which makes it easier for the beam to split. However, due to the periodic structure of the microlens array, as the misalignment continues to grow, the output homogenized beam returns from the split state to the single-beam state, and the superimposed sub-beams are staggered by exactly one array period. Finally, the phenomenon of the homogenized beam splitting in the case of microlens array misalignment is observed experimentally (Fig. 8). The change of the uniform beam with increasing defocus distance is consistent with the theoretical analysis results, which illustrates the reliability of the theoretical design method and the accuracy of the parameter analysis.ConclusionsIn this paper, the research on UV laser homogenization technology based on microlens arrays is carried out. Specifically, the pseudo-mode decomposition theory and the angular spectrum diffraction transmission algorithm are employed to build a numerical model for fast calculation of partially coherent light passing through the microlens array homogenizer, and an excimer laser is used as a simulated light source. Through the analysis of parameters such as defocus and array spacing, the optimal design parameters are determined, and the square beams with sharp edges and high uniformity are realized. Then, the influence of microlens array misalignment on the beam profile and uniformity is discussed in detail, which provides a reference for setting the assembly tolerance of the homogenization system. In addition, the reliability of the theoretical design and the accuracy of the parameter impact analysis are demonstrated through experiments.
ObjectiveIn this paper, a novel, highly-strained InGaAs/GaAs self-fit well-cluster composite (WCC) quantum structure was investigated. The WCC structure differs from the conventional InGaAs/GaAs quantum-well structure, which exhibits considerable potential for numerous laser applications. Presently, the conventional quantum well exhibits a quasirectangle well structure, wherein each well consists of a fixed amount of indium and a single strain type in the material system. The WCC structure with variable indium content and thickness in an InxGa1-xAs/GaAs system can yield remarkable results, thereby facilitating the development of new laser types. This structure is associated with the indium-rich cluster (IRC) effect, wherein the IRCs were typically regarded as defects to be avoided for the conventional InGaAs quantum-well structure; hence, its special optical characteristics remain neglected. The migration of the indium atoms to the WCC structure would reduce the indium content in the corresponding InGaAs regions, consequently generating normal and indium-deficient InxGa1-xAs regions with hybrid strain types in the InGaAs material and aid in the production of special polarized spectra with dual peaks. Therefore, it is crucial to reveal the underlying corresponding luminescence mechanism between dual peaks in different polarized spectra and multiple InxGa1-xAs materials. This work offers new avenues for the development of new types of devices.MethodsFirst, the InGaAs-based WCC quantum structure was developed via metal-organic chemical vapor-phase deposition. To generate the IRC effect by sufficient strain accumulation, the In0.17Ga0.83As/GaAs/GaAsP0.08 material system was designed as a periodic gain structure (Fig.1). The thickness of the In0.17Ga0.83As layer was designed to be 10 nm, because an InGaAs layer thinner than 10 nm is insufficient to obtain the IRC effect. Second, the luminescence mechanism of the WCC structure was studied by coating the WCC sample at a transmittance of T=99.99% at the dual facets to avoid the end reflection. Third, the polarized photoluminescence (PL) spectra in transverse electric (TE) and transverse magnetic (TM) modes were measured using a linear polarizer under varying carrier densities (N) in the range of3.6×1017-4.8×1017 cm-3. The special bimodal feature was observed in both TE- and TM-polarized PL spectra (Fig.2), which could be associated with the emissions from normal and indium-deficient In0.12Ga0.88As regions with varying band gaps. To analyze the different strain types, the lattice constant a(x) of the InxGa1-xAs material was obtained. Subsequently, the hybrid strain types in normal and indium-deficient InxGa1-xAs were obtained. The compressive and tensile strain occurred in the In0.17Ga0.83As and In0.12Ga0.88As layers, respectively. Further, according to the transition matrix element theory, the PL spectrum in TE polarization was primarily associated with the electron-hole recombination between the first conduction (C1) and heavy hole (HH1) subbands, whereas that in TM polarization was associated with the electron-hole recombination between C1 and light hole (LH1) subbands. Moreover, in the compressively-strained In0.17Ga0.83As layer, the HH1 subband lies above the LH1 subband. Conversely, the HH1 subband lies below the LH1 subband in the tensile-strained In0.12Ga0.88As layer. Finally, the underlying luminescence mechanism of the polarized spectra with dual peaks was revealed according to the above analysis.Results and DiscussionsThe TE- and TM-polarized PL spectra (Fig.2) reveal the special bimodal features, and they are marked using letters A and B, and C and D, which correspond to 1.27 eV and 1.33 eV and 1.35 eV and 1.31 eV, respectively. GaAs, In0.17Ga0.83As, and In0.12Ga0.88As yield lattice constant values of 5.65325, 5.72215, and 5.7019 ?, respectively. Accordingly, the In0.17Ga0.83As layer is subject to compressive strain such that the HH1 subband lies above the LH1 subband. Meanwhile, tensile strain is noted in the In0.12Ga0.88As layer such that the HH1 subband falls below the LH1 subband. According to the transition matrix element theory, the main peaks, which are marked by A and C in both TE and TM spectral curves (Fig.2), are attributed to the compressively-strained In0.17Ga0.83As layer; the corresponding TE photon energy is less than the TM photon energy. Meanwhile, the subpeaks marked by B and D (Fig.2) are attributed to the tensile-strained In0.12Ga0.88As region; the corresponding TE photon energy exceeds the TM photon energy. Moreover, the characteristics of the hybrid energy band of the InGaAs self-fit WCC quantum structure are obtained (Fig.3). For the compressively-strained In0.17Ga0.83As layer, the energy intervals from C1 to HH1 and LH1 bands are 1.27 eV and 1.35 eV, which correspond to the photon energy at peaks A and C, respectively. In the case of the tensile-strained In0.12Ga0.88As material, the energy intervals from C1 to HH1 and LH1 bands are 1.33 eV and 1.31 eV, which correspond to the photon energy at peaks B and D, respectively.ConclusionsIn this paper, a novel, highly-strained InGaAs/GaAs self-fit WCC quantum structure is investigated based on the IRC effect. The measured spectra in TE and TM polarizations reveal special features with dual peaks, which are attributed to the combination of different emissions produced by the normal and indium-deficient InGaAs active regions. According to the transition matrix element theory, the corresponding luminescence mechanism between the dual peaks in polarized spectra and InGaAs material with different indium content is revealed. Furthermore, the band characteristics associated with the conduction subband C1 and valence subbands of heavy holes HH1 and light holes LH1 are determined to reveal the underlying luminescence mechanism. The special WCC structure demonstrates a hybrid strain distribution, which indicates the simultaneous existence of compressive and tensile strains. The results of this study can greatly enhance the performance of InGaAs-based WCC-tunable lasers.
ObjectiveThe chirped and tilted fiber Bragg grating (CTFBG) is an important component for filtering Raman light in high-power fiber laser systems. The filtering bandwidth and depth of CTFBG determine the filtering effect, so it is necessary to increase its filtering bandwidth and depth. The tandem inscription method can effectively increase the bandwidth by cascading two CTFBGs with different tilted angles. However, the tandem inscription method based on the traditional ultraviolet laser phase mask technology has the following shortcomings. 1) The fiber needs to be processed by hydrogen loading and heat annealing before and after the CTFBG inscription, respectively, which increases the fabrication time and cost. 2) When cascade CTFBGs with different tilted angles are inscribed, it is necessary to change the tilted angle of the phase mask and realign the inscription system, which increases the inscription complexity. 3) The Bragg reflection bandwidth of cascade CTFBG will also increase, which may provide feedback to Raman light and affect the Raman filtering effect of CTFBG. The proposed femtosecond laser inscription system for cascade CTFBG in this paper can effectively overcome the above shortcomings.MethodsThe femtosecond laser arrives at the cylindrical lens and the chirped phase mask in turn and finally forms interference fringes on the fiber core. The tilted grating plane is formed by oblique scanning of the fiber via a piezoelectric stage. At the same time, the femtosecond laser scans the chirped phase mask along the fiber axis, thereby increasing the length of the grating and introducing a larger chirp. When the femtosecond laser scans along the fiber axis, the grating planes with different tilted angles can be formed by changing the amplitude of the piezoelectric stage, thereby realizing the inscription of cascade CTFBGs. The schematic of the grating structure of the cascade CTFBG is shown in Fig. 1, which consists of sub-CTFBG Ⅰ and sub-CTFBG Ⅱ with different gratings.Results and DiscussionsFigs. 2(a) and 2(b) show the spectra of single-stage CTFBG and cascade CTFBG, respectively. The tilted angle of the former is 6.4° with a grating length of 20 mm. The latter consists of two sections of CTFBG with different tilted angles, and its grating length is 20 mm. The bandwidth of cascade CTFBG is wider than single-stage CTFBG, and the filtration depth can be maintained greater than 20 dB. In order to test the performance of cascade CTFBG for filtering Raman light, a test system is built (Fig. 3). The test source is a continuous-wave high-power fiber oscillator of 1080 nm with a maximum output power of about 1.5 kW and output fiber length of about 18 m. The output spectra measured without and with cascade CTFBG at different output powers are shown in Figs. 4(a) and 4(b), respectively. Raman light is almost completely filtered out by cascade CTFBG at the maximum output power.ConclusionsHere,a CTFBG is fabricated by the femtosecond laser tandem inscription method, and the filtering bandwidth and depth of which are about 15.2 nm and greater than 20 dB, respectively. By introducing the CTFBG at the output end of a high-power fiber laser long-distance transmission system of 1080 nm, the output spectrum without Raman light is realized, which greatly improves the purity of the output laser. This work provides a method for the fabrication of the wideband CTFBG and demonstrates its Raman filtering effect, which is of significance for the development and application of CTFBG.
ObjectiveThe optical parameters and structural characteristics of biological tissue are an important basis for medical clinical diagnosis. Biomedical optical imaging technology has gradually become a new pioneering field developing rapidly in the international arena due to its advantages of safety, non-destructive characteristics, high detection sensitivity, and realization of functional imaging in tissue. However, pure optical imaging techniques such as optical coherence tomography and diffusion optical tomography are unable to obtain excellent imaging resolution and large imaging depth at the same time. Therefore, acousto-optical tomography (AOT) which is a hybrid imaging method emerges. It can offer a great spatial resolution of imaging (sub-millimeter level) in deeper tissue (centimeter-level) because the ultrasound has low scattering in tissue to locate the scattered light. Therefore, it is a promising non-destructive imaging technology for biological tissue. However, the research process of AOT faces two main problems, including the research on acousto-optical interaction mechanisms in tissue and the extraction of weak modulated light signals in strong background light. In this paper, COMSOL Multiphysics software is used to simulate the acousto-optical interaction process in various structural tissue. It is a new approach to studying the acousto-optical interaction mechanism. The simulation results can provide an important basis for data analysis and final image processing and reconstruction by AOT.MethodsThe acousto-optical interaction mechanism can be divided into coherent modulation mechanism and incoherent modulation mechanism in terms of the choice of light sources and the modulation effect of ultrasound. The incoherent modulation mechanism mainly refers to the change in light energy caused by the periodic change in optical parameters (including absorption coefficient, scattering coefficient, and refractive index) of tissue under the effect of an ultrasonic field. It does not require coherent light as the light source, so it belongs to intensity modulation. On this basis, this study adopts the finite element method for simulation, defines the optical and acoustic fields separately by using the diffuse equation with the extrapolated boundary and the ultrasonic theory, and performs multi-physics field coupling based on the incoherent modulation mechanism. Firstly, the influence of light beams on the distribution of light in the tissue and the characteristics of axial and radial light distributions are analyzed. Then, the relationship between the acousto-optical signal and the ultrasonic signal is discussed, and the simulation results are verified by experiments. Finally, the effect of optical parameters on the acousto-optical signal in monolayer tissue is investigated, and the effect of optical parameters of target and non-target tissue on the acousto-optical signal in multilayer tissue is discussed.Results and DiscussionsFirstly, the fluence rate distribution under different beam radiation is compared in the simulation. As the beam width increases, the peak fluence rate gets smaller, but the distribution is wider. In addition, the fluence rate decays more rapidly in the radial direction, but this trend decreases as the beam width increases (Fig. 5). The decrease in radial fluence rate slows down with the increase in axial distance. When the radial distance keeps increasing, the decreasing rate of the axial fluence rate also decays, while there is a rising phase of the fluence rate change during the increase in the axial distance and a peak near the equivalent light source (Fig. 6). Secondly, the acousto-optical signal is defined as the cumulative result of modulated fluence rates at various points inside the tissue, and its waveform is very similar to the ultrasonic waveform, with the frequency the same as the ultrasound frequency (Fig. 7). The acousto-optical signal observed in the experiments also has this characteristic (Fig. 7), and the simulation results are in good agreement with the experimental results. Finally, the influencing factors of the acousto-optical signal are evaluated in the tissue. In monolayer tissue, the mean and peak-to-peak values of the acousto-optical signal decrease exponentially, and the modulation depth increases linearly with the increase in the absorption and scattering coefficients, while the mean and peak-to-peak values of the acousto-optical signal increase exponentially, and the modulation depth decreases linearly with the increase in the anisotropy factor (Fig. 10). In multilayer tissue, the relationship between the optical parameters of the target tissue and the acousto-optical signal is no different from that of the monolayer (Fig. 11). However, when the optical parameters of the non-target tissue in multilayer tissue changes, the modulation depth remains stable (Fig. 12).ConclusionsIt is urgent to explore the acousto-optical interaction mechanism in the process of AOT research. Current modeling methods are mostly based on the coherent modulation mechanism and use the traditional Monte Carlo method for numerical simulation. In this paper, a multi-physics field coupling model is constructed by using the finite element method to model the acousto-optical interaction process in different structural tissue based on incoherent modulation. The characteristics of axial and radial light distributions and the influence of optical parameters of monolayer and multilayer tissue on the acousto-optical signal are discussed. The simulation results show that the change in beam size affects the attenuation speed of axial and radial light and the location of the peak value of axial energy flow rate; the peak-to-peak value, average value, and modulation depth of the acousto-optical signal change regularly with the change in optical properties of monolayer tissue. For multilayer tissue, the modulation depth of the acousto-optical signal only depends on the optical properties of the target tissue and has nothing to do with the optical properties of non-target tissue. It has great interference resistance and is only related to the optical parameters of the target tissue, which has a simple linear relationship, or in other words, the difference in the optical parameters of the tissue at the ultrasound localization can directly characterize the difference in modulation depth. Therefore, it is a favorable reference index in the image processing and reconstruction process of AOT.
ObjectiveThe focal length of the variable-focus optical system can be quickly changed within a certain range, so as to realize the clear imaging of the same objects at different positions or levels, and its function is beyond that of the fixed-focus system. The traditional variable-focus system has a mechanical movement, which restricts its application range. In order to realize zoom without mechanical movement, the variable-focus lens is the key, and an electrowetting liquid lens is an electrically controlled variable-focus lens with excellent performance.At present, many researchers both in China and abroad have conducted a lot of in-depth research on the mechanism, performance, and application of electrowetting liquid lenses. However, due to the diversity of specific lenses and the complexity of the problems, the theory of electrowetting needs to be perfected, the performance needs to be improved, and new applications need to be developed. In terms of application, the performance of the liquid lens is the key. The two most important performance indexes of the variable-focus lens are the focal length and zoom time after zooming, which depend on the response characteristics of the electrowetting liquid lens. From the transient state to the steady state, the focal length after zooming is determined by the steady-state value, and the response time is determined by the transient process. Whether in theory or the experiment, the research on steady-state responses is much less difficult than that on the transient process, so the current research on the response characteristics of electrowetting liquid lenses mainly focuses on the steady-state response, while the research on the transient process is rarely reported. As a result, there is not a completely clear and unified understanding of the transient process.In this paper, the transient process of electrowetting liquid lenses is measured and analyzed, which is helpful to perfect and enrich the electrowetting theory and expand new applications.MethodsA measurement system of the zoom process of electrowetting liquid lenses is designed and built (Fig. 1). The change process of the output voltage measured by the photoelectric detector with time reflects the zoom process of the liquid lens and indicates the change in the interface state of the liquid lens with time, that is, the response characteristics of the liquid lens. The response processes of an ARCTIC liquid lens (A-25H) under different driving voltages, including the response process of loading and unloading voltage, are measured by the self-designed system. According to the response process, the response times of loading and unloading under different driving voltages are obtained, and the measured results under various conditions are analyzed.Results and DiscussionsIn this paper, it is proposed that the response of a variable-focus liquid lens driven by voltage includes inherent response and forced response. The functional form of the inherent response signal is determined by various parameters of the liquid lens, and it is not related to the driving voltage. However, its coefficient is related to the driving voltage. The forced response has the same functional form as the driving voltage. The change law of the transient process of liquid lenses depends on the inherent response and is independent of the driving voltage. Therefore, changing the driving voltage for the same liquid lens only changes the amplitude of the transient process response but does not change the changing law of the transient process, and thus the response time of the liquid lens is not affected. The experiment verifies that the response of liquid lenses can be decomposed into inherent response and forced response (Fig. 2). The response process and response time of the liquid lens driven by different voltages are measured [Fig. 5(d)]. It is found that the measured results are consistent with the theoretical analysis results. Moreover, the experimental result that the response signals of the liquid lens intersect at the same point A under different driving voltages [Fig. 4(b)] is analyzed, which further verifies the theoretical analysis of the proposed transient process of the liquid lens.In addition, the recoil phenomenon of electrowetting liquid lenses is observed. This phenomenon occurs in the initial stage of loading voltage and unloading voltage.ConclusionsIn this paper, it is proposed that the response of electrowetting liquid lenses includes inherent response and forced response, and the changing law of the transient process depends on the inherent response and is independent of the driving voltage. Therefore, the response time of electrowetting liquid lenses is independent of the driving voltage. This conclusion enriches the related theory of electrowetting liquid lenses and has direct guidance for its application. The recoil phenomenon of the electrowetting liquid lens is observed. This finding makes it possible to reasonably utilize or avoid this phenomenon and gives new factors to be considered in the design and preparation of electrowetting liquid lenses, which is helpful to enrich and perfect the working mechanism of electrowetting liquid lenses.
ObjectiveThe non-repetitive transient weak signal exists in diverse fields, such as astronomy, spectroscopy, and biology, and it is difficult to be perceived and analyzed due to its short duration, large instantaneous bandwidth, unexpected arrival time, and low power. Over the past years, photonic technology has witnessed remarkable progress in the wideband and weak signal loss in the noise. For example, the signal stands out from the noise by using the Talbot effect to redistribute the energy of repetitive waveforms into fewer replicas for noiseless intensity amplification and avoiding digital post-processing. However, it is only valid for repetitive waveforms. A spectral cloning receiver based on coherent dual optical frequency combs (OFCs) is proposed to detect a random non-repetitive signal hidden in the noise. In this proposal, the spectrum of the received signal is sliced into a series of sub-bands (or channels) due to the difference in the free spectrum ranges (FSRs) of two combs. Then, coherent in-phase summation of these sub-bands can lead to a signal-to-noise ratio (SNR) increase (10lg S) linearly proportional to the cloning count or the available sub-bands, which is associated with the effective comb line of the coherent dual OFCs (S). In order to achieve a large SNR improvement, considerable comb lines of the OFCs must be required. However, generating massive comb lines not only needs high input radio frequencies (RFs) and laser powers but also needs superior optoelectronic hardware, which makes the system complex and costly. In addition, the comb channel number is also constrained by the available wavelength range. Therefore, a novel method using a single comb-based scheme for deep denoising in covert wireless communication is proposed. However, it also faces the problem that the system is difficult to further increase the number of comb lines. At this time, a method is urgently needed to effectively solve the problems of the above methods.MethodsTo this end, a novel photonic approach to enhance the sensing sensitivity of non-repetitive transient weak signals in a noisy background is proposed. Based on a coherent dual OFCs-assisted spectral cloning receiver, thetransient signal is firstly multicast by N-line signal OFCs and then split equally into M copies, while the local OFC is replicated to multiple replicas by multiple acousto-optic frequency shifters (AOFSs). Therefore, the spectrum of the received transient signal is decomposed into N×M sub-bands. Subsequently, different spectral slices are extracted and down-converted to the same intermediate frequency by an I/Q demodulator. Finally, all the sub-band signals are processed in digital signal processing (DSP) and positively superimposed in the frequency domain. Since the phase characteristics of the spectrum in each sub-channel are in-phase, but the noise frequency spectrum is random, the collinear superposition of the signal spectral vector will be realized, while the noise is randomly superimposed, which leads to a multiplied SNR enhancement of N × M for the transient signal sensing.Results and DiscussionsA spectral cloning receiving scheme based on the dual coherent OFCs with nine comb lines is used to perceive a transient signal. The performance of the system is characterized by an 18-GHz wide pulse at various noise levels. As the scatter diagram shows, the separation degree of signal cloud and noise cloud is greater than that of the single channel after 18 channels are superimposed in phase with one AOFS used (N=9 and M=2). Compared with that of a single channel, the detection sensitivity increases by 3 dB after spectral cloning, which is consistent with the theoretical value (Fig. 5). The local OFC and signal OFC are replicated 1, 2, and 3 times, and the detection gain is improved by 3.0 dB, 4.5 dB, and 5.9 dB, reaching to 12.63 dB, 14.04 dB, and 15.43 dB, respectively, which accord well with the theoretical value (Fig. 7). In this proposal, the complexity of the OFC generation module and the spectral coverage do not increase basically, but a multiplied SNR rise is achieved. In addition, the splitting loss induced by the optical couplers (OCs) will cause a faint power at the detectors so that the system cannot detect the optical signals. Although Erbium-doped fiber amplifiers (EDFAs) can compensate for the loss, the spontaneous emission noise introduced by EDFAs will greatly influence the detection gain of the system. Therefore, it is necessary to select the appropriate splitting number according to the actual link characteristics, such as EDFA's noise and detector sensitivity.ConclusionsA simplified and low-cost spectral cloning receiver using multiple AOFSs for large SNR enhancement is proposed and demonstrated. Based on the dual OFC channelization scheme, multiple AOFSs and OCs are used to replicate the local OFC and modulated signal so that the spectrum of the received transient signal is divided into multiple sub-bands. After the collinear superposition of the sub-band signal spectrum and the random superposition of the noise spectrum, the detection sensitivity of the transient weak signal is greatly improved. The dual-OFCs spectral cloning receiver with nine lines is used to detect the sub-noise transient signal with a bandwidth of 18 GHz. The detection sensitivity gain is increased to 12.63 dB, 14.04 dB, and 15.43 dB under varying noise power conditions by replicating the local OFC 1, 2, and 3 times. Compared with the previous scheme, the proposed scheme requires fewer optical frequency comb lines and a smaller available wavelength range to achieve the same SNR improvement under the available sensitivity of the receiving unit.
ObjectiveA method considering the light transmission of silicon dioxide film on the device surface can be proposed to address the large error between the existing photon detection probability (PDP) model and actual test results, which can accurately predict the detection probability of single-photon avalanche diodes (SPADs). Visible light communication requires a high-sensitivity receiver to receive optical signals, and single-photon detectors play an extremely important role in visible light communication because of their high sensitivity, high gain, and high visible light wide-spectrum response. Due to the time-consuming and cost-intensive bipolar-complementary metal oxide semiconductor-double diffusion metal oxide semiconductor (BCD) process workflow, prediction of SPAD performance is critical to optimize its design before fabrication. Although commercial semiconductor simulation software can usually simulate the electrical properties of SPADs, such as breakdown voltage, impact ionization rate, and electric field distribution, their statistical performance cannot be directly simulated. Additionally, since the internal operating mechanism of the semiconductor simulation software is not open, it is impossible to know the detailed simulation process, and it is also prone to non-convergence during the simulation. Therefore, it is of practical significance to model the performance parameters of SPADs. In fact, although there are some theoretical models for the calculation of PDP, due to the complex factors of its physical process, various models have large errors and are inconsistent with the experimental test trend in the short wavelength range. Thus, the photon-quantitative and reliable prediction of detection probability is challenging.MethodsThe PDP is defined as the product of the light transmission of a photon passing through the silicon dioxide layer on the silicon surface and the internal quantum efficiency of the device. The internal quantum efficiency of the device is the probability triggered when a photon is absorbed by the device and results in an avalanche. The internal quantum efficiency of P+/N well/deep N well SPAD is divided into three parts. In the neutral region P, photons are absorbed in the P+ layer on top of the SPAD to generate electron-hole pairs, and some photogenerated electrons will diffuse to the upper boundary of the depletion region, triggering an avalanche probability. In the depletion region, photogenerated electrons and holes drift in opposite directions under the action of a strong electric field in this region and trigger an avalanche after moving a very short distance. In the neutral region N, photogenerated holes can reach the bottom of the depletion region without being recombined, and initiate an avalanche trigger. In this study, the doping concentration provided by the device processing factory and the designed SPAD layout structure are imported into the TCAD tool to rebuild the two-dimensional device model. Through the function library that comes with Sentaurus Sdevice, parameters such as temperature, bias voltage, and incident light wavelength are set for electrical simulation, and the electric field intensity and width of the depletion region are obtained. Then, the electric field strength and the width of the depletion region are imported into the model built by Matlab software to obtain the internal quantum efficiency. The particle swarm optimization algorithm is adopted to obtain the fitting parameters of the transmission spectrum in the passivation layer of the silicon dioxide film, and finally acquire the PDP.Results and DiscussionsFirstly, two-dimensional process simulations are carried out through the Sentaurus SED based on the standard 0.18 μm BCD process and the SPAD device structure obtained from the process simulations. The simulated electric field distribution of the SPAD at an excess bias voltage of 1 V is simulated by Sentaurus Sdevice (Fig. 4) to extract the one-dimensional (1D) electric field distribution at the center of the device at an excess bias voltage of 1 V (Fig. 5). The electric field distributions at 0.5, 1.0, 2.0, and 3.0 V over-bias respectively are employed to calculate the avalanche trigger probability at each location in the depletion region (Fig. 6). The theoretical model of the PDP is improved by considering the effect of the silica passivation layer film on the incident light wavelength. The wavelength-dependent transmission of the silica film is fitted through a particle swarm optimization algorithm by comparing the theoretical model with experimental test results (Fig. 7). The PDPs contributed by each of the three components of the neutral P, depletion, and neutral N regions are calculated (Fig. 8), and the total PDP is the sum of the three components (Fig. 9). Finally, a PDP model with a low mean error is achieved (Fig. 10). The results show good agreement between the PDP predictions and experimental tests, with an average error of only 1.72%.ConclusionsWe discuss the PDP for simulating typical over-bias voltages from 0.5 to 3 V without substrate contribution. The model and experimental test results are compared at the over-bias voltage of 0.5 V with an average error of only 1.72%. The average error is defined as the average of the sum of the absolute errors for each wavelength. The improved model for PDP considering the transmission spectrum of a thin film of silica passivation layer provides a research direction for the development of new SPAD device structures. Results show that the model can reduce the non-convergence problems in commercial device simulation software, and greatly reduce the time and cost required to develop new structures for SPAD devices. Additionally, the building of models for electric field strength, avalanche trigger probability, and carrier lifetime can help dark counting analysis, thus enlightening related researchers.
ObjectiveIn digital photoelasticity, the stress field contains isoclinic information of the main stress direction angle and isochromatic information of the main stress difference, both of which are indispensable in stress calculation, so it is very important to obtain isoclinic and isochromatic information quickly and accurately. The ten-step phase shift method is the most widely used one, as it solves the problem of isoclinic and isochromatic line coupling in the six-step phase shift method for monochromatic light. Although the ten-step phase shift method has higher measurement accuracy, its efficiency is lower due to the acquisition of four white light incident images. Some researchers have improved the image acquisition devices, such as expensive polarization sensors, to increase efficiency. This paper proposes a minimal phase shift scheme that satisfies the requirements of calculating an isoclinic line in a planar polarized light field and an isochromatic line in a circularly polarized light field, so as to balance measurement accuracy and efficiency.MethodsIn photoelasticity experiments, the planar polarized light field with white light incidence has more advantages than the circularly polarized light field with monochromatic light incidence, and the isoclinic line calculated based on the former field effectively avoids the problem of coupling with isochromatic line. Therefore, in this paper, under the planar polarized light field with white light incidence, the isoclinic line is calculated by reducing photoelastic images from 4 to 3, which effectively avoids the problem of isoclinic and isochromatic line coupling and quarter wave plate mismatch errors. For the problem of low efficiency of the ten-step phase shift method caused by acquiring massive images, this paper reduces photoelastic images from 6 to 3, so as to calculate isochromatic line under the circularly polarized light field with monochromatic light incidence, which solves the problem of low efficiency due to image acquisition. In the next simulation experiment, this paper calculates the isoclinic and isochromatic lines under different noise levels to evaluate their anti-noise performance. In addition, the paper calculates isoclinic and isochromatic lines under different azimuth errors to evaluate the anti-jamming capability of phase shift errors. Furthermore, the effectiveness of the proposed method is verified by a radially compressed polycarbonate disc.Results and DiscussionsFirstly, in view of the problem of isoclinic and isochromatic line coupling caused by monochromatic light in the traditional six-step phase shift method and the low data acquisition efficiency in the ten-step phase shift method, a six-step hybrid phase shift method is designed, which changes the 6+4 measurement method in the ten-step phase shift method to 3+3 measurement method. The feasibility of this method is verified by real experimental data. In addition, compared with the traditional six-step phase shift method, the six-step hybrid phase shift method effectively avoids the problems of isoclinic and isochromatic line coupling and quarter wave plate mismatch errors (Fig. 4); compared with the ten-step phase shift method, the method has an average deviation of isoclinic line of about 0.01 rad and an average deviation of isochromatic line of about 0.09 rad (Table 8). Furthermore, the proposed method reduces image quantity and improves the acquisition efficiency by 40% while ensuring measurement accuracy (Fig. 5-Fig. 8). Secondly, in order to verify the noise immunity and phase shift error immunity of the six-step hybrid phase shift method, the deviations of isoclinic and isochromatic lines calculated under different noise levels are generally comparable to those of the ten-step phase shift method (Table 5), and the deviations of isoclinic line calculated under different azimuth errors are consistent with those of the ten-step phase shift method, which indicates that this method has the same immunity to phase shift error interference as the ten-step phase shift method (Table 6). The deviations of the isochromatic line calculated under different azimuth errors are approximately twice as large as those of the ten-step phase shift method (Table 7). The reason for this is that the ten-step phase shift method uses six images to calculate the isochromatic line, while the proposed method only requires three images, but it loses some effective information to a certain extent, so the resistance to phase error interference of the proposed method is relatively weak compared with that of the ten-step phase shift method.ConclusionsThis paper analyzes the disadvantages of the six-step and ten-step phase shift methods and proposes an optimized six-step hybrid phase shift method. The paper uses three photoelastic images of a planar polarized light field with white light incidence and three photoelastic images of a circularly polarized light field with monochromatic light incidence to calculate isoclinic and isochromatic lines separately and balance the efficiency and accuracy of the six-step and ten-step phase shift methods. Through the simulation experiment of the radially compressed disc, it is verified that the proposed method has excellent anti-noise and anti-interference abilities for phase shift errors. The experimental results of the radially compressed polycarbonate discs show that compared with the traditional six-step phase shift method, the proposed method avoids the problem of isoclinic and isochromatic coupling. Furthermore, the features of the isoclinic and isochromatic images calculated by the proposed method are consistent with those calculated by the ten-step phase shift method. The average deviation of the isoclinic line is 0.01 rad, and the average deviation of the isochromatic line is 0.09 rad. The proposed method reduces the number of images, and the acquisition efficiency is improved by 40%. The effectiveness of this method is verified by repeated experiments under the conditions of changing load and disc diameter.
ObjectiveContinuous variable bright squeezed state light field is a very important quantum resource. It can be used in various domains such as quantum metrology, quantum precision measurement, and quantum information. Examples include quantum-enhanced lidars, magnetometers, quantum-dense coding, quantum key distribution, and teleportation. Applications in these domains require continuous variable bright squeezed state light fields with relatively high power. In order to obtain a continuous variable high-power bright squeezed state light field, the main factors affecting the intensity of green light-induced infrared absorption in a nonlinear periodically poled KTiOPO4 (PPKTP) crystal are studied in the process of parametric down conversion technique. Through the research on this manuscript, one of the main factors limiting the experimental preparation of continuous variable high-power bright squeezed state light field is found, which lays a foundation for overcoming the technical problem and developing continuous variable high-power bright squeezed state lights.MethodsThe experimental preparation system of continuous variable high-power bright squeezed state light field is shown in Fig. 1. The first part is the fundamental frequency light source of the experimental system, which is a high-power single-frequency Nd∶YVO4 solid-state laser of 1064 nm. The second harmonic source is a flat-concave semi-monolithic standing cavity based on MgO∶LiNbO3 crystal. The laser of 532 nm is obtained by a critical phase-matching technique in the nonlinear crystal. The second part is the core part of the experimental system, namely the optical parametric amplifier. It generates a continuous variable high-power bright squeezed state light field and is based on a semi-monolithic standing cavity composed of PPKTP crystal and a concave cavity mirror. The last part is the balanced homodyne detection part of the experimental system. The local oscillator and signal light are evenly divided and interfered on the 50/50 beam splitter and then injected into the balanced homodyne detector. The noise power spectrum of the bright squeezed optical field is measured by scanning the relative phase of the local oscillator and the signal light. In order to optimize the spatial mode distribution of the Gaussian beam in each part of the experimental system, improve the mode matching efficiency between the Gaussian beam and optical resonant cavity, and reduce the relative intensity noise and phase noise carried by the light field, we insert a three-mirror ring cavity as mode cleaner in the fundamental frequency optical path, the second harmonic optical path, and the local oscillator optical path of the balanced homodyne detection part of the experimental system. In addition, in the above preparation experiment system for continuous variable high-power bright squeezed state light field, all-optical resonant cavities and the relative phase of the light field are locked by Pound-Drever-Hall technology. The experimental preparation process of the continuous variable high-power bright squeezed state light field is as follows: the laser field output from the high-power single-frequency Nd∶YVO4 solid-state laser of 1064 nm is divided into two parts by the 90/10 beam splitter. One part, as the local oscillator, is injected into the balanced homodyne detector to amplify the noise power of the squeezed state light field. The other part is divided into two beams with equal optical power by the 50/50 beam splitter. Specifically, one is injected into the flat-concave semi-monolithic standing cavity as the fundamental frequency light to generate the second harmonic light field for pumping the optical parametric amplifier, and the other is injected into the optical parametric amplifier as the seed light to generate the bright squeezed state light field. In order to obtain a high-power bright squeezed state light field, it is necessary to increase the power of seed light. However, the high-power seed light will cause the intense absorption of high-power bright squeezed state light field in PPKTP crystal, which leads to serious thermal effects. This will bring great challenges to the precise locking of the relative phase of the pump light and the seed light, as well as the stable control of the cavity length of the optical parametric amplifier. Therefore, we design an optical parametric amplifier, which is conducive to the generation of a wide-band squeezed light field.Results and DiscussionsFinally, at the analysis frequency of 3 MHz, the bright squeezed state light field with an optical power of 200 μW and squeezing degree of (-10.7±0.2) dB is directly measured (Fig. 2). According to the experimental data and theoretical calculation, the total optical loss during the transmission and detection of the high-power bright squeezed light field is (9±0.05)%. According to Eq. (2), the escape efficiency of the optical parametric amplifier can be calculated as (66.7±0.05)%. The optical parametric amplifier's intracavity loss due to the absorption of PPKTP crystal is estimated to be (5.8±0.05)% by removing the optical loss introduced by the optical devices and the detection process, which accounts for (64.4±0.05)% of the total optical loss. According to Beer-Lambert law, the absorption coefficient of PPKTP crystal under this condition is about 6.0×10⁻² cm-1. By comparing with the experimental preparation system of the squeezed vacuum state, whose optical parametric amplifier's escape efficiency is 98.34%, and the corresponding absorption coefficient of PPKTP crystal is about 2.1×10⁻⁴ cm-1, it can be concluded that absorption of PPKTP crystal is the main reason for the increase in intracavity loss and the decrease in escape efficiency.ConclusionsAn experimental system for generating continuous variable bright squeezed light with high power is established. The bright squeezed light with the power of 200 μW and quantum noise reduction of (-10.7±0.2) dB is obtained by direct measurement at the analysis frequency of 3 MHz with a seed light power of 500 mW and light power of 145 mW pump (Fig. 2). According to the above experimental data and calculation, the total optical loss of the experimental system after the optical parametric amplifier is (9±0.05)%, and the intracavity loss introduced by the green light-induced infrared absorption effect is (5.8±0.05)%, accounting for (64.4±0.05)% of the total optical loss. Under these conditions, the absorption coefficient of PPKTP crystal to the high-power bright squeezed light is about 6.0×10⁻² cm-1, while the absorption coefficient of PPKTP crystal to the squeezed vacuum state is about 2.1×10⁻⁴ cm-1. The above research results confirm that the optical parametric amplifier's intracavity loss introduced by the green light-induced infrared absorption effect becomes the main factor affecting the quantum noise of bright squeezed light with high power. The research conclusion of this manuscript points out the technical difficulties in the current experimental preparation of high-power bright squeezed state light field and the direction for developing a bright squeezed state light field with a higher power, stronger squeezing, and more stable index.
ObjectiveThe damping of collective excitations in two-component Bose-Einstein condensates (BECs) is studied. The damping includes Landau and Baliaev mechanisms. Elementary excitation in BECs is the basic subject of statistical physics and condensed matter physics. With the development of Feshbach resonance technology in ultra-cold atomic gases and the use of highly controllable ultra-cold quantum systems, significant progress has been made in related research. The attenuation of collective excitation amplitude is called damping, which is generated by the interaction between particles. Damping is an important feature of low-energy collective excitation in the BEC experiment. Accurate calculation of damping is very important for understanding the essence of quantum multi-body physics. Since the damping of collective excitation is one of the long-term and important topics in the study of quantum multi-body physics, and the two-component BEC system has rich physical properties, the application of Hartree-Fock-Bogoliubov (HFB) mean-field theory in this paper is extended, so as to provide ideas for the smooth development of related research work.MethodsHFB mean-field theory is used, and the theoretical framework of the two-component system is constructed based on the original work of the one-component system theory. The collective excitation damping formula is derived strictly according to the original work method, including the Bogoliubov-de Gennes equations of non-condensed quasi-particles obtained by diagonalizing the giant canonical Hamiltonian. The three-mode coupling matrix element describing the interaction between particles is obtained by commutation calculation and Fourier transform of normal and abnormal quasi-particle distribution function motion equations, and the relation for the perturbed eigenfrequency and the damping rate of collective excitation are obtained by Fourier transform of collective excitation motion equations. Landau damping of collective excitation in a continuous two-component BEC homogeneous system with an ideal energy level is taken as an example, and a semi-classical approximate calculation is carried out to show the details of particle interaction. In addition, the physical significance and application method of the theory are explained.Results and DiscussionsThe main differences between the two-component system and the one-component system in the construction of the theoretical framework are analyzed. The two-component system includes three cases: two kinds of atoms of the same kind with different fine structures, two kinds of atoms of different isotopes of the same element, and two kinds of atoms of different kinds. The first two cases are not exactly the same. In the construction of the mean-field theory of two-component BECs, two different quasi-particle generation and annihilation operators are used respectively, and the Bogoliubov transform is applied to the non-condensed part operators of the two components, respectively. Although the construction of the one-component theoretical framework is complex, that of the two-component theoretical framework is more complicated. Since two different quasi-particle generation and annihilation operators are used respectively, the cross terms of two different quasi-particle generation and annihilation operators are generated after the Bogoliubov transform of the non-condensed part operators of the two components, and more approximations than the construction of the one-component theoretical framework are needed to introduce and thus diagonalize the giant canonical Hamiltonian. In the semi-classical approximate calculation process of Landau damping of collective excitation in a two-component BEC homogeneous system, the dependence of Landau damping on temperature is analyzed, and the quasi-particle transitions that contribute to damping are analyzed, including various cases between the same type of quasi-particles and between different types of quasi-particles, which are expressed by dimensionless damping functions. The contribution of quasi-particle transitions in different energy ranges to damping is analyzed and expressed by error function.ConclusionsIn this paper, HFB mean-field theory for studying collective excitation damping in BEC is successfully extended from a one-component system to a two-component system, and the application of the original mean-field theory is extended. The observation of collective excitation damping is the evidence for the realization of BECs in early magnetic trap experiments, and the theory of related one-component systems has been used to carry out more in-depth research on the coupling interaction between excitations. Similarly, further experimental research on collective excitation damping of two-component systems is also important for understanding the essence of quantum multi-body physics. Because of the complexity of the axisymmetric system in the magnetic trap, the homogeneous system in the box trap is a simple and ideal example that is easy to be calculated in the early theoretical study of collective excitation damping in one-component BECs. At present, the damping of collective excitation in one-component BECs in the box trap has been experimentally studied. With the further development of cold atom technology, the experimental study of collective excitation damping in two-component BECs in the box trap will also be conducted. It is hoped that the theoretical research in this paper can play a certain role in facilitating experimental work on two-component condensates.
ObjectiveWith the continuous development of light sources based on light-emitting diodes (LEDs), the demand for illumination has shifted from initial environmental protection and energy conservation to healthiness and comfort. Sunlight is commonly considered to be a perfect lighting source due to its full spectrum characteristic, which not only is most suitable for human visual and non-visual needs but also is widely used in plant growth experiments, phototherapy equipment research, photovoltaic cell testing, camera fill light, etc. In recent years, realizing a light source close to the solar spectrum has become a new development goal of semiconductor lighting. However, due to low algorithm accuracy and operation speed, the existing spectral reproduction methods cannot flexibly reproduce the spectrum to meet industrial needs in practical applications. Therefore, we propose a method based on a fully connected neural network (FCNN) to reproduce natural spectra with high accuracy and speed.MethodsIn this work, in order to reproduce the natural spectrum accurately and quickly, a neural network with strong nonlinear fitting ability is proposed to complete spectrum matching. First of all, according to the characteristics of the continuous wide band for natural spectra and spectral distribution for monochromatic LEDs, 23 monochromatic LEDs with different peak wavelengths and full widths at half maximum are selected to make up for the natural spectrum. Then, according to the modified Gaussian distribution spectrum fitting model and spectral superposition principle, different spectral data as the training set and test set for the FCNN model are generated by using monochromatic LEDs' spectra. On this basis, the trained FCNN model that fully reflects the proportional relationship between the synthetic spectrum and the light intensity coefficient of each monochromatic LED is constructed, which can reversely obtain LED ratio parameters from the synthetic spectrum. In other words, the method based on FCNN can obtain the corresponding proportional coefficient of monochromatic LED light intensity for the input target spectrum and then realize spectral reproduction.Results and DiscussionsFirstly, the wavelength of 380-680 nm of the standard solar spectrum as the target spectrum is reproduced by using the proposed method based on FCNN. The results demonstrate that the fitting correlation indexes of the spectrum reproduction results for the standard spectra AM1.5, CIE-D65, and CIE-A are 0.9670, 0.9812, and 0.9815, respectively (Fig. 3). In order to verify the applicability of the proposed method for different spectra, the proposed network model is used to reproduce more natural spectra measured in different time periods, which reveals that the fitting correlation indexes of the reproduction results for the spectra at 6:00, 11:00, 18:00, and 19:30 are 0.9520, 0.9627, 0.9855, and 0.9726, respectively (Fig. 4). In other words, whether it is for the measured spectrum or the standard solar spectrum, the synthetic spectrum obtained by the proposed method based on FCNN can be highly similar to the target spectrum, and the correlation index can reach above 0.95. In addition, the fitting accuracy and time cost of natural spectrum reproduction using the proposed method are further compared with that using an intelligent optimization algorithm. As a result, the method based on FCNN not only has higher accuracy stability but also requires less fitting time than the genetic algorithm (GA) for spectrum reproduction (Fig. 5). This is because the FCNN can save the network parameters and fully reflect the relationship between target spectrum and the monochromatic LED scale coefficient, and the model after training can be used directly to reproduce natural spectrum with small time costs. The results show that the average running time of the proposed method is 0.04 s, which is several times faster than the method based on GA in reproducing different natural spectra.ConclusionsIn this work, a method of natural spectrum reproduction based on FCNN is proposed to overcome the weakness of long fitting time and low accuracy stability of the current matching algorithms. After successfully training and testing the superimposed spectral data of 23 monochromatic LEDs with different peak wavelengths and full widths at half maximum, the FCNN model for natural spectrum reproduction can be constructed. On this basis, the standard solar spectrum and measured natural spectrum at different time are reproduced using the FCNN model and compared with that using the spectral matching method based on the GA in terms of the fitting time and fitting accuracy. The results show that the correlation index of the reproduction results using the proposed method based on FCNN can all reach above 0.95, and the running time required for reproduction is all less than 50 ms for different natural spectra. Furthermore, the proposed natural spectrum reproduction method based on FCNN has higher accuracy stability and requires less fitting time than the GA. Therefore, the method proposed in this work can reproduce different natural spectra stably, efficiently, and accurately, which can provide a new solution for the development of light sources in full-spectrum illumination.
ObjectiveLead sulfide (PbS) is an important semiconductor material in group Ⅳ?Ⅵ semiconductors with a narrow band gap (0.41 eV) and a large exciton Bohr radius (18 nm) at room temperature. These characteristics make PbS highly sensitive to infrared (IR) radiation, which has led to the widespread use of PbS films in IR detectors, solar cells, gas sensors, and other fields. The as-grown PbS thin films respond poorly to IR and can only be used as highly sensitive IR detectors after sensitization. Annealing in oxygen is an effective method to enhance the photosensitivity of PbS detectors, and oxygen has been proven to be the best sensitizer. Although numerous studies have been carried out on one-step annealing in an oxygen-contained atmosphere, the development of new methods to further improve thin films' responsiveness to IR continues to plague academia and industry. In this work, a new two-step sensitization treatment process for as-grown PbS thin films by the chemical bath deposition (CBD) method is investigated, in which the films are first annealed in oxygen at a low temperature and then re-annealed in nitrogen at a higher temperature. It is shown that this process can effectively improve the optoelectronic properties of PbS thin films compared with pure oxygen annealing.MethodsPbS thin films are fabricated on glass substrates by the CBD method. The reaction solution is composed of lead acetate [Pb(CH3COO)2·3H2O], trisodium citrate (C6H5Na3O7), potassium hydroxide (KOH), and thiourea (CH4N2S). The cleaned glass substrates are immersed in the deposition bath. After deposition, the samples are rinsed with deionized water and dried. The as-grown PbS films are uniform, mirror-reflective films, and subsequently, they are annealed in oxygen for 1 h at 550 ℃. Lastly, the oxygen-annealed thin films are re-annealed in nitrogen at 600 ℃ for 10 min, 50 min, 80 min, and 110 min. The Cr/Au electrodes are realized by the magnetron sputter, and the phase and crystal structure of these samples are characterized by the X-ray diffractometer. The surface morphology of the samples is observed by optical microscope and scanning electron microscope (SEM), and the thicknesses of the films are measured by the step profiler. The photoelectric properties are evaluated by a photoelectric test system with a source meter connected to a probe station at room temperature. Lasers are used as excitation sources, and a waveform generator is employed to control the switching of the lasers.Results and DiscussionsThe as-grown PbS thin film shows a dense, compact surface morphology. After oxygen annealing, the new oxidation phase is formed (Fig. 1). Some holes are observed on the surface of the annealed thin films as the re-annealing continues (Fig. 2). The grains of re-annealed thin films recrystallize to form larger nanocrystals powered by the thermodynamic driving force at high temperature (Fig. 3). The study of photoelectric properties shows that the photocurrent of samples increases before it declines with the re-annealing time at different power densities [Fig. 4 (b)]. The responsivity and specific detectivity of thin films drop as the light power density increases [Fig. 4(c) and Fig. 4(d)]. Although the number of photogenerated carriers increases with the rise in light power density, the conversion efficiency of photons into photocurrent is reduced. As the re-annealing time goes by, the values of specific detectivity and responsivity both increase first and then decrease. For a short period of re-annealing, the grains recrystallize to form microcrystals with high crystal quality, which allows the specific detectivity and responsivity values to rise. As the re-annealing time further increases, over re-annealing not only reduces the thicknesses of the films but also creates holes, which leads to lower specific detectivity and responsivity. The optimum value of specific detectivity is obtained at a re-annealing time of 80 min when the specific detectivity and responsivity values are 236% (5×109 cm·Hz1/2·W-1 to 1.18×1010 cm·Hz1/2·W-1) and 259% (0.90 A·W-1 to 2.33 A·W-1) higher than those of thin films only annealed in oxygen, respectively[Fig. 5 (c) and Fig. 5(d)]. In addition, the sample re-annealed for 80 min exhibits high-frequency switching behavior and excellent stability at 4 kHz (Fig. 6).ConclusionsIn this study, polycrystalline PbS thin films are prepared by the CBD method. The thin films are sensitized with the two-step annealing method, in which the thin films are first annealed in oxygen at a low temperature and then re-annealed in nitrogen at a higher temperature. Appropriate nitrogen re-annealing time improves photoelectric properties by improving the crystal quality of thin films. The results show that the photoelectric properties of the PbS thin films sensitized with the two-step annealing method are significantly enhanced. Compared with the case of one-step annealing, the responsivity of thin films annealed in two steps with a re-annealing time of 80 min can be increased to 2.33 A·W-1, an increase of about 259%,and the specific detectivity is raised to 1.18×1010 cm·Hz1/2·W-1, a growth rate of about 236%,under the light power density of 0.2 mW·mm-2 and incident wavelength of 1550 nm. Additionally, the sample re-annealed for 80 min shows high-frequency switching behavior and excellent stability at 4 kHz. More importantly, two-step annealing can improve the photoelectric properties of the photodetectors on the basis of the traditional oxygen-sensitized thin films.
ObjectiveInkjet printing technology has attracted extensive attention in the application of optoelectronic devices because of its low ink consumption, high-resolution pattern, and flexible production scale. However, one of the primary goals of inkjet printing is to achieve uniform deposition of functional films, which is dependent on stable ink droplet jetting. It is essential to achieve stable jetting by the adjustment to the physical properties of inks as well as the printing parameters. Much effort has been put into the development of inkjet inks, including the rheological properties of the inks, such as viscosity, viscoelasticity, and surface tension, which allows them to produce excellent spatially homogeneous films. Although the quality of the devices has been assured by better consistency in the films, they all suffer from low productivity and long cycles when printing with a single nozzle. There is an urgent need to develop new manufacturing technology with high economic efficiency for large-area uniform and efficient printing production. As a viable alternative, multi-nozzle inkjet printing not only overcomes the limitations of mass production but also provides better performance, higher prospective advantages, and lower costs. Nevertheless, many issues impede its future applications and must be addressed. One of the most challenging issues is the thickness variation of deposited films injected through multiple nozzles simultaneously. The inhomogeneity is caused by the variation in the volume of the droplets injected by different nozzles. Some researchers suggest that the issue should be addressed by a deep-learning-based strategy, which can identify and moderate the droplet jetting status of a single-jet printing process. However, this approach is unwieldy used due to unavoidable external constraints on practical applications.In the present study, printing PEDOT∶PSS is a key tactic for balancing the interaction among nozzles and overcoming the unevenness of injecting. Our work facilitates the application and development of large-scale inkjet printing technology. For the manufacturing of large-scale luminescent display panels, it is crucial to achieve stable and uniform ink droplet injection for multi-nozzle inkjet printing.MethodsIn this study, a PiXDRO LP50 multi-nozzle inkjet printing system, consisting of an optical observation system for ink droplet alignment and a printing device, is employed. The optical observation system is required for temporary regulation to align the substrate and ink droplets and correct the ink droplet condition prior to printing. Certain software is used to randomly activate and number 10 of the 128 nozzles, which all have the same basic properties, a pitch of 508 μm, and a diameter of 27 μm. To achieve stable injection and uniform droplets for multi-nozzle inkjet printing, the PEDOT∶PSS ink is used for the analysis of the multi-nozzle inkjet printing parameters, including driving high voltage VH, low voltage VL, rising edge to driving high voltage time TR, driving high voltage time TP, and falling edge to driving low voltage time TF. In addition, a method for calculating the variance is developed to investigate the behavior of droplet volume variances to reveal the influence of printing parameters on droplet uniformity in the multi-nozzle inkjet printing process. Specifically, the states of droplets injected with various printing parameters are obtained and evaluated. The optimal printing parameters are then determined by the droplet volume as a function of the printing parameters, and the relative relevance of various printing parameters is calculated by the range operation.Results and DiscussionsThe multi-ink droplets with excellent volume uniformity are obtained by the adjustment to the driving-voltage waveform parameters for inkjet printing, including driving high voltage VH, low voltage VL, rising edge to driving high voltage time TR, driving high voltage time TP, and falling edge to driving low voltage time TF. The ink droplet volume is precisely distributed in the range of 19.3-19.5 pL (Fig. 8). The variations of the volume variance of droplets injected simultaneously by multiple nozzles are evaluated, and the minimum variance of the impact of each change in an inkjet printing parameter on the volume of droplets is about 0.006. The range deviation of inkjet printing factors is determined by the minimum variance, which shows the volume uniformity of droplets injected simultaneously by multiple nozzles with different inkjet printing parameters. A small range deviation indicates that the factor has less ability to impact the collective volume variance of the injected droplets. A large range deviation means parameter changes have a greater impact on the collective volume variance of droplets. According to the range deviation of the volume variance of each group of droplets, the ability of inkjet printing parameters to affect the volume change of droplets is ranked as follows: TR, TP, VH, TF, and VL (Table 1).ConclusionsThe utilization of multi-nozzle inkjet printing to inject uniform droplets is the key to obtaining large-area luminescent layers for various types of optoelectronic devices. In this study, PEDOT∶PSS ink is used for multi-nozzle inkjet printing, and the driving voltage waveform parameters for inkjet printing, including high voltage VH, low voltage VL, rising edge time TR, peak time TP, falling edge time TF, are analyzed in detail. Moreover, the analysis of the volume variance of inkjet droplets is proposed to obtain stable and uniform inkjet droplets sprayed from multiple nozzles through the adjustment to these parameters. The minimal volume variance of many nozzles operating simultaneously is found to be approximately 0.006. The effect of driving voltage factors on droplet behavior is ranked according to the variations of the drop volume variance for multi-nozzle inkjet printing. The ability of driving-voltage parameters to affect inkjet droplet behavior for multi-nozzle inkjet printing is ranked as follows: TR, TP, VH, TF, and VL. The research provides significant guidance for realizing large-area electronic devices by multi-nozzle inkjet printing.
ObjectiveX-ray is a powerful tool to analyze the internal structure of macroscopic objects and has been widely used in many fields, such as biomolecular imaging and micro/nanostructure detection. Traditional X-ray analysis techniques often have high requirements for light flux and coherence, which are difficult to be applied in a table-top source and thus limit their application. X-ray Fourier-transform ghost imaging (XFGI) has a low requirement for spatial coherence and enables table-top X-ray microscopic detection and imaging. In recent years, researchers have focused on spatial multiplexing, non-local modulation, preset speckle field, and other aspects in the field of XFGI, and it is shown that high-quality imaging can be achieved by using preset speckle patterns at low flux. XFGI via preset speckle patterns needs to measure a mass of speckle fields, and imaging consumes time. A single speckle field has a low signal-to-noise ratio and cannot be used to retrieve the image independently. However, certain sample structure information can be extracted from the spatial distribution of the single speckle field, which can be employed to realize rapid sample defect detection. We aim to propose a method for sample defect detection by using a single speckle pattern, which will be helpful for micro/nanostructure detection and analysis.MethodsIn this paper, a defect detection method based on speckle field distribution by single detection is proposed, and the correlation coefficient between the detected speckle field distribution of test samples and standard samples is used as the evaluation function for sample defect detection. The second-order autocorrelation detection of intensity fluctuation is simulated with the energy of 1095 eV, and defect detection samples have two types: samples with ten holes and circuit samples. Since experimental noise, such as shot noise, can affect the image contrast of the speckle field, the effect of speckle contrast is analyzed under different signal-to-noise ratios. To improve the reliability of this defect detection method, this paper compares the influence of different detail enhancement methods, such as Butterworth high-pass filtering, Wiener filtering, and guided image filtering, on the correlation coefficient detection, so as to select the appropriate detail enhancement method.Results and DiscussionsSamples with ten holes and circuit samples that have rotation angles of 60° and 103°, respectively, are inserted into the optical path to get the detected speckle field distributions and then process the defect detection (Fig. 2). The matching angle and the correlation coefficient of defect detection results are consistent with the presupposition (Fig. 4). For image contrast, this paper corrects simulated speckle field distributions by gamma transform, and the correlation coefficient between detected speckle field distribution and simulated speckle field distribution will change with the image contrast correction coefficient. When the speckle field with a low signal-to-noise ratio is corrected by appropriate gamma transform, the correlation coefficient has a maximum value, which is the upper limit that this sample defect detection method can raise the correlation coefficientto (Fig. 6). For different detail enhancement methods, the results of guided image filtering are similar to Wiener filtering results in most details. However, for details inconsistent with the simulated speckle field distribution of the standard sample, the filtering results will be different from the detected speckle field distribution. The detection details corresponding to the sample defects will be weakened or even disappeared under the guidance of the simulated speckle field distribution of the standard samples. Therefore, the guided image filtering method has a better defect detection effect (Fig. 7 and Table 1). At the same time, guided image filtering can smooth signals with a lower signal-to-noise ratio to avoid the misjudgment of detection (Fig. 7).ConclusionsIn this paper, based on the autocorrelation principle of intensity fluctuation, a fast defect detection method is developed by using a single preset speckle pattern. At the same time, based on this method, the second-order autocorrelation detection optical path of X-ray intensity fluctuation is simulated, and the defect detection of samples with ten holes and circuit samples is simulated. The accurate rotation matching angle and defect detection results can be obtained. In view of the actual situation, the images will have different contrasts under different signal-to-noise ratios, and the change in the contrast will affect the reduction of the measured value of the correlation coefficient. The gamma transform can correct the contrast and improve the upper limit of the correlation coefficient when the details are enhanced, so as to improve the detection accuracy. By comparing different detail enhancement methods, this paper also finds that the details consistent with the standard image will be enhanced, and those inconsistent with the standard image will be smoothed when the guided image filtering method is used to process the detected speckle field distribution. The measured correlation coefficient of the standard samples can be increased to more than 0.95. However, the measured value of the correlation coefficient of samples with defects cannot be improved to such a level, and this property greatly improves the reliability of this sample defect detection method. In principle, this method does not require a coherent source, which makes it possible for applying table-top X-ray detection in semiconductor devices, integrated circuits, high-performance materials, and other aspects.