


Please enter the answer below before you can view the full text.
7-6=

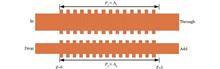
ObjectivePhase-shifted gratings are often used in the fields of biosensing, narrow-band filtering, laser, ultra-high-speed optical signal processing, and optical computing and has received widespread attention. Compared with the traditional ring resonator, the phase-shifted grating has a larger working wavelength range and can meet the requirement of narrow-band filtering of a large-bandwidth input signal. In addition, the slightly larger size also brings a larger sample contact area, which can effectively improve the sensing sensitivity. The Q value is often an important indicator for device performance evaluation. For example, in narrow-band filtering, the larger the Q value, the better the wavelength selection performance of the filter, and the purer the filtered signal frequency. In the on-chip biomedical sensors, the larger the Q value, the lower the detection limit of the sensors. Therefore, the study of high-Q phase-shifted gratings has great practical application value. Although the existing π phase-shifted grating schemes have the advantages of a simple process, a high Q value, a narrow bandwidth, and flexible adjustment, they are all reflective schemes. The reflected signals of the gratings will be output through the original input port, and an optical ring needs to be added in practical applications. A magneto-optical device such as a detector separates the reflected signal from the input signal. Adding magneto-optical devices will increase the complexity of the system, and it is difficult to integrate magneto-optic materials with silicon-based devices on a large scale, so the application scenarios of π phase-shifted gratings will also be limited. Therefore, it is of great practical significance to study the contra-directional coupling type of π phase-shifted gratings.MethodsTo reduce the use of magneto-optical devices such as optical circulators and improve integration, the Moire grating structure is adopted to achieve a high Q value and an ultra-narrow bandwidth performance. According to the refractive index distribution function of a single grating, the refractive index distribution function of the system consisting of two gratings with slightly different periods is deduced, and the refractive index distribution is a rapidly changing structure with a slowly changing envelope. From the distribution of the refractive index, it can be concluded that the π phase shift can be realized at a special position. Therefore, the numerical analysis of the structure is carried out. Since the coupling coefficient of the structure is a function of the change in the position, its spectral characteristics are calculated according to the transmission matrix method. By optimizing different parameters, it is found that the Q value and the bandwidth of the structure have obvious advantages. Therefore, the Moire grating structure is adopted to solve the problem of low Q value in the phase shift gratings.Results and DiscussionsIt is assumed that the grating period Λ1 is 312 nm, the number of gratings P1 is 521, the grating period Λ2 is 312.6 nm and the number of gratings P2 is 520. Through calculation, the 3 dB bandwidth of the contra-directional coupled phase shift grating is 0.1 nm, the extinction ratio (ER) is 19.08 dB, and the Q value is 15771, but the sidelobe suppression ratio is only 0.4 dB (Fig. 4). To further improve the sidelobe suppression ratio, the grating is optimized for apodization (Fig. 5). At this time, the sidelobe suppression of the spectral line at long wavelengths is more obvious (Fig. 6), which is caused by the uneven refractive index change (Fig. 5). At this time, the phase shift wavelength is 1547.18 nm, the Q value is 12893, the 3 dB notch bandwidth is 0.12 nm, the ER is 18.81 dB, and the sidelobe suppression ratio is 10.4 dB (Fig. 8), which are close to the performance parameters calculated by theory. After apodization optimization, the resonance wavelength is blue-shifted from the original 1577.10 nm to 1547.18 nm. To reduce the influence of apodization on wavelength shift, the part of the grating without any apodization is designed as a semi-concave and semi-convex structure (Fig. 9). At this time, the resonance wavelength is 1546.04 nm, and the resonance wavelength shifts only 1.14 nm (Fig. 10). It is proved that the designed structure can effectively reduce the influence of apodization on the wavelength shift.ConclusionsA contra-directional coupling phase-shift grating with a high-Q value and an ultra-narrow bandwidth based on the Moire effect is presented. Firstly, the distribution function of the refractive index of the designed structure is analyzed. From the distribution function, it can be concluded that the refractive index has π phase shift characteristic at a special position. The transmission matrix method is used to prove that the combination of two gratings with slightly different periods can produce a π phase shift. Then, the proposed structure is optimized, and the contra-directional coupling phase-shift spectral line witha Q value of 12893, 3 dB notch bandwidth of 0.12 nm, ER of 18.81 dB, and sidelobe suppression ratio of 10.4 dB can be obtained. The part of the grating without any apodization is designed as a semi-concave and semi-convex structure, which can effectively reduce the influence of apodization on the wavelength shift. The contra-directional coupling phase-shift grating has the advantages of small size, light weight, high Q value, ultra-narrow notch bandwidth, and high sidelobe suppression ratio, and can be widely used in the fields of biosensing, lasers, and wavelength filtering.
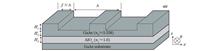
ObjectiveThe traditional vertical-cavity surface-emitting laser (VCSEL) uses distributed Bragg reflectors (DBRs) to provide high reflectivity to conform to the lasing standard. However, due to the relatively small refractive index contrast of lattice-matching material systems, many pairs of DBRs are needed to achieve high reflection, which brings difficulties and limitations to the manufacturing of VCSELs. In addition, multilayer DBRs can cause problems such as high impedance and low conversion efficiency. To improve the performance of VCSELs, researchers introduce the high-index-contrast sub-wavelength grating (HCG) as a reflector in the VCSEL. By the adjustment of grating parameters, it can have extremely high reflectivity and can replace the traditional DBRs in VCSEL. Hence, VCSELs with the HCG will not suffer from the problems of high resistance and serious light absorption caused by DBRs.In this paper, the HCG reflector for VCSELs is studied and fabricated. On the basis of the rigorous coupled wave analysis (RCWA), the polarization and reflection characteristics of a GaAs/AlOx HCG reflector are analyzed. A TE-polarized HCG is designed to have the highest reflectivity of close to 1 near 940 nm when the incident light is perpendicular to the substrate. Moreover, the influences of topography error and the incident angle on reflectivity are investigated. Then, the device is prepared by mental-organic chemical vapor deposition technology, electron beam lithography (EBL), inductively coupled plasma (ICP) etching, wet etching, and wet oxidation. Since the GaAs/AlOx HCG has the same material system as the half-VCSEL, it can be integrated with the VCSEL through one-time epitaxial technology, which is of great significance for obtaining high-quality wafers. Furthermore, the low stress between the HCG and half-VCSEL is crucial to keep the long-term stability of the device.MethodsFig. 1 shows the structure of the HCG, including the grating layer H1, stress buffer layer H2,and low index sub-layer H3, which are directly grown on the GaAs substrate. The HCG is composed of GaAs and AlOx, where the latter is obtained from AlAs by oxidation. The large index difference between the AlOx (refractive index n1≈1.6) and GaAs (refractive index n2≈3.538) grating layers is conducive to increasing the width of the reflection band. As the thickness of AlAs shrinks after oxidation, the GaAs grating layer is not completely etched to form a stress buffer layer to prevent delamination and fracture after oxidation.By the RCWA method, a TE-HCG mirror for the GaAs-based VCSEL is simulated. It can be seen from Fig. 2 that the TE-HCG has a large reflection bandwidth of up to 97 nm (Δλ/λ0=10.3%), with its TE reflectivity of more than 99.5% and TM reflectivity of lower than 90%.The simulation is based on the rectangular grating model, but the actual grating is usually trapezoidal. Therefore, we consider the influence of the grating shape on reflectivity. As shown in Fig. 3(a), although there is a 5% difference between the upper and lower fill factors, it has little effect on the high reflection band, which shows that the grating has great shape tolerance. Fig. 3(b) shows the impact of the incident angle on HCG performance. When the incident angle is greater than 5°, the reflectivity of the TE wave is significantly reduced. It is the sensitivity of HCG to the angle that makes the VCSEL integrated with HCG exhibit good single-mode performance.The HCG is prepared given the above results. Fig. 4 shows the scanning electron microscope (SEM) images of the epitaxial structure, and the thickness of GaAs and AlAs layers is 370 nm and 220 nm, respectively. After epitaxial growth, the processes are followed by wet etching, wet oxidation, EBL, and ICP etching. As shown in Fig. 5, period Λ=750 nm, f=28%, thickness H1=170 nm, thickness H2=200 nm, and thickness H3=200 nm, and they are all within the tolerance range.Results and DiscussionsDue to the limitations of test conditions, it is difficult to measure the reflectivity of the incident light from the substrate. Therefore, the reflectivity of the incident light perpendicular to the grating surface is measured. Fig. 6 shows the theoretical and measured results of the actual grating. The measured maximum reflectivity of TE-polarized light is 84.9%, which is close to the theoretical value of 86.5% under the same incident direction, while the reflectivity of TM-polarized light is lower than 40%. The test results are in good agreement with the simulations. The HCG can act as an ultra-thin reflector for VCSEL, with the advantages of a long period, a shallow etching depth, and great tolerance, which is easier to integrate with VCSEL. Meanwhile, the VCSEL integrated with the HCG features low loss, stable polarization, and single-mode operation.
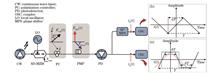
ObjectiveIn recent years, people's demands for massive information transmission and processing are increasing, which leads to technological innovation and development in satellite communication, radars, electronic military affairs, broadband wireless communication, and other fields. As a carrier of information, the high-frequency microwave signal is an inevitable development trend. In practical applications, there is a great demand not only for high-frequency microwave signals but also for microwave signal waveforms in radars, software radio, modern instruments, testing, and other fields. For example, triangle wave signals in radars can be generated by triangle waves, which can be used for range and velocity measurement of multiple targets by radar systems, and the signals can be combined with cross-phase modulation and be used for optical frequency conversion and pulse compression. Square waves can be used to form false target interference to pulse compression radars. Therefore, the realization of multi-waveform online flexible and adjustable waves becomes a future development trend. However, traditional electronic systems are faced with problems such as electronic bottlenecks, high complexity, large volume and weight, and poor flexibility, and they are easy to be affected by electromagnetic interference and will produce electromagnetic radiation. Nowadays, radars, satellite communication, and other systems tend to move towards multifunctional integration, which requires large working bandwidth, large capacity, flexible waveform generation, high carrier frequency stability, flexible tuning, and multi-channel and dynamic resource allocation, which cannot be realized by traditional electronic systems. Therefore, it is important for our research to explore efficient methods to generate high-frequency and high-quality microwave local oscillator signals and arbitrary waveform signals with a high-frequency bandwidth.MethodsA function waveform signal generator based on birefringence characteristics of a polarization-maintaining fiber (PMF) is proposed and studied. The generator adopts sinusoidal microwave signals to modulate continuous light waves, which are controlled by 45° polarization and then coupled into the PMF. By using the birefringence characteristics of the PMF, the paper introduces a controllable delay difference between two orthogonal optical field components of fast and slow axes. After the final photoelectric detection, the expression of photocurrent is composed of Fourier series cosine harmonics and sine harmonics featuring a 90° broadband bridge. Thus, the model has tunable function waveform output characteristics. Analysis shows that three variables are controlled by the generator, namely, the phase shift φ, the modulation coefficient β, and the delay difference τ, and theycan be used to adjust the harmonic coefficients of the Fourier series. The optical simulation software OptiSystem is used to build the structural diagram of the system and verify the simulation. The light source used in the system is a CW laser. The values of wavelength, power, and linewidth are set, and then the light is coupled to a signal-drive Mach-Zehnder modulator (SD-MZM) for modulation. The polarization state of the modulated signals is adjusted by a polarization controller so that the polarization state of the optical field is 45° from the polarization principal axis of the PMF. Due to the birefringence characteristics of the PMF, the two orthogonal polarized optical signals transmitted by the fast and slow axes will be transmitted at different group speeds, and the resulting delay difference is related to the access length of the PMF. According to the values calculated in the table, the access length of the PMF can be adjusted to realize the tuning of delay quantity. In order to evaluate the difference between the target function waveform and the generated waveform, the root mean square error is used to compare the similarity between the approximate waveform generated by the system scheme and the theoretical waveform.Results and DiscussionsA function waveform generator based on the birefringence characteristics of a PMF is presented and analyzed. According to the simulation experiment, trapezoidal wave signals with an adjustable top and edge (Fig. 4) and triangular wave signals (Fig. 6) with an adjustable symmetry factor are obtained, which are helpful for the application of multifunctional waveforms in high-speed signal processing. At the same time, by introducing adjustable and symmetry factors, the waveforms of triangular waves, sawtooth waves, trapezoidal waves, and rectangular waves are connected, so as to realize the output of multiple waveforms in a single system. Moreover, the proposed scheme does not need to fix the modulation coefficient, which makes the scheme have a more flexible parameter configuration and enriches the diversity of the signal generator.ConclusionsAn optical generator for generating function waveforms with high birefringence characteristics based on SD-MZM and PMF is proposed and described. By changing the delay difference τ and the phase shift φ caused by bias, trapezoidal waveforms with an adjustable top edge and triangular waveforms with an adjustable symmetry factor are generated. Compared with similar schemes, the proposed scheme does not need to fix the modulation coefficient and has a more flexible parameter configuration. The tunable performance of waveform and parameter control methods is discussed, and the simulation verification is carried out by using OptiSystem simulation software. It is found that when the root mean square error is less than or equal to 5%, the adjustable trapezoid waves (0≤δ≤30%) and the adjustable symmetrical triangular waves (20%≤σ≤80%) with better waveform quality can be obtained.
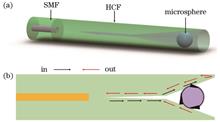
ObjectiveThe whispering-gallery-mode (WGM) microcavity sensor has the advantages of a small mode volume and a high quality (Q) factor, and thus it can be applied in high-sensitivity sensing of various physical quantities. Now, common coupling methods for exciting WGMs include prism coupling, tapered fiber coupling, and fiber end coupling. The main disadvantage of prism coupling is that the system is bulky and not easy to be applied to sensing. Tapered fiber coupling is the most common method, whose coupling efficiency can reach 99%. However, the waist diameter of the tapered fiber is too small, and the effective waist diameter should be less than 2 μm to effectively excite WGMs, which makes the overall structure fragile. The fiber end coupling features low efficiency and poor stability, and the control of the coupling angle is difficult. In this paper, an in-fiber WGM microsphere resonator is proposed, which is composed of single-mode fiber (SMF) and hollow-core fiber (HCF). The inner diameter of HCF is small, and the light intensity reflected by the fiber end after corrosion is relatively large, which can effectively improve the stability of the reflection spectrum and play a role in temperature and refractive index sensing.MethodsFirst, we use simulations to analyze the phase matching of the coupling between microsphere cavities of different sizes and fiber structure and obtain the influencing factors of the spectral shape. It is concluded that the phase difference δ can be changed by the control over the distance between HCF etching end and coupling region to obtain a better Fano profile and increase the slope. Second, in device preparation, the phases of SMF and HCF are fused, and the HCF is cut into a segment of about 2 mm by a fixed-length cutting device. The segmented HCF is then vertically immersed in a hydrofluoric acid (HF) solution with a volume fraction of 40% for etching. Third, a tapered fiber is used as a probe to pick up and move the barium titanate microspheres, which are embedded in the HCF to form a fiber-type resonator structure. In the experiment, it is found that the WGM excited in the microsphere cavity interacts with the reflected light at the HCF end, which results in Fano resonance. The resonator has both temperature and refractive index sensing capabilities. The conclusions obtained by calculation and simulation are consistent with the experimental results.Results and DiscussionsThe optical fiber simulation model is built by the beam propagation method. When the fiber length is fixed, a smaller inner diameter of HCF means stronger light intensity reflected by the fiber end (Fig. 2). In addition, the appropriate size of microspheres is selected by simulation to excite WGMs (Fig. 3). The simulation shows that the phase difference δ is the main factor affecting the spectral shape, and δ can be changed by the control over the distance between HCF etching end and coupling region to obtain a better Fano profile and increase the slope (Fig. 4). During the sensing experiment, the WGM excited in the microsphere cavity participates in the Fano resonance with a slope of -99.3 dB/nm (Fig. 9), and the cavity can sense the temperature and refractive index. In the temperature sensing experiment, the temperature sensitivity of Fano line of the resonator is 26.8 pm/℃ (Fig. 10), which is consistent with the simulation results obtained in the previous section (Fig. 5) and is higher than the sensitivity of the Lorentz line (Fig. 11). In the refractive index sensing experiment, the Fano line is degraded to the Lorentz line, and the refractive index sensitivity is -244.97 dB/RIU (Fig. 12). The calculation method of the optical path difference can be used to confirm that WGM is excited inside the microsphere cavity (Fig. 13).ConclusionsIn this paper, an in-fiber WGM microsphere resonator is fabricated and investigated, and the temperature and refractive index sensing characteristics are studied. The influence of different parameters on the shape of the Fano resonance spectrum is explored. Through simulation, the formation of the Fano profile is researched by the matching of the fiber structure and microsphere diameter with the help of the propagation constant. Moreover, the interval of the theoretical value L that can lead to a better Fano profile is calculated, which is of guiding significance for subsequent experimental operations. The experiments demonstrate the temperature and refractive index sensing characteristics of the designed structure, with temperature sensitivity of 26.8 pm/℃ and reflective index sensibility of -244.97 dB/RIU. The resonator is stable, compact, and simple to process, and this in-fiber structure is expected to be applied in complex sensing environments.
ObjectiveA multiparametric fiber optic sensor with a pull-tapered fiber modified by sensitive materials and a microcavity cascade is fabricated, and its strain, temperature, and humidity characteristics are experimentally demonstrated. The proposed microcavity is formed by a femtosecond laser scribing discharge and tapered. The interference peak of the reflection spectrum of the sensor is sensitive to the change in strain, and the experimental results show that the strain sensitivity is 4.8 pm/με, but the structure is insensitive to both temperature and humidity. After the tapered part of the structure is coated with polyvinyl alcohol (PVA) doped with graphene quantum dots (GQDs), the sensitivity of temperature and humidity is significantly improved, with the maximum temperature sensitivity of 20.4 pm/℃ and the maximum relative humidity sensitivity of 14.6 pm/%. Dip1, Dip2, and Dip3 are analyzed, and then the cross-sensitivity is eliminated by using a third-order matrix, so as to simultaneously measure strain, temperature, and humidity. The device is easily fabricated, and it has a small size, excellent linearity, and good application prospects.MethodsFirstly, the femtosecond laser pulse is focused on the single-mode fiber (SMF) with an OLYMPUS objective lens with a numerical aperture of 0.7, and the program is run to write the optical fiber core axially with a controlled writing length of 45 μm, and a fiber fusion splicer is used to discharge the fiber at the center of the inscription. The discharge current and the discharge time of the fusion splicer are set to 20 mA and 1500 ms, respectively, and the bubble is generated inside the fiber with a width of 82 μm and a length of 129 μm. Secondly, the SMF is tapered to obtain the Mach-Zehnder interferometer (MZI). The tapered area of the MZI is stretched to 277 μm, and the MZI is cascaded with a microbubble Fabry-Perot (FP) cavity to develop the required sensor device. The diameter of the tapered fiber after coating is 48 μm, and the coating thickness is 4 μm. 5 mg of GQDs and 100 mg of PVA are used, and they are mixed well, with 100 mL of pure water added. Then, the mixed solution is heated to 95 ℃ and stirred well by a magnetic stirrer for 1 h, so as to obtain the GQDs-PVA solution. After the solvent in the GQDs-PVA solution evaporates, a thin film attached to the tapered part of the sensor can be found, and its main components are PVA and GQDs. The film is observed under a scanning electron microscope, and the size and distribution of GQDs in the PVA film can be known. Finally, the initial spectrum of the sensor after coating GQDs-PVA is measured, and three resonance valleys, namely, Dip1, Dip2, and Dip3 are taken for observation and analysis.Results and DiscussionsThe temperature range of the experimental chamber is 20-100 ℃, with an accuracy of ±0.1 ℃, and the relative humidity measurement range is 10%-95%, with an accuracy of ±0.1%. The broadband light source is a spontaneous radiation source with a spectral range of 1250-1650 nm. The measurement range of the adopted optical spectrum analyzer is 600-1700 nm, with an accuracy of ±0.1 nm. The light is output from the broadband light source and transmitted to the sensor by the coupler. Then, the reflected light is transmitted back to the optical spectrum analyzer by the coupler. Dip1, Dip2, and Dip3 are selected to observe the spectral changes, and the temperature sensitivities are 16.6 pm/℃, 18.5 pm/℃, and 20.4 pm/℃, and the linearities are 0.9857, 0.9859, and 0.9867, respectively. The central wavelengths of Dip1, Dip2, and Dip3 have a positive linear relationship with humidity. The linearities are 0.9889, 0.9652, and 0.9863, and the relative humidity sensitivities are 12.6 pm/%, 13.5 pm/%, and 14.6 pm/%, respectively. The axial strain sensitivities are 4.0 pm/με, 4.3 pm/με, and 4.8 pm/με, and the linearities are 0.9993, 0.9995, and 0.9996, respectively. Finally, a third-order matrix is constructed to eliminate the cross-sensitivity between the three parameters.ConclusionsOptical fiber sensors cascaded by MZI and FPI are fabricated by femtosecond laser scribing and fiber fusion splicer discharge technology, and their three-parameter sensing characteristics are verified by experiments. The strain sensitivities at the three resonance valleys are 4.0 pm/με, 4.3 pm/με, and 4.8 pm/με, respectively, which are relatively high, with a range of 600 με. When GQDs-PVA is uncoated, the sensitivities of temperature and humidity of the sensor are almost zero. The temperature sensitivities at the three resonance valleys are 16.6 pm/℃, 18.5 pm/℃, and 20.4 pm/℃, and the measurement range of temperature is 24-80 ℃. The relative humidity sensitivities at the three resonance valleys are 12.6 pm/%, 13.5 pm/%, and 14.6 pm/%, and the measurable relative humidity range is 40%-70%. The strain, temperature, and humidity had a positive linear relationship with the corresponding central wavelength. Finally, the cross-sensitivity is eliminated by constructing a third-order matrix, and the strain, temperature, and humidity can be measured simultaneously. The proposed sensor can be easily fabricated, and it has high sensitivity and good application prospects in fields such as medical monitoring, food safety, and environmental detection.
ObjectiveIn the pulsed single-frequency fiber master oscillator power amplifier (MOPA), the stimulated Brillouin scattering (SBS) effect severely limits the increase of peak power. Although both soft glass large-mode-area fibers and tapered fibers can effectively suppress SBS, the complex manufacturing process and the relatively high requirements for use restrict their applications to some extent. Actually, large-mode-area silica fibers have been widely used in the preparation of fiber lasers due to their excellent compatibility. However, in previous work, the low doping concentration of rare-earth ions in silica fibers leads to low SBS thresholds of laser systems. In this work, a commercial silica fiber with high doping concentration is used as the gain medium, and the trade-off between SBS threshold and laser efficiency is investigated by optimizing fiber length. As a result, a single-frequency laser output with a peak power of 91 kW at 1064.4 nm is realized.MethodsA pulsed single-frequency MOPA system based on a silica fiber is built. Firstly, an electro-optic intensity modulator (EOIM) is used to modulate a continuous-wave (CW) single-frequency Yb3+-doped fiber laser, so as to generate a pulse train with a pulse width of 2.4 ns and a pulse repetition frequency of 20 kHz. The CW single-frequency fiber laser with a central wavelength of 1064.4 nm consists of a single-frequency laser seed with an output power of 30 mW and a core-pumped pre-amplifier which can boost the power of the CW laser seed to 70 mW. Due to the insertion loss of the EOIM and the low duty cycle of the modulated laser, the weak signal pulses are pre-amplified using two stage core-pumped Yb3+-doped pre-amplifiers with a 0.5-m Yb3+-doped fiber and a 0.6-m Yb3+-doped fiber (LIEKKI, Yb-300-6/125) as the gain medium, respectively. The pre-amplified laser is then modulated by an acousto-optic modulator (AOM) which is synchronized to the EOIM to remove the amplified spontaneous emission (ASE) component for higher signal-to-noise ratio (SNR) in the time domain. The laser output with an average power of 0.16 mW, corresponding to 3.3 kW peak power, is obtained after the AOM, which is further amplified by two stage cladding-pumped pre-amplifiers. The first stage cladding-pumped pre-amplifier and the second stage cladding-pumped pre-amplifier use a piece of 1.5-m Yb3+-doped fiber (Nufern, LMA-YDF-10/130-M) and a piece of 2-m Yb3+-doped fiber (Nufern, LMA-YDF-20/130-VIII) as the gain medium, respectively. The average power of the pulsed single-frequency laser seed is boosted to 45 mW and 120 mW under a pump power of 4.6 W and 2.6 W in these two stage cladding-pumped pre-amplifiers, respectively. Before being injected into the main amplifier, the single-frequency laser reaches a pulse energy of 6 μJ, with the pulse width remaining 2.4 ns and the peak power being 2.5 kW. In the main amplifier, a piece of Yb3+-doped silica fiber (Liekki, Yb-1200-30/250) with a core diameter of 30 μm, a cladding diameter of 250 μm, and an absorption coefficient of 14 dB/m at 976 nm is used as the gain medium. The coiling diameter of the active fiber is controlled to 14 cm in order to optimize the beam quality.Results and DiscussionsWith a 0.9-m active fiber used in the main amplifier, an average power of 4.37 W (Fig. 3) is obtained under a pump power of 21 W, which corresponds to an optical-to-optical efficiency of 21% [Fig. 2(c)]. The maximum pulse energy of 0.22 mJ is achieved with a pulse repetition frequency of 20 kHz, which corresponds to a pulse peak power of 91 kW (Fig. 3). The pulse width of the pulsed single-frequency laser seed modulated by the AOM and the main amplifier output with a peak power of 91 kW are both 2.4 ns, which manifests that there is no obvious distortion of the pulse waveform during the amplification process [Figs. 4(a) and 4(b)]. The measured spectral linewidth of the laser seed, namely, the full width at half maximum (FWHM), is 201 MHz [Fig. 5(a)], which is consistent with its theoretical transform-limited level. However, the spectral linewidth after amplification broadens to 279 MHz due to the self-phase modulation (SPM) effect [Fig. 5(b)]. The SNR of the laser at the maximum output power is 45 dB, and the central wavelength of the signal is 1064.4 nm [Fig. 6(a)]. Before the main amplification, the beam quality factors Mx2 and My2 in the x and y directions are 1.31 and 1.33 [Fig. 6(b)], respectively, while the beam quality factors Mx2 and My2 in the x and y directions are both 1.44 at a 91-kW peak power laser output of the main amplifier [Fig. 6(c)], which indicates that the pulsed single-frequency laser undergoes no obvious degradation in beam quality and maintains the near-diffraction-limited laser output.ConclusionsIn this work, a high-peak-power pulsed single-frequency fiber MOPA based on Yb3+-doped silica fiber is demonstrated. The influence of the active fiber length in the main amplifier on the peak power, the threshold of SBS, and the optical-to-optical efficiency of the pulsed single-frequency fiber laser is investigated experimentally. With a 0.9-m Yb3+-doped silica fiber used in the main amplifier, the pulsed single-frequency laser with an average power of 4.37 W is obtained at a central wavelength of 1064.4 nm under a launched pump power of 21 W with a pulse width of 2.4 ns and a pulse repetition frequency of 20 kHz. The maximum pulse energy is 0.22 mJ, which manifests that there is no obvious CW ASE component, and the corresponding peak power is 91 kW. The spectral linewidth is 279 MHz, and the SNR is 45 dB, with the beam quality factor M2 being 1.44 at the maximum output power.
ObjectiveOptical coherence tomography (OCT) has the characteristics of high resolution, high sensitivity and high speed. However, affected by factors such as the high scattering of tissue, the micro-movement of target, and the jitter of hardware during imaging process, OCT images always carry noise dominated by speckle noise, which reduces the accuracy of the subsequent processing. How to denoise the image to improve the image quality has been highly concerned. Current denoising methods based on deep learning are almost end-to-end, which means that the denoising degree is uncontrollable. However, the noise intensity may be different in different cases, and its uncontrollable denoising degree will lead to the reduction of the generalization ability of the model. For doctors, the denoising degree required is different depending on the patient's condition. The end-to-end deep learning network limits the autonomous control of the denoising degree. Therefore, achieving end-to-process denoising is of great significance in clinical applications.MethodsThe TMI_2013OCT dataset publicly available from Duke University is used in this work, which is obtained from the normal population and patients with age-related macular degeneration (AMD). In order to avoid the under-fitting problem of the model caused by insufficient training data, data augmentation is used to expand the size of training set to 79200 pairs. Using multi-layer convolution and deconvolution to build an autoencoder, a modularized denoising autoencoder (MDAE) is built based on the architecture of a modular deep neural network. Each autoencoder module can sequentially output a image with gradually increased denoising degree. Process results meet different usage requirements. In order to reduce the amount of parameters and improve the training speed, all modules share parameters (i.e., all modules have the same parameters). Mean square error (MSE), peak signal-to-noise ratio (PSNR) and structural similarity (SSIM) are used as evaluation metrics.Results and DiscussionsTo quantitatively evaluate the denoising capability with different number of modules (T), the MSE, PSNR and SSIM are calculated when T varies from 1 to 4 (Fig. 4). The MSE has dropped significantly after the denoising of the first module, and then is still decreased but the magnitude is getting smaller and smaller after the denoising of the subsequent each module. Both PSNR and SSIM have been greatly improved after denoising in the first module, and the magnitude gradually becomes smaller after subsequent each module. These metrics show that the proposed end-to-process model can denoise the image progressively, and T=4 is the best choice in this work after considering factors such as denoising performance and running time. To evaluate the performance of the proposed model, retinal OCT images of normal eyes are randomly selected from the test set for testing and compared with Gaussian filtering, mean filtering, block-matching and 3D filtering (BM3D), and stacked denoising autoencoder (SDAE) methods (Fig. 5). On the premise of maintaining a significant denoising effect, the proposed method preserves more image details, and has the best results in all the metrics compared to others (Table 1). To further examine the denoising performance of the proposed method on retinal OCT images of diseased eyes, images from AMD patients are randomly selected from the test set for testing (Fig. 6). After MDAE denoising, there is almost no information loss, and the image restoration is the highest. All the metrics of MDAE except time are the best among all methods (Table 2), indicating that the proposed method also has the best performance for retinal OCT images of diseased eyes. Gaussian filtering and mean filtering methods have absolute time advantages with very little calculation, but the denoising effect is very unsatisfactory. The BM3D method is the most time-consuming, and the average time to process an image is close to 7.0 s, which is unbearable in practical clinical applications. The average time for MDAE method to process each image is about 0.26 s. Although it has no advantage compared to other methods and is far from the requirement of real-time denoising, denoising usually belongs to the post-processing stage of a image, and this time consumption is still at an acceptable level.ConclusionsCompared to the original retinal OCT image without processing, the PSNR of the denoised result obtained by the proposed method is increased by 11.32 dB and 12.08 dB for the images from normal eyes and diseased eyes, respectively, and the noise level is greatly reduced. This provides the possibility for subsequent high-precision image processing and analysis. The proposed method can control the denoising degree by controlling the number of modules, so as to be more suitable for complex clinical applications. At the same time, the proposed method only relies on the parameter T to control the denoising degree without adjusting other parameters, which saves the user's learning cost and is very friendly to doctors who focus on clinical tasks.
ObjectiveHyperspectral image classification aims to assign feature labels to each image element in images. Nowadays, several classification techniques are applied in hyperspectral classification, such as support vector machines (SVMs), polynomial logistic regression, and neural networks. In recent years, sparse representation has proven to be a powerful tool for solving problems such as face recognition and image super-resolution. The basic assumption of sparse representation is that if a class has enough training samples, the test samples belonging to this class can be represented by using a linear combination of the training samples from this class. Sparse representation classification obtains the sparse representation parameters by the sparse representation of the test samples and calculates the reconstructed residuals for each class of the training samples, which thus determines the class of the test samples. The sparse representation usually pays more attention to the spatial information of the neighborhood of the test image elements and ignores the spatial information of dictionary atoms. The proposed weighted joint sparse representation hyperspectral image classification algorithm based on the spatial-spectral dictionary (SSD-WJSRC) addresses the problem that the spatial-spectral information of dictionary atoms is underutilized.MethodsSSD-WJSRC algorithm makes full use of the spatial-spectral information of dictionary atoms. Firstly, the superpixel segmentation is performed by using the entropy rate superpixel segmentation (ERS) algorithm on the principal component image to obtain the superpixel segmentation map. Secondly, the spatial-spectral joint distance between the test image elements and the dictionary atoms is calculated, and the spatial-spectral joint distance is jointly determined by the spatial distance and the spectral angle distance. Then, image elements are added in the superpixel neighborhood corresponding to the first K dictionary atoms to the spatial-spectral dictionary as sub-dictionaries. Meanwhile, in the joint sparse model, different weights are used for the superpixel neighborhood image elements of the test image elements, and the weights are calculated from the Gaussian kernel distance, and the Gaussian kernel can be used to capture the distance of nonlinear information to measure the similarity between samples. Finally, a weighted sparse representation model is constructed on the spatial-spectral dictionary, which solves sparse coefficients by using the simultaneous orthogonal matching pursuit (SOMP) algorithm, and the reconstructed residuals are calculated. Furthermore, the classification results are determined.Results and DiscussionsSeveral important results are obtained as follows. Firstly, The experimental results from the Indian Pines and Salinas datasets show that the proposed SSD-WJSRC can effectively improve the classification accuracy by 97.60% and 98.01%, respectively. The spatial-spectral constraint is adopted to realize the full utilization of the pixel spatial-spectral information of the dictionary and generate a better expressive spatial-spectral dictionary. The proposed method can also improve the misclassification by using spatial information in the case of high spectral similarity of features (Figs. 6 and 7). Secondly, the proposed method reduces the influence of irrelevant pixels in the neighboring pixels on the sparse model by weighting the neighboring domains and effectively improves the classification accuracy in the neighboring regions of different features and at the edges of the features. When classifying feature types with few samples, the proposed method makes full use of the neighborhood information of the samples to ensure classification accuracy (Figs. 6 and 7). Thirdly, the effects of different balance coefficients, number of superpixels, and sparsity on classification accuracy are also analyzed (Figs. 8-10). Finally, in order to verify the effect of the constructed spatial-spectral dictionary on sparse representation classification, ablation experiments are performed. The classification results obtained with the same selection of test image elements and dictionary atoms are shown in Table 5. It can be seen that there is a certain decrease in classification accuracy without constructing the spatial-spectral dictionary, which proves that the spatial-spectral dictionary can effectively improve classification accuracy.ConclusionsThe proposed SSD-WJSRC makes full use of the spatial and spectral information of the dictionary atoms' neighborhoods. The dictionary atoms with high spatial and spectral similarity to the test pixels are selected as the adaptive dictionary, and the superpixel neighborhoods of the dictionary atoms are extended to an adaptive dictionary to form a spatial-spectral dictionary. Different weights are assigned to the superpixel neighborhoods to reduce the influence of the irrelevant image elements on the sparse representation results, and a weighted sparse representation model is constructed on the spatial-spectral dictionary to obtain the classification results. The simulation results on Indian Pines and Salinas datasets show that the accuracy of the proposed algorithm is higher than that of traditional algorithms such as K-Nearest Neighbor (KNN) algorithm, and it has better classification results with fewer samples than current deep learning methods.
ObjectivePhotoacoustic imaging (PAI) is an emerging imaging modality that provides structural and functional information on biological tissue, with the advantages of high contrast of optical imaging and high penetration depth of ultrasound imaging. Photoacoustic endoscopic imaging is an endoscopic application of PAI, which combines non-invasive PAI with endoscopic detection technology. This imaging modality is physically based on the photoacoustic effect of biological tissue illuminated by short laser pulses. The absorbed optical energy density is proportional to the product of the optical absorption coefficient and the local light fluence. Therefore, light fluence is related not only to the optical properties of the tissue but also to the distribution of irradiation intensity. The optical properties of the tissue cannot be accurately reflected in the distribution image of absorption energy density. By solving the optical inverse problem, the optical property parameters can be estimated quantitatively to realize quantitative imaging. Due to the complex optical properties of tissue and non-uniform and non-stationary illumination, photoacoustic image reconstruction is subject to non-uniform light fluence, which leads to a reduction in image quality and imaging depth. The purpose of this work is to solve the problem of reduced accuracy of quantitative imaging due to light fluence variation.MethodsA quantitative image reconstruction method for photoacoustic endoscopic imaging is presented to correct light fluence variation. It employs a two-step scheme. Firstly, the distribution of absorbed optical energy density on the cross-section of the tubular object is recovered from the photoacoustic signal measured by the ultrasonic detector with conventional image reconstruction methods such as back projection and time reversion. Secondly, the sparse representation of the distribution of absorbed optical energy density is constructed by the weighted sum of a finite number of discrete Curvelet and Haar joint basis functions. The sparse representations of the absorption coefficient and light fluence are then obtained by the greedy algorithm. In addition, the absorption coefficient and light fluence distributions are reconstructed simultaneously by sparse matrix decomposition.Results and DiscussionsThe method has been verified by simulation and phantom studies. The comparisons with the one-step method, model-based method, and state-of-the-art fluence compensation method demonstrate the superiority of the proposed method in recovering optical coefficient distribution with high accuracy. The simulations show that the one-step method has a large error when estimating the absorption coefficient, and the reconstructed image cannot distinguish different tissue types clearly. In the images reconstructed by the Bregman method, significant overlap between different tissue regions can be observed. The images reconstructed by the perturbation Monte Carlo method show the low contrast of tissue boundaries in the low-fluence region. The proposed method is superior to other methods in recovering the absorption coefficient closest to the ground truth. In the phantom study, due to similar optical properties of the two materials used to fabricate the phantom, the overall contrast of the image representing the distribution of absorbed optical energy density is low, and it is difficult to distinguish the contours of the embedded targets. In contrast, images showing the distribution of absorption coefficients can clearly distinguish the contours of the targets. In addition, compared with other methods, the proposed method can achieve the highest accuracy in absorption efficient estimation. Simulation and experimental results on the phantom reveal that the root mean square error (RMSE) of the absorption coefficient estimated with this method can be reduced by about 48%, and the normalized mean square absolute distance (NMSAD) and structural similarity (SSIM) of the reconstructed images can be reduced by about 25% and increased by about 24%, respectively, compared with the one-step method and model-based method. The comparisons with the state-of-the-art fluence compensation method show significant improvements in RMSE, NMSAD, and SSIM metrics by about 22%, 20%, and 10%, respectively.ConclusionsThis work presents a joint reconstruction method of the absorption coefficient and light fluence distribution based on sparse decomposition to construct the distribution of absorbed optical energy density. The method shows advantages over the one-step method based on exact solutions, the model-based method, and the state-of-the-art fluence compensation method in recovering absorption coefficient distribution with high accuracy. Furthermore, the quantitative reconstruction accuracy of the proposed method is not sensitive to the recovery of the absorbed optical energy density and the similarity measurement of sparse decomposition. It should be noted that the optimization algorithm for sparse reconstruction influences the reconstruction accuracy, among which the accuracy of multi-candidate orthogonal matching pursuit (MOMP) and Dice orthogonal matching pursuit (DOMP) is higher than that of matching pursuit (MP) and basis pursuit (BP). Future work should involve the following two aspects. One is to verify the feasibility of this method in clinical transplantation through in vivo experiments. The reconstruction accuracy should be further improved with comprehensive consideration of non-ideal factors in practical application scenarios, such as limited-view sparse-sampling measurement, acoustic reflection and scattering, motion artifacts caused by cardiac motion in intracoronary photoacoustic imaging, and characteristics of ultrasonic detectors. The other is to attempt to apply deep learning to eliminate the influence of light fluence variation on PAI quality.
ObjectiveOptical coherence tomography (OCT) is a non-invasive optical imaging technology. In recent years, it has become a research hotspot of biological imaging and has been widely used in the field of medical diagnosis. As an imaging technology based on the principle of low coherent light interference, OCT is susceptible to speckle noise. Speckles will destroy details of OCT images and reduce image quality, which imposes significant limitations on the clinical application potential of OCT. Superposition is a common method to reduce additive white noise. However, speckle noise belongs to the multiplicative noise. In order to suppress speckles more effectively, it is necessary to use speckle decorrelation technology to reduce the speckle correlation between images for superimposition, which is called the decorrelation superimposition method. Decorrelation superimposition can improve the speckle signal-to-noise ratios of superimposed images. Up to now, researchers have proposed a variety of speckle decorrelation technologies, but they face the following limitations: the number of available decorrelation images is limited; the overall system is bulky, complex, and expensive; the transmitted light power is greatly lost, and illumination variability during two-dimensional scanning is introduced. In this study, a speckle decorrelation OCT system using a pure random phase plate (PSD-OCT) is reported. The system uses a tailored pure random phase plate (PRPP) to achieve speckle decorrelation, which can avoid the loss of light power and the introduction of illumination variability, and has a simple and low-cost structure. PSD-OCT helps obtain low-noise imaging results.MethodsThe PSD-OCT system is built based on swept-source OCT. The system uses a PRPP to modulate the wavefront phase of the sample light, and changes the gray value characteristics of speckles when images for superimposition are collected to realize speckle decorrelation, so as to provide low correlation images for decorrelation superposition method and reduce OCT speckle noise. PRPP is a specially designed binary diffractive optical element used to modulate the wavefront phase of OCT, with periodic random phase distribution of 0-2π in the radial direction. The PRPP is placed on the focal plane between the scanning lens and the subsequent lens of a sample arm. Due to the conjugate relationship, the object plane of the imaging sample and the modulation plane of the PRPP are object-image conjugate planes. When the sample is continuously collected at the same imaging position, PRPP moves on the plane perpendicular to the optical axis to change the wavefront phase distribution of the illumination and scattered light of the sample arm, and then realizes the random phase modulation of the object plane through the conjugate relationship. The phase shift of PRPP with time changes the OCT speckle pattern, which makes each image have different speckle patterns, realizes decorrelation superimposition, and reduces speckle noise.Results and DiscussionsThe simulation results of the three-layer scatterer (Fig.1) show that when the image is decorrelated and then superimposed, the speckle phenomenon of superimposed images is well suppressed, and the tomographic boundary between layers is clearer. In addition, the speckle signal-to-noise ratio is increased by 1.5 times. The result demonstrates that decorrelation superimposition can reduce noise. It can be seen from the imaging results of the scatterer model that PRPP reduces the correlation coefficient between multiple images used for superimposition from 0.93 to 0.49 (Fig. 5), which is close to the ideal result of the simulation (0.42). Such results demonstrate that the PSD-OCT system has a nearly ideal speckle decorrelation effect. After speckle decorrelation, the signal-to-noise ratios of superimposed images are significantly improved, and speckle noise is smoothed. By comparing the imaging results of human nails and fingertip skin of traditional OCT and PSD-OCT (Figs. 7 and 8), it can be seen that compared with traditional OCT, the granular speckle noise in the superimposed images obtained by PSD-OCT is suppressed, and tomographic structure features between tissues are clearer. To sum up, our experimental results show that PSD-OCT can reduce speckle correlation, improve the speckle signal-to-noise ratio, and observe finer and clearer biological structures.ConclusionsIn this study, a speckle decorrelation OCT technology using PRPP as a phase modulator is proposed, and a low speckle OCT imaging in vivo is successfully realized by using the decorrelation superposition method. PRPP modulates the wavefront phase distribution of the sample light by generating a time-varying phase shift, and it has excellent speckle decorrelation ability, which makes superposition effectively reduce the impact of speckles on imaging and thus enhances the visual visibility of OCT images. The low signal loss rate introduced by PRPP can avoid the image contrast reduction and illumination variability caused by additional optical devices during operation. Our study shows that compared with traditional OCT, PSD-OCT has achieved a remarkable speckle suppression effect with a simple and compact structure. This system can reveal details of samples originally covered and damaged by speckles, and can more clearly show the fine structure and chromatographic characteristics of biological tissues. PSD-OCT has a wide application prospect in the biomedical imaging field, which will enable doctors to diagnose related diseases more accurately and reduce the difficulty of algorithms including OCT image enhancement, contour extraction, and so on.
ObjectiveExtreme ultraviolet (EUV) lithography has been introduced into high-volume manufacturing (HVM) of chips with a technology node of 7 nm and below. As the technology nodes of chips decrease, the structure of the EUV mask is becoming more and more complex. The defects in EUV masks degrade the mask imaging quality, which is one of the most critical problems affecting the yield of EUV lithography. Phase defects refer to the deformation of the EUV mask multilayer caused by the defects situated at the bottom of the multilayer. Phase defects of nanometer size can lead to a distinct phase shift of the reflected field and seriously degrade the aerial images. Defect compensation methods can be adopted to indirectly compensate for the degradation of imaging quality caused by the phase defects. Accurate inspection of the type, location, and profile of phase defects is the prerequisite for effective defect compensation. A method to inspect the type, position, and surface profile of phase defects in EUV masks on the basis of aerial images is proposed in this paper. The accuracy of the proposed method is verified by simulations.MethodsDeep learning models are adopted to construct the mapping between aerial images of defective mask blanks and defect information. After that, the type, location, and profile of phase defects can be obtained from the aerial images of defective mask blanks by the trained models. The inspection model for the type and location of defects is built by the construction of the relationship between the type and location of defects and the aerial images of defective mask blanks with the convolutional neural network (CNN) model. On this basis, the aerial images are intercepted according to the obtained location of defects. The inspection model for the surface profile parameters of defects is constructed with the spectrum information of the intercepted aerial images and the multilayer perceptron (MLP) model.Results and DiscussionsA test group containing 256 defective mask blanks is utilized to verify the accuracy of the proposed method. The phase defects in the multilayer can be accurately classified into bump defects and pit defects by the trained CNN models (Fig. 6). The mean absolute error (MAE) of the x coordinates of the phase defects is 1.38 nm, and the MAE of the y coordinates is 0.74 nm, which indicates that the inspection accuracy of the y coordinates is higher than that of the x coordinates. The simulations show that the inspection accuracy of the location of bump defects is higher than that of pit defects (Fig. 7). For bump defects, the MAE of the surface height is 0.06 nm, and the MAE of the surface full width at half maximum (FWHM) is 0.55 nm. For pit defects, the MAE of the surface height is 0.12 nm, and the MAE of the surface FWHM is 0.57 nm (Fig. 8). Noise is added to the aerial images in the test group to examine the robustness of the trained models. The results reveal that noise lowers the accuracy of the trained models, and the inspection model for the type and location of defects is more robust to the noise than the inspection model for the surface profile parameters of defects.ConclusionsIn this paper, a method based on aerial images is proposed to inspect the type, location, and surface profile parameters of phase defects in the EUV mask multilayer. CNNs are adopted to construct the relationship between the type and location of defects and the aerial images of defective mask blanks. In this way, the CNN-based inspection model is constructed to inspect the type and location of defects. The aerial images are intercepted according to the obtained location of defects. MLP is adopted to construct the relationship between the surface profile parameters of defects and the spectrum information of the intercepted aerial images. In this way, the MLP-based model is built to inspect the surface profile parameters of defects. The simulations show that the inspection results of the proposed method are accurate. The CNN-based model used to inspect the type and location of defects is robust to the noise, and the MLP-based model used to inspect the surface profile parameters of defects is sensitive to the noise.
ObjectiveThe accuracy of wave plates has a significant influence on the performance of polarized optical systems, and thus the high-accuracy measurement of their phase retardation and fast axis azimuths is required. Many wave plate measurement methods at present are based on the principle of light intensity measurement. The measurement accuracy is easily affected by light intensity fluctuations, and the requirements for light source and stability of light path are high. Quite a few methods among them cannot measure the fast axis azimuth of the wave plate at the same time. Therefore, many researchers have also studied other measurement methods, such as laser feedback method, to improve the performance of wave plate measurement. In this study, a high-accuracy wave plate measurement method based on dual-frequency laser interferometry and phase detection is proposed. It has good advantages of wave plate measurement.MethodsA dual-frequency laser heterodyne interference optical path is constructed by using a rotatable half-wave plate and a corner prism in this study (Fig. 1). The relationship between the phase retardation of the wave plate to be measured and the phase difference between the measured signal and the reference signal is obtained by Jones matrix method. During the measurement, the phase retardation and the fast axis azimuth of the measured wave plate can be obtained by rotating the half wave plate, monitoring the change of phase difference between the measured signal and the reference signal through a phase meter, and recording the maximum value and minimum value as well as the corresponding fast axis azimuth of the half wave plate.Results and DiscussionsError analysis shows that the measurement uncertainty of the phase retardation is about 3.9', and that of the fast axis azimuth is about 5'' under the experimental conditions. The experimental comparison results indicate that the result of the proposed method is in good agreement with that of other methods. The repeated experiments show that the measurement standard deviation is about 2'. The measurement is not affected by the azimuth accuracy of birefringent devices such as wave plates and polarizers in principle. The common optical path structure is one of the advantages of the proposed measurement system, so the measurement is highly stable. The signal processing adopts the phase detection means which has higher accuracy than intensity detection means. In addition, the proposed method has the advantages of few components, a simple structure and a quick measurement process.ConclusionsWave plates are important optical components, whose accuracy has a significant influence on the performance of polarized optical systems. Therefore, the high-precision measurement of the phase retardation and fast axis azimuth of the wave plate is required. A high-accuracy wave plate measurement method based on dual-frequency laser interferometry and phase detection is proposed in this paper. A dual-frequency laser heterodyne interference optical path is constructed by using a rotatable half-wave plate and a corner prism. It can accurately measure the phase retardation and the fast axis azimuth of an arbitrary wave plate. The measurement is not affected by the azimuth accuracy of birefringent devices such as wave plates and polarizers in principle. The common optical path structure is one of the advantages of the measurement system, so the measurement stability is good. The signal processing adopts the phase detection means which has higher accuracy than intensity detection means. The measurement formulae are deduced and the measurement system is built. Error analysis reveals that the measurement uncertainty of the phase retardation is about 3.9', and that of the fast axis azimuth is about 5'' under the experimental conditions. The experimental comparison results indicate that the result of the proposed method is in good agreement with that of other methods. The repeated experiments demonstrate that the measurement standard deviation is about 2'. In addition, the presented method has the advantages of few components, a simple structure and a quick measurement process.
ObjectiveFringe projection profilometry (FPP) has been widely used in dynamic three-dimensional (3D) morphology measurement. Nevertheless, its application in transient and complex dynamic scenes is weakened by the low measurement efficiency and poor robustness of the traditional methods. As one of the simplest approaches to eliminating phase ambiguity, the Gray code-based temporal phase unwrapping method codes fringe orders f with serial binary Gray-code patterns on the time axis. In static scenes, the Gray code-based method is able to analyze highly discontinuous objects because each spatial pixel of the measured object is unwrapped independently. Another advantage of this method is that noisy pixels remain isolated and do not spread to ruin the entire unwrapped phase. However, since M patterns can be used to code 2M phase orders at most. Consequently, the entire duration of data acquisition is significantly prolonged, rendering the Gray code-based method inefficient in some time-critical situations such as online inspection and real-time scanning. Furthermore, blurred pattern edges caused by optical defocusing are also a source of additional errors. Pixels incorrectly unwrapped at the partial boundary between adjacent Gray-coded image areas are common. The intrinsic superiority of Gray codes in robustness and anti-noise ability appears to be no longer obvious in dynamic scenes. This study proposes an efficient and robust 3D measurement method based on time multiplexing structured light coding.MethodsThe basic idea of time multiplexing light coding in the present study is reorganizing pattern arrangement and reusing fringe patterns and Gray-code patterns on the time axis. The coding process starts by reordering the four-step phase-shifting fringe patterns according to the initial phase order: π/2, 0, π, and 3π/2. Subsequently, M Gray-code patterns are inserted into the gaps among the phase-shifting fringe groups, resulting in a phase shift value of π between two nonadjacent fringe patterns. Then, the combination of one Gray-code pattern and two phase-shifting patterns are called a sequence unit, and it has a corresponding number n on the time axis. Finally, considering the odevity of M, the cyclic sequence units shall be looped end to end to make full use of the projected pattern and obtain as many 3D reconstruction results as possible. The decoding process starts by calculating the average of the fringe patterns from two adjacent units respectively to obtain the background light intensity. Then, the truncated phase is calculated in each unit with the background light intensity. Furthermore, the phase order is calculated with the closest four Gray-code patterns on the time axis, and the unwrapped phase is obtained with the truncated phase and the phase order. The proposed method reduces the number of required patterns and improves coding efficiency. As a result, the number of projected sequential patterns required for updating a new 3D result is reduced to three. With the help of a high-speed projector and a synchronous camera in the aspect of hardware and the generalized tripartite phase unwrapping method in the aspect of algorithm, the blur caused by motion and defocusing can be suppressed greatly in principle. The combination of the above parts all together paves the way for high-robustness and high-speed 3D morphology measurement.Results and DiscussionsThe results of the experiments of striking a badminton ball and pinching a rubber ball with hands prove that the proposed method can efficiently reconstruct 3D morphologies in complex dynamic scenes. The comparison and analysis of the results of measuring different objects with the binary Gray code and the quaternary Gray code confirm that the binary Gray code-based method, with greater robustness and higher anti-noise ability, is more suitable for complex high-noise dynamic scenes where the shooting speed is much higher than the speed of the objects. They also prove that the multi-grayscale Gray codes represented by the quaternary Gray code are more resistant to motion-induced blur and are thus more applicable for reconstruction in dynamic scenes featuring fast speed and lower environmental noise.The following observations can be made from the experimental results: 1) the proposed method can update a new 3D result with every three more patterns in dynamic measurement and finally reconstruct 3D morphology at 3174 frame·s-1; 2) compared with multi-grayscale Gray codes, the binary Gray code-based method offers a longer decoding sequence, a higher anti-noise ability, and lower resistance to motion-induced blur. Therefore, it is more suitable for complex dynamic scenes featuring measuring speeds much higher than the objects' speeds.ConclusionsThis study proposes a 3D measurement method based on the time-multiplexed Gray-code coding technique assisting phase-shifting fringes. Through multiplexing phase-shifting fringe and Gray-code patterns in time, the study calculates the background light intensity and the phase order successively. Then, the truncated phase is calculated in a pattern sequence unit n with the background light intensity, and the continuous phase is further obtained by decoding the phase order. Breaking through the application limitation of low measurement efficiency and weak robustness on traditional structured-light coding methods in dynamic scenes, the proposed method provides a feasible technical scheme for efficient and robust 3D morphology measurement in complex dynamic scenes.
ObjectiveIn the three-dimensional measurement technology of structured light, traditional sinusoidal fringes are lost due to the nonlinear gamma effect of digital micromirror projectors and industrial cameras, which results in phase errors and thus reduces the measurement accuracy and effect. With only two gray values, the binary fringe is not affected by the nonlinear system and can greatly improve the projection speed, and hence, it is widely studied by scholars both at home and abroad. Binary fringe defocused projection technology is widely used in three-dimensional topography measurement. In this technique, the gray sinusoidal fringes of eight bits are discretized and quantized into the binary fringes of one bit, and the sinusoidal fringes are obtained at the imaging end by the micro defocus of the projector. This method can reduce the nonlinear effect of the projector and significantly improve the measurement speed, but it can hardly grasp the defocus degree and will reduce the depth range of measurement. Given the advantages of binary fringes, this paper proposes a measurement method based on binary coded fringes. This method can combine the binary fringes with the phase-shifting technique without defocused projection to improve the measurement accuracy and effect.MethodsThis paper proposes a measurement method based on binary coded fringes. The modulation information of the measured object surface is obtained by the projection of multiple binary fringes, and then the sinusoidal fringes are generated by the binary superposition of binary fringes. The projection of binary fringes can avoid the direct projection of sinusoidal fringes and reduce the influence of the nonlinear system. First, the gray value of the traditional sinusoidal fringe that changes sinusoidally in a period is sampled to obtain the discrete decimal gray value of the sinusoidal fringe. The gray value is encoded in binary, and all the code words of the same rank of binary encoding are combined separately to generate binary fringes. Second, the sequential projection is carried out by the digital projector, and the collected fringes are superimposed in binary to generate the sinusoidal fringes modulated by the height information of the object to replace the process of directly projecting the traditional gray sinusoidal fringes. Third, the wrapped phase is obtained by the combination of the proposed method and the four-step phase-shifting technique, and the phase is unwrapped by the complementary Gray-code method to obtain the absolute phase. Through projector and camera calibration, the absolute phase is mapped to three-dimensional point cloud data.Results and DiscussionsTo verify the superiority of the three-dimensional measurement method based on binary coded fringes, this paper uses the binary coded fringe method combined with the four-step phase-shifting technique to measure different objects and carries out a comparison experiment with the traditional four-step phase-shifting method and twelve-step phase-shifting method. In terms of accuracy evaluation, the standard sphere with a diameter of 50.8140 mm is measured, and the local point cloud data is fitted. The average distance between the point cloud data of the proposed method and the fitted standard sphere is 0.0697 mm, while that of the traditional method is 0.1288 mm. Compared with the results of the traditional methods, the accuracy of the proposed method is significantly improved, and the average distance is reduced by 45.88%, as shown in Fig. 5 and Table 2. The measurement of the high-precision plane and the linear fitting of the local data show that the root mean square error (RMSE) of the proposed method is 0.1211 mm, and the sum of the squared error (SSE) is 2.922 mm, as shown in Fig. 7 and Table 3. By the measurement of large-depth objects, the proposed method greatly reduces the periodic errors caused by nonlinear influences compared with the traditional method based on four-step phase-shifting, and the effect is similar to that of the twelve-step phase-shifting method. The local reconstruction results are shown in Fig. 8.ConclusionsIn this paper, a measurement method based on binary coded fringes is proposed. Multiple binary fringes are obtained by binary coding of the gray values within a sinusoidal period, and the modulation information of the measured object is obtained by binary fringe projection, and the collected binary fringes are superimposed in binary. This can replace the direct projection of traditional sinusoidal fringes and fundamentally reduce the measurement error caused by the nonlinear gamma effect. In addition, the proposed method is combined with the four-step phase-shifting method, and the complementary Gray-code method is used to assist in phase unwrapping. The comparison with the traditional four-step phase-shifting method and the twelve-step phase-shifting method demonstrates that the accuracy of the proposed method is significantly higher than that of the traditional four-step phase-shifting method, and on the basis of the principle of four-step phase shifting, the nonlinear effect is reduced. The proposed method not only retains the advantages of the four-step phase shifting but also achieves a similar effect as the twelve-step phase shifting method. Although the proposed method increases the number of projected fringes to a certain extent, it still effectively improves the projection efficiency compared with the projection of gray sinusoidal fringes. However, compared with the traditional method, the proposed method has some shortcomings in the projection. Further research is required to reduce the overall projection number of binary coded fringes. In conclusion, replacing gray sinusoidal fringes with binary coded fringes is a meaningful research idea and can be applied to actual three-dimensional measurement.
ObjectiveMueller matrix of targets can reflect the change in the polarization state of the light in the propagation process, and it contains the polarization characteristics of the target itself, such as polarizance and depolarization. In the analysis of the characteristics of the Mueller matrix, most studies analyze the polarizance and depolarization characteristics separately. But in the process of theoretical derivation, it turns out that the two characteristics are independent of each other. Therefore, it is necessary to define a new index that can comprehensively evaluate the two characteristics.MethodsIn view of the shortcomings of the existing Mueller matrix measurement systems, this paper, based on the working principle of a polarization analyzer, improves and builds a rotating Mueller matrix measurement system. Then, the linear operation of the change in the polarization state is realized by transforming the propagation process of the light into a correlation semi-positive definite quadratic function, and a novel index is proposed to comprehensively evaluate the polarizance and depolarization characteristics of the Mueller matrix. In addition, we use a polarizer to verify the derived index and test the effectiveness of its comprehensive representation of the polarizance and depolarization characteristics. According to Mueller matrices of different targets published in the literature, their ability to identify targets during target detection is verified. Finally, Mueller matrices of aluminum plates under different incident angles and roughness are measured. The effect of incident angles and roughness on the Mueller matrix is analyzed by defining the influencing factor Q of roughness on polarization characteristics and stability S of the polarization characteristics to incident angle.Results and DiscussionsFrom the analysis results, it can be concluded that leaves, sand, soil, and glass of natural objects have weak polarizance characteristics, strong depolarization characteristics, and strong retained depolarization characteristics, and their values are close to 1. Therefore, all of them can be approximated as a complete depolarizing system. Artificial target dielectric, smooth steel plate, rough steel plate, camouflage coating, and camouflage cloth have relatively strong polarizance characteristics but relatively weak retained depolarization characteristics, with 1PΔ2. They belong to a retained depolarizing system, and the dielectric can be approximated as a nondepolarizing system. The camouflage coating is a complete polarizing system (Fig. 3 and Table 1). As the roughness increases, PP, PD, and PM of the aluminum plates get smaller. In other words, weaker polarizance characteristics are accompanied by stronger depolarization characteristics. Theoretically, stronger retained depolarization characteristics of the aluminum plates can be obtained, and their values get smaller, which is consistent with the rule in Fig. 5 (d). Under different roughness, with 1PΔ2, all aluminum plates are in the range of the retained depolarizing system. In view of other characteristics, as roughness gets smaller, aluminum plates tend to be a nondepolarizing system, and as the roughness increases, aluminum plates tend to be a complete depolarizing system (Fig. 5).ConclusionsBy converting the degree of polarization into a correlation semidefinite quadratic function, the linear calculation of the reflection process of incident light with different polarization states on the target surface is realized. In view of the problem that the traditional evaluation indexes of the Mueller matrix can only be used to evaluate the polarizance and depolarization characteristics, the retained depolarization characteristics and PΔ are defined, and the polarization characteristics of the target Mueller matrix in different definition ranges are analyzed, so as to realize the comprehensive evaluation of the polarizance and depolarization characteristics of the target by using one index. The proposed index is verified by using polarizers with different extinction ratios and published data. The results show that the index can not only define polarizers with arbitrary extinction ratios but also play a positive role in target recognition during target detection. Finally, the Mueller matrices of three groups of different roughness under different incident angles are measured experimentally. The influence factor Q of the roughness on different polarization characteristicsof the aluminum plates and the stability S of aluminum plate polarization characteristics with the increase in incident angle are defined, and the influence of roughness and incident angle on the target Mueller matrix elements and polarization characteristics is explored. The results show that when the roughness is small, the influence degree on the polarization characteristics of the target Mueller matrix is greater than that under a large roughness, and the influence factor decreases with the increase in the roughness. As the incident angle increases, the stability of the index related to the depolarization of the aluminum plates becomes worse.
ObjectivePhotonic integrated circuits (PICs) based on silicon-on-insulator (SOI) platforms have attracted much attention due to their high integration density and compatibility with complementary metal-oxide-semiconductor transistor (CMOS) processes. Among the various integrated optical devices on the SOI platforms, optical couplers with arbitrary splitting ratios are widely used for power distribution, passive optical networks, and signal monitoring. Traditional device design methods are limited by the experience of designers and spend a lot of time on structural design and parameter optimization. In addition, when the design targets change, the structure often needs to be redesigned and optimized, which makes the design less efficient due to the large amount of repetitive work. In contrast, inverse design methods use intelligent algorithms to generate desired device structures, and they can effectively reduce design complexity and improve design efficiency. Specifically, the adjoint method is able to calculate the shape derivatives of all points in the space and requires only two simulation processes in each iteration. It can achieve design targets with fewer simulations and iterations, and further improve the design efficiency of devices. The device structures of inverse design can be divided into internal perforation type and boundary optimization type. Internally perforated devices have a large number of holes in their structures, and when light is transmitted in these devices, these holes tend to cause light reflection and thus lead to relatively large transmission losses. The boundary-optimized device structure mainly adjusts the boundary of devices, so it can avoid the existence of a large number of holes in the structure. In this paper, an inverse design method based on the adjoint method is adopted, and an efficient design method for realizing 1×2 optical couplers with arbitrary splitting ratios by optimizing the boundary shapes of devices is proposed. Various optical couplers with different splitting ratios are automatically designed to verify the feasibility. The analysis results show that the performance of the designed optical couplers has met the design targets, and characteristics such as small size, low insertion loss, and large bandwidth are obtained.MethodsOptical couplers with arbitrary splitting ratios can be realized by optimizing the boundary shapes of devices through an inverse design method based on the adjoint method. First, the initial structure of optical couplers is defined, and multiple discrete boundary optimization points are inserted at both top and bottom boundaries of the devices. By using the adjoint method combined with gradient descent, the positions of the optimization points can be effectively adjusted in the y-axis direction to approach design targets. The boundary shape can be defined by fitting the optimized points into a curve through spline interpolation. By the adjoint method, the number of simulations is effectively reduced, and design efficiency is improved. Three optical couplers with splitting ratios of 1∶2, 1∶4, and 1∶8 (i.e., 3 dB, 6 dB, and 9 dB) are designed, and the characteristics such as splitting ratio, insertion loss, and fabrication tolerance are numerically analyzed. One of the couplers is fabricated through a commercial multi-project wafer (MPW) program. By measuring the power from output ports within a bandwidth range, the performance can be fully characterized.Results and DiscussionsSimulation results show that the splitting ratios of the three couplers are 1∶2, 1∶3.97, and 1∶8.17 at 1550 nm, which well match the design targets (Fig. 5). For all the couplers, the simulated insertion loss is less than 0.12 dB at 1550 nm. When the wavelength ranges from 1500 nm to 1600 nm, the splitting ratio deviations are kept within ±1 dB, and the insertion loss is less than 0.28 dB (Fig. 7). In addition, the fabrication tolerance of the three couplers is analyzed by controlling the width within ±20 nm, and the splitting ratio deviations are still kept within ±1 dB compared with the design targets, which indicates a stable performance (Fig. 8). Experimental tests show that the designed optical coupler with a splitting ratio of 1∶2 meets the design targets in a wavelength range of 1500-1565 nm, and the insertion loss is less than 0.9 dB (Fig. 10).ConclusionsIn summary, 1×2 optical couplers with arbitrary splitting ratios are efficiently designed by using the inverse design method based on the adjoint method. The simulation results show that when the wavelength ranges from 1500 nm to 1600 nm, the splitting ratio deviations of the three designed optical couplers are kept within ±1 dB, and the insertion loss is less than 0.28 dB. The experimental tests show that when the wavelength ranges from 1500 nm to 1565 nm, the designed optical coupler with a splitting ratio of 1:2 meets the design targets, and the insertion loss is less than 0.9 dB. Compared with recently designed optical couplers with arbitrary splitting ratios, the proposed design has advantages in small footprint and large operating bandwidth. The proposed design method paves the way for the efficient design of couplers with arbitrary splitting ratios, low insertion loss, and large operating bandwidth.
ObjectiveThe integration of Raman spectroscopy detection system is the current focus of Raman technology, especially combining waveguide with Raman, and effectively coupling excitation light into waveguide is particularly important for Raman spectroscopy sensing and signal collection. The process is mainly realized by waveguide grating couplers. However, the majority of the waveguide grating couplers are studied for the C band. In addition, the physical designs of the grating couplers are very complex and the preparation processes are difficult. The transparent window of the silicon nitride used in this paper is between 400 nm and 3500 nm. It has a wide range and a high refractive index, which can form a refractive index difference with the surrounding materials to bind the energy of the light in the waveguide layer, and it can reduce the transmission loss of light in the waveguide. The grating coupler designed here has a simple structure and preparation process. Besides, the wavelength of excitation light is 785 nm, which is also commonly used in Raman sensing. The grating couplers studied here can effectively couple the excitation light into the waveguide, and it is helpful for Raman spectroscopy sensing and signal collection.MethodsFirstly, we have a theoretical analysis based on the principle of the grating coupler and analyze the interaction of parameters and the effect of each parameter on the coupling efficiency. Then the two-dimensional and three-dimensional models of the grating couplers are established, and the finite difference time domain (FDTD) simulation software is used to analyze them. With coupling efficiency as the main performance index, the influences of incident angle, grating constant, grating height, filling factor,and etching depth are analyzed to achieve the maximum of the coupling efficiency of the grating couplers. Electron beam lithography is used to prepare three-dimensional fully etched and focused waveguide grating couplers and an optical system including a supercontinuum source, tunable narrow bandpass filters which can select the wavelength of incident light, optical fibers which are used as the input and output fibers, and a spectrometer which collects output spectral signal is built. Then the prepared grating couplers are tested experimentally. In the test, direct waveguide devices of different lengths are prepared to test the loss factor of silicon nitride waveguide, and the test conditions such as light source, angle of incidence, and spectrometer are kept exactly the same. Next, the coupling efficiency of the grating coupler is tested. After the laser from the light source passes through the tunable narrow bandpass filter, the optical fiber couples the incident light into the grating coupler, the input light passes through the silicon nitride direct waveguide, then the grating coupler couples the light into the output optical fiber, and the output light is transmitted to the spectrometer for measurement. Finally, the coupling efficiency of the grating couplers is calculated according to the relationship of power of emergent light and incident light.Results and DiscussionsIn the simulation analysis, for the two-dimensional grating coupler, the final optimization value for the grating constant, grating height, filling factor, and etching depth are 0.455 μm, 0.260 μm, 0.514, and 0.132 μm, respectively. The coupling efficiency of the final two-dimensional grating coupler is about 39.64% (Fig. 2). The coupling efficiencies of three-dimensional direct waveguide grating coupler, three-dimensional half etched and focused waveguide grating coupler,and three-dimensional fully etched and focused waveguide grating coupler are 23.43%, 37.52%, and 21.29% (Fig. 4), respectively. Compared to the direct waveguide grating coupler, the focused grating coupler has a smaller structural size, while ensuring a lower mode conversion loss. All the grating trenches of the focused waveguide grating coupler are focused on the junction between the waveguide and the grating coupler, which can focus the coupled light into the waveguide layer. The efficient coupling between the optical fiber and waveguide is realized. In the experimental test, firstly, the loss factor of the silicon nitride waveguide is tested. Then the light source and test conditions remain constant, and the light is transmitted to the spectrometer for measurement finally. The coupling efficiency of the three-dimensional fully etched and focused grating coupler can reach about 19.91% (Table 3). The reason for the different coupling efficiencies between experimental test results and simulation results is that the surface of the actual grating couplers is not completely flat due to the matching error in the process of fabricating the grating couplers. So there is a little difference between the simulation models and the samples in the test, and thus the coupling efficiency of the grating coupler in the experimental is slightly lower.ConclusionsIn this paper, the finite difference time domain (FDTD) simulation software is used to analyze and optimize the two-dimensional and three-dimensional silicon nitride waveguide grating couplers. The three-dimensional fully etched and focused waveguide grating couplers are prepared by electron beam lithography, and the performance of grating couplers is tested. The results show that the performance of the two-dimensional grating coupler whose coupling efficiency is 39.64% is the best, and the coupling efficiency of three-dimensional fully etched and focused waveguide grating coupler in the experiment 19.91%, which can couple light into the waveguide effectively. The material selection and structure design of the grating couplers can also be optimized to improve the coupling efficiency of the grating couplers in the future.
ObjectiveDeep cooling is a key step in the preparation of ultracold atoms and a key technology for exploring extremely low temperatures. To rule out the effect of gravity, scientists combined microgravity experiments with atomic cooling experiments to get even colder temperatures below 1 nK. The Cold Atom Physics Research rack in the Chinese space station will adopt the deep cooling scheme of all-optical two-stage cooling (TSC) proposed by Chen Xuzong's research group at Peking University. In this scheme, two pairs of 1064 nm Far-Off Resonant optical-dipole Traps (FORTs) are used to successively cool 87Rb atomic cloud by evaporative cooling and adiabatic expansion cooling. According to a direct Monte Carlo simulation, it is concluded that ultracold atomic gas below 100 pK can be obtained in microgravity environments by TSC process. In order to cover the experimental requirements in orbit, we develop a set of integrated optical-fiber 1064-nm laser system. This system provides four high power, high dynamic range, and low relative intensity noise (RIN) 1064-nm infrared channels, with full digitalization, high integration, high stability, and easy maintenance, which fully meets the application requirements of the space station and other remote-control projects.MethodsThe system adopts beam splitting amplification scheme, namely, "pre-amplifiers+beam splitters +power controlling+post-amplifiers", to carry out multi-channel, high-power amplified, and high-dynamic range-controlled laser sources which is generated from a single seed light.This laser system composed of polarization-maintaining fiber devices, as shown in Fig. 1, can be divided into two stages. The first stage, "high-quality seed source", as shown in left purpure shadow of Fig. 1, consists of three parts: a seed source, a high-gaining pre-amplifier (PA), and cascade fiber beam splitters, and it is used to provide stable and narrow-linewidth seed light required by the subsequent optical operations. The other stage, "high-power amplification", as shown in right shadow of Fig. 1, consists of two components: a power control level, consisting of boost amplifiers (BO) and fiber-coupled acousto-optic modulator (AOM), and a power monitoring level, consisting of terminal photodiodes, and it plays the role of amplifying, output controlling, and power feedback, so that the output signals meet the experimental requirements in terms of high power, high dynamic range, high stability, and low RIN. From the left to right in Fig. 1, the continuous-wave seed signal, coming from a single-mode narrow 1064-nm laser tube, is sequentially amplified, filtered, split, and controlled within this full-functional optical platform to generate four 1064-nm FORTs, CH1-CH4, where CH1 and CH2 are called as high-power thin-waisted FORTs, and CH3 and CH4 are named after low-power wide-waisted FORTs.As for the design of amplifiers, our laser adopts the full-fiber Master Oscillation Power Amplifier (MOPA) scheme to enlarge the optical power, where ytterbium-doped fibers (YDFs) with emission band from 1000 nm to 1100 nm are selected as the gain medium in the application of 87Rb TSC and a 976-nm wavelength-locked laser diode is used for cladding forward pumping of these YDF. Both of PA and BOs are adopted a one-level MOPA scheme, as present in Fig. 2, to amplify and control the gained beams. With these amplifiers and power feedback mechanism, the laser system has capability of producing multi-channel laser with high power and low noisy, which satisfies the TSC experimental requirements.Results and DiscussionsWe run a series of tests to evaluate the performance of the laser system in terms of output power, spectrum, stability, RIN, etc. and conduct ground-based TSC pre-experiments to verify the overall system design in real experimental environments. The results show that this system has realized two 5-W and two 160-mW optical power independent output channels, has performed its capability of 60-dB high power-scanning dynamic range, as shown in Table 1, and has reduced the RIN as low as 5×10⁻⁴, as demonstrated in Fig. 6. In the subsequent ground TSC experiments, we have obtained an ultra-cold 87Rb atomic cluster with an extreme-low temperature of 10 nK, which is much lower than the cooling temperature in general all-optical evaporative cooling, and the experimental results are presented in Fig. 7 in details. All the tests and experiments indicate that our laser system reaches the overall performance requirements and is competent in future in-orbit TSC experiments.ConclusionsIn this paper, we describe in detail the development and testing of an integrated all fiber 1064-nm laser system for 87Rb atomic deep cooling. The system uses all optical fiber devices to realize the functions of seed source, optical power amplification, and optical power feedback controlling. It has the characteristics of digitalization and integration, and it is suitable for various applications of ultracold atoms with mobile requirements. The performance evaluation and experimental results prove that the laser system fully meets the power, control, and stability requirements of the TSC deep cooling experiments on four beams of optical dipole traps. This laser system has been installed in the Cold Atom Physics Research rack in Chinese Space Station, has been launched in October 2022, and plays an important role in ultracold physics researches in orbit.
ObjectiveChaotic laser is proved able to be used in key distribution systems to provide a reliable physical entropy source. High-speed random keys can be extracted from a constructed chaotic laser synchronization system. The common externally driven optical injection is the main synchronization structure of chaotic key distribution systems. External-cavity semiconductor lasers (ECSLs) are driving sources easiest to realize in practice and have good robustness. However, this synchronization system faces the following problems in application: 1) optical feedback introduces time delay characteristics into chaotic synchronization signals, which limits signal complexity; 2) chaotic signals have asymmetric amplitude distribution, which affects the randomness of key generation; 3) there is a high correlation between the external driving signal and the local synchronization signal, which reduces the security of the synchronization system.MethodsGenerative adversarial networks (GANs) are a kind of powerful generative model, which includes two neural networks that are pitted against each other in a game-like scenario. They can finally reach a Nash equilibrium through continuous iterative optimization in the training process. The main learning task of a GAN is to realize the transformation of a probability distribution, namely to generate data approaching the target probability distribution through input data. The introduction of a GAN into a chaotic laser synchronization system can optimize the symmetry of chaotic signal amplitude distribution and then realize the generation of random keys at a higher rate.Results and DiscussionsFig. 4 compares the autocorrelation function (ACF) and amplitude probability distribution of chaotic signals before and after optimization. Two commonly used analysis methods, ACF and permutation entropy (PE), are used to analyze the time delay signature (TDS) and complexity of chaotic signals. The optical-feedback ECSL-driven injection makes the initial chaotic signal generated from the laser have TDS, and an obvious correlation peak can be detected at the feedback delay of 62.3 ns, whose amplitude also shows an asymmetric probability distribution [Figs. 4 (a) and (b)]. After calculation, the complexity and skewness of the initial chaotic signal are 0.973 and 1.19, respectively. The results after GAN optimization [Figs. 4 (c) and (d)] demonstrate that the ACF curve of the optimized signal is approximate to a Dirac function. The TDS corresponding to the feedback delay is completely suppressed, and the complexity is increased to 0.99. In addition, the optimized amplitude distribution is close to the Gaussian distribution, and the symmetry is significantly improved. The skewness is reduced to 7.78×10⁻⁴, increased by 3 orders of magnitude. Fig. 5(a) shows the suppression results of chaotic signal TDS before and after optimization under different parameter conditions. The results indicate that compared with the initial chaotic signal, the optimized signal has significantly suppressed TDS, which is reduced to a level below 0.01 under different injection powers. The Kullback-Leibler (KL) divergence of the original chaotic signal is greater than 3, while that of the optimized signal is greatly reduced, which remains at a low level of less than 0.01 under different injection powers, indicating that the optimized distribution is close to a standard normal distribution. Fig. 7 shows the influence of the threshold coefficient α on the bit error rate (BER) of synchronous random sequences. The BER of the optimized signal is significantly lower than that of the original chaotic synchronization signal because the symmetry of the amplitude distribution is significantly improved through optimization. BER is about 0.1 at α=0 (namely that no sampling point is discarded). With the increase in α, BER follows an approximately linear decline trend. When α is greater than 0.125, BER is below the forward error correction threshold (3.8×10⁻³). Here α is set to 0.15 so that the BER of synchronous random bit sequences is lower than 10-3, and the corresponding retention ratio γ is 0.82. The final generation rate of synchronized physical random numbers is 4.1 Gbit/s. To verify the quality of random numbers, this paper employs the randomness test set NIST SP800-22 as the evaluation standard, which is widely used internationally. The results show that the 4.1 Gbit/s synchronized physical random numbers generated by the proposed scheme can pass the standard test of randomness.ConclusionsChaos synchronization is the basis for the application of optical chaos in the field of secure communication. However, the existing experimental systems of chaos synchronization have problems of asymmetric amplitude distribution, limited complexity, and insufficient privacy. This paper proposes and verifies a chaos synchronization optimization scheme based on deep learning. To optimize the initial synchronized chaotic signals, the paper introduces a GAN into the common signal-induced synchronization system which is driven by an ECSL with optical feedback. The main advantages of the proposed scheme are as follows: 1) the initial chaotic signals have suppressed TDS and improved complexity; 2) the symmetry of the amplitude distribution is significantly improved; 3) the correlation between the driving signal and the local signal is greatly reduced, which enhances the privacy of the synchronization system. In addition, the optimized chaotic signals are applied to the physical entropy source. On the basis of chaos synchronization, the paper verifies the generation of synchronized physical random numbers with a high rate of 4.1 Gbit/s and a BER lower than 10-3.
ObjectiveVertical cavity surface emitting lasers (VCSELs) based on micro-electro-mechanical systems (MEMSs) are widely applied in optical communication, optical coherence tomography, and other fields, with the advantages of wide continuous tuning range, fast tuning rate, and low power consumption. The tuning modes of MEMS-VCSEL include electrostatic, piezoelectric and thermoelectric, but the basic principle is to control the mirror shift to change the overall cavity length of the resonant cavity to achieve wavelength tuning. The support structure of the suspended mirror will be subjected to alternating loads during tuning, and the stress concentration will occur at the fixed end position of the structure, leading to the fatigue fracture. The optimization design of the beam structure can improve the reliability of the device at a low cost, which is a high-feasibility optimization method. In this paper, the support beam structure of the suspended mirror is optimized on the micro/nano-scale, and the hyperbolic beam structure is proposed. The maximum stress is reduced, and the resonant frequency is improved without changing the maximum offset and the corresponding bias of the mirror in the MEMS structure. The proposed optimization method can improve the mechanical and tuning characteristics of the device without introducing additional process steps, which is well compatible with other materials and structure optimization methods.MethodsA hyperbolic beam structure is designed for 850 nm tunable VCSEL based on MEMS to improve the mechanical and tuning characteristics. First, the Mises stress distribution of the traditional constant cross section (CCS) beam structure is analyzed by the finite-element method. The stress concentration problem will appear at the fixed end surfaces because the section modulus at different positions of the structure is the same with different moments when the CCS beam structure is subjected to uniform load. Then, the maximum stress on the structure can be reduced by increasing the geometry size of the end surface, and the stress distribution can be more uniform. Based on this theory, the hyperbolic beam structure is designed. In addition, the maximum offsets of the two structures before and after optimization are compared, which means that the stress optimization results do not sacrifice the offset of the mirror. Finally, the relationship between the resonant wavelength of MEMS-VCSEL and the applied bias is calculated by the frequency domain analysis method, and the resonant frequencies of the MEMS structure before and after optimization are compared.Results and DiscussionsThe mechanical and tuning characteristics of the two structure beams before and after optimization are compared. The most important parameters of mechanical properties are the maximum stress and offset of the structure. The stress distribution of the traditional CCS beam structure and the hyperbolic beam structure is calculated when the offset is 390 nm. As shown in Figs. 4 and 5, the stress distribution of the two structures is similar. For the traditional CCS beam structure, the maximum stress values of the upper and lower surfaces are 3.25×10⁷ and 3.06×10⁷, respectively. For the hyperbolic beam structure, the values are 2.49×10⁷ and 2.54×10⁷ respectively, which indicates that the maximum stress is reduced by 23.4% and 17.0% after optimization. For hyperbolic beam structure, hyperbolic shapes and stress reduction effects are both different, which means that the best mechanical properties can be obtained by optimizing the size of the hyperbolic beam structure. The wavelength tuning range and tuning rate are the most important parameters to evaluate the tuning characteristics of tunable lasers. The relationship between the offset of the upper mirror and the applied bias in the MEMS structure is calculated, and then the relationship between the cavity length of the laser and the applied bias is obtained. The wavelength tuning range of the device is obtained by the frequency domain analysis method, and the results are shown in Fig. 8. The influence of the air gap on the resonant wavelength is different under different coupling modes of the semiconductor cavity and the air cavity in the laser. For the semiconductor-cavity dominated (SCD) structure, the wavelength tuning range is narrow (16.6 nm), but it is continuously tuned in the whole range. For the air-cavity dominated (ACD) structures, the wavelength coverage is 42 nm, but "mode hopping" occurs during tuning. The resonant frequencies of the two beam structures will decrease with the increasing applied bias, but the resonant frequency of the hyperbolic beam structure is always increased by 7.9% compared with the CCS beam structure.ConclusionsA hyperbolic beam structure is designed to improve the mechanical and tuning characteristics of MEMS-VCSEL devices. The main principle is to reduce the maximum stress and improve the elastic coefficient of the structure by increasing the section size of the large bending moment. The maximum stress of the upper and lower surfaces decreases by 23.4% and 17.0% after optimization when the offset is 390 nm. There is little difference between the two structures in the maximum offset and the required applied bias. In addition, the resonant frequency of the hyperbolic beam structure is increased by 7.9%. The wavelength continuous tuning range is 16.6 nm when the coupling structure between the two cavities in the laser is SCD structure. The wavelength coverage is about 42 nm for the ACD structure, but there is a "mode hopping" phenomenon during tuning. This optimization method does not need to change the structure of the laser, and is compatible with other optimization methods, with certain application prospects.
Due to the limited lifetime of He-Ne lasers, interferometers used in lithography and other applications often need to be stopped to replace the end-of-life lasers. However, the following are the real bottlenecks confronted, which need to be studied preferentially. First, we used to transform single-frequency lasers into dual-frequency lasers by the Zeeman effect (Figs. 1-2). One drawback of Zeeman dual-frequency lasers is that a large frequency difference and high power cannot be achieved simultaneously; in other words, if the frequency difference is large, the power becomes small, which cannot meet the larger frequency difference (such as 10, 20, and 40 MHz) requirement of lithography machines. Second, as early as 1983, it was discovered that either single-frequency or dual-frequency laser interferometers have a nonlinear error as large as a few nanometers or even dozens of nanometers. This error has long been found by foreign measurement units and National Institute of Metrology of China, but it has not been solved.In this regard, China faces the problem that it cannot manufacture the He-Ne lasers of the kovar-glass assembly structure for laser interferometers. Such He-Ne lasers purchased in the market have a high elimination rate due to frequency instability and mode jumps.Progress To break through the two technical bottlenecks of Zeeman dual-frequency lasers, our research team started the study of the birefringent dual-frequency laser. In 1985, we placed a crystal quartz plate inside a He-Ne laser. The birefringence of crystal quartz caused the laser frequency to split, and one frequency was divided into two frequencies with orthogonal polarization. Subsequently, the frequency splitting is caused by the stress birefringence inside the optical glass plate in the laser, and then the stress birefringence cavity mirror causes the laser to produce two frequencies. By the stress birefringent cavity mirror, the surface of the mirror substrate facing the laser gain tube is coated with an anti-reflection film so that the laser beam passes through without loss. The other surface of the mirror substrate is coated with a laser reflection film as the laser cavity mirror (Figs. 4-6). The stress in the optical substrate causes the laser to change from single frequency to double frequencies. This laser can emit a frequency difference of more than 40 MHz, but it can achieve a frequency difference of less than 40 MHz.The frequency difference from 1 MHz to 40 MHz is the most useful interval for dual-frequency laser interferometers as the Doppler frequency shift caused by the velocity of the measured target displacement is in this region for most dual-frequency laser interferometers. If the laser frequency difference is large, the electronic system matching with the laser will be complicated and costly, which is unnecessary for some applications.The experiments show that when the difference between two frequencies is less than 40 MHz, the coexistence width of the two frequencies is zero; with one extinguished, the frequency difference disappears. The reason why the frequency difference of less than 40 MHz cannot be obtained is theoretically analyzed, namely that the intense mode competition of the laser makes one of the two frequencies extinguished. The scalar Lamb theory overestimates the competition intensity between modes while the Lamb ring laser theory underestimates the inhibitory effect of competition on one of the two frequencies, which is inconsistent with our experiments. We choose the extended Lamb theory and consider the effects caused by the orthogonal polarization characteristics of laser beams, the degeneracy of the atomic energy level, the ratio of two isotopes of Ne, the collision between atoms, and other factors. The theoretical analysis results are consistent with the experimental results. It is shown that when the frequency difference is less than 40 MHz, one of the two frequencies is always in the suppressed state and alternates between winning and being extinguished due to the change of the cavity length (Fig. 3). The relationship between the width of the coexistent frequency domain of the two frequencies and the laser frequency difference is calculated (Fig. 7).Furthermore, our team looks for a method to generate a frequency difference less than 40 MHz. First, the frequency of the laser is split by birefringence; as a result, a laser beam contains two optical components with perpendicular (or orthogonal) polarization to each other. Then, a transverse magnetic field is applied to the laser, and the transverse Zeeman effect divides the gain atoms into two groups. Thus, each one of the two polarized lights obtains a gain from its atomic group, and there is no competition between them so that the two frequencies with a difference of less than 40 MHz can oscillate independently. The main direction of birefringence and the transverse magnetic field direction should be consistent.We put forward the concept of "internal engraving stress" for generating dual frequencies. The narrow-pulse laser is focused on the inside of the cavity mirror substrate to engrave the stress birefringence of the He-Ne laser (Fig. 8). The "internal engraving stress" improves the precision of the frequency difference. The polarization of light at two frequencies is perpendicular to each other, which can be explained by the photo-elastic theory. A birefringence-Zeeman dual-frequency laser is made by adding the transverse magnetic field to the internal engraving stress birefringence dual-frequency laser. In a wide range of applications, this laser has proved its excellent characteristics.The internal engraving stress dual frequencies need to be implemented directly for the He-Ne laser. Hence, a dual-frequency He-Ne laser with kovar-glass structure is developed, which has the power of about 1 mW and a length of about 150 mm (Fig. 9). At the same time, it solves the problem that China was unable to manufacture He-Ne lasers of kovar-glass structure, as well as the problem of the high elimination rate of He-Ne lasers in the manufacturing of laser interferometers.The birefringent dual-frequency lasers with kovar-glass assembly structure (non-blowing technology) and interferometers have been mass-produced, and so are the temperature, humidity, pressure sensors, and calibration systems, which meet the needs of scientific research and the industry. The dual-frequency laser interferometer is tested by National Academy of Metrology of China, and the results are as follows: the frequency stability is 10-8-10-9; the resolution is 1 nm; the nonlinear error is less than 1 nm, and the length measurement error of 70 m is less than 5 μm.Our team has carried out research on the solid-state micro-chip dual-frequency laser interferometer, which is smaller in size (e.g., 3 mm×3 mm×1 mm) and consumes less power (less than 1 W) than the He-Ne laser interferometer and can achieve nanoscale resolution. Despite its wide application scope, its accuracy is not comparable to that of the He-Ne laser interferometer. It seems that the He-Ne dual-frequency laser would remain the main source of the interferometer for a long period of time, but it is hoped that one day the solid-state micro-chip dual-frequency laser interferometer will have the same accuracy as the He-Ne dual-frequency laser interferometer.SignificanceThe laser interferometer with a wavelength of 632 nm is the length benchmark of today's nano age and is also the precision guarantee of advanced manufacturing (machine tools, lithography machines, aerospace, etc.). The spectral line of the helium-neon (He-Ne) laser with a wavelength of 632 nm is narrow and has a natural highly stable frequency point that can be regarded as the mark point of the high stability of frequency (wavelength). The light with a wavelength of 632 nm is orange-red, which can facilitate the alignment of light paths. These excellent characteristics of the He-Ne laser make it the best choice as a light source for single-frequency laser interferometers and dual-frequency laser interferometers. Most lithography machines choose dual-frequency laser interferometers to guarantee nanoscale measurement accuracy. Due to their large size and limited lifetime, numerous research was conducted to replace He-Ne lasers with semiconductor lasers but failed.Conclusions and ProspectsThis paper introduces the whole-chain technology of dual-frequency laser interferometers completed by our research team, including the laser with kovar-glass assembly structure→internal engraving stress birefringence dual-frequency laser→birefringent dual-frequency laser interferometer. We solve the two bottlenecks of the traditional Zeeman dual-frequency laser interferometry, namely, the nonlinear error of measurement as large as a few nanometers or even more than 10 nm and the impossible coexistence of a large frequency difference and high power. The laser power is 1 mW, and the frequency difference ranges from 1 MHz to hundreds of MHz, with a nonlinear error of less than 1 nm. Upon the replacement of the failed laser for a lithography machine, the positioning error of the workbench is reduced to a quarter of what it was.
SignificanceThe laser interferometer with a wavelength of 632 nm is the length benchmark of today's nano age and is also the precision guarantee of advanced manufacturing (machine tools, lithography machines, aerospace, etc.). The spectral line of the helium-neon (He-Ne) laser with a wavelength of 632 nm is narrow and has a natural highly stable frequency point that can be regarded as the mark point of the high stability of frequency (wavelength). The light with a wavelength of 632 nm is orange-red, which can facilitate the alignment of light paths. These excellent characteristics of the He-Ne laser make it the best choice as a light source for single-frequency laser interferometers and dual-frequency laser interferometers. Most lithography machines choose dual-frequency laser interferometers to guarantee nanoscale measurement accuracy. Due to their large size and limited lifetime, numerous research was conducted to replace He-Ne lasers with semiconductor lasers but failed.Due to the limited lifetime of He-Ne lasers, interferometers used in lithography and other applications often need to be stopped to replace the end-of-life lasers. However, the following are the real bottlenecks confronted, which need to be studied preferentially. First, we used to transform single-frequency lasers into dual-frequency lasers by the Zeeman effect (Figs. 1-2). One drawback of Zeeman dual-frequency lasers is that a large frequency difference and high power cannot be achieved simultaneously; in other words, if the frequency difference is large, the power becomes small, which cannot meet the larger frequency difference (such as 10, 20, and 40 MHz) requirement of lithography machines. Second, as early as 1983, it was discovered that either single-frequency or dual-frequency laser interferometers have a nonlinear error as large as a few nanometers or even dozens of nanometers. This error has long been found by foreign measurement units and National Institute of Metrology of China, but it has not been solved.In this regard, China faces the problem that it cannot manufacture the He-Ne lasers of the kovar-glass assembly structure for laser interferometers. Such He-Ne lasers purchased in the market have a high elimination rate due to frequency instability and mode jumps.ProgressTo break through the two technical bottlenecks of Zeeman dual-frequency lasers, our research team started the study of the birefringent dual-frequency laser. In 1985, we placed a crystal quartz plate inside a He-Ne laser. The birefringence of crystal quartz caused the laser frequency to split, and one frequency was divided into two frequencies with orthogonal polarization. Subsequently, the frequency splitting is caused by the stress birefringence inside the optical glass plate in the laser, and then the stress birefringence cavity mirror causes the laser to produce two frequencies. By the stress birefringent cavity mirror, the surface of the mirror substrate facing the laser gain tube is coated with an anti-reflection film so that the laser beam passes through without loss. The other surface of the mirror substrate is coated with a laser reflection film as the laser cavity mirror (Figs. 4-6). The stress in the optical substrate causes the laser to change from single frequency to double frequencies. This laser can emit a frequency difference of more than 40 MHz, but it can achieve a frequency difference of less than 40 MHz.The frequency difference from 1 MHz to 40 MHz is the most useful interval for dual-frequency laser interferometers as the Doppler frequency shift caused by the velocity of the measured target displacement is in this region for most dual-frequency laser interferometers. If the laser frequency difference is large, the electronic system matching with the laser will be complicated and costly, which is unnecessary for some applications.The experiments show that when the difference between two frequencies is less than 40 MHz, the coexistence width of the two frequencies is zero; with one extinguished, the frequency difference disappears. The reason why the frequency difference of less than 40 MHz cannot be obtained is theoretically analyzed, namely that the intense mode competition of the laser makes one of the two frequencies extinguished. The scalar Lamb theory overestimates the competition intensity between modes while the Lamb ring laser theory underestimates the inhibitory effect of competition on one of the two frequencies, which is inconsistent with our experiments. We choose the extended Lamb theory and consider the effects caused by the orthogonal polarization characteristics of laser beams, the degeneracy of the atomic energy level, the ratio of two isotopes of Ne, the collision between atoms, and other factors. The theoretical analysis results are consistent with the experimental results. It is shown that when the frequency difference is less than 40 MHz, one of the two frequencies is always in the suppressed state and alternates between winning and being extinguished due to the change of the cavity length (Fig. 3). The relationship between the width of the coexistent frequency domain of the two frequencies and the laser frequency difference is calculated (Fig. 7).Furthermore, our team looks for a method to generate a frequency difference less than 40 MHz. First, the frequency of the laser is split by birefringence; as a result, a laser beam contains two optical components with perpendicular (or orthogonal) polarization to each other. Then, a transverse magnetic field is applied to the laser, and the transverse Zeeman effect divides the gain atoms into two groups. Thus, each one of the two polarized lights obtains a gain from its atomic group, and there is no competition between them so that the two frequencies with a difference of less than 40 MHz can oscillate independently. The main direction of birefringence and the transverse magnetic field direction should be consistent.We put forward the concept of "internal engraving stress" for generating dual frequencies. The narrow-pulse laser is focused on the inside of the cavity mirror substrate to engrave the stress birefringence of the He-Ne laser (Fig. 8). The "internal engraving stress" improves the precision of the frequency difference. The polarization of light at two frequencies is perpendicular to each other, which can be explained by the photo-elastic theory. A birefringence-Zeeman dual-frequency laser is made by adding the transverse magnetic field to the internal engraving stress birefringence dual-frequency laser. In a wide range of applications, this laser has proved its excellent characteristics.The internal engraving stress dual frequencies need to be implemented directly for the He-Ne laser. Hence, a dual-frequency He-Ne laser with kovar-glass structure is developed, which has the power of about 1 mW and a length of about 150 mm (Fig. 9). At the same time, it solves the problem that China was unable to manufacture He-Ne lasers of kovar-glass structure, as well as the problem of the high elimination rate of He-Ne lasers in the manufacturing of laser interferometers.The birefringent dual-frequency lasers with kovar-glass assembly structure (non-blowing technology) and interferometers have been mass-produced, and so are the temperature, humidity, pressure sensors, and calibration systems, which meet the needs of scientific research and the industry. The dual-frequency laser interferometer is tested by National Academy of Metrology of China, and the results are as follows: the frequency stability is 10-8-10-9; the resolution is 1 nm; the nonlinear error is less than 1 nm, and the length measurement error of 70 m is less than 5 μm.Conclusions and ProspectsThis paper introduces the whole-chain technology of dual-frequency laser interferometers completed by our research team, including the laser with kovar-glass assembly structure→internal engraving stress birefringence dual-frequency laser→birefringent dual-frequency laser interferometer. We solve the two bottlenecks of the traditional Zeeman dual-frequency laser interferometry, namely, the nonlinear error of measurement as large as a few nanometers or even more than 10 nm and the impossible coexistence of a large frequency difference and high power. The laser power is 1 mW, and the frequency difference ranges from 1 MHz to hundreds of MHz, with a nonlinear error of less than 1 nm. Upon the replacement of the failed laser for a lithography machine, the positioning error of the workbench is reduced to a quarter of what it was.Our team has carried out research on the solid-state micro-chip dual-frequency laser interferometer, which is smaller in size (e.g., 3 mm×3 mm×1 mm) and consumes less power (less than 1 W) than the He-Ne laser interferometer and can achieve nanoscale resolution. Despite its wide application scope, its accuracy is not comparable to that of the He-Ne laser interferometer. It seems that the He-Ne dual-frequency laser would remain the main source of the interferometer for a long period of time, but it is hoped that one day the solid-state micro-chip dual-frequency laser interferometer will have the same accuracy as the He-Ne dual-frequency laser interferometer.
ObjectiveOptomechanical systems are a research topic that has been proposed in recent years and has attracted the attention of many researchers. In many optomechanical systems, the radiation pressure-induced optomechanical interactions will lead to phonon modes, which in turn affects the optical properties and then results in remarkable quantum interference effects. Therefore, many important breakthroughs have been achieved in optomechanical systems, such as cooling of mechanical resonators, quantum entanglement, optomechanically induced transparency, optical bistability, four-wave mixing, and so on. The radiation pressure-induced breathing mode oscillations of the boundary of the resonator play a key role in the nonlinear phenomena. However, the possible role of rotation of the resonator itself has not been explored. In a rotating device, an additional phase is accumulated for the propagating light, which is called the optical Sagnac effect. A non-reciprocal optical transmission with an isolation of 99.6% is achieved using a rotating optical cavity in a recent experiment. Subsequently, hybrid spinning optomechanical systems have been extensively studied, and several remarkable phenomena have been founded including nonreciprocal photon blockades, nanoparticle sensing, and slow and fast light. However, optical bistability and four-wave mixing have not yet been explored in hybrid spinning optomechanical systems.MethodsIn this paper, a hybrid spinning optomechanical system driven by a probe laser and pump laser is built to study optical bistability and four-wave mixing, and the composition of the system is analyzed and the definition of each parameter is explained. The drive light entering the system enters from the left side of the fiber and travels clockwise through the optical cavity. The clockwise and counterclockwise modes of the optical cavity experience Sagnac-Fizeau shifts. According to the obtained Hamiltonian, the Heisenberg equation of motion, factorization, and other methods are used to solve it, and relational expressions describing optical bistability and four-wave mixing can be established. Finally, the influence of additional phonon pumping on the four-wave mixing of the system is discussed, and it is found that a small external force is applied, and the four-wave mixing spectral line of the system changes significantly.Results and DiscussionsThe study shows that different properties of optical bistability and four-wave mixing can be observed in the hybrid spinning optomechanical system under different parameter mechanisms. When the optical cavity rotates clockwise, the pump power required to observe the optical bistability is relatively large with the increase in rotation rate. In the case of large pump drive power, when the positive rotation rate increases, the upper stable branch of the corresponding bistable curve increases. This result is reversed when the optical cavity rotates counterclockwise (Fig. 3). In case of no external force and no rotation, two symmetrical peaks appear in the four-wave mixing spectrum, and the mode splitting phenomenon occurs at the resonance. When the optical cavity rotates clockwise, the peak value of the four-wave mixing spectrum will increase, and the mode splitting phenomenon will disappear. When the optical cavity rotates counterclockwise, the peak value of the four-wave mixing spectrum will decrease, and the mode splitting phenomenon gets obvious (Fig. 4). With the increase of the rotation rate when the optical cavity rotates clockwise, the peak value of the four-wave mixing spectrum will gradually decrease, while the mode splitting phenomenon will emerge. From here, the critical value for distinguishing whether pattern splitting occurs at resonances when the optical cavity rotates clockwise can be determined. With the increase of the rotation rate when the optical cavity rotates counterclockwise, the peak value of the four-wave mixing spectrum will decrease, and the mode splitting phenomenon gets obvious (Fig. 5). In case of a small external force and rotation rate, two symmetrical peaks become asymmetrical. With the increase of the external force when the optical cavity is at a fixed rotation rate, the peak value of the four-wave mixing spectrum will increase significantly, and there is no pattern splitting at the resonance (Fig. 6). However, whether the optical cavity rotates clockwise or counterclockwise, under the same external force, the peak value of the four-wave mixing spectrum will decrease, and the reduced energy is used for pattern splitting at the resonance (Fig. 7).ConclusionsIn this paper, based on the optomechanical systems, a hybrid spinning optomechanical system is proposed. By controlling the rotation speed and direction of the optomechanical cavity, the frequency shift induced by the rotation and the optical bistable behavior can be controlled effectively. The results indicate that the rotating direction and rotation rate of the optomechanical cavity affect the four-wave mixing intensity of the system. The decrease or increase of the four-wave mixing intensity will enhance or suppress the mode splitting phenomenon in the resonance region of the system. The external force will destroy the symmetry of the four-wave mixing spectrum. Moreover, the increase of external force will significantly increase the intensity of the four-wave mixing at a fixed rotation rate. However, under the same external force, the increase of rotation rate will reduce the four-wave mixing intensity of the system. Although the optical bistability and four-wave mixing phenomena have been studied in some optical systems, these two phenomena have not yet been analyzed in spinning optomechanical systems, and the study of nonlinear optical properties of hybrid spinning optomechanical systems will have potential applications in quantum information networks.
ObjectiveAs one of the important means of optical imaging in vivo, two-photon microscopes are widely used in biomedical related research fields, such as brain neuroscience, neurodegenerative diseases, embryonic development, and especially in cerebral cortex imaging. The shape of the mammalian brain is irregular and the contour is like a curved surface, but most microscopes are plane field of view. Therefore, the two-photon fluorescence imaging of the mammalian brain will cause uneven imaging depth of the field center and field edge, and with the expansion of the imaging field of view, it will become more and more obvious, thus affecting the imaging quality. In order to solve the problems of small field of view and mismatch between field of view and curvature of brain contour when traditional two-photon microscope is used for two-photon fluorescence imaging of cerebral cortexes, an optical design scheme of two-photon microscope objective lens with large field of view and curved field of view is proposed.MethodsAccording to Seidel aberration theory, the major aberrations in the optical system, including spherical aberration, coma and astigmatism, are completely corrected and the field curvature is retained. The field curvature at this time is called Petzval field curvature. The curvature radius of the mouse brain contour is matched by controlling the value of Petzval field curvature. A set of solutions for solving the initial structure of coaxial three-mirror system is derived. On the basis of the coaxial system, the aperture occlusion in the optical system is eliminated by means of an off-axis field of view. By introducing free-form surface to the primary mirror, the secondary mirror and the third mirror, and using 15 term xy polynomials to characterize the free-form surface shape of the system, an off-axis three-mirror imaging system using free-form surface is further optimized.Results and DiscussionsBased on Seidel aberration theory, a set of corrected initial solutions of the basic aberration is derived. In the absence of astigmatism, the Petzval field curvature is increased to match the radius of curvature of the mouse brain contour. A set of solutions for the initial structure of coaxial three-mirror system with bending field of view is derived (Table 2). The numerical aperture NA is 0.15, the radius of curvature of the field of view reaches 6 mm, the field of view angle reaches 9°×18°, and the size of the field of view is up to 3.5 mm (Fig. 6), which demonstrates that the optical performance of the optimized system is good (Figs. 7-9). By reasonably controlling the system structure parameters in the initial structure selection and taking advantage of the structural advantages of the off-axis reflective optical system, a design scheme for the joint use of dual objective lenses without physical interference (Fig. 10) is obtained, which is conducive to further improving the size of the imaging field of view.ConclusionsIn order to solve the problems of small field of view and uneven imaging of the center and the edge of the field of view in two-photon imaging of mouse cerebral cortexes by conventional two-photon microscopy, a design method of two-photon microscope objective lens with large field of view and curved field of view is proposed. Based on Seidel aberration theory, a set of initial solutions of coaxial three-mirror system with corrected basic aberration is obtained. In the absence of astigmatism, the Petzval field curvature is increased to match the radius of curvature of the mouse brain contour. The designed system has a numerical aperture of 0.15, a radius of curvature of the field of view of 6 mm, and a field of view angle of 9°×18°. Taking advantage of off-axis reflective optical system, an innovative design scheme for the joint use of the dual objective lens system without physical interference is realized, which provides a design basis for the simultaneous two-photon fluorescence imaging of the left and right cerebral cortexes of mice, and increases the size of the imaging field of view. The 15 term xy polynomials are introduced to characterize the free-form surface shape of the system, and the system aberration is well corrected. The average aberration of the system in the full field of view is 0.014λ, which can meet the needs of high-resolution brain neural network imaging in large field of view. This method has reference value for the design of two-photon microscope with large field of view and curved field of view. In addition, the proposed method can also be applied to other scenes that require the radius of curvature of the field of view
ObjectiveThe design of an optical system can be understood as a process of seeking optimal solutions of parameters. There is a complex nonlinear relationship between optical aberration and structural parameters of an optical system. Traditional optical design usually selects an initial structure similar to the expected structure on the basis of experience or from a public lens library. Then, the initial structure is optimized by local optimization algorithms such as damped least squares and the adaptive method, and global optimization algorithms such as simulated annealing, the genetic algorithm, the escape algorithm, and the particle swarm optimization algorithm. Therefore, selecting an appropriate initial structure is essential for subsequent optimization effect and efficiency. However, the current initial structure design method is usually similar to a trial-and-error process, and designers mainly rely on design experience to determine the most appropriate initial structure for different design requirements. This method limits the design efficiency and subsequent optimization of the optical system to a certain extent. In this paper, the proposed optimal design method for the initial structure of a refractive optical system based on deep learning provides designers with a way to choose the initial structure and improves the efficiency of optical design.MethodsFirst, the structural characteristic data of the reference lens in the optical lens library are learned through supervised training. Then, an unsupervised training model based on ray tracing is constructed. The corresponding general formula for solving optical parameters is derived, and the structure of the optical system under a specific focal length is optimized by unsupervised training. After that, unsupervised training is combined with supervised training to ensure the correctness of the training results and improve the generalization ability of the network model. The super parameters of the network model are adjusted, and the rationality of the system structure is compared before and after the training. Finally, the gap between the output of the network model and the reference lens is compared through the cross-validation experiment, and the generalization ability of the deep learning network model for the design of the initial structure of the optical system under different focal lengths is verified.Results and DiscussionsBefore the training, the size of the super parameter is dynamically adjusted. The comparison of different loss curves in Fig. 4 indicates that the training loss curve 1 drops faster than the training loss curve 3. This is because the learning rate of the training loss curve 3 decreases, which can increase the learning time but ensure the stability and accuracy of the deep learning training process. After deep learning, the optimized optical system is designed. Lens parameters are selected reasonably, and the distance between surfaces is appropriate. The system can perform normal imaging on the image surface (Fig. 5). After cross-validation training (Fig. 8), the comparison shows that the root-mean-square (RMS) spot radius of the lens designed by deep learning is similar to that of the reference lens, and some of the RMS spot radii of the deep learning lenses are even smaller than that of the reference lens. This indicates that the network model can design the initial structure of the refractive optical system that meets the requirements of the actual imaging quality. Finally, the initial structures under different entrance pupil distortions (EPDs) and fields of view (FOVs) are designed, and the success rate of optimal design is better than 96.403%. This indicates that the network model has a good generalization ability.ConclusionsIn this work, a deep learning method for the optimal design of the initial structure of the refractive optical system is proposed, combining supervised training with unsupervised training. Supervised training helps the deep neural network model to learn the structural characteristics of the optical system, and unsupervised training introduces ray tracing and the general formula derived in this paper into the deep learning framework to optimize more optical systems at a set focal length. After 2×10⁵ times of training, the network model can design the initial structure of the optical system with the same optical properties as the reference lens. The simulation shows that under different focal lengths, the network model can generate one million groups of initial optical system structures within the specified EPD and FOV, and the design success rate is better than 96.403% under the specified RMS spot radius. This indicates that the network model has a certain generalization ability after deep learning. The proposed optimal design method for the initial structure of the refractive optical system based on deep learning in this paper provides designers with a way to choose the initial structure, improves the efficiency of optical design, and renders a new optimization method and optimization idea for optical optimal design.
ObjectiveUnidirectional electromagnetic mode travels along one direction and immunes from backscattering by breaking Lorentz reciprocity. As free from backscattering, it is widely used in laser and optical communication systems. In addition, the unidirectional electromagnetic mode can be realized by introducing a magnetic field to break the time inversion symmetry. The most promising method to realize a unidirectional electromagnetic mode is to use surface magnetoplasmons (SMPs) which exist in the interface between the gyro-electric and dielectric media, and an external magnetic field can be applied to separate the dispersion curves of wave vectors in both directions. When the frequency falls into the gap of the dispersion curves, the electromagnetic wave propagates in one direction. In terahertz bands, achievements on an SMPs-based unidirectional electromagnetic mode are reported in terms of the interface of the semiconductor InSb and the dielectric medium with a normal magnetic field magnitude. While in near-infrared bands, it is difficult to produce SMPs by using magneto-optical materials since the ratio of the non-diagonal term to the diagonal term of the dielectric tensor under the normal magnetic field magnitude is only about 10-3. In order to solve this problem, a meta-material is employed to enhance the ratio of the non-diagonal term to the diagonal term of the dielectric tensor, and SMPs in a 1.1 eV band are achieved at the interface of the proposed meta-material and the dielectric material.MethodsA physical model of a unidirectional waveguide based on SMPs was presented in this paper. The model is an interface consisting of meta-material-based gyro-electric and dielectric materials (PMMA, with a dielectric coefficient of 2.28). According to the continuity condition, a dispersion equation was obtained. The relationship between the dielectric tensor of the gyro-dielectric material and the dielectric coefficient was theoretically analyzed when SMPs existed. Since the non-diagonal term of the dielectric tensor of normal magneto-optical materials is much smaller than the diagonal term, the diagonal term of the dielectric tensor of the meta-material-based gyro-electric materials is close to the dielectric coefficient of the dielectric materials. In order to construct meta-material-based gyro-electric materials, cerium-doped yttrium iron garnet (Ce∶YIG) and silver with a negative dielectric coefficient were employed. Due to the low absorption and large non-diagonal dielectric coefficient under the normal magnitude of magnetic field (0.2 T), Ce∶YIG was widely used in the near-infrared bands. According to the effective dielectric tensor theory, the dielectric tensor of the meta-material-based gyro-electric materials with different proportions could be obtained. With a ratio of 0.108/0.892 (Ag/Ce∶YIG), the dispersion curves of the SMPs were given, from which it is obvious that the unidirectional band exists around a frequency of 1.1 eV.Results and DiscussionsThe characteristics of unidirectional propagation were simulated and analyzed in this paper. The electric field distribution along the interface is shown in Fig. 4 by placing an excitation source in the interface. The electric field rapidly decays in the opposite direction, and there is almost no backscattering. In other words, the structure is immune to backscattering. Since the electric field in the opposite direction is suppressed within a distance of less than half a wavelength, it can be used to design optical isolators in sub-wavelength size, which is of great significance for improving photonic integration. By setting protrusions and depressions on the interface, the robustness of the unidirectional waveguide to interface defects is verified. As shown in Fig. 5, although the electric field amplitude oscillates violently at the setup defect, the surface wave quickly returns to the interface after bypassing the defect and converts back into its original amplitude size with little energy loss. It shows that the unidirectional waveguide has good robustness as the interface defects do not affect the transmission of surface waves or weaken the unidirectional transmission characteristics. This property is helpful to reduce the process requirements during the manufacturing of photonic devices. SMPs-based unidirectional waveguides not only show positive robustness to defects but also have excellent unidirectional characteristics for waveguides with large-angle bending. Fig. 6 shows the transmission characteristics of a structure at four right angles, and the SMPs are still well constrained at the interface after passing through the structure at four right angles without introducing backscattering. This exclusive property is critical for designing optical devices with complex structures.ConclusionsThe dispersion equation of the dielectric/gyro-electric model of the SMPs was theoretically analyzed, and the relationship requirement between the dielectric tensor and the dielectric coefficient was obtained, so as to achieve unidirectional transmission of the SMPs. According to the effective tensor theory, a meta-material with the combination of Ce∶YIG/Ag was proposed to construct a gyro-electric material, so as to satisfy the requirement. The dispersion characteristics of the SMPs were analyzed, and the transmission characteristics were simulated by a finite element method. An SMPs-based unidirectional waveguide operating in the near-infrared band was constructed by two materials of Ce∶YIG/Ag with a magnetic field with normal magnitude (0.2 T). The unidirectional waveguide structure with defects was also simulated, and the results show that the SMPs-based unidirectional waveguide has good robustness.
ObjectiveStructural color has the outstanding advantages of high chemical stability and low environmental pollution. In recent years, it has received great attention from researchers in the fields of optical camouflage, dynamic display, secure communication, etc. Traditional structural color devices mainly use flat films or one-dimensional, two-dimensional, and three-dimensional periodic micro/nano structures. The anisotropic characteristics of these structures determine that the structural color has an angle dependence. The colors are different when we view from different angles, which limits its applications in many fields such as optical camouflage. It can only achieve camouflage effects from a certain detection angle. The reported work has experimentally verified that the angle dependence can be reduced by breaking the periodicity of three-dimensional structures so that they no longer have the anisotropic characteristics. However, it has not been studied from the perspective of theoretical calculation to indicate what kind of quasi-amorphous structures can achieve what degree of angle dependence reduction. In this paper, a random perturbation surface structure that can reduce the angle dependence is studied theoretically. Compared with the flat film structure, the effect of the perturbation surface structural parameters on reducing the angle dependence is calculated.MethodsThe color of the film interference structure is mainly determined by the central wavelength of the reflection spectrum. Therefore, we use the shift of the central wavelength peak to measure its angle dependence. In this paper, a finite element method (FEM) model of thin-film interference structures is established to investigate the reflection characteristics. In order to verify the validity of the model, the reflection spectra at perpendicular incidence of the FEM model are compared with those of multi-beam interference method and the measured fabricated samples. The FEM simulation results agree well with calculation results of the multi-beam interference method, and are in good agreement with the test results, which verifies the accuracy of the FEM model. Based on this model theory, the reflection spectra of rough surface structures with different perturbation characteristics at different incident angles are studied, and a set of structural parameters are optimized, namely fluctuation height H1=40 nm and spectral index β=1.4. With this set of structural parameters, the reflection spectra and energy propagation characteristics of TE wave and TM wave of flat film structure and random perturbation surface structure are calculated using our FEM model. Finally, the reflection spectra and angle dependence of equivalent natural light are obtained.Results and DiscussionsFor the flat film structure, the reflection spectrum shows a significant angle dependence. When the incident angle is 0° and 40° respectively, the corresponding peak wavelengths are 508 nm and 474 nm, respectively, and the blue shift reaches 34 nm, showing a remarkable change in color. For the random perturbation surface structure, the corresponding peak wavelength is 486 nm and 476 nm when the incident angle is 0° and 40° respectively, and the peak wavelength change is only 10 nm.ConclusionsAiming at the angle dependence of structural color in flat film structures, this paper studies the effect of a random perturbation surface structure on reducing the angle dependence of reflection spectrum. The results indicate that in the incident angle range of 0° to 40°, the reflection spectrum peak of the flat surface structure shifts by 34 nm, whereas that of the random perturbation surface structure only shifts by 10 nm. A decrease of 70.6% in angular dependence is thus achieved. It indicates that the perturbation surface structure plays a significant role in reducing angular dependence.
ObjectiveDue to the degree of freedom of orbital angular momentum, vortex beams have become a research hotspot in the field of spatially structured light fields in recent years, which are widely used in micro-particle manipulation, optical imaging, optical measurement, and optical communication. The wide application of this novel beam has also greatly stimulated researchers to explore and understand the structure of light fields. With the in-depth study of the new vortex field, researchers are no longer limited to the study of a single optical vortex, but focus on multiple optical vortices arranged according to a certain rule, namely the optical vortex lattice. In recent years, optical vortex lattices have been applied to optical measurements and show the promise of ultra-cold atoms trapping. Therefore, the generation and regulation of optical vortex lattice are of great scientific significance in related optical fields. So far, optical vortex lattices are usually generated by the superposition of two or more specific optical beams. Researchers have produced several optical vortex lattices via the superposition of Gaussian beams, Ince-Gaussian (IG) beams, Hermite-Gaussian beams, and Laguerre-Gaussian beams. Among these approaches, optical vortex arrays generated by the superposition of IG beams have additional abundant structures owing to the rich transverse intensity distribution of the IG beams. However, the influence of beam waist on the optical vortex lattice generated by IG beam superposition is not further studied. Therefore, it is necessary to study the characteristics of optical vortex lattice generated by IG superposition with different beam waist radii, so as to enrich the spatial pattern distribution of optical vortex lattice.MethodsIn this paper, a double-layer flower-shaped optical vortex lattice is proposed by superimposing odd and even mode IG beams with different waist radii based on computational holography. The optical vortex lattice is successfully generated by single optical path interference method, and the existence of vortex phase in the generated optical vortex lattice is verified by spherical wave interference. The experimental setup is shown in Fig. 2. The 532 nm beam generated by Nd∶YAG laser after frequency doubling passes through the pinhole filter and convex lens L1 (f1=100 mm) to obtain an expanded beam. The expanded beam is split into two beams after it passes through the beam splitter. One beam is illuminated on the spatial light modulator (SLM) used to load the phase mask (HOLOEYE,PLUTO-VIS-016, pixel size is 8 μm×8 μm). The phase mask records the phase and amplitude information of the double-layer flower-shaped optical vortex lattice. The beam modulated by the SLM is screened out by the 4f (f2=200 mm,f3=200 mm) system of aperture A2, and the required +1 order diffraction beam is finally recorded by CCD camera (Basler acA1600-60gc,pixel size is 4.5 μm×4.5 μm) placed in the back focal plane of lens L3. Another beam is converted into a spherical wave through the lens L4 (f4=75 mm).Results and DiscussionsThe optical vortex lattices are double-layer distribution, and the number of vortices N meets the relationship of N=4m. And the topological charge values of the inner and outer vortices equal, but the signs are opposite (Fig. 3). The spherical wave interferes with the optical vortex lattice. According to the properties of the optical vortex, when it interferes with the spherical wave, a fork filament appears at the dark core, therefore verifying the vortex phase of the producing optical vortex lattice (Fig. 4). In order to research the effect of waist radius on the light intensity distribution of the optical vortex lattice, the odd mode waist radius wo=4 mm is controlled. When the even mode IG beam waist radius increases from 3 mm to 4 mm with a step of 0.2 mm, the inner and outer edge bulges gradually flatten and the intensity distribution intends to be circular. As the waist radius gap between the odd and even mode IG beams decreases, the vortex distribution gradually changes from double layer to single layer, and the topological charge values and signs remain unchanged. When the waist radii equal, the surrounding dark cores in optical vortex lattice disappear, and only the central large dark core exists (Fig. 5). To investigate the properties of initial phase difference of DFOVL, the phase difference φ is added to the even mode IG beams, forming a completely isolated light flap when the initial phase difference is equal to π/2, which the dark cores and phase singular dots completely disappear. When the initial phase difference increases to π, the intensity mode of optical vortex lattice restores, but the signs of the inner and outer vortexes in the optical vortex lattice change (Fig. 6).ConclusionsWe have experimentally produced a double-layer flower-shaped optical vortex lattice, which is generated by coaxial superposition of odd-mode and even-mode Ince-Gaussian beams with different waist radius. The distributions of vortices in optical vortex lattice are double-layer, the number of vortices N meets the relationship of N=4m, and the topological charge values of the inner and outer vortices equal, but the signs are opposite. The effects of waist radius and phase difference on the distribution characteristics of light intensity and phase are analyzed. The results show that: when the phase difference φ between the odd and even mode IG beams is an integer multiple of π, the vortex sign changes; when φ is an odd multiple of π/2, the vortex disappears. Therefore, the generation and disappearance of vortex or the modulation of the vortex sign can be realized by changing the phase difference. When the waist radius gap between the odd mode and even mode IG beams gradually decreases, the light intensity distribution of the double-layer optical vortex lattice generated by superposition gradually intends to a concentric annulus, and the distribution of the vortex dark core changes from double-layer to single-layer. The research results greatly enrich the spatial mode distributions of optical vortex lattice and have potential applications in micro-particle manipulation.
ObjectiveAs the basic technology for positioning and navigation of unknown targets, ranging technology is closely related to people's life, national defense construction, aerospace exploration, and other aspects. The traditional positioning system can realize navigation ranging by continuously transmitting electromagnetic pulses into space, and the pulses will be reflected to the receiver as the presence of targets. As a result, we can detect the echo pulse and estimate its time delay through the propagation time. Wider bandwidth and greater transmission power of a transmitted electromagnetic pulse signal indicate higher precision of time accuracy. However, due to the restriction of the energy and bandwidth of the electromagnetic pulse, the accuracy of navigation ranging has certain limits. To go beyond the limits of energy, bandwidth, and accuracy in classical measurement, quantum ranging makes use of the entangled state, squeezed state, as well as other characteristics to make the transmitted quantum information have a strong correlation and high density. It can obtain much higher ranging accuracy (Heisenberg limit) than that of classical radio ranging systems, and thus it can be further applied to systems such as navigation, positioning, and gravitational wave measurement. In view of the problem that many previous ranging schemes are highly sensitive to photon loss and that it is difficult to achieve long-distance transmission through quantum interferometry, we use the squeezed state to improve the peak estimation of the time delay and propose a non-classical navigation ranging scheme based on quantum illumination, which makes a statistical judgment on the echo signal of a target to determine the distance parameter. We hope that our study can be helpful for the application of quantum information and the design of future navigation and positioning systems.MethodsThe quantum ranging scheme enhanced by Gaussian entanglement can be used for high-precision navigation ranging, whose form is similar to that of the classical radio ranging method. With the ranging scheme based on quantum illumination, a pair of entangled photons is generated through parametric down-conversion, and one photon is emitted as the detection signal, while the other photon is left in the local area as the idle signal. If there is a target, the photon scattered by the target can be entangled with the local photon for entanglement measurement, and additional performance gain can be obtained. In our work, first, the basic principles of radar ranging and quantum illumination are introduced, and the discrimination theory of Gaussian states is deduced. Then, upon the analysis of the statistical properties of three Gaussian states, namely, the coherent state, thermal state, and squeezed state, the new ranging method that uses the quantum squeezing effect to improve the estimation accuracy of the time delay is described, and the proposed quantum illumination scheme is further used to improve the entanglement ranging performance. Finally, given the navigation ranging scheme based on quantum illumination, the performance of the coherent state is compared with that of the two-mode squeezed vacuum (TMSV) state in the application of entanglement ranging. In addition, the Chernoff bound of quantum signal detection is used for quantitative analysis.Results and DiscussionsThe results show that the detection error probability of the TMSV state is about 6 dB lower than that of the coherent state in the exponential part after the idle signal is stored, which effectively improves the performance of the navigation ranging system. The Chernoff bound of the detection error probability decreases as the number of signal photons grows and increases as the number of noise photons rises (Fig. 7). At the same time, the entanglement gain performance of the TMSV state is significantly better than that of the coherent state. According to the analysis of quantum hypothesis theory, the detection performance of navigation ranging based on quantum illumination can be improved by about four times (6 dB) in the exponential part compared with that of the traditional scheme when the number of signal photons is small, or the number of noise photons is large. This gain is significant under the circumstance of low-brightness illumination sources or strong noise environments (Fig. 8). The entangled navigation ranging scheme significantly enhances the signal detection performance, improves the range resolution, and can more sensitively determine the range element with lower error probability, thus realizing high-precision navigation ranging. Compared with the situation of the classical navigation ranging scheme, when the detection probability of the echo pulse signal is the same, the receiver in the squeezed-state quantum illumination ranging scheme will have a lower detection threshold, which will expand the maximum range of the navigation ranging system according to the radar range equation. If the detection threshold D0 is reduced to 1/16 of the original value, doubling the navigation range is promising.ConclusionsIn this work, a new navigation ranging method based on quantum illumination is proposed. For quantum navigation ranging, we can use the squeezed state and entangled state of the quantum to improve the performance of time delay estimation. Comprehensively utilizing the quantum squeezing and entanglement properties, we focus on the comparison of the entanglement ranging performance between TMSV state and coherent state and the analysis of the quantum Chernoff bound for error probability. When the idle signal is stored at the receiver for entanglement measurement, the detection error probability of the TMSV state decreases by about 6 dB in the exponential part compared with that of the coherent state, which effectively improves the detection performance of the navigation ranging system. The quantum illumination scheme has a higher detection probability when the measurement range is fixed, and meanwhile, the scheme has a larger measurement range when the detection probability is the same as that of the classical ranging scheme. Therefore, the scheme is suitable for low-brightness illumination sources and has stronger anti-interference performance for ranging signal detection in complex environments. At present, the optimal quantum receiver design still requires further research, but many theoretical models and experiments of suboptimal receivers have made significant progress. Preliminary theoretical analysis and recent experiments show that the proposed navigation ranging scheme is feasible and can be further applied to quantum navigation and positioning systems in the future.
ObjectiveThe co-fiber quantum-classical signal transmission technology is of great significance for the development of practical quantum secure communication networks. Quantum signals are interfered with the noise resulting from the nonlinear effects, such as Raman scattering (RS), four-wave mixing (FWM), and cross-phase modulation (XPM), of the classical signal in fiber channels. For the above reason, this paper constructs a simulation model for the secure key rate of a continuous-variable quantum key distribution (CVQKD) system based on co-fiber quantum-classical signal transmission. The paper focuses on analyzing the influences of the power of the classical light, channel spacing, and detection method on system noise and key rate. The results show that the FWM noise dominates the short-range transmission process, while the XPM noise is larger than both the RS noise and the FWM noise when the transmission range is longer than 10 km. The total system noise is positively correlated with the power of the classical light and inversely correlated with the spacing of wavelength division multiplexing channels. Under homodyne and heterodyne detection, the variations in the secure key rate with the transmission range exhibit a similar overall trend, although the homodyne detection method achieves a longer maximum transmission range. This paper can provide a reference for the optimal design of practical CVQKD systems based on co-fiber quantum-classical signal transmission.MethodsFocusing on the CVQKD system, this paper builds a co-fiber quantum-classical signal transmission model integrating the RS, FWM, and XPM effects and simulates and analyzes the effects of the three nonlinear effects on system noise and key rate. The research status of co-fiber quantum-classical signal transmission and the focus of this paper are outlined; the simulation model is constructed, and the secure key rate of the CVQKD system, RS, FWM, XPM, and simulation parameter settings are presented; the properties of co-fiber quantum-classical signal transmission are expounded. This paper can provide theoretical support and a reference for co-fiber quantum-classical signal transmission of CVQKD systems in practical environments.Results and DiscussionsAs shown in Fig. 2, the RS noise first increases and then decreases with the increase in the transmission range. The FWM noise exhibits an oscillating distribution as the range increases, and its maximum decreases gradually. The XPM noise increases with the range. When the transmission range is short, the FWM noise is dominant among the three noises. Otherwise, the XPM noise is larger than the RS noise and the FWM noise. In Fig. 3, the total system noise increases with the power of the classical light. As the transmission range increases, the maximum and minimum of the total noise gradually converge, and during long-range transmission, the total noise is approximately positively proportional to the power of the classical light. The differences in the maximum of the total noise under different power of the classical light are much larger in short-range transmission than in long-range transmission. Fig. 4 shows the variation in the total system noise with transmission distance under different channel spacings. The total noise decreases with the increase in channel frequency spacing, and with the increase in the range, the decreasing trend of the noise becomes obvious. The difference between the maximum and minimum of the total noise also decreases as the channel frequency spacing increases. Fig. 5 presents the change in the secure key rate of the CVQKD system with the transmission distance under different power of the classical light. The system's secure key rate gradually decreases with the increase in the transmission distance, and the secret key rate decreases rapidly when the transmission distance reaches a certain value, which is the longest transmission distance that the system can achieve under the corresponding condition. The secret key rate and the maximum transmission distance both decrease with the increase in the power of the classical light.ConclusionsThe RS noise first increases and then decreases with the increase in the transmission distance. The FWM noise is in an oscillating distribution as the range increases. The XPM noise is positively correlated with the transmission distance. When the transmission distance is short, the FWM noise dominates. In contrast, the XPM noise will be larger than both the RS noise and the FWM noise when the transmission distance is longer than 10 km. The total noise increases with the power of the classical light, and during long-range transmission, it is approximately positively proportional to the power of the classical light. Nevertheless, it decreases as the channel frequency spacing increases and decreases more rapidly as the distance increases. The system's secret key rate gradually decreases with the increase in the transmission distance. Large power of the classical light results in a lower secret key rate and a shorter maximum transmission distance that the system can achieve under the same distance. The secret key rate curves under different channel spacings are approximate during short-range transmission. As the transmission distance increases, the curves gradually separate, and the secret key rate and the maximum transmission distance both increase as the channel spacing increases. Under the two detection methods, the overall change trends of the secret key rate curves are close to each other. When the transmission distance is long, the homodyne detection can obtain a higher secret key rate, but the difference is not large. To sum up, the power of the classical light and channel spacing have a great influence on the noise and secret key rate of the system and should thus be selected properly in actual co-fiber classical-quantum signal transmission systems.
ObjectiveWide-color-gamut display systems play an important role in the fields of electronic commerce, digital archives, design, simulation, and medical systems. In contrast to conventional three-primary display systems whose color gamut is limited to a triangle area, multi-primary display systems are more appropriate for wide-color-gamut display thanks to their larger polygonal color gamut. Nowadays, various multi-primary display systems have been put forward, such as four-primary, five-primary, and six-primary display systems. The theoretical studies of multi-primary display mainly focus on the conversion models between the multi-primary space and the standard CIE XYZ color space. However, the acquisition or production of driven images remains difficult for multi-primary display. It is a challenge for a conventional camera to capture color images which match multi-primary display with a wide color gamut. Besides, the driven images of multi-primary display have more than three channels, and thus they cannot be produced directly from three-primary images due to metamerism. In this paper, we introduce multi-primary LED dot matrix display, which has the advantages of a large size, a wide color gamut, high brightness, and a large dynamic range. To drive multi-primary LED dot matrix display with correct color reproduction, we propose a method to produce driven images for multi-primary display systems by using a conventional RGB camera. We hope that our method can be helpful for wide-color-gamut multi-primary display.MethodsWe measured the spectral sensitivity of four typical digital cameras, including Canon 1000D, Fuji X-E3, Nikon J1, and Sony F828, and analyzed their color acquisition ability. In light of the colorimetry theory and with numerical methods, we built a forward model which can convert the n-primary space of a display system to the standard CIE XYZ color space and then built an inverse model for the conversion from three-primary space to n-primary space by using a look-up table from three-dimensional space to n-dimensional space. A five-primary LED dot matrix display system was simulated utilizing typical LED components, and the ColorChecker SG target with a wide color gamut was used as the target image. We experimented with our conversion method on this five-primary LED dot matrix display system.Results and DiscussionsSince the target image is a raw color image of the ColorChecker SG target and its color gamut exceeds the sRGB gamut, it has the characteristics of a wide color gamut. If the illumination is changed, such as using a high-chroma light source, its color gamut can be further increased. When the colorimetric parameters of the five-primary LED dot matrix display are determined, the forward model can be easily built according to the proposed method. The chromatic aberration of 96 color blocks is mostly less than 2. Reducing the step size can lower the chromatic aberration of individual color blocks. The step-size parameter in the experiment is set as 25, which is the result of balancing the chromatic aberration and the calculation speed. The experimental results show that our method can produce images with the use of an RGB camera for driving the five-primary LED display system, and desired color reproduction can be achieved. There are some non-uniform distributions in the five-primary driven images, which will not affect the final display result.ConclusionsThe colorimetry theory and numerical methods help build a forward model and an inverse model for image conversion between the n-primary space of an LED dot matrix display system and the three-primary space of a CIE1931 XYZ system. The experimental results demonstrate that our models can easily produce multi-primary images from wide-color-gamut RGB images for driving LED dot matrix display and achieve desired color reproduction. Next, our work will focus on improvements in the color reproduction accuracy, the color gamut of the target image, the uniformity of the primary images, and the production speed of multi-primary images. It should be noted that our method is based on the assumption that the n-primary display system is in line with the principle of linear superposition, which is suitable for LED display systems. The method is promising in wide-color-gamut multi-primary display systems whose channels are highly independent.