


 View fulltext

2022
Volume: 42 Issue 9
50 Article(s)

Peng-hui LI, Zheng-wei JIANG, Jia-quan LI, Jian-peng REN, and Wen-juan WU
Lignin degradation is an important way to the utilization of biomass resources. Lignin is a three-dimensional networked macromolecular structure with many functional groups. When different methods are used to degrade lignin, detecting the content of phenolic hydroxyl groups in degraded lignin can more intuitively show the degradation efficiency of this method and can reflect the specific structure of lignin and the activities of hydrolysis, oxidation and reduction. Designing or comparing a measurement method that can efficiently and quickly determine the concentration of phenolic hydroxyl groups in degraded lignin is critical for analyzing the structure and function of small lignin molecules after depolymerization. According to the classification of instruments, the recent detection methods of phenolic hydroxyl groups after the degradation of lignin, such as titration methods, ultraviolet spectroscopy (ultraviolet spectrophotometry and Folin-Ciocalteu reagent, etc.), high-performance liquid chromatography, nuclear magnetic resonance (phosphorus spectrum, carbon spectrum, hydrogen spectrum, fluorine spectrum, etc.), gas chromatography-mass spectrometry, and gas chromatography (measurement of 1-acetylpyrrolidine by ammonolysis and methanol by periodate oxidation) were reviewed. Moreover, the application conditions, sample requirements and key factors of each quantitative analysis method were analyzed. Based on the efficient, convenient and economical detection method of phenolic hydroxyl, the future development direction prospected.
Sep. 01, 2022Vol. 42 Issue 9 2666 (2022)
Hong-sheng SUN, Xin-gang LIANG, Wei-gang MA, Jing GUO, Jia-peng WANG, Chao QIU, and Xiao-gang SUN
The surface temperature retrieval of high-temperature objects shielded by strong diffusive mist plays a critical role in aerospace, metallurgical and many other industries. Traditional radiation temperature measurements under extreme conditions usually cause substantial errors because of the strong extinction and scattering by mist during light propagation. The current infrared temperature retrieval methods often use single-channel or double-channel non-imaging temperature measurement strategies. In such methods, the temperature is corrected using either pre-measured or real-time mist parameters, and the results are analyzed and evaluated according to radiative transfer theory. Based on the calculated spectral radiation characteristics of mist, this paper proposed an infrared imaging temperature measurement method. A temperature retrieval model is also built based on radiative transfer theory while the adjacent effect is considered. The exact surface temperature distribution can be retrieved while the parameters of the diffusive mist medium remain unknown. During a typical temperature retrieval process, the radiative temperature distribution is firstly calculated according to the infrared images in three different channels calibrated by the pre-acquired calibration and emissivity data. Then the exact temperature is retrieved according to this non-linear temperature retrieval model. A three-channel infrared temperature retrieval system is designed, with its three channels centered at 8.8, 10.7, and 12.0 μm, respectively. Three identical long-wave infrared focal plane detector is applied, which can simultaneously photograph the high-temperature object. Besides, an experimental verification device is assembled to test the performance of the three-channel infrared system based on a high-temperature blackbody and a home-made mist generator. The results prove that long-wave infrared shows a higher interference resistance capacity than mid-wave infrared. This three-channel device and the temperature retrieval model reduce the image distortion caused by mist and show an average temperature retrieval error of ca. 7% at 1 000, 1 100, and 1 200 ℃ conditions. This method is suitable for both high-temperature blackbody and graybody, while the pre-acquisition of the mist parameters is not required. The temperature retrieval method based on multi-spectral infrared imaging proposed in this article shows universal applicability and considerable innovativeness.
Sep. 01, 2022Vol. 42 Issue 9 2702 (2022)
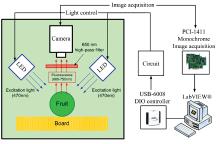
Tong-tong ZHOU, Xiao-lin SUN, Zhi-zhong SUN, He-huan PENG, Tong SUN, and Dong HU
Fruits and vegetables are subjected to different degrees of squeezing, collision or friction during harvesting, transportation, storage, sorting, packaging and marketing, resulting in external bruising like crushing, cracking and abrasions, as well as internal bruising like black core, water core, browning rot, mildly heart disease. The initial characteristics of bruising in fruits and vegetables are not obvious, and the appearance is the same as that of normal fruit. However, the bruised tissue deteriorates and spreads with time, which will eventually cause others and the whole box of fruits and vegetables to rot and deteriorate, leading to huge economic losses in the fruits and vegetables industry. There are diverse methods for postharvest bruising detection of fruits and vegetables. Among them, manual detection is the simplest and most commonly used. However, this method is not only time-consuming, labor-intensive and wrong mistakes, but also can not realize the bruising beneath the peel or internal bruising detection that is invisible to the naked eye. With the rapid development of computing technology, more and more non-destructive inspecting techniques have been widely used for bruising detection of fruits and vegetables. Among them, spectroscopy and imaging techniques are the most popular. Spectral imaging techniques usually achieve the goal of bruising detection by using the signal difference (i.e., spectroscopy or image) of the bruised and non-bruised fruits and vegetables with the procedure of image processing, spectral analysis, chemometrics, statistical analysis and other methods. These techniques are non-destructive and fast and can overcome the shortcoming of manual detection (i.e., time-consuming, labor-intensive and low accuracy). This review mainly summarizes the research progress of eight kinds of spectroscopy and imaging techniques (near-infrared spectroscopy, Raman spectroscopy, fluorescence spectroscopy, hyper-spectral imaging, spatial-frequency domain imaging, nuclear magnetic imaging, X-ray imaging and thermal imaging) in bruising detection of fruits and vegetables. Working principles and main technical features of these techniques were described, followed by their applications in detecting bruising of fruits and vegetables. Finally, a discussion on the future perspectives was given. We hope to provide references for non-destructive detection of bruising in fruits and vegetables.
Sep. 01, 2022Vol. 42 Issue 9 2657 (2022)
Yu-xia HU, Jie CHEN, Hui SHAO, Pu YAN, Heng XU, Long SUN, Xiao XIAO, Lei XIU, Chun FENG, Ting-ting GAN, and Nan-jing ZHAO
Waterborne pathogenic bacteria contamination can cause various diseases, seriously endangering human health and public health security. Waterborne pathogen detection is important to human health care, water safety and disease diagnosis. Conventional waterborne pathogen detection techniques, such as artificial culture, molecular biology and immunology, are accurate and effective, but sample pre-treatment is cumbersome and time-consuming, not conducive to real-time online detection of pathogenic bacteria. Spectral detection technology to non-invasive access to pathogenic bacteria emission, scattering or absorption spectral characteristics, able to determine the nature, structure and content of pathogenic bacteria and other information. Due to the advantages of easy operation, rapidity, portability, non-destructiveness and ease of real-time monitoring, this technique has many application prospects in environmental monitoring and bioanalysis. The article introduces the existing waterborne pathogen detection techniques and their advantages and disadvantages, points out the necessity of rapid and efficient detection of pathogenic bacteria; discusses the principles of spectroscopic detection techniques and data analysis methods, focusing on the working principles and research progress of UV/Vis spectroscopy, fluorescence spectroscopy, infrared spectroscopy, Raman spectroscopy and terahertz spectroscopy in the detection of waterborne pathogenic bacteria; finally summarizes the advantages and disadvantages of each technique. The challenges and strategies for the practical application of spectroscopic techniques in detecting pathogenic bacteria are presented to provide a reference for further development of rapid detection of waterborne pathogens based on spectroscopic techniques.
Sep. 01, 2022Vol. 42 Issue 9 2672 (2022)
Qiang LIU, Shao-bo LIU, Xue-song LU, Jun-jia FAN, Hua TIAN, Xing-zhi MA, and Li-li GUI
Raman spectroscopy has the advantages of being simple, rapid, in-situ, micro-zone, non-destructive, high resolution and high sensitivity, can be used to analyze the composition and molecular structure information of substances and is a powerful tool for geological research. By reviewing the research progress of Raman spectroscopy in recent years, the application of Raman spectroscopy in petroleum geology research is summarized based on the practical oil and gas geology research, analysis and testing experience, then the existing problems in the application process and the future development direction is discussed. Raman spectroscopy application in petroleum geology is mainly divided into three aspects: (1) the mineral and fluid inclusion analysis, which can determine the type and composition of diagenetic fluid and hydrocarbon, diagenesis and hydrocarbon accumulation process, including rock and mineral identification, analysis of the fluid system in fluid inclusions, water and rock interaction process, isotope study of geological samples, etc.; (2) Different types of organic matter analysis can be used to reconstruct thermal history and constrain the stages of hydrocarbon accumulation; (3) Fluid inclusion pressure recovery can be used to study the formation and evolution process of oil and gas reservoirs. The main way to recover fluid inclusions and trapping pressure is using the displacement variation of gas Raman characteristic peak and gas solubility. In practical petroleum geology research, the quantitative and semi-quantitative application of Raman spectroscopy is restricted by many factors, including the complexity and particularity of geological samples, sample processing methods, Raman testing parameters and testing environment Raman spectrum data processing and analysis methods. Standardization of Raman spectrum testing and analysis process, selection and preparation of calibration samples Combining Raman spectroscopy with heating-freezing stage, hydrothermal diamond-anvil cell (HDAC), high-pressure optical cell (HPOC), scanning electron microscope (SEM), electron probe (EPMA) and other instruments to carry out in-situ. Real-time and different temperature and pressure testing of complex systems is the research direction for further application of Raman spectroscopy in petroleum geology.
Sep. 01, 2022Vol. 42 Issue 9 2679 (2022)
Xiao WANG, Mu-hua LIU, and Jiang XU
Based on the spectrum detection technology of dispersion polarization, the optical polarization characteristics of emulsified oil particles and the Mie scattering physical model have been emphatically studied, and the spectrum detection system of dispersion polarization degree has been constructed. In the wavelength range of 400-700nm, the spectral reflectance of 301 bands was collected for four samples. Combining the Bessel function and Hankel function, the relationship between the wavelength of incident light and the polarization amplitude vector of the scattered light has been derived, and a new characteristic parameter has been extracted: the degree of dispersion polarization (DODP). Under darkroom conditions, the emulsified oil samples ND18 and ND75 were measured, and the polarization value of the sample at each measurement wavelength was calculated using the dispersion polarization formula, verifying the feasibility of detecting emulsified oil based on DODP value. This study found that although the solution of Mie scattering is derived from the diffraction of a single sphere. As long as their diameter and composition are the same, and the distance between each other is greater than the wavelength, They can also be used to diffract any number of balls. There is no coherent phase relationship between lightly scattered by different spheres, and the total scattered energy is equal to the energy scattered by a sphere multiplied by their integers. When the angle between the observation plane and the vibration direction of the incident wave electric vector is ϕ=0 or ϕ=π/2, the scattered light component Eθ(s) and Eϕ(s) disappears. Since the particle size of ND18 is smaller than that of ND75, the forward scattering lobe of ND18 is larger, and the ratio of forwarding scattering to backward scattering is small. Under the same lighting conditions, the multiple scattering of ND75 is more serious than that of ND18. According to the theory of path correlation matrix, multiple scattering is likely to cause depolarization, and secondary radiation waves will spread and distribute in the angular domain. Therefore, the number of scatterings generated on the surface of the emulsified oil measured is proportional to the damping capacity of the incident light energy. Due to the difference in energy dissipation of incident light on the surface of emulsified oil, the energy dissipation rate is proportional to the component of the forward scattering amplitude in the direction of the incident wave vector, and the degree of polarized scattering of emulsified oil is different from the degree of polarized scattering of incident light. Experimental results show that DODP can reflect emulsified oil’s depolarization ability caused by multiple dispersions. Since the simulated light source was natural light, it was very convenient to calculate the polarization parameters of scattered light, which could greatly shorten the data processing time and reduce the experimental error. DODP can identify emulsified oil in seawater and distinguish the concentration of pollutants and accurately identify the edge diffusion of emulsified oil.
Sep. 01, 2022Vol. 42 Issue 9 2689 (2022)

Terahertz (THz) waves characterized by low energy, instantaneity and proficiency in spectral analysis have a promising futures in material identification. Although the existing substance identification methods based on THz have achieved certain effects, they are prone to fall into local optimization, resulting in low identification accuracy. Uniform manifold Approximation and Projection (UMAP), as a nonlinear dimensionality reduction method, assume that the data are uniformly distributed on Riemannian manifolds, which can be used to model manifolds with fuzzy topology. UMAP dimension reduction is to optimize the layout of data representation in low-dimensional space by minimizing the cross-entropy between two topological representations. The initial clustering centre is often given randomly in the traditional fuzzy C-clustering method (FCM). When the initial clustering center is not selected correctly, it is easy to fall into the local optimum, leading to wrong clustering. To this end, this paper proposes a Uniform Manifold Approximation and Projection (UMAP) assisted fuzzy C-clustering algorithm. Firstly, UMAP is used to reduce the dimensionality of the input THz sample matrix. And then, based on the principle of maximizing the distance between categories, the appropriate initial clustering center is selected. Finally, the fuzzy C-means method is employed to perform the clustering analysis. This proposed algorithm can solve the overcrowding problem between categories in the clustering process and reflect the distance information between categories to facilitate the selection of appropriate initial clustering centers. In order to verify the reliability of the algorithm proposed in this paper, four different types of genetically modified cotton seeds of Lu Mianyan28, Lu Mianyan29, Lu Mianyan36, and Zhongmian28 were detected by using THz time-domain spectroscopy technology. Then, the UMAP-assisted fuzzy C-clustering method was used to cluster the absorbance spectral data of four different types of genetically modified cotton seeds. The different cotton seeds are successfully well separated, and the clustering effect with a total correct rate of 0.9833 is obtained. The result fully demonstrates that the fuzzy C-clustering method based on UMAP-assisted proposed in this paper has a good application prospect in identifying material THz spectrum.
Sep. 01, 2022Vol. 42 Issue 9 2694 (2022)
Guo-yang WANG, Qing-hao MENG, Si-yu SHAO, Ping YE, Bo SU, and Cun-lin ZHANG
The photon energy of THz wave is only meV, which is much lower than the bond energy of various chemical bonds, so it will not cause harmful ionization reaction to biological tissues; on the other hand, because the characteristic energy of rotation and vibration of most biomolecules is in the THz range, THz wave can be used to identify the biomolecules. Water is the most important liquid in a biological medium, the interaction between biomolecules and liquid water determines its biological activity, so it is very important to study the terahertz characteristics of liquid water. As a polar liquid, the dipole-dipole interaction and the hydrogen bond between polar molecules in the liquid will have a great absorption effect on the THz wave, making it very difficult to study the characteristics of biomolecular dynamics in a liquid environment by using THz technology. Microfluidic technology controls the thickness of the liquid sample by changing the depth of the liquid channel in the microfluidic chip reduce the interaction distance between THz wave and liquid sample, thus greatly reducing the absorption of THz wave by water. In this study, a reusable sandwich microfluidic chip was fabricated using double-sided adhesive and Zeonor 1420R material with a THz transmittance of 95%. The liquid channel’s length, width and depth are 2 cm, 5 mm and 50 μm, respectively. In addition, a refrigeration system is designed and manufactured, which is composed of a refrigeration chip, heat dissipation module, temperature sensor, incubator and temperature controller. The refrigeration system can cool the internal environment of the incubator and keep a constant temperature to a certain extent. During the experiment, the microfluidic chip filled with water is placed in the incubator, and the refrigeration system cools the water in the microfluidic chip. The THz transmission is measured every 1 ℃ from 8 to -3 ℃. Through the analysis of the experimental data, it is found that the THz transmission of water increases with the decrease of temperature, it shows that the absorption of THz wave by water decreases with the decrease of temperature. The results lay a foundation for the future study of THz absorption characteristics of liquid samples by microfluidic technology in different low-temperature environments and provide technical support for the application and development of THz in the biological field.
Sep. 01, 2022Vol. 42 Issue 9 2709 (2022)
Qing-song LIU, You-quan DAN, Peng YANG, Luo-peng XU, Fu-bin YANG, and Nan DENG
The development of a deep-sea methane sensor that can accurately, in real-time and in-situ, obtain hydrothermal methane data is of great significance for deep-sea research. Previously, two kinds of optical imaging interference systems that use methane radiation spectrum to detect and retrieve methane state parameters have been proposed. Firstly, based on the molecular spectral radiation theory, the theoretical relationship between molecular radiation spectrum and concentration, temperature and pressure is established. Then, combined with the characteristics of a high-pressure deep-sea-environment, the deep-sea molecular radiation model based on the Lorentz spectra line is established. The model provides a theoretical basis for the inversion of state parameters such as molecular concentration, temperature and pressure by spectral legal quantity. At the same time, it provides a powerful tool for deep-sea molecular spectrum simulation. Then, with the help of the molecular basic spectral line parameters provided by the HITRAN molecular spectral database, the light source spectral line of the methane imaging interference system is selected. Comparing the characteristic absorption spectra of CH4 molecule with CO2, H2S, H2O and other molecules in the 5 990~6 150 cm-1 band, the intensity of the CH4 spectral line is about 2~3 orders of magnitude higher than that of interfering molecules, and the six effective spectral lines of methane are evenly distributed in this band, with a spectral line spacing of about 2~3 nm, which is very suitable for temperature and other state parameters detection by the spectral method. Therefore, six methane spectral lines (1 640.37, 1 642.91, 1 645.56, 1 648.23, 1 650.96 and 1 653.72 nm) with weak spectral line interference, uniform spectral line distribution and moderate spectral line spacing are selected as the target light source spectral lines of methane imaging interference detection system. Finally, based on the deep-sea molecular radiation model and the basic spectral line parameters of methane in the HITRAN database, the radiation spectrum data of methane with arbitrary concentration, temperature and pressure are synthesized, and the variation characteristics of methane radiation spectrum with concentration, temperature and pressure are analyzed. For a single central spectral line, the radiance of methane molecules increases linearly with the increase of concentration, increases nonlinearly with the increase of temperature, and decreases nonlinearly with the increase of pressure. For the full band spectral line, the full width of the methane radiation spectrum widens with the increase of concentration and temperature and narrows with the increase of pressure. The theory and simulation results of the deep-sea methane radiation spectrum established in this paper can provide data support and a theoretical basis for developing and data inversion of marine in-situ methane sensors based on the spectral method.
Sep. 01, 2022Vol. 42 Issue 9 2714 (2022)
Heng XU, Hao-ran LIU, Xiang-guang JI, Qi-hua LI, Guo-hua LIU, Jin-ping OU, and Peng-cheng ZHU
Nitrogen dioxide (NO2) is one of the main pollutants in the atmosphere, which plays a key role in tropospheric and stratospheric atmospheric chemistry processes. It not only participates in the catalytic formation of tropospheric ozone, but also contributes to the formation of aerosols, which leads to climate disasters such as acid rain and endangers human health. NO2 from anthropogenic sources (industrial, power plant, transportation, etc.) accounts for the majority of the total NO2 emissions. Traditional monitoring methods, such as satellite remote sensing technology, are not sensitive enough to the bottom of the troposphere, while in-situ sampling instrument can only obtain the concentration information of pollutants near the surface. The multi-axis differential optical absorption spectroscopy (MAX-DOAS) technique, which has been widely used in recent years, is not only sensitive to near surface observation, but also has the advantages of high temporal resolution, low detection limit and simultaneous monitoring of multiple pollutants. In order to monitor the variation characteristics of the tropospheric column density of NO2 in Shanghai in real time, a ground-based MAX-DOAS instrument was set up in Xuhui District of Shanghai for long-term continuous observation. By analyzing the MAX-DOAS measurement data from June to September 2019, it is found that NO2 VCDs generally reach the peak value (1.56×10¹⁶ molec·cm-2) at about 9:00 in the morning, and the concentration decreases significantly with the increase of illumination, and reaches the lowest value (1.21×10¹⁶ molec·cm-2) in the afternoon, and increases again after 16:00 in the evening. In addition, the NO2 VCDs during the morning peak of weekday was significantly higher (about 11.8%) than that at the weekend, while the NO2 VCDs in the weekend evening increased significantly compared with that in the weekday evening. Comparing the MAX-DOAS observation results with the data of TORPOMI satellite, it is found that two data sets have a good agreement, and the correlation coefficient R is 0.87. Using the HYSPLIT backward trajectory model to cluster analysis the backward trajectory of air mass transport at 500 m height during the campaign, it is found that NO2 pollution in Shanghai is significantly influenced by the transportation of polluted air masses in coastal areas. Research shows that the ground-based MAX-DOAS system, as a real-time, rapid and continuous atmospheric monitoring method, can be widely used in urban area pollution monitoring applications. The observational research of tropospheric NO2 in Shanghai provides some data support for the prevention and control of air pollution in Shanghai.
Sep. 01, 2022Vol. 42 Issue 9 2720 (2022)
Chlorophyll is an important physiological parameter reflecting the health status of green vegetation. The change mechanism of chlorophyll and leaf spectrum under pest stress is complex. It is of great significance to analyze the relationship between chlorophyll and leaf spectrum in depth for pest detection. Taking Shunchang County, Nanping City, Fujian Province as the experimental area, the leaf SPAD and leaf spectrum of Phyllostachys pubescens under different damage scenarios were measured. Pearson correlation method was used to screen the leaf spectrum characteristic indexes, and multiple linear regression, ridge regression, random forest and XGBoost estimation models of leaf SPAD were established. By comparing the screening results of spectral characteristics and the estimation effect of the model, the relationship between chlorophyll and leaf spectral characteristics of Phyllostachys pubescens under the stress of Pantana phyllostachysae was analyzed. The results showed that: (1) SPAD of Phyllostachys pubescens leaves showed a downward trend with the increase of insect pests; (2) Compared with the undamaged state, the spectral characteristics of Phyllostachys pubescens leaves changed obviously under the stress of Pantana phyllostachysae, and the “green peak” and “red valley” tended to disappear, the slope of “red edge” decreased, and the reflectance of near infrared wavelength decreased. (3) The best spectral characteristics of leaf SPAD based on full sample fitting are VOG2, R515/R570, CIred, PRI and NDVI705, and the best estimation model is multiple linear regression model (R2=0.753 7, RMSE=3.015 0). (4) SPAD of Phyllostachys pubescens leaves was fitted based on samples with different damage degrees. The optimal spectral characteristic indexes were health: CIred, VOG2, ARVI, R515/R570, DVI; mild hazard: RENDVI, RERVI and REDVI; moderate hazard: RENDVI, RERVI and REDVI; severe hazard: VOG2, CIred, NDVI705; off year: PRI, NDVI705, VOG1, CIred.The best estimation model is the multiple linear regression model, and the model accuracy is healthy (R2=0.882 3; RMSE=1.638 8); mild hazard(R2=0.180 2; RMSE=3.335 4); moderate hazard(R2=0.360 4; RMSE=3.886 7); severe hazard (R2=0.467 7; RMSE=2.601 8); off year (R2=0.732 4; RMSE=2.375 4). It was found that with the increase of the damage grade, the spectral characteristic index of Phyllostachys pubescens leaves changed, and the estimation accuracy of the relational model showed a trend of sharp decline at first and then slowly rising. The model had better estimation effect on SPAD of healthy and young leaves, but poor estimation effect on SPAD of light-medium-severe damaged leaves. When the relationship between SPAD and spectral characteristics of Phyllostachys pubescens leaves tends to be disordered, it indicates that the harm of Pantana phyllostachysae may occur.
Sep. 01, 2022Vol. 42 Issue 9 2726 (2022)
Xin TANG, Sheng-ling ZHOU, Shi-ping ZHU, Ling-kai MA, Quan ZHENG, and Jing PU
Terahertz time-domain spectroscopy contains the chemical and physical information of samples and indicates the background information related to equipment noise, sample status and environmental parameters. Its diversified spectrum may affect the model’s performance and reduce the prediction accuracy. Therefore, extracting the characteristic information of target components, eliminatingredundant variables and screen the characteristic spectrum regions from the spectral data in a complex, overlapping and changing environment is of great significance for the quantitative and qualitative analysis of the terahertz spectrum. This paper collected the THz absorption spectra of 342 L-tartaric acid samples with concentrations of 10%, 20%, 40%, 50%, 60% and 80%. The B3LYP method in density functional theory (DFT) was used to optimize the monolecular model of L-tartaric acid based on 6-31G* (d, p) basis set, and the terahertz spectrum characteristics of the monolecular model were theoretically simulated. The molecular vibration modes corresponding to the characteristic wave peaks were analyzed, and the absorption spectra in the band of 0.2~1.6 THz were obtained. Compared with the measured absorption spectrum, the measured results agree well with the theoretical calculation results. The terahertz absorption spectrum of L-tartaric acid was screened using Bootstrapping soft shrinkage (BOSS). The competitive adaptive weighted sampling (CARS-PLS), Monte Carlo non-informational variable elimination (MC-UVE-PLS) and interval partial least square method (iPLS) were then compared and analyzed to obtain a better feature spectral region identification model. The analysis results indicate that the effective spectrum area obtained by the BOSS algorithm agrees better with the characteristic spectral region calculated by DFT theory. The L-tartaric acid spectrum modeling and regression analysis were conducted using full-spectrum PLS, CARS-PLS, MC-UVE-PLS, iPLS and BOSS algorithms. The experimental results imply that the prediction accuracy of the four spectral region screening methods is improved compared with the full spectrum PLS model. In addition, the prediction ability of the BOSS algorithm is improved most significantly by whose cross-validation root-mean-square error (RMSECV), prediction root-mean-square error (RMSEP), validation set determination coefficient (Rtest2) and test set determination coefficient (Rtrain2) are 0.026 0, 0.026 0, 0.988 1 and 0.987 5 respectively, with higher prediction accuracy and model stability than other models. Therefore, it is foreseeable that, this study may provide an effective method for rapid and quantitative detection based on terahertz spectroscopy.
Sep. 01, 2022Vol. 42 Issue 9 2740 (2022)
Jin LIU, Run-juan FU, Tong-shuai HAN, Rong LIU, and Di SUN
In the tissue composition measurements in vivo based on diffuse spectroscopy, the tissue differences or variations could induce a big uncertainty. Monitoring the tissues’ optical characteristics is necessary to improve the measurement accuracy. The measurement with single light source detector separation (SDS) is not suitable to be applied widely because the absorbance of diffuse light dose not vary with SDSs linearly then. The results with one SDS hardly are transferred to that with other SDSs. In this paper, we use two SDSs to perform a differential measurement and acquire the effective attenuation coefficient (EAC) for in vivo tissues, independent of the used SDSs as a comprehensive optical property related to tissue absorption and scattering. An optical fiber leads incident light, and two detectors are designed for the two SDSs, arranged circularly with multiple optical fibers. The SDSs applied are 0.6 and 2.0 mm, respectively. The acquired EAC spectra can monitor the tissue composition variations or tissue condition fluctuations. In tralipid solutions were used to mimic tissues, and the EAC spectra of glucose concentration, hemoglobin concentration, particle density and temperature in the waveband of 1 000~1 300 nm were investigated and compared. The results show that the EAC spectra mainly demonstrate the tissue absorption caused by the variables. The EAC spectra of hemoglobin show a similar characteristic with hemoglobin’s absorption as there is a more considerable absorption at 1 000~1 200 nm and a lower at 1 200~1 300 nm. The EAC spectra caused by temperature changes appear similar to the water’s absorption change under varying temperatures. The EAC spectra caused by scattering change show less specificity, and the spectra of glucose and particle density seem similar in that they only affect scattering as glucose has less absorption at this waveband. Furthermore, the EAC spectra of human bodies are investigated and their differences between individuals or test positions, including fingers, palms, backs of hands, and lateral arms. These EAC spectra of human bodies can demonstrate the tissue differences caused by hemoglobin, water and temperature etc. In summary, this EAC spectrum measurement approach is especially suitable for in vivo tissues and provides a new way for monitoring in vivo tissues in real-time as a good indicator of absorption or scattering of the tissues.
Sep. 01, 2022Vol. 42 Issue 9 2746 (2022)
Ming-bo LIU, Lei ZHAO, Xue-qiang HU, Zi-yue NI, Li-xia YANG, Yun-hai JIA, and Hai-zhou WANG
A high-through put μ-EDXRF instrument named NX-mapping with polycapillary optics and 4~6 SDD detectors placed symmetrically around the emitted focal spot was developed. We designed the software to control the X-ray source, multiple detectors, and high-precision stage and carried out the work of data collection, signal synchronization and result in analysis simultaneously. Due to the use of multiple detectors, the intensity of this XRF instrument was improved several times, and the RSD was reduced to 40% hasn’t deteriorated due to the differences between several detectors and the moving stage.There is no significant difference between the RSD of scanning a uniform sample with 2 mm×2 mm square 400 pixels and the fixed-point test, indicating that the motion mechanism and control algorithm performed well. The fluorescent knife-edge test was carried out forthe effective focal size testing of NX-mapping. The minimum effective focal size of Fe, Ni and Mo elements are 52.4, 49.3 and 39.03 μm. The law that each element’s effective focal spot size decreases with the increase of atomic number is summarized, which is consistent with the design principle of polycapillary optics.It is also found that the effective size of the focal spot of each element is sensitive to the change of height at the minimum value. Therefore, it is recommended to keep the surface of the sample flat in order to obtain uniform and clear images.Finally, the characteristic intensity of elements Ni, Ta, W and Re of a single crystal superalloy sample were scanned and analyzed by NX-mapping. The images of the dendritic structure can be distinguished, and the intensity of the Ni∶Ka characteristic line was up to 220 kcps, which was significantly higher than that of the ordinary XRF test. The NX-mapping μ-EDXRF instrument with multiple detectors, which provide high signal intensity, good test precision and shorter test time,can meet the requirements of high-through put testing.
Sep. 01, 2022Vol. 42 Issue 9 2752 (2022)
Shuang NI, Jia-xing WEN, Min-jie ZHOU, Jing-lin HUANG, Wei LE, Guo CHEN, Zhi-bing HE, Bo LI, Song-nan ZHAO, Zong-qing ZHAO, and Kai DU
COVID-19, which has lasted for a year, has caused great damage to the global economy. In order to control COVID-19 effectively, rapid detection of COVID-19 (SARS-CoV-2) is an urgent problem. Spike protein is the detection point of Raman spectroscopy to detect SARS-CoV-2. The construction of spike protein Raman characteristic peaks plays an important role in the rapid detection of SARS-CoV-2 using Raman technology. In this paper, we used Deep Neural Networks to construct the amideⅠ and Ⅲ characteristic peak model of spike proteins based on simplified exciton model, and combined with the experimental structures of seven coronaviruses (HCoV-229E, HCoV-HKU1, HCoV-NL63, HCoV-OC43, MERS-CoV, SARS-CoV, SARS-CoV-2) spike proteins, analyzed the differences of amideⅠ andⅢ characteristic peaks of seven coronaviruses. The results showed that seven coronaviruses could be divided into four groups according to the amideⅠ and Ⅲ characteristic peaks of spike proteins: SARS-CoV-2, SARS-CoV, MERS-CoV form a group; HCoV-HKU1, HCoV-NL63 form a group; HCoV-229E and HCoV-OC43 form a group independently. The frequency of amideⅠ and Ⅲ in the same group is relatively close,and it is difficult to distinguish spike proteins by the frequency of amideⅠ and Ⅲ; the characteristic peaks of amideⅠ and Ⅲ in different groups are quite different, and spike proteins can be distinguished by Raman spectroscopy. The results provide a theoretical basis for the development of Raman spectroscopy for rapid detection of SARS-CoV-2.
Sep. 01, 2022Vol. 42 Issue 9 2757 (2022)
Zi-xuan LI, Hong LIU, Yan-dong ZHANG, Xiao-jing WU, and Long-jiu CHENG
Fatty acids have been used in organic solid-liquid transformation materials due to their low cost, high latent heat of phase transition and good thermal stability. Although thermogravimetry (TG) and differential scanning calorimetry (DSC) for fatty acids can obtain thermodynamic data, it is difficult to analyze structural changes. Under the temperature perturbation, the two-dimensional infrared spectrum (2D-IR) signal will change instantaneously, and the structure change can be found by mathematical processing. In this paper, the infrared spectra of myristic acid were tested at 4 000~400 cm-1 and 30~100 ℃. The C=O bond and O—H bond were analyzed by a two-dimensional moving window (MW2D) infrared spectrum, and it was found that the melting point measured by MW2D was the same as that measured by DSC. The results of the 2D-IR analysis showed that the overlapping absorption peaks were separated due to the improvement of resolution, and it was speculated that there was a transition from dimer to monomer configuration of myristic acid. There are three changes in the C=O bond and O—H bond at temperature rise. Before the phase transition temperature, the absorption peak strength of C=O remained unchanged, while the absorption peak strength of O—H gradually decreased, indicating that the dipole moment change of the O—H bond was more susceptible to temperature than the C=O bond. During the phase transition, both of the absorption peak intensity decreased significantly, and the absorption peak intensity of the O—H decreased greatly. After the phase transition temperature, it may be that the intermolecular hydrogen bond is heated from strong to weak, and the electron cloud on O—H moves to C=O, which leads to the increase of the C=O absorption peak intensity and the decrease of the O—H absorption peak intensity. At the same time, combined with density functional theory, the inferences of 2D-IR have been verified, and there exists a transformation process from dimer to monomer configuration of myristic acid.
Sep. 01, 2022Vol. 42 Issue 9 2763 (2022)
Zi-jin BAI, Jie PENG, De-fang LUO, Hai-hui CAI, Wen-jun JI, Zhou SHI, Wei-yang LIU, and Cai-yun YIN
Monitoring total nitrogen content rapidly and accurately in farmland soils can significantly improve the efficiency of soil fertility diagnosis and evaluation efficiency. Traditional methods for measuring total soil nitrogen have disadvantages such as time-consuming, high cost, and environmental pollution, while the quantitative method of total soil nitrogen based on spectroscopic principles overcomes the disadvantages of traditional measurements. Mid-infrared (MIR) spectroscopy has morebands and information than visible-near infrared (VNIR) spectroscopy, and how to use MIR spectroscopy to monitor soil total nitrogen content has not been systematically studied in China. In order to explore the feasibility of mid-infrared spectroscopy for soil total nitrogen monitoring,we selected 246 farmland soil samples in the southern Xinjiang region as the research objects and used total nitrogen content and mid-infrared spectral reflectance data measured in the laboratory to analyze the differences mid-infrared spectral characteristics of soil samples with different total nitrogen content. Firstly, the dimension of spectral data was reduced by the principal component analysis (PCA) and successive projections algorithm (SPA) and then used four modeling methods including the partial least squares regression (PLSR), support vector machine (SVM), random forest (RF) and back propagation neural network (BPNN) to construct the quantitative inversion model of soil total nitrogen content based on the full-band and dimension-reduced data, respectively. The results showed that: (1) the spectral reflectance of soil in the mid-infrared band increased with the increase of total nitrogen content with a significant absorption valley near 3 620, 2 520, 1 620 and 1 420 cm-1. The correlation between soil spectral reflectance and total nitrogen content could improve significantly after the maximum normalization of mid-infrared spectral data. (2) Comparing the two data dimension reduction methods, PCA and SPA reduced the number of model variables by 99.8% and 97.5% respectively. However, the prediction accuracy of the model established with the eight principal components extracted by PCA as independent variables were generally higher than that of the corresponding model of SPA. Therefore, the modeling with the principal components extracted by PCA was more suitable for constructing the soil total nitrogen model. (3) In the modeling set, the PLSR and SVM models had the highest accuracy in full-band modeling, but the modeling efficiency was low due to alarge number of modeling variables. However, based on the RF and BPNN models, using the data after dimension reduction by PCA and SPA for modeling respectively, while maintaining the comparative accuracy, the modeling efficiency can be significantly improved. In the prediction set, the BPNN model based on PCA dimension-reduced data had the highest prediction ability, with R2 and RMSE of 0.78 and 0.12 g·kg-1, RPD and RPIQ of 2.33 and 3.54, respectively, indicating that the model had great prediction ability. The study results can provide some reference values for the rapid estimation of total nitrogen content in farmland soil.
Sep. 01, 2022Vol. 42 Issue 9 2768 (2022)
Shi-jie LIU, Yao-di ZHU, Miao-yun LI, Gai-ming ZHAO, Li-jun ZHAO, Yang-yang MA, and Na WANG
In order to explore the Raman fingerprint of food-borne pathogenic bacteria spores for rapid identification. In this study, the spores of C. perfringens, C. difficile and B. cereus were used as the research objects. The SERS technology of AgNPs synthesized by the sodium citrate reduction method was used to detect the Raman spectroscopy of food-borne pathogenic bacteria spores and analyze the similarities or differences among different spores. The SERS spectra of three kinds of food-borne pathogenic bacteria spores were combined with principal component analysis (PCA) and hierarchical cluster analysis (HCA) for comparative analysis to identify different species of food-borne pathogenic bacteria spores. The results showed that the SERS spectra of different food-borne pathogen spores had sufficient specificity and reproducibility. In the SERS spectra of spores, the number and intensity of Raman vibration peaks of Ca2+-DPA were dominant, and the Raman vibration peaks were located at 657~663, 818~820, 1 017, 1 389~1 393, 1 441~1 449 and 1 572~1 576 cm-1. The intensity of six characteristic peaks of Ca2+-DPA in SERS spectra of C. difficile spores were higher than that of C. perfringens spores and B. cereus spores, followed by C. perfringens spores. The Raman peak intensity of Ca2+-DPA at 1 017 cm-1 (Ca2+-DPA) of the three spores was the highest, and the difference was noticeable, which was the main characteristic peak of Ca2+-DPA and the main characteristic peak of the three spores. In addition, C. perfringens spores showed unique Raman peaks at 936 cm-1 (N—C stretching of phospholipid), 1 294 cm-1 (CH2 deformation vibration of lipid), 1 609 cm-1 (tyrosine of protein) and 1 649 cm-1 (amide Ⅰ of protein). C. difficile spores showed unique Raman peaks at 890 cm-1 (=C—O—C=stretching). PCA analysis showed that the variance contribution rates of PC1 and PC2 were 51.10% and 39.70%, respectively, and the cumulative contribution rate was 90.8%, which could effectively distinguish all samples. HCA analysis indicated that the SERS spectra of the three spores were divided into three clusters, and each cluster of the three spores had no cross-interference. The combination of multivariate statistical analysis effectively realized the distinction among the three spores and distinguished the distinction between Clostridium spores and Bacillus spores, providing an effective means for food safety control.
Sep. 01, 2022Vol. 42 Issue 9 2774 (2022)
Yan-de LIU, Jun LIAO, Bin LI, Xiao-gang JIANG, Ming-wang ZHU, Jin-liang YAO, and Qiu WANG
Gongpear is a popular fruit. In order to study the influence of different detection directions on the online detection of soluble solid SSC in Gongpear by NIR, a global model was proposed, and its robustness was analyzed. The spectra were collected from Gongpears in six directions: stem-calyx axis vertical, stem-upward (A1) and stem-downward (A5), between the stem-calyx axis and horizontal 45°, stem-upward sloping (A2) and stem-downward sloping (A4), stem-calyx axis horizontal, stem-right light oriented (A3), stem-calyx axis horizontal, stem-band moving direction (A6). The 150 samples with SSC ranging from 9.53 to 14. 70 were divided into 115 calibration sets with a standard deviation of 1.05 and 35 prediction sets with a standard deviation of 0.93. Six local models and one global model were established by partial least-squares regression (PLSR). The local models were established by partial least-squares regression (PLSR) after 115 calibration sets of data in each direction were preprocessed by Savitzky-Golay convolution smoothing, Multiple Scattering Correction(MSC)and Gaussian Filtering Smoothing (GFS). The local model established by the local correction set was used to verify the data of 35 prediction sets in the local direction. Compared with the PLSR model established by the three pretreatment methods, the results showed that the model established by GFS processing had the best validation effect. Therefore, the PLSR model established by GFS processing was used for all the six local and global models. The global model is a Gongpears SSC model established by PLSR after GFS pretreatment from 690 calibration sets of spectral data in A1, A2, A3, A4, A5 and A6. The prediction sets in each direction verified the seven models. The verification results showed that although the prediction effect of the local model was stronger than that of the global model in the local direction, it could not be verified in other directions and the robustness was poor. Therefore, different detection directions had a great influence on the prediction effect. The global model can accurately predict the SSC of Gongpears pear in each detection direction. The global model’s correlation coefficient (Rc)is 0.828, and the root mean square error RMSEC is 0.424. The correlation coefficients (Rp) of A1, A2, A3, A4, A5 and A6 prediction sets were 0.818, 0.765, 0.799, 0.821, 0.794 and 0.824, and the root mean square errors RMSEP were 0.446, 0.525, 0.478, 0.538, 0.486 and 0.619, respectively. The Rp and Rc in six directions are close to each other and are around 0.800, the RMSEC and RMSEP are around 0.500. The results show that the global model has excellent robustness in detecting gongpear SSC in different directions.
Sep. 01, 2022Vol. 42 Issue 9 2781 (2022)
Visible and near-infrared (VIS-NIR) non-imaging spectroscopy has been widely applied to estimate soil organic carbon (SOC) content. Due to the high demand for soil sample pretreatments, VIS-NIR non-imaging spectroscopy easily suffers from soil roughness in practical application. This study explored the potential of imaging spectroscopy to estimate SOC content with high soil roughness. With soil samples collected in Iowa State, United States, imaging spectra were utilized to measure the VIS-NIR spectra of soil samples with and without ground. With five spectral pre-processing including continuum removed (CR), absorbance transformation (AB), S-G smoothing (SG), standard normal variate (SNV), and multiplicative scatter correction (MSC), partial least squares regression (PLSR) and support vector regression (SVR) were used to build estimation models to analyze the potential of imaging spectra. Non-imaging spectra were also applied to build PLSR and SVR models as a comparison. Results demonstrated that imaging spectra could achieve SOC content estimation for soil samples with high roughness, but non-imaging spectra could not successfully estimate that. The best PLSR and SVR model developed by imaging spectra could reach 0.739 and 0.712 of R2 for SOC content estimation of soil samples with high roughness, while that established by non-imaging spectra could achieve 0.344 and 0.311 of R2. Based on the imaging spectra after the four pre-processing methods of AB, SG, SNV, and MSC, the performance of the PLSR model established before soil sample grinding was better than that of the PLSR model established after soil sample grinding, while the performance of the SVR model was just the opposite. For non-imaging spectra, the accuracies of PLSR and SVR models established after soil samples grinding were always better than that of models established before soil samples grinding. For these two spectral data and the two estimation models, different spectral pre-processing methods had different abilities to improve the estimation accuracy of the model. The performance of imaging spectroscopy outperformed non-imaging spectra before or after being ground soil samples. Imaging spectra could enhance the correlation coefficient between VIS-NIR spectra and SOC for soil samples with high roughness, there by improving PLSR model’s performance. Our findings provide a new way to estimate SOC content on large-scale yield because imaging spectra could overcome the influence of soil roughness.
Sep. 01, 2022Vol. 42 Issue 9 2788 (2022)
Ji MA, Guo-xia HUANG, Jun-sheng LI, Liu-juan YAN, and Qian ZHANG
Hydrogen peroxide (H2O2) is widely used in the food industry, environmental monitoring and analysis, fuel cell, clinical diagnosis and other fields. Hydrogen peroxide is not only a biomarker of severe diseases but also an important food additive. In terms of food safety and human health, it is of great significance to construct a simple, rapid and sensitive detection method. Colorimetric method is widely concerned because of its advantages such as easy operation, low cost and visualization of detection results. The enzyme commonly used in colorimetric method is horseradish peroxidase (HRP). However, natural enzymes are easy to deactivate, have high production costs and have poor stability. Nanoenzyme overcomes the disadvantage of HRP’s easy inactivation. However, some nanoenzymes are complex in synthesis, need to be characterized, and have poor water solubility and have low catalytic activity. Compared with HRP and nanoenzyme, copper ion (Ⅱ) with peroxidase-like properties has the characteristics of high sensitivity and does not need complex synthesis, is easy to obtain, easy to store, without modification can be directly used, simple operation and low analysis cost, etc. Copper ion (Ⅱ) can catalyze hydrogen peroxide to generate hydroxyl radicals and oxidize 3,3’,5,5’-tetramethyl benzidine (TMB) to produce the oxidation state TMB, which makes the color in the solution gradually change from colorless to blue, thus producing light signals that can be recognized by the naked eye and detected by ultraviolet spectrophotometer. Based on the above principles, a fast colorimetry sensor based on hydrogen peroxide was constructed and applied to detect tremella samples. The effects of hydrogen peroxide concentration, pH value, temperature and other factors on the absorbance were investigated. The pH value of the buffer solution was 3.0, the temperature was 40 ℃, the concentration of TMB and Cu(Ⅱ) was 6.0×10⁻⁴ and 4.0×10⁻³ mol·L-1, respectively, and the reaction time was 20 min. Under the optimal conditions, the concentration of hydrogen peroxide had a good linear relationship with the absorbance of the system, the linear range was 0.08~40 μmol·L-1, and the detection limit was 0.14 μmol·L-1. The recoveries of hydrogen peroxide in tremella were 97.10%~107.08%, and the relative standard deviation (RSD) was less than 5%. In this study, a simple, rapid, low-cost and sensitive visual detection of hydrogen peroxide was achieved without special detection equipment, which is conducive to the rapid promotion of quantitative detection of hydrogen peroxide in the food field and clinical practice.
Sep. 01, 2022Vol. 42 Issue 9 2795 (2022)
Zi-yun HONG, Cheng-lin YAN, Hong MIN, Yan-jun XING, Chen LI, and Shu LIU
The information on coal species provides technical support for evaluation of coal quality and import and export tax. Traditional coal identification methods require the determination of indicators such as dry ash-free volatile matter, the light transmittance of low-rank coal, bonding index, the gross calorific value on the moist ash-free basis of coal samples and other indicators, with large energy consumption and long detection cycle, which is not conducive to the rapid customs clearance at ports. Due to the advantages of no chemical reagents consumption, and fast and low cost, the research on coal identification by near-infrared spectra has attracted extensive attention. However, there has not been any application for the identification of coal from different sources in the world so far, and the correlation between NIR spectral characteristics of cal and coal species remains to be explored. This research collected 410 representative samples of imported coal from 9 countries, including Australia, Russia and Indonesia, etc. involving lignite, bituminous coal and anthracite. By analyzing the near-infrared spectrum, it is found that the differences in NIR spectra of different coal species mainly focus on absorbance, spectral slope and characteristic peak. Combining sample composition information, X-ray diffraction analysis and near-infrared spectra to analyze the reasons for these differences shows that the NIR absorbance is positively correlated with the fixed carbon content in coal, and the spectral slope is negatively correlated with this the aromatization of coal. The increase of coal aromatization leads to the increase of the absorption coefficient in the long-wavelength direction and the decrease of the spectral slope. Spectral characteristic absorption peaks are mainly the characteristic information of water and hydrogen-containing groups of organic substances, and the intensity of characteristic peaks depends on the content of water and volatile matter in coal. Principal component analysis (PCA) was used for data dimension-reduction, and the spectral variables were reduced from 1 557 to 394. The first 10 principal components were discriminated step by step, and PC1, PC2, PC3, PC4, PC6, PC7, PC8, PC9 and PC10 were selected as input variables to establish the Fisher discriminant analysis model for coal species identification. The verification accuracy of modeling sample was 98%, the cross-validation accuracy was 97.8%, and the verification accuracy of the test sample was 99.1%. PCA load diagram shows that PC1 and PC2 are mainly related to the volatile content of coal, followed by moisture content. The correlation between the discriminant function 1 (57.7%) and PC1 was the strongest, and the correlation between the discriminant function 2 (42.3%) and PC2 was the strongest, which indicated that the difference between volatile content and moisture content in different coal species was the internal basis for the identification of coal species by NIR.
Sep. 01, 2022Vol. 42 Issue 9 2800 (2022)
Si-ying CHEN, Yi-wen JIA, Yu-rong JIANG, He CHEN, Wen-hui YANG, Yu-peng LUO, Zhong-shi LI, Yin-chao ZHANG, and Pan GUO
Manuka honey is produced in New Zealand and has strong antibacterial and antioxidant effects. The price is relatively high, and adulteration incidents have occurred frequently in recent years. This paper uses laser-induced fluorescence (LIF) technology to classify and identify Manuka honey adulterated with syrup. Four commonly used lasers of 266, 355, 405 and 450 nm are selected as excitation sources, and three brands of New Zealand Manuka honey (No. A, B and C) adulterated with baking syrup are used as experimental samples. The adulteration ratio ranged from 0% to 90%, with an interval of 10%. Each sample solution has been tested 60 times under different excitation wavelengths, with a total of 7 200 sets of data. For the spectral data, firstly, pretreat with fluorescence band interception, smoothing and normalization; Then, randomly select 80% of the data as training and 20% as test sets. Principal component analysis (PCA) combined with linear discriminant analysis (LDA) is used to reduce the dimension of the training set data; Finally, K-nearest neighbor (KNN) and support vector machine (SVM) classification models are established for the dimensionality reduction data respectively, and the test set data are classified and identified by the models. After 50 times of random grouping and classification calculation, the recognition rate’s average value and standard deviation are obtained. The experimental results show that the excitation wavelength greatly influences the final recognition results. The recognition rate of 266 nm excitation is the highest. The recognition rates of the three Manuka adulterated solutions are more than 98.5%, and the highest can reach 100%; 355 and 405 nm excitation are the second, and the recognition rates of all samples are greater than 92%; The classification effect of 450 nm excitation is the worst, with the recognition rates less than 66%. Therefore, the comparison of classification algorithms only uses the spectral data excited by 266, 355 and 405 nm. The analysis results show that the classification effect of the KNN algorithm is better than the SVM algorithm. For the three honey adulterated solutions excited by 266 nm, the recognition rates of the KNN algorithm are more than 1% higher than that of the SVM algorithm. According to the experimental results, using LIF to classify and identify adulterated Manuka honey is feasible. For Manuka honey adulterated with syrup, among all combinations used in this paper, 266nm excitation combined with PCA-LDA and KNN algorithms has the highest recognition rate and the best classification effect, which provides an effective method for rapid and accurate identification of adulterated Manuka honey.
Sep. 01, 2022Vol. 42 Issue 9 2807 (2022)
Xiao-li CHEN, Li-chun WANG, You-li LI, and Wen-zhong GUO
Lettuce (Lactuca sativa) was cultured in a completely enclosed plant factory and irradiated with an intelligent LED light system with accurate regulation of spectral space-time distribution. Absorption and content of eight mineral elements such as K, P, Ca, Mg, Fe, Mn, Zn and Cu in Lactuca sativa exposed to alternating red and blue light spectrum with different alternating intervals were studied by ICP-AES technology. The results showed that: (1) Compared with concurrent red and blue light spectrum, all the alternating spectrum treatments increased shoot biomass of lettuce, the increasing range of fresh weight and dry weight was respectively 18.6%~67.4% and 5.1%~88.0%. All the alternating spectrum treatments significantly increased the accumulation of Mg, Fe and Zn in the lettuce plant (p<0.05); all the alternating spectrum treatments decreased the content of Ca in lettuce to different extents. (2) Fe content in lettuce subjected to R/B(5 m) was significantly higher than any other treatment, increasing by 38.87%~85.37% compared with the other treatments. Alternating red and blue light spectrum with high alternating frequency seemed to stimulate Fe uptake by lettuce plants. (3) Alternating red and blue light spectrum enhanced the use efficiency of light photons and electricity by lettuce. Compared with RB, all alternating treatments significantly improved the light and electric use efficiency of leaf lettuce by about 34.3%~87.5% and 34.6%~87.9%; Among them, the light and electric use efficiency of leaf lettuce were both the largest under the alternating treatment with an interval of 4 h, which were 6.13% and 2.01% respectively. Except for the alternating treatments with the intervals of 5 m and 10 m, no significant difference existed in the light and electric use efficiency of plants among the alternating spectrum treatments. (4) The absorption of K and Mg by lettuce showed antagonism under the alternating intervals of 10m, 15 m, 60 m and 4 h. (5) The contents of P, Ca, Fe and Mn in lettuce treated with R/B(30 m) showed the lowest level among treatments, and the contents of P and Ca were significantly lower than the control.
Sep. 01, 2022Vol. 42 Issue 9 2813 (2022)
Song-tao CAI, Hua-lin XIE, and Jian-hua HUANG
Cereal-based complementary food for infants and young children is an important energy source for infants and young children nutrition. The main raw material for the cereal-based complementary food is rice. While, rice can easily absorb heavy metal Cd from the soil and water in growing process, result in a relatively high residual concentration of Cd in rice, and posing a potential threat. In this paper, a new strategy for determination of heavy metal Cd in cereal-based complementary food for infants and young children by inductively coupled plasma tandem mass spectrometry (ICP-MS/MS) was proposed. The sample was directly determined by ICP-MS/MS after microwave digestion. The main spectral interferences in the determination process were Mo based polyatomic interference ions (MoO+, MoN+, MoC+) formed by high concentration Mo, and isobar (112Sn+, 114Sn+, 116Sn+) formed by Sn. In order to eliminate these interferences, in the MS/MS mode, using H2, NH3/He, and O2 as reaction gas, the interference elimination effect and analysis sensitivity of different Cd isotopes were investigated. The results show that in the H2 and NH3/He reaction mode, both H2 and NH3 can undergo mass shift reaction with Mo-based interfering ions, but cannot react with Sn+. 110Cd+, 111Cd+, 113Cd+ can be selected for determination. However, the reaction speed of H2 and Mo-based interfering ions is slow, and it is difficult to completely eliminate the mass spectral interference of Cd in high-concentration Mo-based matrix. In the O2 reaction mode, all interfering ions can undergo mass shift reaction with O2. Although the analytical sensitivity obtained is slightly lower than that in the NH3/He reaction mode, the background equivalent concentration (BEC) is significantly lower than that in the NH3/He reaction mode. The optimal analysis scheme for eliminating the interference in the determination of Cd with O2 as the reaction gas was determined. The accuracy of the method was evaluated by using standard reference materials, and the reliability of the method was verified by comparative analysis with the national standard method (GB5009.268—2016). The results showed that the LOD of Cd is 2.03~13.4 ng·L-1, and the measured value of the standard reference materials is basically the same as the certified value. At the 95% confidence level, there is no significant difference between the comparative analysis results. The method has high sensitivity, accurate and reliable results, and is suitable for the high-throughput determination of heavy metal Cd in large quantities of cereal-based complementary food for infants and young children.
Sep. 01, 2022Vol. 42 Issue 9 2818 (2022)
Pan LIU, Jing-bin LI, Jian-hao ZHANG, Yi ZHANG, Guo-liang CHANG, Peng-fei HE, Bin-bin ZHANG, and Xin-yao ZHANG
Welding flux, such as fused and agglomerated flux, are composed of various inorganic and organic minerals such as silicates, carbonates, oxides, fluorides, iron alloys and metal powder. They are prepared by smelting, sintering, binding or mixing. Welding flux would play an important role in slagging, deoxidation, gas making, arc stabilization and alloying in the fusion welding of steel and nickel-based alloys. They have been widely used in the engineering fields, including shipbuilding, ocean engineering, energy, metallurgy, chemical, and machinery. Phosphorus is a trace and harmful impurity element in iron, steel and nickel-based alloy materials, which could reduce the mechanical properties of materials by causing embrittlement and micro-cracks in deposited metals and welded seams. The accurate and rapid determination of phosphorus in welding flux is significant to performance evaluation and quality control. Working conditions for determining phosphorus in welding flux by inductively coupled plasma atomic emission spectrometry with ultrasonic-assisted hydrochloric acid were optimized, such as radio frequency power, gas flows of atomization, auxiliary and plasma, and analysis line. The optimized operating parameters were obtained below: The radio frequency power was set to 1.2 kW, and the gas flows of atomization, auxiliary and plasma were set to 0.75, 1.0 and 12 L·min-1, respectively. P 213.617 nm was selected as the analysis line. The sample suspension was prepared with a 0.5 g welding flux sample in 20 mL hydrochloric acid with ultrasonic-assisted extraction for 30 min and was heated to boiling with 2 mL nitric acid. After cooling, the volume of suspension was adjusted to 100 mL by pure water. Then the suspension was dry filtered, and the filtrate was used for measurement. A series of solutions for developing a calibration curve was prepared with 20 mL hydrochloric acid and 2 mL nitric acid as the matrix. The linear correlation coefficient of the calibration curve was 0.999 9, and the quantification limit was 0.0012%. The actual sample and certified reference materials of welding fluxes with phosphorus between 0.003% to 0.03% were determined, and the results were consistent with the certified or obtained the standard. The relative standard deviations (n=6~10) of determination results were less than 8%, and the recoveries were between 93% to 110%. The proposed method has the advantages of accuracy, fast and convenience. It is suitable for the rapid inspection of phosphorus in welding fluxes.
Sep. 01, 2022Vol. 42 Issue 9 2824 (2022)
Ying-rui GENG, Huan-chao SHEN, Hong-fei NI, Yong CHEN, and Xue-song LIU
Tobacco is a natural plant with complex compositions, the quality of tobacco leaves is directly affected by several external factors such as geographic location and growth conditions. Tobacco leaves are widely planted in China, and they cultivated in different areas, they have different styles. Different blended ratios play a decisive role in the quality of cigarettes. Thus, there is an emerging need for accurate and rapid identification of the origin of tobacco leaves. Near-infrared spectroscopy technology provides a new rapid, and convenient method to automatically evaluate tobacco areas. On this basis, we proposed the grey wolf optimizer (GWO) algorithm to optimize the performance of the support vector machine model (SVM) for the first time to identify and classify tobacco leaves from different origins. This study was conducted with 824 tobacco leaf samples from eight different origins, and 617 training set samples and 207 test set samples were obtained using Set partitioning based on joint x-y distance (SPXY). The wavelength selection methods such as Competitive adaptive reweighted sampling (CARS) and Random frog (RF) algorithms were applied to reduce spectral redundant information and screen the characteristic wavelengths in the -full spectrum of the samples, and 141 and 534 were selected from all 1 609 variables, respectively. Then they were used as the input parameters of the SVM classifier. The optimization effect of GWO on the SVM model was contrasted to the Particle swarm optimization (PSO) and Genetic algorithm (GA) optimization in the same search range. The analysis showed that the spectral variables screened by RF had a better modeling performance than CARS. Among them, the RF-GWO-SVM model achieved the best predictive performance with an accuracy of 96.62% in identifying tobacco leaves from 8 producing areas. More than that, the running time of RF-GWO-SVM was 156 and 131 min shorter than RF-PSO-SVM and RF-GA-SVM, respectively. To sum up, RF-GWO-SVM has the advantages of higher accuracy and faster convergence speed. It can be seen that GWO has a more efficient optimization capability for model parameters, and the support vector machine model optimized by GWO can be used for rapid identification of tobacco origin.
Sep. 01, 2022Vol. 42 Issue 9 2830 (2022)
Soluble solid content (SSC) and titratable acidity (TA) are important indexes affecting the fruit quality and the fruit quality grading. Classical destructive detection methods are not suitable for fruit classification by quality. NIRS detection method is fast, easy to operate and can detect fruit quality without damage. In order to achieve non-destructive and rapid determination of SSC and TA in Angeleno plum fruits by near-infrared spectroscopy (NIR), diffuse reflectance spectra of plum fruits were collected by NIR spectrometer, SSC was measured by saccharometer, and TA content was determined by titration. Using leverage and F probability value to eliminate abnormal samples and software optimization combined with a manual screening of spectral bands, eliminating constant offset, subtracting a straight line, standard normal variate (SNV), max-minimum normalization, and multiplicative scatter correction (MSC), first and the second derivative combined smoothing, the first derivative combined minus a straight line and smoothing, and the first derivative combined with SNV or MSC correction. Partial least squares (PLS) and back propagation artificial neural network (BP-ANN) were used to establish the quantitative models of SSC and TA of plum fruit. Results indicated that the best Band ranges of plum fruit SSC and TA are 4 000~8 852 and 4 605~6 523 cm-1 respectively. The best spectral preprocessing method of the PLS model of SSC was MSC correction. The best model correction correlation coefficient (Rc) was 0.914 4, the prediction correlation coefficient (Rp) was 0.878 5, the correction root means square error (RMSEC) was 0.91, and the prediction root means square error (RMSEP) was 1.00. After the first order differential combined with SNV and 9-point smoothing, the PLS model of TA was the best, and the Rc, Rp, RMSEC and RMSEP were 0.860 3, 0.819 6, 0.80 and 0.86. The principal components of SSC and TA spectral data of plum fruits were extracted, and the optimal BP-ANN quantitative analysis model of SSC and TA were established based on the first 10 principal component scores. The SSC BP-ANN model’s Rc, Rp, RMSEC and RMSEP were 0.976 7, 0.889 7, 0.75 and 0.99. The corresponding parameter values of the BP-ANN model of TA were 0.974 3, 0.897 7, 0.62 and 0.83, respectively. Compared with the quantitative model established by the PLS algorithm, the BP-ANN model has higher Rc and Rp and lower RMSEC and RMSEP than that of the PLS algorithm, so the quantitative analysis results from the BP-ANN model were better than that of the PLS algorithm for SSC and TA indicators.
Sep. 01, 2022Vol. 42 Issue 9 2836 (2022)
Xiang-hui DONG, Fang-wei YANG, Hang YU, Wei-rong YAO, and Yun-fei XIE
Zilpaterol is a β2-receptor agonist, also known as “Clenbuterol”, often used in livestock breeding by illegal businesses. There is no relevant national standard that stipulates its residue limit. After the veterinary drug enters the animal’s body, it can change the metabolic mode of certain nutrients, promote the growth of the animal’s muscle, and rapidly consume and transform the fat in the animal’s body, thereby increasing the lean meat rate of the animal. The current detection method for the drug is mainly liquid chromatography-tandem mass spectrometry, which has the disadvantages of high cost, cumbersome operation, and long time-consuming. Surface-enhanced Raman spectroscopy has the advantages of high sensitivity and fast detection speed. In recent years, it has beenwidely used to detect toxic and harmful substances in food. In order to realize the rapid detection of zilpaterol in pork, a surface-enhanced Raman spectroscopy method for rapid detection of zilpaterol residue in pork was established. By optimising and comparing a series of experimental results, it is determined that the best volume ratio of sample to gold glue is 1∶2, and the best mixing detection time is 3 min.Through the comparison of multiple extraction solvents, it is finally determined that ethyl acetate is used as the extractant;through the calculation of the theoretical spectrum of B3LYP/6-311 + G(d) basis group aligned patro in density functional theory, the SERS characteristic peak of zipatro is determined and the vibration is assigned. The characteristic peaks at 1 116, 1 447 and 1 573 cm-1 are taken as the characteristic quantitative peaks of zilpaterol, of which 1 116 cm-1 is caused by the in-plane deformation vibration of a benzene ring, and 1 447 cm-1 is the out of plane swing vibration of C—H bond, 1 573 cm-1 is the stretching vibration of C—H bond of the benzene ring. Under the best experimental conditions, a standard curve of the characteristic peak SERS signal and concentration logarithm of zilpaterol standard solution was established, and the R2 value of the linear equation was all above 0.9; actual samples with different spiked concentrations were performed. The detection showed that the average recovery rate was 80.39%~101.24%, and the RSD value was 7.90%~8.94%. This method is convenient, fast, and stable. It can realize the rapid and accurate determination of zilpaterol residues in pork without complicated sample pretreatment. It provides a new method for detecting zilpaterol and the formulation of related standards.
Sep. 01, 2022Vol. 42 Issue 9 2843 (2022)
Water deficit of citrus leaves is one of the important factors affecting the growth of citrus. In order to study the effect of water stress on the moisture content of citrus, hyperspectral technology was used to rapidly and non-destructively detect the moisture content of citrus leaves, and pseudo-color processing was applied to realize the visualization of moisture content. 100 citrus leaves were collected, and 500 leaves with different gradient moisture content were obtained by drying method. The samples were divided into a training set (350 samples) and a testing set (150 samples) according to the ratio of 7∶3. The determination coefficient (R2) and root mean square error (RMSE) was used to evaluate the model’s prediction quality. A convolution neural network (CNN) is used to predict spectrum data. The CNN model uses a one-dimensional convolution kernel with three convolution pooling layers activated by the RELU activation function. The output layer uses a linear activation function for regression prediction, and the nadam algorithm is used to optimize and update the model with 1 000 epochs; The Raw spectrum data and the spectrum data are pretreated by SG, MSC and SNV are used respectively. The full bands, the feature bands screened by CARS and the feature bands extracted by PCA are imported into the CNN model respectively. The best model is CARS-CNN of the Raw spectrum data, the Rc2 and RMSEC of the training set are 0.967 9 and 0.016 3 respectively. The Rv2 and RMSEV of the testing set are 0.947 0 and 0.021 4, respectively. The effect of the full bands CNN model of the Raw spectrum data is the second, and the Rc2 and RMSEC of the training set are 0.934 3 and 0.024 9, respectively. The Rv2 and RMSEV of the testing set are 0.915 9 and 0.028 6, respectively; At the same time, the best combined results of the support vector machine regression model (SVR), partial least squares regression model (PLSR) and random forest model (RF) under different pretreatment methods and characteristic wavelength selection were compared. The best combination model (Raw spectrum+CARS+PLSR, SNV+PCA+RF, SNV+PCA+SVR) was compared with CARS-CNN of Raw spectrum data, CARS-CNN model still has the best prediction effect. Compared with other models, the CARS-CNN model has higher prediction accuracy than SVR, PLSR and RF models, after further feature extraction by CARS and convolution kernel. Select the trained CARS-CNN model, import the hyperspectral image into the model, calculate the moisture content of each pixel, and get the pseudo-color image, which can more intuitively display the visual distribution of leaf moisture content. The result provides a faster, more intuitive and more comprehensive assessment of citrus leaf moisture content, a basis for the study of citrus leaf water stress, and a reference for optimising intelligent irrigation decision-making.
Sep. 01, 2022Vol. 42 Issue 9 2848 (2022)
Dan-dan LÜ, Hui-ru WEI, and Wei-gang ZHANG
Using polydimethylsiloxane (PDMS) modified epoxy resin (HYSZ) as a binder, Sm2O3 as a functional pigment, and nano-SiO2 as a micro-nano structural modifier, a near-infrared absorption coating with good hydrophobic properties and adhesion strength was prepared. The effects of the mass ratio of PDMS to HYSZ, DOP addition amount, total filler addition amount, and the mass ratio of Sm2O3 to nano-SiO2 on the coating performances were systematically analyzed. The results show that: PDMS modification can significantly reduce the surface energy of the coating, thereby significantly enhancing the hydrophobicity of the coating. The use of DOP to strengthen the toughness of the coating and the micro-bridging effect can enhance the integrity of the coating, which can significantly improve the adhesion strength and near-infrared absorption performance of the coating. The surface roughness of the coating can be significantly increased with the increase of the total filler addition, so that the coating can exhibit better hydrophobic properties. When the mass ratio of PDMS to HYSZ, DOP addition amount, total filler addition amount, and the mass ratio of Sm2O3 to nano-SiO2 are 1∶9, 20%, 50%, 5.5∶4.5 in the coating, respectively, the coating has good near-infrared low reflectivity (59.1%), hydrophobic performance (water contact angle is 137°) and adhesion strength (2 grade).
Sep. 01, 2022Vol. 42 Issue 9 2855 (2022)
Li CHEN, Shi-yong WANG, Si-li GAO, Chang TAN, and Lin-han LI
Recently, deep convolutional neural networks have made remarkable progress in visible light ship detection. However, most improve detection performance by improving large network structures, which require strong computer performance. In addition, the visible image is difficult to detect ships in the cloud, fog, sea clutter, night and other complex scenes. In order to solve these problems, this paper proposes a lightweight ship detection algorithm, which integrates the spectral information of Red, Green, Blue and NIR bands from coarse to fine. This paper uses the improved water detection algorithm to extract the ship candidate area from the existing methods that extract the water area by using the water detection algorithm according to the spectral characteristics. To obtain a more accurate candidate area, in this paper, the ships, the thick clouds, cloud, calm sea, five kinds of cluttered sea four bands of pixels in the scene have carried on the statistical analysis. Near-infrared is greater than the threshold as the auxiliary judgment, and in its center for candidate area the size of 32×32 slices, and to the maximum inhibition of slice, thus obtained the coarse detection results of the ship. Then constructs a lightweight LSGFNet network for fine identification of ship candidate regions. In the structural design of the network, the spectral features extracted by 1×1 convolution and the geometric features extracted by 3×3 are fused. In order to prevent the “information not flowing” during the fusion of spectral features and geometric features, the channel disruption mechanism in ShuffleNet is introduced in the LSGFNet network, and the model structure is reduced. Compared with the typical lightweight network, it has a better effect and a smaller model. Finally, 1 120 sets of data with 512×512 and 6014 sets of data with 32×32 were constructed for rough detection and fine network training using sentinel-2 multi-spectral 10-meter resolution data. Among them, the recall rate of rough extraction of candidate regions was 98.99%, and the fine identification network precision was 96.04%. The overall average precision is 92.98%. Experimental results show that the proposed algorithm has high detection efficiency in the complex background of suppressing clouds, sea clutter and other disturbances, the training time is short, and the computer performance demand is low.
Sep. 01, 2022Vol. 42 Issue 9 2862 (2022)
Fei ZHANG, Xia HUA, Jia-ying YUAN, Fan YOU, Ren-cai YE, Li DING, and Jian-mei ZHAO
Tallium in the blood of occupationally exposed population may reflect their exposure in vivo. Therefore, it is very important to establish a method to determine thallium in blood. At present, there is no national standard method for the determination of thallium in blood in China, and the methods reported in domestic and foreign literature have some shortcomings. In order to obtain accurate thallium concentration in the blood of occupationally exposed population, a new method was developed for thallium in blood by inductively coupled plasma mass spectrometry with high matrix injection. In this study, plasma mode and pretreatment method were selected. After the 0.20 mL sample was pretreated with the mixed solution of 0.1% Triton X-100 and 0.5% nitric acid, the thallium content was detected by adding internal standard online. Under the optimal conditions, good linearity was obtained in the concentration range of 0.02~4.00 μg·L-1 with a linear calibration curve of Y=0.010 33X+0.000 12 (R=0.999 9). The detection limit (DL) and the quantitative limit (QL) were 0.005 and 0.02 μg·L-1. When the sample volume and constant volumes were 0.20 and 5.00 mL respectively, the method detection limit (MDL) and the method quantitative limit (MQL) were 0.12 and 0.42 μg·L-1, and the analytical range of this method was 0.42~100 μg·L-1. The average recoveries at three fortified levels (2.50, 15.0 and 75.0 μg·L-1) were 92.7%~103.8%. The relative standard deviations of in-batch (RSDs of in-batch) ranged from 1.71% to 2.81%, and the relative standard deviations of interbatch ranged from 2.84% to 4.77%, which indicated the accuracy precision of the method were good. The signal variation of 209Bi internal standard isotope in 50 samples(including standard solution, quality control samples and whole blood samples) was less than 7.7%, which showed that the method had good stability. The established method was successfully applied to the analysis of 30 whole blood samples in the occupational exposed population. Four samples were above the MDL, but below the MQL. The other 26 samples were below the MDL and all the 30 samples were within the average background range. This method was simple, rapid, accurate and stable and suitable for analysing of large quantities of actual samples. The results showed that the exposure level of thallium was shallow in vivo, and there was no potential health risk of thallium to 30 professional contacts in their workplace.
Sep. 01, 2022Vol. 42 Issue 9 2870 (2022)
Wei CHEN, Hai-long WU, Tong WANG, Yue-yue CHANG, Yao CHEN, Jian YANG, Hai-yan FU, Xiao-long YANG, Xu-fu LI, and Ru-qin YU
Atractylodes macrocephala Koidz. (AM) is a famous traditional Chinese medicine, the quality of AM is directly related to the producing area, so it is urgent to find a method to quickly identify the quality of AM and trace its origin. AM contains various endogenous fluorescent substances, which can provide a basis for identifying the origin of AM by three-way fluorescence technology. In this paper, the three-way fluorescence spectrum of AM was characterized by alternating trilinear decomposition (ATLD), and then three-way fluorescence was combined with partial least squares discriminant analysis (PLS-DA) and k-Nearest Neighbors (kNN) to trace the origin of AM samples. The results show that the classification models established by PLS-DA and kNN could effectively distinguish samples from the three major AM production areas (Anhui, Hunan, and Zhejiang), and the classificationaccurate rate (CCR) of Zhejiang AM, a Dao-di AM herbs, is as high as 80% and 90 in the prediction set, respectively. The proposed method provides a novel and rapid solution for the origin traceability of AM, which is conducive to maintaining the order of AM market and its industrial development.
Sep. 01, 2022Vol. 42 Issue 9 2875 (2022)
Li-qian ZHANG, and Yang-jie LIU
Pyrite, limonite, red ochre, and magnet are iron-containing mineral medicines. There are many fake or mixed-use phenomena in the market. This is directly related to the inaccuracy of mineralogical identification. This article aims to conduct mineralogical and spectroscopic identification of four iron-containing mineral medicines through character observation and mirror identification using scanning electron microscopy(SEM), X-ray diffraction(XRD), and semi-quantitative trace elements spectroscopy, and infrared spectroscopy(IR). The results are as follows: (1) The character identification shows that pyrite and limonite belong to pyrite, the red ochre is hematite mixed with a small amount of limonite, and the magnet is magnetite. (2) The reflectance of pyrite measured by the reflector is about 53%, the reflectance of limonite is about 50%, the reflectance of red ochre is about 47%, and the reflectance of the magnet is about 20%. There is no internal reflection, and it is a homogeneous body. (3) SEM observation revealed that the pyrite is cubic, the limonite is a nodular aggregate, the red ochre is granular, and the magnet is massive. (4) XRD results show that the main diffraction lines in pyrite are 2.704 (10), 1.631 (9), 1.912 (8), 2.704 (10), 2.513 (8). The content of pyrite and limonite is about 95%, 5%. The main diffraction lines in limonite are 2.705 (10), 1.631 (10), and the content of pyrite is about 99%. The main diffraction lines in the red ochre sample are 2.702 (10), 2.519 (9), and the content of hematite is about 95%,and 3.351 (10), 4.250 (8), 1.800 (8), quartz is about 97%. The main diffraction lines in the magnet sample are 7.030(10), 2.957(9), 2.525(8), 2.094(7), 1.460(6). the content of the magnet is about 98%. (5) Semi-quantitative analysis of trace element spectroscopy shows that the types of trace elements are Cu, Mo, Co, and Mn, but pyrite contains Yb, B, limonite contains Pb, Sn, Ni, Yb, red ochre contains Zn, Pb, Ga, V, Ge, In, and magnet contains Zn, Pb, Ni , Be, Sr. (6) The IR shows that the characteristic spectrum lines of pyrite are 417, 343 cm-1; the limonite is 413, 345 cm-1; the red ochre is 569 cm-1, and the magnet is 1 083, 531, 452, 320 cm-1. It is not easy to effectively distinguish the four iron-containing mineral medicines by simply using the character identification, while supplemented by infrared spectroscopy and X-ray diffraction tests can effectively identify them.
Sep. 01, 2022Vol. 42 Issue 9 2884 (2022)
Heavy metal pollution will affect the normal growth of crops, and quickly detecting the content of heavy metals in crops has become a problem to be investigated. The traditional detection of heavy metals in plants depends on chemical methods. Although it can realize the high accurate detection of heavy metal content, its operation process is laborious, and it cannot meet the requirements of the high throughput detection, let alone the in-situ micro detection of plant tissues under heavy metal stress. Raman spectroscopy has the advantages of non-destructive detection of molecular vibration information of solid, liquid and gas species, high spectral resolution and insensitive to water. Therefore, it is feasible to monitor the content of heavy metals in crops by Raman spectroscopy. Apple rootstock is the basis of apple seedling grafting, which can ensure the health of the apple tree and apple quality and yield in the later stage. The root of apple rootstock is polluted by heavy metals directly, which hinders its healthy growth and affects the stress resistance of apple seedlings. Therefore, studying the interaction mechanism between heavy metals and apple rootstock root is necessary. In this study, five groups of apple rootstocks under the stress of CuSO4·5H2O solution with different concentrations were investigated. Firstly, the Raman scattering spectra of apple rootstocks under different copper ion (Cu2+) stress gradients were collected, and the adaptive iterative reweighting partial least squares (air-PLS) and S-G smoothing method were applied to preprocess the obtained raw Raman spectrum data for removing the fluorescence effect and correcting the baseline. Secondly, partial least squares discriminant analysis (PLS-DA) and support vector machine (SVM) discriminant models were established to estimate the different heavy metal stress concentrations. Results showed that the accuracy of the SVM model and PLS-DA model could reach 100% and 96%, respectively, which is promising for predicting apple rootstocks’ heavy metal Cu stress situation; finally, the chemical imaging was mapped based on the characteristic Raman spectrum peaks at 1 096, 1 329, 1 605 and 2 937 cm-1. It was illustrated that the Raman signal intensity increased first and then decreased with the increase of stress concentration in the exact wavenumber. These findings demonstrated the potential of micro-Raman scattering for measuring apple rootstock heavy stress, which provides anovel method for detecting heavy metal stress of crops.
Sep. 01, 2022Vol. 42 Issue 9 2890 (2022)
Miao CHEN, Ming-yu HOU, Shun-li CUI, Zhen LI, Guo-jun MU, Ying-ru LIU, Xiu-kun LI, and Li-feng LIU
The sugar content of peanut seeds is an important indicator that affects the quality of eating. Establishing a method for rapidly determining sugar content can effectively improve the detection efficiency of edible peanuts. The appearance color of the sample is one of the important factors that affect the near-infrared analysis. Classification and correction according to the appearance color of the sample are more conducive to improving the model’s the model’s predictive performance. Therefore in this study, 332 peanut germplasms with different sugar content were selected, and the peanut germplasms were divided into three categories: black-purple, red, and pink, according to the seed coat color using a colorimeter. The 3,5-dinitrosalicylic acid, anthrone colorimetric, and sucrose enzymatic methods were used to determine the total sugar, soluble, and sucrose content in seeds, respectively. The total sugar content was 6.42%~39.53% (blackpurple peanuts), 9.66%~39.71% (red peanuts), and 8.52~38.84 (pink peanuts). The soluble sugar content was 2.4%~14.32% (blackpurple peanuts), 2.94%~13.75% (red peanuts), 2.19%~14.53% (pink peanuts), and the sucrose content was 0.92%~7.53% (blackpurple peanuts), 1.05%~7.23% (red peanuts), 0.95%~7.99% (pink peanuts), the coefficient of variation was above 33%. The Perten DA7250 near-infrared analyzer (950~1 650 nm) was used to collect the near-infrared spectrum values of the seeds. The total 9 NIR spectroscopy calibration models about the total sugar content, soluble sugar content, and sucrose content of blackpurple, red, and pink peanut seeds were established respectively through the Partial Least Square Regression (PLSR) method based on the whole band, and the single or compound pretreatment methods, and comparing the correlation coefficient and error of the models. The correlation coefficient ofcorrection (Rc) was 0.883~0.925, and the root means standard error of calibration (RMSEC) was 0.370~1.988. In the model of total sugar content, the Rc of pink seed coat peanuts was 0.925, and the RMSEC was 1.705. In the model of soluble sugar content, the Rc of blackpurple seed coat peanuts was 0.921, and the RMSEC was 0.667. In the model of sucrose content, the Rc of blackpurple seed coat peanuts was 0.914, and the RMSEC was 0.435. External verification was carried out using 15 germplasms. The correlation coefficient of prediction (Rp) of the 9 models was 0.892~0.967, and the root means standard error of prediction (RMSEP) was 0.327~2.177. In this study, near-infrared models could predict the content of several sugars in peanut seeds simultantly and rapidly, and provide technical support for ediblepeanut breeding of high sugar content.
Sep. 01, 2022Vol. 42 Issue 9 2896 (2022)
Zhen-qing ZHANG, Li-juan DONG, Yu HUANG, Xing-hai CHEN, Wei HUANG, and Yong SUN
RMB is the legal currency of the people’s Republic of China. The authenticity of RMB is directly related to the harmony and stability of the society. As the most significant denomination bill in China, identifying the authenticity of 100 yuan RMB is more critical. In the paper, we use the visible/near-infrared hyperspectral imager to obtain the hyperspectral image data of an actual bill and two fake bills. Then select four feature points on the front and back of the bill to analyze the spectral differences between the front and back of the bill.From the spectral reflectance curves of the four characteristic positions on the front of the authentic and counterfeit banknote. It can be seen that the spectral reflectance of some patterns between the real and the counterfeit banknote varies greatly at different characteristic points, while that of some patterns is not significant. Moveover, for different batches of counterfeit banknotes, the spectral reflectance at different locations also has large differences. The analysis of the back of real and counterfeit banknotes shows that with different feature points, the spectral reflectivity between the real and the counterfeit banknote is also different in different bands. According to spectral reflectance curves of the 8 characteristic points on the front and back of the genuine and the counterfeit banknote, the grayscale images of the wavelengths at 500, 660 and 870 nm were selected. It was observed that the grayscale images of real and counterfeit banknotes showed obvious differences at different feature points.The image contour of the real banknote at 500 nm is clear. In 660 and 870 nm, no matter on the front or back, the real banknote has several characteristic positions different from the counterfeit banknotes. Therefore, it can be used to distinguish the real 100-yuan banknote at 660 or 870 nm. In order to highlight the difference between real banknotes and counterfeit banknotes, the gray-scale image of real and counterfeit banknotes of 100 yuan is obtained by band calculation. As can be seen from the figure, real banknotes are different from counterfeit banknotes in many places on the front and back sides. From the grayscale image of the first 12 principal components on the front of genuine and counterfeit banknote, it can be seen that there exist significant differences in each principal component no matter from the front or the back.According to the texture feature map on the front and back of the real and fake banknotes, it can be seen that the texture characteristics of the real banknotes are significantly different from the fake banknotes. The results show that the spectral reflectance of 100 yuan real banknotes is significantly different from that of different versions of counterfeit banknotes in the visible/near-infrared spectral range, and the differences between the front and back positions of 100 yuan real banknotes can be found by the near-infrared characteristic band, spectral operation, principal component analysis and texture characteristics. Therefore, visible/near-infrared hyperspectral imaging technology can be used to identify 100 yuan real and fake banknotes and provide the possibility and theoretical support for the traceability of counterfeit banknotes. The technology has practical significance in the actual practice of public security.
Sep. 01, 2022Vol. 42 Issue 9 2903 (2022)
Xi WANG, Gui-fen CHEN, Li-ying CAO, and Li MA
According to the actual need for rapid and non-destructive testing methods for nitrogen in maize production. Samples were divided according to the equivalent water thickness gradient, and a gradient continuous leaf nitrogen inversion model was established. The influence of water content on leaf reflectance characteristics and the accuracy of the inversion model is preliminarily explored. Firstly, the hyperspectral data of leaf-level are obtained, and then the samples are sorted and sliding divided according to the value of equivalent water thickness, and the subset set is established. In addition to the original spectral data, the parent set also adopts (1) baseline correction; (2) Scattering correction; (3) Smoothing methods, three categories of spectral transformation methods, while subsets do not use any spectral transformation techniques. A full band PLSR inversion model is established, the model accuracy is compared, and the influence of equivalent water thickness on modeling accuracy is preliminarily quantitatively evaluated. The experimental results show that: (1) among the four groups of data, the inversion accuracy of three parent sets is lower than that of the optimal subset, and the other group is the same (2018 field-N: (parent set) RCV2=0.48Rcv2=0.57, RPDCV=1.38CV=1.52; 2018 field +N: RCV2=0.48RCV2=0.7, RPDCV=1.39CV=1.8; 2019 field +N: RCV2=0.59RCV2=0.68, RPDCV=1.57CV=1.77); (2) The inversion accuracy of the optimal subset of all the four groups reaches or even exceeds the level of the qualitative model, while the parent set has only two groups; (3) In the problem of sample selection of inversion data set, the factor of equivalent water thickness needs to be fully considered to avoid the loss of overall inversion accuracy caused by too wide sample selection. In conclusion, the factor of equivalent water thickness significantly impacts the accuracy of nitrogen modeling in maize leaves, which should not be ignored. After this factor is considered, the method of rapid, nondestructive detection of nitrogen in maize leaves using leaf hyperspectral data will be more reliable and feasible.
Sep. 01, 2022Vol. 42 Issue 9 2913 (2022)
Jiu-ming ZHANG, En-jun KUANG, Feng-qin CHI, Yi-dan LIU, Bao-ku ZHOU, Xiao-yu XIA, Xiao-jun WANG, Lei SUN, Ben-chao CHANG, and Dan WEI
The combined application of organic and inorganic fertilizer is an effective measure to improve soil fertility and reduce the application of inorganic fertilizer. In order to investigate the effect of organic fertilizer instead of inorganic fertilizer (nitrogen fertilizer) on the content and structure of DOC in black soil area, different proportions of organic fertilizer instead of chemical nitrogen fertilizer were used to analyze the content and fluorescence spectrum characteristics of DOC. The results showed that the content of DOC in M treatment was 325.97 mg·kg-1, which was significantly higher than that in other treatments. Compared with CK treatment, the fluorescence peak wavelength of each fertilization treatment decreased to different degrees. DOC’s fluorescence index (FI) ranged from 1.54 to 1.59, and the humification index (Hix) of DOC in all treatments was less than 0.85, indicating that soil DOC was affected by both authigenic and terrestrial sources, and the degree of soil humification was low. A parallel factor analysis identified three fluorescent components: two humus components (fulvic acid like substance and humic acid like substances) and one protein like component (tyrosine like protein substance). The fluorescence intensity of the three components in each fertilization treatment was higher than that in the CK treatment. Among them, the total fluorescence intensity of soil DOC under M and M2N2 treatments were higher, and the fluorescence intensity of the C3 component under M2N2 treatment was the highest. The relative proportion of three organic components in soil DOC was the highest in C1(close to 50%), indicating that small molecular substances accounted for a large proportion in the soil. The application of fertilizer can improve the degree of soil humification, which was conducive to the fixation of soil DOC. And the reasonable application of organic fertilizer combined with chemical nitrogen fertilizer can increase the availability of DOC and improve the ability of soil fertilizer supply.
Sep. 01, 2022Vol. 42 Issue 9 2919 (2022)
Prediction of Organic Matter Content in Sandy Fluvo-Aquic Soil by Visible-Near Infrared Spectroscopy
Xiang-jun ZHONG, Li YANG, Dong-xing ZHANG, Tao CUI, Xian-tao HE, and Zhao-hui DU
Soil Organic Matter (SOM) is a crucial soil parameter that affects the sowing rate. Real-time control of the sowing rate based on SOM information is the cutting-edge research area of planting technology, which can make full use of land resources to tap the yield potential, accurately and adequately adjust the number of seeds to maximize the return. This article focuses on the North China Plain, one of the main corn-producing areas, as the study area, and the sandy loam soil in this area has been collected by visible-near infrared (300~2 500 nm) spectra. Monte Carlo cross-validation is used to eliminate abnormal samples, and the Savitzky-Golay convolution smoothing method is used to smooth and denoise the spectral data. Respectively through Competitive adaptive reweighted sampling (CARS), Successive projections algorithm (SPA), Competitive adaptive reweighted sampling-Successive projections algorithm (CARS-SPA), Uninformative variables elimination (UVE) and Variable Combination population Analysis (VCPA), and other wavelength screening methods to extract effective variables. Combined with Partial least squares regression (PLSR), the SOM content prediction models of full wavelength and characteristic wavelength were established respectively. The results showed significant differences in the number of wavelengths and wavelength positions screened by different methods. The spectral features selected by the CARS and SPA algorithms are distributed in the spectral range, while the bands selected by UVE and VCPA were concentrated. Moreover, the characteristic variables could be further optimized based on the CARS-SPA method, and the characteristic wavelength was only 15% of the total wavelength. By comparing the modeling and prediction effects of different models, except for the UVE and VCPA algorithms, the models constructed by the other algorithms can all effectively predict the SOM content, and their RPD values were all greater than 2.0. The PLSR model based on CARS-SPA has the best performance. Its RP2 and RPD were 0.901 and 3.188 respectively, higher than other methods. It reduces the interference of invalid information on the prediction effect, but the computational efficiency of the model is significantly improved, which can realize the reliable prediction of SOM content in this area. This research can provide method references for rapid prediction of SOM content and instrument design.
Sep. 01, 2022Vol. 42 Issue 9 2924 (2022)
Jiang-sheng GUI, Jie HE, and Xia-ping FU
To reduce the impact of insect pests on soybeans, first use the corresponding hyperspectral instrument to collect samples. The samples are divided into 4 categories: those with tiny eggs, those with larvae, those with nibbling marks, and those with entirely normal soybeans. 20 Then, a hyperspectral detection method of soybean borer based on three-dimensional image retrieval (3D-RD, 3D Resnet18 DCH) was proposed. The application of video retrieval inspires this method. Considering the analogy relationship between different frames of the video and the different layers of the hyper spectrum, the classification model trained on the large-scale video retrieval data set is used as a predictive model. Train the 3D convolution model for training. Same as the known literature method, the public spectral data set is used for formal training and fine-tuning to obtain a 3D convolutional network that can perform feature extraction. Image retrieval is used to achieve indirect classification, and the feature distance between samples is used to achieve classification in new categories. In order to be able to adapt to the task, the final classification layer of the model is turned into a commonly used hash layer for image retrieval, thereby obtaining the binary code representing the feature. This method completes the detection of soybean types in different situations and solves the problem of insufficient samples during training. In order to explore a good similarity matching loss function, this article uses a variety of newer methods to explore and finally found that the Cauchy distribution is integrated into the loss function, which can be effectively applied in this experiment. Experiments have proved that the classification accuracy of the final model is 86%±1.00%. Compared with the latest small sample method in detecting soybean borer, the 3D-RD method improves the accuracy by about 3.5%, which shows that the method is effective. The method also provides a new way of thinking for hyperspectral research.
Sep. 01, 2022Vol. 42 Issue 9 2931 (2022)
Zhao-jia PIAO, Hai-ye YU, Jun-he ZHANG, Hai-gen ZHOU, Shuang LIU, Li-juan KONG, and Jing-min DANG
Wheat is the primary grain crop in our country and plays a pivotal role in developing the national economy. However, abiotic stress factors such as salt and physical damage have gradually become essential factors restricting wheat yield and quality. Studies have shown that the cell wall is an important line of defence for plant cells to resist adversity and stress directly. Under salt stress, cell osmotic pressure increases, and the permeability of the plasma membrane will be affected to a certain extent. In order to maintain cell morphology and structure, pectin and other polysaccharides in plant cell walls will be transformed and changed to varying degrees. Physical damage will deepen the degree of lipid peroxidation of plant cell membranes, increase membrane permeability, and lead to the loss and degradation of nutrients. The damaged site and its surrounding cells will also be embolized to block the invasion of bacteria. Pectin, which is the main component of cell wall and can reflect the integrity and permeability of the plant cell wall and membrane system, can be used as an important factor in studying the response mechanism of plant internal substances under stress. At present, commonly used pectin detection methods such as Gravimetric Colorimetric, Liquid chromatography, etc. are cumbersome to operate, not real-time, and large sample consume. There is an urgent need for a simple, fast and non-destructive detection method. This paper used hydroponics to research the wheat (Yannong 0428). The sodium chloride (NaCl) solution was applied to culture medium, and acupuncture was carried out on both sides of the main vein of the first leaf of wheat to simulate the salt damage and the physical damage caused by insect bites, respectively. The pectin and its hyperspectral information of wheat leaf were also collected and processed. The correlation analysis method was used to screen the sensitive spectral band. The three modeling methods of principal component regression (PCR), partial least squares (PLS), and stepwise multiple linear regression (SMLR) were combined with multiple scattering correction processing (MSC), standard normal transformation processing (SNV), first derivative processing (FD), convolution smoothing (SG), and Norris derivative filter processing (NDF) to establish a pectin content inversion model. Finally, the model established by PLS+SNV+FD+NDF method was selected as the optimal model, and its performance was also tested. The results showed that the predicted value of pectin content was consistent with the measured value, and the coefficient of determination (R2) and root mean square error (RMSE) were determined to be 0.997 6 and 0.35, respectively. The repeatability of the predicted value was good, and the relative standard deviation (RSD) was 1.2%. This study uses a new method to realize the high-precision, fast and non-destructive detection of wheat pectin, which is helpful to the in-depth study of the mechanism of the wheat response to stress and provides a reference for the prediction of the stress degree of field crops and the accurate control of planting environment.
Sep. 01, 2022Vol. 42 Issue 9 2935 (2022)
Meng-ruo WU, Zhen-fang QIN, Liu-yang HAN, and Xiang-na HAN
The preservation states of excavated/salvaged waterlogged wooden artifacts vary greatly. The inhomogeneity of degradation and restricted acquirement of sampling make many necessary qualitative or quantitative analyses of wood properties and protection effect evaluation tests difficult to carry out. Therefore, it is urgent to develop a laboratory-controlled artificial degradation method to obtain sufficient waterlogged wood samples with good repeatability and uniform properties for preservation method research. This paper selected sound Pinus sp. wood to make artificially degraded waterlogged wood by NaOH-vacuum impregnation-hydrothermal combined method. The maximum water content (MWC) of the artificially degraded waterlogged wood was 260%, 340% and 575%, respectively, corresponding with the widely recognized degradation states level of low, medium and high degraded waterlogged archaeological wood according to their MWCs. Fourier transform infrared spectroscopy (FTIR) results indicated that the cellulose structure of the wood was well preserved though the hydrogen bond partially broke. Hemicellulose was degraded significantly, the main chain, as well as side chain, were broken, and the characteristic peak at 1 732 cm-1 disappeared; Lignin was partially degraded, and the relative intensity of the vibration absorption peak of aromatic lignin ring at 1 508 cm-1 decreased and shifted. Near-infrared reflectance spectroscopy (NIR) showed that all the three major components in the samples were degraded. Hemicellulose was the most degraded, followed by lignin. The increase of relative content of lignin, reflected by the increase of relative content of C=O. A broad peak was formed in the 1 536~1 580 nm region with decreased peak intensity, indicating that the hydrogen bond structure within and between molecules in the cellulose crystallization region was broken.Compared with traditional methods, the concentration of NaOH solution using the combined method was reduced from more than 50% to 1%, and the treatment time was significantly shortened from several months to 10 hours, which proved that the degradation efficiency was greatly improved. The MWC and the degradation degree of the chemical structure of wood cell wall of artificially degraded waterlogged wood was many controller and higher than that of the existing methods. The state and performance of artificial waterlogged wood in this research were similar to archaeological wood.
Sep. 01, 2022Vol. 42 Issue 9 2941 (2022)
Rui LI, Bo LI, Xue-wen WANG, Tao LIU, Lian-jie LI, and Shu-xiang FAN
Intelligent recognition of coal and gangue is a new technology that needs to be developed urgently to realize the intelligentization of fully mechanized caving mining. Visible-near infrared spectroscopy technology has many advantages such as environmental friendly and real-time, which meets the requirements of intelligent separation of coal and gangue. The Extreme Gradient Boosting Tree (XGBoost) algorithm which performed well in data science competitions, was introducedto achieve the recognition of coal and gangue based on visible-near infrared spectroscopy. Firstly, a visible-near infrared spectroscopy experimental platform was built to collect the reflectance spectra of lump coal and gangue samples from Shanxi Ximing, Shaanxi Shenmu, and Inner Mongolia Balongtu coal mines in the range of 370~1 049 nm. The collected original spectra were preprocessed through black and white correction, method of removing the start and end bands, Savitzky-Golay (SG) smoothing and standard normal variable transformation (SNV) to reduce the effects of uneven illumination, noise and optical path difference. Secondly, the experimental group and test group were divided according to the difference of reflection spectrum of samples from different mines. The experimental group had a minor difference, which was used to compare the performance of different models and select the best algorithm; the difference of test groups was obvious, which was used to test the performance of the best algorithm in other coal mines and verified the applicability of the algorithm to different coal mines. In the experiment of the experimental group, the coal and gangue classification model was established based on the XGBoost algorithm, and the commonly used machine learning classification algorithms k-nearest neighbor method (KNN), random forest (RF), support vector machine (SVM), which were introduced for comparison. The results showed XGBoost performed best. The average accuracy of 10-fold cross-validation (ACC10), classification accuracy (ACC), and AUC values respectively reached 0.957 2, 0.970 5, and 0.971 6, showing strong stability and classification capabilities. Then in order to reduce the data dimension and calculations, recursive feature elimination (RFE), successive projections algorithm (SPA) and competitive adaptive reweighted sampling (CARS) were used to select the characteristic wavelength and combined with the above four classification algorithms to construct a simplified classification model, respectively. The simplified model of the combination of RFE and XGBoost(RFE-XGB) performed best in the test. The ACC10, ACC, AUC was 0.965 7, 0.980 3, 0.980 3, respectively, and the data dimension reduced to 9. Simplified model improved the stability and classification ability of the model while reducing the data dimension. In the experiment of the test group, the model based on XGBoost and RFE-XGB algorithms can also achieve stable and accurate recognition of coal and gangue in other coal mines, and the simplified model performed better, which was consistent with the results of the experimental group.
Sep. 01, 2022Vol. 42 Issue 9 2947 (2022)
Yan-fei LI, Dong HAN, Zong-jia QIU, Kang LI, Yi-kun ZHAO, Liu-jie WAN, and Guo-qiang ZHANG
Partial discharge of air is an important factor causing insulation deterioration of high voltage electrical equipment. The emission spectrum information in air discharge has close relationship with the discharge characteristics. In this paper, the development process of air corona discharge was simulated by needle-plate electrode, and the emission spectra in 200~980 nm wavelength range of “ultraviolet-visible-near infrared” band were detected. The emission spectrum at the initial discharge stage is mainly composed of the band spectrum of nitrogen molecule N2, which are the second positive band system (Second Positive System, SPS) and the first positive band system (First Positive System, FPS) of N2 respectively. With the deepening of the discharge degree, the kinds of particles that undergo energy level transitions become more abundant, resulting in complex spectral lines that overlap with the band spectrum and the linear spectrum. Moreover, the spectral range is extended from 280~460 to 200~980 nm. When the discharge is at a critical breakdown, the intensity of the emission spectrum increases sharply, and the highest intensity values appear at 500.715 and 777.202 nm, respectively corresponding to the spectrum of nitrogen ions N+ and oxygen atoms O. Based on the air discharge mechanism, it is found that the dominant peaks or bands at the three stages of initial discharge, discharge deepening and critical breakdown are caused by the radiative transitions of N2, NO, O and N+, which are determined by the discharge energy. The characteristic spectrum wavelengths at the three discharge stages are 336.907, 239.687 and 500.715 nm, respectively. At the initial discharge stage, the intensity at 336.907 nm is absolutely dominant, and the relative intensity at 239.687 and 500.715 nm is very small. When the discharge degree is deepened, the intensity at 239.687 nm is dominant, and the relative intensity at 500.715 nm is the smallest. At the critical breakdown stage, the strength at 500.715 nm is dominant, and the strength at 336.907 nm is the weakest. In the 200~980 nm spectrum range of air corona discharge, although the photon number of the ultraviolet band (UV), visible band and near infrared band increases with the increase of the applied voltage, the normalized photon number of each band show that with the deepening of the discharge degree, the photon proportion in the ultraviolet band decreases while increasing gradually in the visible band, and the change of photon ratio in near infrared band is relatively small. There are obvious differences in the relative photon number distribution in the “UV-visible-near infrared” bands at different discharge stages, which can reflect the development of the discharge.
Sep. 01, 2022Vol. 42 Issue 9 2956 (2022)
Jian-lu HUANG, Tao SHEN, Yang YANG, and Bo-xiong FAN
Sep. 01, 2022Vol. 42 Issue 9 2963 (2022)
Tomato leaves in the infection of disease occurred after the first internal physiological reaction, the naked eye can not observe, from the blade infection to the appearance of visible disease spots, for the left disease latent period. In order to achieve the tomato leaf surface did not see obvious disease spots of gray mold latent period diagnosis. This paper is for the inoculation samples for leaf coding, daily tracking, and collection of all encoded leaf sample hyperspectral image data, the establishment of tomato leaf sample sequence hyperspectral data set. Based on the tracked leaf samples, hyperspectral data from the same location area a few days before the appearance of visible spots with the naked eye were used for detection and analysis as latent period data. In order to establish the diagnosis of the latent period of tomato leaf gray mold disease and the classification model of different disease plaque levels, the classification model based on the teaching learning-based optimization algorithm (TLBO) optimization extreme learning machine (ELM) is used to model. The input weight and hidden layer deviation of ELM are optimized by the TLBO algorithm, and the model classification performance is improved. Data modeling was obtained in the near-infrared hyperspectral band 388-1007nm band to obtain 5 levels of interest, and 213 hyperspectral data were sampled, including health (56), latent (42), small disease plaque (43), major disease plaque (39) and severe disease (33). The best-performing wavelet filtering transformations (Discrete Wavelet Transform, DWT) filter each type of data in the sample data separately by comparing different spectral preprocessing methods. After DWT filtering, the five class spectral curves between the 610 and 840 nm bands can be distinguished significantly, containing 91 wavelengths and a larger wavelength. Therefore, competitive adaptive reweighted sampling is used (Competitive Adaptive Reweighted Sampling, CARS) to repeated the preferred feature wavelength 3 times in the 610~840 nm band using DWT pre-treated spectral data and combined to remove duplicates to obtain 9 feature bands: 694, 696, 765, 767, 769, 772, 778, 838 and 840 nm. Finally, three classification models FC-TLBO-ELM, DWT-TLBO-ELM, DWT-CARS-TLBO-ELM, were selected for experimental comparison, in which DWT-CARS-TLBO-ELM detection accuracy was up to 100%, and the potential recall rate was 100%. Using the minimum time of 0.068 9 s, it is shown that the model can realize the high-precision diagnosis and high-precision classification of the disease degree of gray mold disease during the latent breeding period of tomato ash mold, and provide a theoretical basis for the early prevention and treatment of tomato ash mold disease and the precise application of medicine.
Sep. 01, 2022Vol. 42 Issue 9 2969 (2022)
Dong-dong XU, Xin YU, Li-min DU, and Guo-ling BI
A multispectral image compression and encryption algorithm that combines chaos, wavelet transform and KL transform is proposed for solving the security problem of multi-spectral image compression and transmission. Firstly, the K-means clustering scheme is used to cluster multi-spectral images into common pixels, and the performance of the algorithm is optimized by selecting the appropriate K value, and it is convenient for subsequent processing. Secondly, the multispectral image is clustered into general pixels, we will perform a two-dimensional discrete 9/7 wavelet transform on the general pixels, and then perform Arnold transform and encryption processing on the transformed coefficients to eliminate most of the spatial redundancy of the multispectral image and reduce the block effect of the compression process. Next, to eliminate residual spatial redundancy and spectral redundancy, the generated wavelet coefficients are performed by KL transform. Finally, differential pulse filters are used to encode the coefficients, and Tent mapping is used to implement confusion diffusion encryption on the code stream. Through experiments, it can be known that the information entropy of this algorithm reaches 11.794 3 (selecting 12-bit multispectral images), and the information entropy is closer to the maximum value of 12, which is better than the existing algorithm and can better hide the original image features. The NPCR and UACI are respectively 99.81% and 34.19, which are better than the existing other algorithms, which can better resist differential attacks. The output bit-stream change rate is maintained between 47.62%~47.71%, and the ciphertext bitstream change rate is maintained between 47.45%~47.52%, so this algorithm has good key sensitivity; In the range of 4∶1~32∶1, the system PSNR is above 42 dB, which has high compression performance. Within the range of 4∶1~32∶1, this compression algorithm achieves a very high peak signal-to-noise ratio, which is better than the existing compression algorithm. When the normal working compression ratio is 16∶1, it is better than the existing compression algorithm. The ratio is improved by more than 0.64 dB. In order to further verify the compression performance of the algorithm in the case of a high compression ratio, this paper tested the system’s signal-to-noise ratio of 31.28 when the compression ratio is 128∶1. The reconstructed image is clearer at this time, which is more than 1dB better than the existing algorithm. It can be seen that this algorithm is feasible and particularly suitable for occasions which require a high compression ratio and has a good effect in terms of spectrum fidelity.
Sep. 01, 2022Vol. 42 Issue 9 2976 (2022)
Nan SUN, Hong-lin TAN, Zheng-dong ZHANG, Xiang REN, Yan ZHOU, Jian-qi LIU, Xiao-ming CAI, and Jin-ming CAI
Graphite carbonaceous materials are widely used in electronic equipment, composite materials, batteries, and sensors because of their good electrical, mechanical and thermal properties. However, the current high energy consumption, high pollution, high cost, and uncontrollable production is the core problem that needs to be solved urgently. Therefore, the method of obtaining graphitic carbon structures in nanoscale devices by using simpler and low-cost manufacturing techniques is an attractive area for exploration. Surface plasmon technology has attracted wide attention because of its environmental friendliness and low energy consumption. Using plasmon technology to induce graphitization of macromolecular chain polymers is a promising preparation technology. As a base metal, Cu has the advantages of high yield and low price. Based on the surface plasmon technology, this paper uses laser radiation to graphitize polyacrylonitrile on the metal surface by irradiating polyacrylonitrile (PAN)+carbon nanotubes (CNT) on the rough Cu surface. PAN/Cu and PAN+CNT/Cu were systematically studied to obtain the best graphitization conditions by changing the substrate etching time, annealing temperature, annealing time, and laser intensity. The experimental results show that with PAN as the probe molecule, the surface-enhanced Raman scattering (SERS) effect was observed on the copper substrate etched by 2.5 mol·L-1 nitric acid for 15 minutes. The enhancement factor is 1.39×10⁴. By using the Raman laser as the light source, when the annealing temperature is 140 ℃, it can be observed that there are fewer defects in the graphitized PAN molecular structure and the disappearance of carbon-nitrogen triple bonds, and the ID/IG can reach 1.160 8. The CNT is further used to change the photocatalytic performance of rough copper substrates. We use nitric acid-modified multi-walled carbon nanotubes (MWCNT) combined with PAN to improve the catalytic system. When 2% CNTs are incorporated, PAN can achieve graphitization at 40 ℃ by surface plasmons. The ID/IG can reach 0.942 1,and the introduction of laser greatly improves the controllability of graphitization sites. We attribute it to the catalysis of PAN by hot electrons generated on the copper surface under laser irradiation. It is proposed that there may be two mechanisms of catalysis and graphitization. One is that hot electrons graphitize PAN through CNT, the other is that hot electrons act on O2 near PAN through CNT, and PAN is graphitized through ·O2-.
Sep. 01, 2022Vol. 42 Issue 9 2983 (2022)
© Copyright 2018-2021 | Chinese Laser Press.
All Rights Reserved 沪ICP备15018463号-20