


 View fulltext
Jia-wang LI, Yan LIU, De-qing ZHANG, Yong-an YANG, Chuan-yun ZHANG, Lun LI, and Min-zhen SI
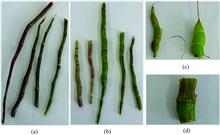
In this paper, Fourier transform infrared spectroscopy (FTIR) was used to compare the five dendrobium species' infrared absorption spectra of stem powder. The stem of Dendrobium is rich in saccharides. The saccharides of Dendrobium Officinale, Dendrobium Paxt and Dendrobium wardianum Warner are complex in composition. And the sugar units are mainly galactopyranose, grape pyranose, mannopyranose, arabinopyranose and xypyranose. The sugar components in the stem of Dendrobium strongylanthum Rchb. f. were simple. The sugar units were galactopyranose, grape pyranose and mannopyranose. Dendrobium wardianum Warner had the same chemical structure as Dendrobium strongylanthum Rchb. Dendrobium Officinale had the same chemical structure as Dendrobium devonianum Paxt. The species of Dendrobium could be identified by the characteristic absorption peak of the polysaccharide fingerprint absorption region.
Oct. 01, 2022Vol. 42 Issue 10 2989 (2022)
Dong-dong SHI, Zhao-bin CAO, Yan-hua HUAN, Yan-chun GONG, Wen-yuan WU, and Jun YANG
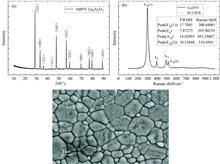
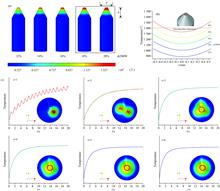
Rare earth zirconate (RE2Zr2O7, RE is rare earth element) materials have the advantages of low thermal conductivity, stable high-temperature phase structure, corrosion resistance and relatively low price, etc. In recent years, it has been widely and deeply applied in the fields of the thermal barrier coating, environmental barrier coating and nuclear protective coating and has attracted extensive attention.However, the current research on these coating materials is mainly focused on thermal, mechanical and electrical properties, while the optical properties, especially the polarization characteristics of reflected light, are rarely reported. Therefore, taking La2Zr2O7 as the representative, the optical polarization characteristics of rare earth zirconate were systematically studied, especially the corresponding relationship between material surface properties and optical polarization characteristics was analyzed. In the experiment, the powder and density bulk of La2Zr2O7 were synthesized by the solid-state reaction method. The microstructure was analyzed and characterized by X-ray diffraction (XRD), Raman spectroscopy and scanning electron microscope (SEM). The results show that the prepared La2Zr2O7 is a cubic pyrochlore phase structure.In the analysis of optical properties, natural light and linearly polarized light were used as detection light sources, respectively, and the polarization characteristics of reflected light are studied under different detection angles.It is shown that, for the natural light incidents, the degree of linear polarization (DOLP) of both bulk and powder La2Zr2O7 materials is significantly dependent on the incident light wavelength. With the increase of wavelength, the DOLP increases first and then decreases. It is worth noting that the DOLP decreases rapidly and approaches zero in the infrared band, indicating that the material shows good polarization stealth characteristics in the infrared band. It is also found that the DOLP of dense bulk has amaximum value at ~720 and ~773 nm while natural light is incident, and the peak wavelength is not sensitive to the detection angle. Powder materials also have two peaks near ~714 and ~774 nm. Under the incidence of linearly polarized light, for the large angle detection angle, DOLP of bulk has two peaks at ~720 and ~763 nm respectively. Different from the incidence of natural light, two peak values are equal under the same detection angle. Two peaks near ~720 and ~755 nm respectively appear for powder materials, and the peak intensity decreases, indicating that the roughness of the coating material has a definite influence on the polarization characteristics of the reflected light.Further research shows that the wavelength corresponding to the two peaks does not become dependent on the detection angle. The results of this study provide theoretical and experimental support for the development, application and design of polarization spectroscopy of rare-earth zirconate coating materials.
Oct. 01, 2022Vol. 42 Issue 10 2995 (2022)
Yi-min LIAO, Yin-zhou YAN, Qiang WANG, Li-xue YANG, Yong-man PAN, Cheng XING, and Yi-jian JIANG
ZnO is third-generation semiconductors which can be used as the carrier of ultraviolet photoluminescence and multi-resonance mode laser. In recent years, ZnO microcrystals prepared by optical vapor supersaturation precipitation (OVSP) have shown important advantages in photocatalysis, efficient multi-color light source and efficient electroluminescence. However, the high preparation cost and low production efficiency hinder the development of the large-scale device. In this work, we designed and built a set of growth devices with a working wavelength of 1 080 nm and a power of 18% (@2 500 W) laser heating. The height of the raw material rod was 6.5 mm, and the diameter was 8 mm. The results show that the morphology, structure, and luminescence properties of the products prepared by this device are very close to those prepared by the OVSP method, and the production efficiency is greatly improved (~500 %). The growth device successfully prepared acceptor-rich ZnO single crystal micro rods with complete hexagonal cross-section morphology. The diameter and length of ZnO micro rods are about 3.8 and 10~20 μm, respectively. Raman spectra show that the Raman peaks of ZnO micro rods are sharp, and the Raman mode at 437 cm-1 indicates that the ZnO micro rods are hexagonal wurtzite structures with good crystallinity. By analysing the PL spectra of ZnO micro rods, it was found that the ZnO microtubes prepared by the OVSP method had a similar ultraviolet bimodal structure, indicating that there exists an abundant zinc-vacancies acceptor. In the 80~280 K range, with the increase of temperature, the fluorescence intensity of ZnO microrods appears “thermal quenching-negative thermal quenching-thermal quenching” behavior. The negative thermal quenching behavior in the range of 166~200 K is related to the intermediate state energy level (trap center) at 477 meV below the conduction band bottom, and the thermal quenching phenomenon in the range of 200~280 K is related to the non-radiative recombination center at 600 meV below the conduction band bottom. The appearance of both is related to the prepared ZnO microrod oxygen vacancy (VO) defect. The laser growth device developed in this paper has high feasibility and practicability. This preparation method lays a technical foundation for the rapid batch growth of ZnO single crystal micro rods with rich acceptors and is also of great significance for its application in optoelectronic devices.
Oct. 01, 2022Vol. 42 Issue 10 3000 (2022)
Kun YANG, Lei CHEN, Fan-chong CHENG, Huan PEI, Gui-ming LIU, Bao-huai WANG, and Wen ZENG
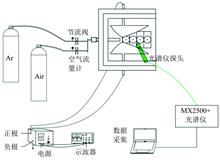
To understand the effect of argon on the air gliding arc plasma, an air gliding arc plasma was generated at a discharge frequency of 10 kHz and an atmospheric pressure with qAir=15 L·min-1 to study the effect of Ar volume flow on air-Ar gliding arc discharge. And then focused on the analysis of the active particle species, electron density and vibration temperature of air gliding arc plasma under different Ar volumetric flow rates and voltage of the voltage regulator. The results show that the main active particles in the gliding arc plasma region are OH, the second positive band system of N2, Hα, O atoms, Ar Ⅰ and Ar Ⅱ atoms. It is found that the relative spectral intensity of O and ArⅠ, ArⅡ atoms is strong. With the increase of Ar volume flow, the relative spectral intensity of O(777.4 nm) increases slowly at first, then quickly increases to a maximum value, then slowly decreases and tends to stabilizes, and the relative spectral intensity of O(777.4 nm) varies between 1 580~6 650 a. u. The relative spectral intensity of O(777.4 nm) increases as the voltage of the voltage regulator increases. Moreover, the influence of voltage of the voltage regulator on the relative spectral intensity of O(777.4 nm) is affected by the volume flow of Ar: The relative spectral intensity of O(777.4 nm) changes significantly under high Ar volume flow (4~6 L·min-1). The addition of Ar significantly increases the relative spectral intensity of OH (313.4 nm), the relative spectral intensity of OH(313.4 nm) varies between 235~311 a. u. As the volume flow of Ar increases, the relative spectral intensity of OH(313.4 nm) first increases and then decreases and tends to stabilize. At a lower voltage (100 V), the relative spectral intensity of OH(313.4 nm) does not change significantly with the volume flow of Ar. As UR increases, the relative spectral intensity of OH (313.4 nm) changes significantly with the volume flow of Ar: at low Ar volume flow (0~4 L·min-1), the relative spectral intensity of OH (313.4 nm) increases significantly with the increase of Ar volume flow. A Gaussian fitting is made with the Hα spectral lines to analyse and calculate the electron density. It is found that the electron density is between 1.15~2.04×1017 cm-3. Keeping the air flow constant, the addition of Ar can significantly increase the electron density: when qAr is 0~4 L·min-1, the electron density has an apparent growth trend. As qAr continues to increase, at lower UR (100~120 V), the electron density first increases and then decreases and tends to stabilize. At the higher UR (140~160 V), the electron density first increases and then slowly increases and tends to stabilize. The change of the UR will also affect the electron density. The electron density increases with UR, and as the UR increases, the electron density growth trend becomes faster.
Oct. 01, 2022Vol. 42 Issue 10 3006 (2022)
Xin-yuan ZHAO, Guo-yang WANG, Qing-hao MENG, Feng-xuan ZHANG, Si-yu SHAO, Jing DING, Bo SU, and Cun-lin ZHANG
Terahertz (THz) refers to an electromagnetic wave with a frequency of 0.1~10 THz and a wavelength of 30~3 000 μm. Because the frequencies of vibration and rotation of many small molecules in nature are in the terahertz band, and the low electron energy characteristics of terahertz will not cause damage to the samples to be tested in the experimental process, terahertz technology is widely used in the fields of nondestructive testing, biomedicine and so on. However, there are few reports on terahertz in the field of ferromagnetism. Therefore, in this study, terahertz transmission characteristics of new magnetic material, carrier liquid, a magnetic fluid component, are studied by terahertz time domain spectroscopy. Magnetic fluid is a new functional material with both liquid fluidity and solid magnetism, breaking traditional magnetic materials' solid form. The magnetic fluid is composed of Fe3O4 nanoparticles and a carrier liquid. In the previous research results, it is found that magnetic fluid not only has a good magneto-optical effect but also has high transmittance to terahertz at a certain frequency. In addition, under the action of an extremely low-frequency electromagnetic field, it can be used in medical tumor therapy and as a drug delivery system for targeted therapy. Due to the high cost of carrier liquid, a magnetic fluid component, microfluidic technology is used in this experiment. Microfluidic technology has the advantages of less consumption of detection samples, fast detection speed, and can design channels according to experimental needs. Therefore, it is a convenient and flexible detection method. In this study, a sandwich terahertz microfluidic chip was made of quartz material with high transmittance to terahertz waves. First, put two pieces 3 cm×3 cm×2 mm quartz glass is used as the substrate and cover, and then the strong adhesive double-sided adhesive tape is cut and engraved into a hollow pattern to form 2 cm×2 cm square area, and then bond the cover sheet and the substrate through the engraved strong adhesive double-sided tape, with a channel thickness of 50 μm. It can be used to detect a small amount of liquid, and the carrier liquid can be made into a thin film. Then, combining terahertz technology and microfluidic technology, the terahertz transmission characteristics of carrier liquid are studied by terahertz time-domain spectroscopy (THz-TDS). The study of terahertz time domain spectroscopy and frequency domain spectroscopy shows that the signal intensity of microfluidic chip with carrier liquid is higher than that of empty microfluidic chip. This discovery provides technical support for the in-depth application and research of carrier liquid.
Oct. 01, 2022Vol. 42 Issue 10 3012 (2022)
Gui-jun ZHU, Gan-zhen WANG, Jun PENG, Zong-ping TIAN, and Zhi-hua HOU
Recently a rare mineral of the Phosphohedyphane series was discovered in Hunan Province of China. It occurs in the clay adits above the Pb-Zn deposit, the Shizhuyuan, about 15 km east-south of Chenzhou. Determination of the mineral is difficult because its mineralogical and spectroscopic characteristics are similar to some phosphate minerals. Routine determinative procedures and spectroscopy analysis were carried out to investigate the mineral morphology, microstructure, spectroscopy features and partial chemical compositions of 4 samples. The crystals occur as subtransparent, yellow-green to bluish-green, the aggregate of micro-crystals. Crystal faces exhibit vitreous to greasy luster. The mineral has a Mohs hardness of approximately 4. The relative gravity is 4.487~5.331 g·cm3. The observation by stereoscopic microscope shows that crystals are hexagonal prisms, as individuals up to about 1 mm in length and ≤0.8 mm in diameter. Crystals occur in subparallel intergrowths and irregular clusters. The specimens' infrared spectra show good agreement with Fluorphosphohedyphane. The vibration mode and frequency of PO43- determine the infrared spectrum's main feature of samples. The phosphate ions' asymmetry stretching vibrations appear at about 1 090/1 010 cm-1 and their symmetry stretching vibrations appear at 934 cm-1. Correspondingly, their bending vibrations appear at about 589/566/546 cm-1 with weak spilt bands of CO32- and AsO43- from the infrared absorption spectroscopy. The Raman spectra analysis proves the phosphate ions stretching vibrations appear at about ~400/426 cm-1 while the bending vibrations appear at ~558/586 cm-1 with symmetric stretch at ~936/976 cm-1 and asymmetry vibration at about 1 060 cm-1. Two Raman bands at ~170~214 cm-1 are assigned to lattice vibration. In addition, there is a notable band of AsO43- at ~822 cm-1 in the Raman spectra. The results of semi-qualitative chemical composition analysis by Energy Dispersive X-ray Fluorescence (EDXRF) show the main elements of Pb, Ca, PO and Cl, with trace elements of Cu, Fe, Zn, et al. The 2θ°, d-spacing, hkl and intensity of main Powder X-Ray Diffraction (XRD) lines are 10.603/22.351/28.261/31.047°, 8.336 5/3.974 4/3.155 3/2.878 2 Å, (100/111/210/211), 59.1/36.4/30.0/100 respectively. The samples' d-spacing is smaller in comparison with Phosphohedyphane and closely matches Fluorphosphohedyphane's. The integraded analysises of relative gravity, vibrational spectroscopy and XRD data prove that the 4 experimental samples are Fluorphosphohedyphane. The present paper is the first report on the discovery of Fluorphosphohedyphane from Chenzhou of Hunan Province, China. This provides an initial spectroscopy analysis on which to undertake further studies of chemical quantitative analysis, composition, or structural refinement work.
Oct. 01, 2022Vol. 42 Issue 10 3017 (2022)

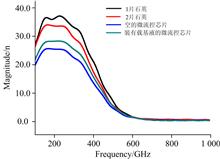
Bing-ying LEI, Bo-ping XU, Yi-shan WANG, Xiang-ping ZHU, Yi-xiang DUAN, Wei ZHAO, and Jie TANG
Laser-induced breakdown spectroscopy (LIBS), a fast and real-time tool for elemental analysis, has attracted great attention due to its broad applications in trace detection, geological environment monitoring, and other fields. The sample surface is one of the key environmental factors that affect the generation and characteristics of plasma. In this work, a 1 064 nm-laser beam with a pulse width of 8 ns is used to produce plasma in ambient air and comparatively investigate the emission spectra of a series of natural rock samples under non-flat and flat samples surfaces. Based on the laser-supported detonation wave model, the influence of non-flat sample surface on spectral characteristics of laser-induced plasmais discussed. For time-integrated spectra, the results show that the spectral intensities of the atomic lines of the non-flat sample are reduced by nearly 70% compared to those of the flat sample. This indicates that the negative effect of the non-flat sample surface on the LIBS cannot be ignored. According to the signal intensity of the spectral lines, Fe Ⅰ 404.58 nm and Fe Ⅰ 438.35 nm from limonite sample under different laser energies, the variation of their peak intensities and reduction factor with the change of laser energy were studied under the conditions of flat and non-flat sample surfaces. It is found that the spectral intensity under the condition of the non-flat sample surface is lower than that under the condition of the flat sample surface. It is worth noting that the reduction factor of spectral intensity first decreases gradually with laser energy, reaches the minimum value at 33 mJ, and then increases with the further increase of laser energy. Further observations show that laser-plasma with lower electron density is generated on the non-flat sample surface, and the ratio of the electron density of the non-flat sample to that of the flat sample reaches its minimum at the laser energy of 33 mJ, which is consistent with the changing trend of reduction factor with laser energy. This mainly arises because a thinner energy absorption region in laser-plasma is formed due to the large laser incident angle on the non-flat sample surface, thereby increasing the laser energy threshold corresponding to the plasma shielding. Moreover, it is found that the sample surface and the laser energy have little effect on the plasma temperature.
Oct. 01, 2022Vol. 42 Issue 10 3024 (2022)
Yong-bin ZHANG, Dan-dan ZHU, Ying CHEN, Zhe LIU, Wei-liang DUAN, and Shao-hua LI
The frequent occurrence of algal bloom seriously affects the Marine environment and human production activities, so it is very important to monitor the phytoplankton in water.3D fluorescence spectroscopy has been widely used in the analysis of algae community composition and the quantitative analysis of algae concentration in water phytoplankton. However, the information redundancy in 3D fluorescence spectrum data has significantly impacted the qualitative and quantitative analysis of algae.In order to solve the problem of spectral information redundancy, a new wavelength selection method of 3D fluorescence spectrum based on the combination of feature region and convex point extraction is proposed.Taking Aureococcus anophagefferens, Chlorella Vulgaris, and Synechococcus elongatus as the research object, the Savitzky-Golay convolution smoothing method was used to preprocess the 3D fluorescence spectrum to solve the problem of spectral noise caused by external factors. The Mahalanobis distance method was used to eliminate the abnormal spectral samples in the 3D fluorescence spectrum data set.The residual concentration method was used to eliminate the abnormal concentration value samples in the 3D fluorescence spectrum data set.Then the reliability of the convex points under different characteristic regions was measured by the root mean square error of cross-validation (RMSECV) of the PLS regression model, and the wavelength variable was selected. In order to verify the effectiveness of the wavelength selection method, the PLS regression model was established for the three algae species, and the determination coefficient (R2) and root mean square error of cross-validation (RMSECV) were used as the evaluation indexes of the model. Compared with the regression model established with the full spectrum data, the wavelength variables of Aureococcus anophagefferens, Chlorella Vulgaris, and Synechococcus elongatus respectively decreased from 1 071 to 77, 75 and 67, and R2 respectively increased by 0.016 4, 0.002 and 0.032 4. RMSECV was respectively reduced by 1.8×10⁵, 2.0×10⁵ and 2.6×10⁵. Compared with the UVE method, the wavelength variables of Aureococcus anophagefferens, Chlorella Vulgaris, and Synechococcus elongatus were respectively reduced by 599, 357 and 317, and R2 was respectively increased by 0.014 5, 0.000 4 and 0.012 3, RMSECV was respectively decreased by 1.6×10⁵, 7.0×10⁴ and 1.6×10⁵. After the selection of wavelength variables by the method of feature region combined with convex point extraction, the redundant information is reduced, and the model's prediction ability is improved.
Oct. 01, 2022Vol. 42 Issue 10 3031 (2022)
Yu-xia ZHENG, Paerhatijiang TUERSUN, Remilai ABULAITI, Long CHENG, and Deng-pan MA
Noble metal nanoparticles have attracted much attention because of their local surface plasmon resonance properties, among which Au-Ag alloy nanoparticles have widespread investigated for their good structural stability, photothermal properties, and potential anticancer efficacy. The properties in many applications are closely related to particle size and concentration. However, the currently used electron microscopy observation method, and dynamic light scattering method cannot obtain both particle size and concentration information, so it is very important to take effective means to measure particle size and concentration. Based on the spectral extinction method, the inversion problem is solved using a non-negative Tikhonov regularization method and the extinction matrix is calculated using the Mie theory. For the noise problem, two cases are adopted to study the inversion of the particle size distribution and concentration of polydisperse Au-Ag alloy nanospheres. In the case of without noise, the inversion error of particle systems Ⅰ is smaller than that of particle systems Ⅱ, and the inversion error is the smallest in the wavelength range of 300~500 nm, where the inversion errors of the mean particle size, the standard deviation of particle size, and the particle number concentration are 0%, -0.03%, and 0%, respectively. In the case of adding random noise, 0.5% and 1.0% random noises were added to the extinction spectrum of particle systems Ⅰ. The inversion error was the smallest in the wavelength range of 200~600 nm. When 0.5% random noise was added, the ranges of particle size distribution, the standard deviation of particle size, and particle number concentration were 79.76~80.15 nm, 5.60~6.61 nm, and 0.995 8×10¹⁰~1.005 9×10¹⁰ particle·cm-3, respectively; when 1.0% random noise was added, the ranges of particle size distribution, the standard deviation of particle size, and particle number concentration were 78.87~80.27 nm, 5.36~9.00 nm, and 0.992 4×10¹⁰~1.027 7×10¹⁰ particle·cm-3, respectively. It was found that with the increase of random noise, the variation range of the inversion result also increased significantly (i. e., the relative error of the inversion increases). The mean particle size, the standard deviation of particle size, and the particle number concentration were averaged after 100 random noise sequences were added. When the random noise increases from 0.5% to 1.0%, the relative errors of the inversion results increase, but the relative errors of the particle size distribution, the standard deviation of particle size, and the particle number concentration are less than 6%. It indicates that the inversion results obtained by the algorithm have good stability. This investigation shows that the spectral extinction method provides a simple and rapid characterization means for the inversion of particle size distribution and concentration of polydisperse Au-Ag alloy nanospheres, and also has enlightenment for the investigation of non-spherical nanoparticles.
Oct. 01, 2022Vol. 42 Issue 10 3039 (2022)
Yu-rui TAO, Hong-bo WANG, Hai-hua WANG, and Mi ZHOU
Due to the important application of cyanamide compounds in organic synthesis, the design and mechanism research of various cyanamide compounds have become a hot topic. The structure is the basis for functional material design. In order to explore the structural stability of a prototype of cyanamide compounds-dicyandiamide, we study the high-pressure Raman investigation of dicyandiamide at pressures of 24GPa.Under compression, most of the Raman lines move toward to high wave-number region, indicating that the reduced bond length of the functional group in dicyandiamide is shortened. Furthermore, the intensity of four Raman bands located at 502, 524, 934 and 2 157 cm-1 respectively change greatly with pressure (N—H, N—C≡N, C=N—C C≡N). At the same time, spectral phenomena such as new appearance of Raman peaks, disappearance of original Raman peaks and splitting of some Raman peaks are observed, indicating a pressure-induced electronic density rearrangement occurs in the dicyandiamide. Through the analysis of Raman frequency-pressure curves of dicyandiamide. It is observed that the slope of most curves suddenly changes at 5 GPa, and it could be concluded that a first-order phase-transition happens at about 5 GPa. Furthermore, there is no significant change in the slope of the C=N and C≡N frequency-pressure curves, indicating that the two functional groups have similar pressure responses before and after the phase transition. In contrast, the slope of N—H bending vibration changes significantly, indicating that this functional group has a complex response to pressure, which is attributed to the inter-molecular hydrogen bond between dicyandiamide molecules. In addition, the intensity of the N—H stretching mode decreases gradually with the increase of pressure, and the frequency shows an abnormal blue shift, which indicates that the N-H bond length extends and the intermolecular hydrogen bond of dicyandiamide is enhanced in the new structural phase. At ambient conditions, dicyandiamide has two kinds of isomers, imino and amino forms. The characteristic peak of the imino form is 2 157 cm-1 and that of the amino form is 2 203 cm-1. According to the characteristic Raman line intensity evolution of the two isomers, it is found that the amino form of dicyandiamide transforms into an imino form gradually and disappears at 11 GPa. This study shows that high pressure Raman spectroscopy is an effective method to study the structural phase-transition and isomer identification of cyanamides, which provides an experimental basis for the design and synthesis of functional materials.
Oct. 01, 2022Vol. 42 Issue 10 3046 (2022)
Cheng-qian JIN, Zhen GUO, Jing ZHANG, Cheng-ye MA, Xiao-han TANG, Nan ZHAO, and Xiang YIN
NIR Hyperspectral imaging technology was used to detect soybean moisture content rapidly and non-destructively and realized the visualization of soybean moisture content. A total of 96 soybean samples of hyperspectral images in the region of 900~2 500 nm were acquired, and the moisture content of each soybean sample was measured by the direct drying method. The average spectral information of the region of interest(ROI)of the image was extracted by HSI Analyzer software, representing the sample's spectral information. The SPXY algorithm was used to divide the sample calibration set and prediction set, and the spectral data in the band range of 938 to 2 215 nm were retained. The spectral's pretreatment was analyzed, such as Moving Average, Smoothing S-G, Baseline, Normalize, Standard Normal Variate(SNV), Multiple Scattering Correction(MSC)and Detrending, and the PLSR model established after Normalize pretreatment had the best effect. The characteristic wavelengths were selected by successive projections algorithm(SPA), competitive adaptive reweighted sampling(CARS)and uninformative variable elimination(UVE). 14,16 and 29 characteristic wavelengths were selected by SPA, CARS and UVE, accounting for 6.5%, 7.4% and 13.4% of the total wavelengths. The prediction models were established for the spectra and characteristic wavelengths of 938~2 215 nm, and the model with better effect was combined with the Normalize method. Compared with the 14 prediction models established, it was found that the modeling and prediction effect of characteristic wavelengths selected by the SPA algorithm was good, and the Normalize-SPA-PCR model was optimized. The values of RC2 and RP2 in the model were higher, which were 0.974 6 and 0.977 8, respectively, while the values of RMSEP and RMSECV in the model were lower, which were 0.238 and 0.313, respectively. The stability and predictability of the model were good, which could be used to predict the soybean moisture content accurately. The Normalize-SPA-PCR model was used as a visual prediction model for soybean moisture content, and the moisture content of each pixel in the hyperspectral image was calculated to obtain a gray image. The gray image was transformed by pseudo-color transformation to obtain a visual color image of soybean moisture content. The 24 soybean varieties in the prediction set were visualized. The color of the visualized image was different with different moisture content, and the color of the visualized image was more evident with different moisture content. The results showed that hyperspectral imaging combined with stoichiometry could accurately, rapidly, and non-destructive predict soybean moisture content. They realized the visualization of soybean moisture content, which provided technical support for soybean moisture content detection in the process of soybean harvest, storage and processing.
Oct. 01, 2022Vol. 42 Issue 10 3052 (2022)
Yu-qi CAO, Xu-sheng KANG, Piao-yun CHEN, Chen XIE, Jie YU, Ping-jie HUANG, Di-bo HOU, and Guang-xin ZHANG
Terahertz radiation bridges the gap between the microwave and optical regimes. It has unique properties such as fingerprint characteristics, non-destructive testing and transparency to various materials, which makes terahertz waves have significant scientific and technological potential in drug testing applications. Terahertz time-domain spectroscopy plays an important role in identifying target drugs containing absorption peaks. It can be used to discriminate specific molecules contained in drugs or the changes of components in samples, as many molecules have characteristic absorption peaks in the terahertz regime. Thus, to solve the problems of identifying weak absorption peaks of low content targets in the mixture, in this paper, the adjoint inflection point (AIP) method based on the discrete local maximum (DLM) method is proposed for identifying the characteristic absorption peaks in terahertz regime for the effective identification of the low content target. Firstly, the adjoint inflection points of potential absorption peaks are obtained using the first and second derivative of the terahertz absorption coefficient spectrum. Secondly, the difference spectrum is calculated by performing the operation between the original absorption spectrum and the baseline spectrum. At last, the absorption peak positions are determined by using the DLM method along the difference spectrum. Also, this AIP method is applied to the absorption peak extraction of four nitrofurans sample spectra. The result is compared with the peak positions determined by DLM, and the peak positions are also compared with the peaks calculated by the density functional theory. The better performance of the recognition capacity of the AIP method is observed and verified, especially for weak absorption peaks. This method suggests that it has profound application potential in spectroscopic analyses and even in determining curve peaks in various applications.
Oct. 01, 2022Vol. 42 Issue 10 3058 (2022)
Dong-li QI, Jia CHENG, Hui SUN, Rui-xin ZHANG, Jian-yu SONG, Yan-li QIN, Hong-da LI, and Long-hai SHEN
In order to change the particle size of TiO2 and improve photocatalytic performance, TiO2 powder was treated by high-energy ball milling. The effects of ball milling time on the morphology, crystal structure, Raman spectrum, fluorescence spectrum and Photocatalytic Performance of the samples were studied; The relationship between fluorescence spectrum and photocatalytic performance was analyzed to identify the photocatalytic mechanism and provide a basis for quickly judging the photocatalytic performance of photocatalysts. The results showed that with the increase in milling time, the sample particles changed from regular to irregular shape, and the surface became rough. All samples were mainly anatase structures with a small amount of rutile structure. With the increase of ball milling time, the (110) diffraction peak of rutile structure gradually increased, indicating that a small amount of TiO2 had undergone phase transformation during ball milling, and the grain size first decreased and then increased. All samples showed the Raman scattering peak of anatase TiO2, but the Raman scattering peak of rutile crystal was not found. The FWHM of each Raman peak increased with milling time, indicating that the sample's surface quality decreased, and the surface defects and oxygen vacancies gradually increased. All samples hada fluorescence peak near 470 nm, and the fluorescence peak of the samples after ball milling was enhanced. The TiO2 samples after ball milling had fluorescence peaks at 397, 452, 483, 500 and 536 nm, and the intensity of TiO2 fluorescence peaks after ball milling for 4 h was the strongest, indicating that the surface defects and oxygen vacancy content were the most, which was consistent with the results of Raman spectroscopy. With the increase of irradiation time to 100 min, the degradation rate of all samples increased, and the degradation rate of methyl orange exceeded 60% after 100 min. The degradation rate of TiO2 samples after ball milling was higher than that without ball milling, and the degradation rate of samples milled for 4 hours was the highest, indicating that its photocatalytic performance was the best. In the photocatalytic reaction process, oxygen vacancies and defects became the center of capturing photogenerated electrons, so the recombination of photogenerated electrons and holes was effectively prohibited. The oxygen vacancy in the sample contributed to the absorption of oxygen. Oxygen interacted with photogenerated electrons captured by oxygen vacancies to form oxygen radicals, which played a key role in the oxidation of organic compounds. Therefore, the more oxygen vacancies and surface defects, the stronger the exciton photoluminescence peak, the better its photocatalytic performance. The photocatalytic performance of TiO2 powder can be improved by ball milling, and photocatalytic performance can be judged quickly and qualitatively by the intensity of exciton photoluminescence peak.
Oct. 01, 2022Vol. 42 Issue 10 3063 (2022)
Li-gang ZHANG, Li-hong MA, Su-ling ZHAO, Zheng XU, Hai-jun YANG, Chen-pu LI, Ke WANG, Gui-xia LIU, Yong-qing BAI, and Wen-mei SHEN
At present, rare-earth ion-doped up-conversion luminescent materials (UCNP) have attracted widespread attention due to their massive potential of practical application in various fields like color display, biological imaging, solar cells, photodynamic therapy, solid-state lasers and more. Among various rare earth elements, Sc is situated at the top of the third main group and at the beginning of the transition element. With the minimum ionic radius, it demonstrates different physical and chemical properties to Y, Gd, and Lu-based materials. Although Na3ScF6 is regarded as a new and efficient host material for its consistent chemical properties and low phonon energy, there are still few studies focusing on it. Allowing for this, the solvothermal method was adopted in this study, with oleic acid (OA) and octadecene (ODE) as complexing agents. On the basis of OA:ODE=10 mL:10 mL and NaF:Ln3+=4:1, a series of monoclinic Na3ScF6:Yb/Er nanocrystals were synthesized at the temperature of 260, 280, and 300 ℃, respectively. The phase, microstructure and upconversion luminescence properties of the samples were characterized by X-ray diffractometer, transmission electron microscope and fluorescence spectrometer, respectively. Research indicates: when the reaction temperature reached 260 ℃, the sample was monoclinic Na3ScF6:Yb/Er (PDF No.47-1221) nanospheres with a particle size of about 20 nm; when the reaction temperature reached 300 ℃, the sample was monoclinic phase Na3ScF6:Yb/Er (PDF No.20-1221) nanocrystals with a size of about 18 nm, exhibiting high crystallinity and excellent dispersion. Having a mixed phase of PDF No.47-1221 and PDF No.20-1221 at 280 ℃, the sample demonstrated uniform morphology and excellent dispersion, with a particle size of about 30 nm. Under the excitation of a 980 nm laser, the upconverted luminescence color of the sample shifted from red light to green light when the reaction temperature was raised from 260 to 300 ℃, while the luminous intensity showed a significant increase to about 3.1 times the original level. Moreover, a discussion was conducted about the evolution of the sample morphology with time at 300 ℃. This work achieves a controllable output of Na3ScF6:Yb/Er nanocrystal upconversion luminescence color only by adjusting the reaction temperature, which not only provides a simple method for the regulation of red and green light, but also complements scandium-based fluoride and broadened the application scope of scandium-based nanomaterials.
Oct. 01, 2022Vol. 42 Issue 10 3068 (2022)
Yuan LI, Wen-bo ZHANG, Xiao-lin CHEN, Han LI, and Guan-jun ZHANG
As the aging condition of the insulating papers determines the remaining lifetime of the oil-immersed transformers, a fast and effective aging assessment method for insulating paper is of great significance. As it is known, the degree of polymerization (DP) is the most direct parameter to characterize the aging condition of insulating papers. However, the traditional detection method or so-called viscometry is time-consuming and destructive. Near-infrared spectroscopy (NIRS) technology, as a non-destructive detection method can rapidly determine the samples' components and contents. Until now, it has been successfully applied in many fields and will hopefully be employed as an alternative method to viscometry. However, the current spectral quantitative analysis method is still not accurate enough to predict the DP of insulating paper samples. In this paper, we introduce Gaussian process regression (GPR) to predict DP of insulating papers accurately. Firstly, the NIRS database of insulating papers under different aging conditions is established, and in this procedure, the raw spectra are preprocessed by the Savitzky-Golay method to improve the signal ratio to noise. Then GPR models with various kernels are established, and the prediction accuracy and stability of the different models are comparatively studied. The results show that the GPR model with Exp kernel is of poor generalization performance, and the models with Matern32, Matern52 and RQ kernels are highly sensitive to the model parameters. Finally, the SE kernel is selected as the optimal kernel function of the GPR model. The DP prediction results of the SE kernel GPR model are compared with traditional PLS, SVR and BPNN models, and the results show that our established GPR model has the lowest RMSE (65.5 and 70.6) and highest correlation coefficient r (0.94 and 0.93), both for the training set and testing set. The RMSE of the GPR model is lower than PLS, SVR and BPNN models by 54.1%, 58.8% and 12.9% respectively. It is indicated that the established GPR model can be a powerful tool for the aging assessment of insulating papers by the NIRS technique.
Oct. 01, 2022Vol. 42 Issue 10 3073 (2022)
Bin WU, Jia-qi SHEN, Xin WANG, Xiao-hong WU, and Xiao-lei HOU
The storage time of lettuce is an important factor affecting the quality. The traditional way of detecting lettuce storage time mostly depends on artificial experience, so it lacks accuracy and reliability. This study aims to provide a fuzzy recognition model for spectral analysis of lettuce to identify the storage time of lettuce compared with other discriminant methods. For this objective, sixty samples of fresh lettuce bought in the local supermarket were prepared and stored in a refrigerator for later detection. These samples were detected by near-infrared spectroscopy (NIR). Firstly, the Antaris II NIR spectrometer (the wave number range: 10 000~4 000 cm-1) was utilized to collect the near-infrared spectral data of lettuce samples every 12 hours, and every sample detection was repeated three times, taking the average value as experiment data. Secondly,NIR spectra were preprocessed with multiple scatter correction (MSC) for decreasing reductant information. PCA and PCA Sort were used to further clear the useless data of NIR spectra and simplify the following classification of data. PCA Sort was based on PCA with sorting principal components and could improve the classification accuracy and help the FLDA extract features effectively. In this step, only the first fifteen components of PCA and PCA Sort were used to compress NIR spectra. Finally, fuzzy linear discriminant analysis (FLDA) algorithm and k-nearest neighbor (KNN) were performed to classify the previous low-dimensional data. The classification accuracy of the model based on PCA coupled with KNN was 43%, and that based on PCA as well as FLDA and KNN was 83%. The classification results in experiments showed that the discriminant of the model based on PCA, FLDA and KNN was significantly improved. Replacing PCA in the model with PCA Sort, the recognition accuracy of this new model based on the algorithm PCA Sortcoupled with FLDA and KNN was better and achieved 98.33%, which was higher than other classification algorithms. The classification results in experiments showed that PCA Sort plus FLDA and KNN could build an efficient discrimination model for the identification of the storage time of lettuce.
Oct. 01, 2022Vol. 42 Issue 10 3079 (2022)
Xu-yang WANG, Tao SUN, Xin-ping ZHU, Guang-mu TANG, Hong-tao JIA, and Wan-li XU
They can be applied to agriculture by changing the properties of biochar by phosphoric acid (H3PO4) and pyrophosphoric acid (H4P2O7) . It is helpful to revealing the bio-availability of P on its surface for identifying P occurrence form and binding mode of changed biochar for H3PO4 and H4P2O7. This paper adopts wheat stalk biochar (WBC) and cotton stalk biochar (CBC) as raw materials. Meanwhile, this paper prepares changed H3PO4 (P-WBC and P-CBC) and changed biochar of H4P2O7 (PA-WBC and PA-CBC) by H3PO4 and H4P2O7 respectively. This paper adopts Raman spectroscopy (Raman) and scanning electron microscopy (SEM) to characterize the structure and P distribution of the changed biochar. In addition, this paper adopts Fourier transform infrared spectroscopy (FTIR) and X-ray photoelectron spectroscopy (XPS) to investigate the P-binding mode of changed biochar surface. Meanwhile, this paper quantitatively analyzes the changes of P form and content in biochar before and after changing by combining the Hedley phosphorus classification method with visible spectro-photometry. The result shows that the IG/ID value of biochar increases and the graphitization structure enhances to form the P-containing granular structure after changing the properties of H3PO4 and H4P2O7. It has promoted the formation of carboxyl (—COOH), P—O—P and P—H acid functional groups on the surface of biochar for changes of H3PO4 and H4P2O7. They are similar to functional groups on the surface of changed biochar of H3PO4 and changed biochar of H4P2O7. XPS result shows that it increases by 13.15%~32.44% significantly by compared with WBC and CBC for the relative content of O1s peak in the changed treatment. Meanwhile, it also shows that it increases by 18.54%~27.02% significantly for the relative content of the P(2s) peak (ps) and O(1s) into C—P—O, C—O—P, O=P—O C=O and (or) P=O C—O—C and (or) P—O—C and P—O—P for the deconvolution integral peaks. It can promote the formation of C—O—P, O=P—O C—O—C and/or P—O—C and P—O—P bonds for the changed properties of H4P2O7 by comparing with the changed properties of H3PO4. It also significantly increases the total P content in biochar for the changed properties. Meanwhile, it is significantly higher than that in P—WBC and P—CBC for the P content in PA-WBC and PA-CBC. The active P content in the changed treatment significantly increases by 2.36~14.77 g·kg-1 compared with WBC and CBC. In addition, the stable P content significantly decreases by 0.06~0.17g·kg-1 (p-1 respectively. The stable P content decreases by 0.03~0.34 g·kg-1 (p3PO4 and H4P2O7. The difference in the content and binding mode of P in different forms between H3PO4 and H4P2O7 modified biochar are of great significance for further exploring the bioarailability of P.
Oct. 01, 2022Vol. 42 Issue 10 3084 (2022)
Peng-cheng YAN, Xiao-fei ZHANG, Song-hang SHANG, and Chao-yin ZHANG
Mine water disasteris a great threat to the safety production of a coal mine, so the rapid identification of mine water inrush source is of great significance to the early warning and post-disaster rescue work. Laser-induced fluorescence (LIF) technology has high speed, high efficiency and high sensitivity, which overcomes the shortcomings of long recognition time in traditional hydrochemical methods. Circulating neural network (RNN) has obvious shortcomings in solving the problems of gradient disappearance and gradient explosion in long sequence training, while the special variant RNN, long and short term memory (LSTM) neural network, makes up for the shortcomings of RNN.In this paper, the combination of LIF technology and LSTM algorithm is applied to rapidly identify mine water inrush source.The experimental samples were collected from Huainan Mining Area. The sandstone water and goaf water were taken as the original samples, and the sandstone water and goaf water were mixed into 5 kinds of mixed water samples. According to different proportions, 7 kinds of water samples experimented. Firstly, MinMaxSxalerr, SG and SNV were used to preprocess the original spectral data to reduce the noise and interference. After that, to prevent the data from being too large and too high a dimension, the dimension of four groups of data, including the original spectral data, was reduced to 3 dimensions by LDA.Finally, the LSTM recognition models are built respectively, and the optimal model is selected by comparing the prediction accuracy of the test set, the changing trend of the accuracy and the loss function of the training set.Thereinto, SG+LDA+LSTM and Original+LDA+LSTM can reach 100% in the test set prediction accuracy, MinMaxScaler+LDA+LSTM test set prediction accuracy is 98.57%, SNV+LDA+LSTM accuracy is the lowest, only 87.14%;In terms of the trend of training set accuracy, SG+LDA+LSTM can keep good learning and reach 100% soon. Original+LDA+LSTM and MinMaxScaler+LDA+LSTM can also reach 100% accuracy. However, at the beginning of the training process, the accuracy will decline, and the SNV+LDA+LSTM training set does not reach 100% within the training times; The trend of SG+LDA+LSTM loss function also has good convergence and stability. Original+LDA+LSTM, MinMaxScalerr+LDA+LSTM and SNV+LDA+LSTM do not perform well in the trend of loss function.The results show that the SG+LDA+LSTM model is the most suitable for mine water inrush identification among the four models. This method supplements the work of mine water inrush source identification and provides a new idea for mine water inrush identification.
Oct. 01, 2022Vol. 42 Issue 10 3091 (2022)
Xu ZHANG, Yue-er YAN, Chun-mei ZHANG, Guang-hui YANG, and Yi TANG
Yan'an was the revolution center and strategic backside of the Communist Party of China and the cradle of revolution. Large numbers of red kinds of literature with historical, cultural, and educational significance were published in the Yan'an period, which recorded the grand development of the Communist Party of China and reflected the continuous improvement of scientific and technological productive force as well as the unique pulping and paper making process in that period. Thus, the research value of Yan'an red kinds of literature is of great importance. However, although these red kinds of literature have a history of fewer than 100 years, their preservation situations are not optimistic, and problems such as aging and embrittling of paper are widespread. These books are in urgent demand of scientific detection and preservation to prolong their live performance. Research on the detecting and analyzing of Yan'an red literature is still blank. Non-destructive testing methods should have opted as far as possible. Based on Attenuated Total Reflection-Fourier Transform Infrared Spectroscopy (ATR-FTIR), the intensity of the characteristic peak at 1 510 cm-1 of lignin and 1 030 cm-1 of cellulose was used as the quantitative foundation to establish the non-destructive testing method of the relative lignin content in paper raw materials and red literature paper. The effect of alkali strength and concentration on the degree of delignification during the pulping process was investigated by examining the lignin content of paper mulberry bark, bitter bamboo and poplar. The generality of FTIR method for determining the relative lignin content was also demonstrated. The relationship between the paper lignin content and the paper pH value or the paper oxidation degree was studied for Yan'an red kinds of literature collected in Fudan University Library. The results showed that red kinds of literature with relative lignin content higher than 25% had a higher paper oxidation degree and acidity(pH 3~4), and the overall preservation situation of this literature was worrisome. However, the red kinds of literature with relative lignin content lower than 25% had a lower paper oxidation degree and acidity, and their overall preservation situation was relatively good. The above results indicate the feasibility of the FTIR method for the determination of lignin content of Yan'an red kinds of literature, and propose a suitable range of paper lignin content in combination with paper oxidation degree and acidity, providing a reference for the delignification process of raw plants in pulping and paper making. This work expands the application of FTIR spectroscopy in the non-destructive analysis of red literature and provides a scientific basis for the research of preservation and conservation of red literature in the Yan'an period.
Oct. 01, 2022Vol. 42 Issue 10 3097 (2022)
Pan LIU, Mi-fang DU, Zhi-ya LI, Ling-qing GAO, Hua-yun HAN, and Xin-yao ZHANG
Tellurium was a trace and harmful impurity element in iron and steel materials, which could reduce the mechanical and fatigue properties of materials by causing embrittlement and micro-cracks between crystals, and further endanger the service safety of marine equipment. Therefore, it was important to accurately and quickly determine and control tellurium in steel. The original standard method GB/T 223.55—2008《Iron, steel and alloy—Determination of tellurium content-Oscillo-polarographic method》 was abolished in 2017, with the full international and domestic entry into force of the Minamata Convention on Mercury. Because the above method used the dangerous dropping mercury electrode, which would cause the accumulation of mercury in the local environment, thereby endangering the operator's health and water environment, the analysis of tellurium in steel urgently needed a more environmentally friendly, accurate and rapid method. Based on the characteristics that tellurium could be reduced to volatile tellurium hydride by new ecological hydrogen, the hydride generation sampling technology was used to separate and enrich tellurium from the matrix solution with high selectivity, and the atomic fluorescence method was used in parallel to determine the trace tellurium content in the steel. The working conditions of the atomic fluorescence spectrometer have been optimized, such as negative high voltage, lamp current, observation height, carrier gas flow, the shielding gas flow. Moreover, hydride generation conditions have been studied, including digestion acid, test solution medium, solution acidity, carrier flow acidity and potassium borohydride concentration. Then, the background interference of steel matrix with coexisting ions such as chromium, nickel, manganese, copper, molybdenum, tungsten, titanium, silicon, and vanadium, and the masking methods were systematically investigated. The optimized condition parameters were as below: negative high voltage of 360 V, lamp current of 70~80 mA, observation height of 7~8 mm, carrier gas flow of 700 mL·min-1, shielding gas flow of 700~800 mL·min-1. The test solution medium was 15% hydrochloric acid, the masking was 2% thiourea-ascorbic acid, and the potassium borohydride concentration was 1.5%~2.5%. The 0.080 g steel sample was digested by 3 mL aqua regia at low temperature until completely dissolved. Then 20.00 mL 10% thiourea-ascorbic acid mixed solution was added, and the volume was adjusted to 100 mL with 15% hydrochloric acid. A calibration curve was established with iron the matrix solution based on matrix matching method. The calibration curve was a quadratic equation with a correlation of 0.999. The limit of quantification was 1.25 μg·g-1, and the relative standard deviation of the determination result was not more than 7%. The determination results of the simulated sample were consistent with the theoretical value, and the bias was better than the tolerance specified in GB/T 223.55—2008. The proposed method has the advantages of sensitivity, accuracy, speed and greenness and could be used for the inspection and control of trace tellurium in steel for marine engineering.
Oct. 01, 2022Vol. 42 Issue 10 3103 (2022)
Ai-guo OUYANG, Tong-zheng LIN, Jun HU, Bin YU, and Yan-de LIU
China's railway has a long span, long operation time and great changes in operation environment, so the wear of wheels is large. In order to ensure the safe operation of high-speed railways, the surface hardness of high-speed train wheels has become an important parameter. The laser-induced breakdown spectroscopy (LIBS) experimental platform was used to conduct the breakdown of eight HS7 high-speed rail wheel steel samples with a different hardness to obtain the LIBS spectral data. It was found that the spectral intensity of matrix elements (Fe) and alloy elements (Cr, Mo, W), the intensity ratio of ion line to atomic line (Ⅱ/Ⅰ), and the spectral intensity ratio of alloy elements to matrix elements(A/M) had different degrees of correlation with the hardness of the samples. Partial least squares (PLS) quantitative analysis model with spectral line intensity and spectral line intensity combined with spectral line intensity ratio as variables was established. Before the establishment of the model, three preprocessing methods, standard normal variable transformation (SNV), Savitzky-Golay convolution second derivative and Gaussian filter (Gaussian filter), were used to reduce the experimental error. The results show that the PLS model established by SNV pretreatment is the best in the model with spectral line intensity as a variable. The determination coefficient of the calibration set is 0.98, the root mean square error is 1.30, the determination coefficient of the prediction set is 0.90, and the root means square error is 2.43. The PLS model established with the original data has the best effect in the model with the ratio of spectral line intensity to spectral line intensity as the variable. The determination coefficient of the calibration set is 0.99, the root mean square error is 0.79, the determination coefficient of the prediction set is 0.94, and the root means square error is 2.44. Through comparison, it is found that the prediction accuracy and stability of the model with the ratio of spectral line intensity to spectral line intensity as the variable are improved compared with the model with the spectral line intensity as the variable. The results show the combined results of spectral line intensity and the intensity ratio of ions to atomic lines. Moreover, the spectral line intensity ratio of alloy elements to matrix elements is used as model variables, which can significantly improve the solution of the PLS model for the prediction of surface hardness of metal materials and construct a quantitative analysis model with stronger correlation. Studies have shown that it is feasible to quantitatively analyze the hardness of high-speed railway wheels by using laser-induced breakdown spectroscopy combined with the partial least squares method. This technology can be applied to the field diagnosis and estimation of the surface hardness of high-speed train wheels, guaranteeing the safe operation of high-speed trains.
Oct. 01, 2022Vol. 42 Issue 10 3109 (2022)
Hong-wei PAN, Wen-bin TONG, Hong-jun LEI, Guang YANG, and Li-li SHI
Organic fertilizer is an effective means to improve soil physical structure, enhance soil fertility and regulate nutrient balance. However, the effects of organic fertilizer application on the evolution of organic matter and nitrogen in farmland are still unclear. This paper studied the changes of TOC, DOC and inorganic nitrogen contents in soil after applying organic fertilizer. The changes of DOM spectral characteristics of soil after applying organic fertilizer were analyzed using three-dimensional fluorescence spectroscopy. PARAFAC was used to analyze the changes in the relative contents of the fluorescent components in soil DOM in different periods after applying organic fertilizer, and 2D-COS was used to analyze the change sequence of the fluorescent components with time. In addition, the response relationship between the relative content of DOM components and soil nitrogen was studied using the typical correlation analysis method to explore the effects of organic fertilizer application on the evolution of soil organic matter and nitrogen. The results showed that: ① The application of organic fertilizer increased the content of total organic carbon, water-soluble organic carbon and nitrate nitrogen but decreased the content of ammonium nitrogen. ②Three-dimensional fluorescence spectra of soil DOM showed a peak (UV humic acid), M peak (UVA humic acid) and T peak (tryptophan). PARAFAC analysis showed that soil DOM was mainly composed of terrestrial humic acid (C1), typical humic acid (C2) and tryptophan (C3). The results showed that applying organic fertilizer could increase the relative contents of soil C1, C2 and C3 components. The relative contents of C1, C2 and C3 in the soil treated with organic fertilizer increased initially and then decreased, reaching the maximum on the 30th day. The change order of different fluorescence components with time was C1(C2)↑→C3, and humic acid-like changed greatly, and the promotion of humic acid-like by organic fertilizer was significant.③The application of organic fertilizer can improve the bioavailability of soil and reduce the degree of soil humification. BIX value increased first and then decreased after applying organic fertilizer and reached the maximum on the 30th day; The HIX value decreased at first and then went up and reached the minimum on the 30th day. BIX and HIX were negatively correlated (R2=0.732). ④The relative contents of C1, C2 and C3 were positively correlated with nitrate nitrogen and negatively correlated with ammonium nitrogen, and the relative contents of C1 and C2 had a great influence on the contents of nitrate nitrogen and ammonium nitrogen. In conclusion, reasonable application of organic fertilizer can control the transformation of soil organic matter and nitrogen reducing the non-point source pollution of chemical fertilizer.
Oct. 01, 2022Vol. 42 Issue 10 3116 (2022)
Xiao-hua GUO, Peng ZHAO, Ya-qing WU, Xue-ping TANG, Di GENG, and Lian-jin WENG
Anxi is the origin of Tieguanyin, with hundreds of millions of gross output values yearly. However, the price of Tieguanyin with different quality is uneven, and the counterfeit and shoddy phenomenon exists in the market. Anxi County and Hua'an County in Fujian Province are the main tea producing areas of Tieguanyin. Although these two counties have a relatively high market share in tea-production and are geographically adjacent, the quality and flavor of tea are different, causing troubles for the tea market. Detecting the types and contents of microelements in Tieguanyin is of great significance in tracing its origin. In the study, standard less semi-quantitative X-ray fluorescence spectrometry (XRF) analysis and microwave digestion-inductively coupled plasma mass spectrometry (ICP-MS) is used to quantitative analyze the element contents of 30 Tieguanyin samples from Anxi (Gande, Xiping, Xianghua) and Hua'an (Liangcun, Huafeng, Xiandu) counties. The element types detected by XRF are K, Ca, S, P, Mg, Al, Si, Cl, Fe, Mn, Rb, Zn, Na, Sr,and there are certain differences in element content. For comparison, we use the ICP-MS method to detect the metallic elements found by XRF. According to the results of the XRF method, tea samples were diluted quickly and accurately for ICP-MS to meet the requirements of trace detection. When detecting Ca, Mg, Al, Fe, Mn and Zn metal elements, the correlation coefficient R2 of the XRF and ICP-MS methods is between 0.824 8 and 0.892 8, and the slope of the trend line is between 0.806 0 and 0.944 9, which shows good comparability. It shows that the XRF and ICP-MS methods are suitable for detecting these six elements. XRF and ICP-MS determined one Tieguanyin sample, the relative standard deviations were less than 6.0% and 3.0%, respectively. Compared with the ICP-MS method, the XRF method is simpler and less time-consuming in the pretreatment. Therefore, when low-cost, fast and easy detection of the content of Ca, Mg, Al, Fe, Mn and Zn in tea samples is required, the XRF detection method is preferred. K, Ca, Mg, Al, Fe, Mn, Rb, Zn, Na and Sr metal elements detected by ICP-MS were used for stepwise discriminant analysis, and the Fisher discriminant model was established to realize the recognition of Tieguanyin tea samples in Anxi County and Hua'an County. The discriminant rate of origin test, cross-validation and test samples established by the model was 96.7%, 96.7% and 100%, respectively. ICP-MS combined with stepwise discriminant analysis is feasible for Tieguanyin tea samples in Anxi County and Hua'an County.
Oct. 01, 2022Vol. 42 Issue 10 3124 (2022)
Xuan HU, Zi-hui CHENG, Shu-chao ZHANG, and Lei SHI
Extracting rare earth elements from hematite and developing high-value-added products can improve the comprehensive utilization of mineral resources, inject resources into enterprises and promote the development of high and new technology. The content of rare earth oxides in red mud is low (0.001 0 %~0.050%), and there are many matrix elements such as aluminum and iron in red mud. How to eliminate the interference of matrix elements in the determination of rare earth oxides is important. The traditional acid dissolving methods can cause incomplete digestion of some elements, which are difficult to quantify accurately and has a low recovery rate. In contrast, the alkali fusion methods can introduce a large amount of alkali flux and cause serious matrix interferences, also block the atomizer at the same time. Red mud was melted with sodium hydroxide and extracted with hot water. Triethanolamine solution was used to eliminate the matrix interferences of aluminum and iron, EDTA disodium solution was used to complex with calcium, magnesium and other interfering elements, and rare earth hydroxide was retained in the precipitation, precipitation was dissolved into the liquid to be tested by hydrochloric acid. Thus rare earth elements were separated from fluxes and matrix elements. The experiment showed that the standard solution did not need matrix matching, the linear correlation coefficients of the calibration curve were not smaller than 0.999 9, and the detection limits were 0.000 2%~0.001 5%. The relative standard deviations of rare earth oxides in the sample were between 2.5% and 7.2%, recovery rates were between 85.0% and 105.0%; results of inductively coupled plasma mass spectrometry (ICP-MS) were consistent with that of ICP-OES. ICP-OES realized the analysis of rare earth oxides in red mud in the future.
Oct. 01, 2022Vol. 42 Issue 10 3130 (2022)
Dong-feng YANG, Ai-chuan LI, Jin-ming LIU, Zheng-guang CHEN, Chuang SHI, and Jun HU
At present, near-infrared spectroscopy (NIRS) technology, can realize the rapid and non-destructive detection of seed vigor, but the vigor grade is generally less than 3, and the accuracy is not high.The contradiction between the increase of vigor level and model precision urgently needs to be solved in the near-infrared spectrum detection of seed vigor. Five kinds of seed samples were obtained by the artificial aging method, and the corresponding spectral data were collected to establish the BP prediction model. In order to improve the accuracy and robustness of the model, an algorithm of coupled Mean Impact Value-Successive Projection Algorithm (MIVopt-SPAsa) is presented. Aiming at the problem of determining the number of feature variables extracted by the Successive Projection Algorithm(SPA), the algorithm sets the number range of feature wavelengths and selects the best in this range to realize adaptive SPA(SPAsa). Aiming at the problem that SPA algorithm takes a too long time, MIV algorithm is used to reduce the dimension of SPA algorithm. Although the MIV method can sort the wavelength influence values, it lacks the threshold value for selecting wavelength influence. Therefore, the relative distance ratio is introduced to optimize the MIV algorithm to effectively segment the characteristic wavelength range. The full spectrum with 1 845 wavelengths is extracted by the MIVopt-SPAsa algorithm, and 37 characteristic wavelengths are extracted, which are mainly distributed near the 7 main absorption peaks of near-infrared spectrum of maize seeds. The results show that the algorithm can effectively extract the characteristic wavelength, which is consistent with the NIR absorption characteristics of maize seed biochemical substances. In order to verify the effect of the algorithm on the performance of the model, the full spectrum BP model, SPAsa-BP model, MIV-BP model, MIVopt-SPAsa-BP model and competitive adaptive reweighting CARS-BP model were established to classify the five grades of maize seed vigor. The average prediction accuracy of the MIVopt-SPAsa-BP model is 99.1%, which is higher than other models; the average prediction time is 14.382 s, which is lower than that of the MIV-BP model (24.523),CAR-BP (97.226) and SPAsa-BP model (101.224 s), but higher than that of full-spectrum model (0.253 1); The best performance cross-entropy is 0.007 892, which is far lower than other 4 models. The experimental results show that the MIVopt-SPAsa algorithm can effectively improve the accuracy of the near-infrared detection model of maize seed vigor, realize multi-level, accurate and nondestructive detection of seed vigor, and provide a reference for optimizing the optimisation seed vigor detection model.
Oct. 01, 2022Vol. 42 Issue 10 3135 (2022)
Ke-yan YUAN, Rong WANG, Xiang-xiang WANG, Li-ping XUE, and Li YU
Camel milk has gradually become a health care dairy product trusted by consumers because of its high nutrition and unique health care effects. However, due to the small output of camel milk and its high market value, this provides a profitable operating space for the hybridization of camel milk. With the further strengthening of the state's crackdown on the illegal addition of melamine in dairy products, inferior hydrolyzed animal protein has gradually become a new favorite for counterfeiting in dairy products due to its high protein content, and low price and strong concealment of illegal addition. Preventing and cracking down on fake and inferior hydrolyzed animal protein in camel milk has become a huge challenge faced by consumers and practitioners in the camel milk industry. How to detect fake and low-cost animal hydrolyzed protein in camel milk has become an urgent problem to be developed. With the rapid development of near-infrared spectral analysis technology in the past ten years, near-infrared spectral analysis technology has gradually become widely used in many fields such as petrochemical, food, agriculture, medicine, etc. widely used. In this paper, the near-infrared spectrometer with a 6 mm sample dish was used to measure the animal hydrolyzed protein of camel milk ginseng with different contents to obtain the original spectral matrix. The original spectra were preprocessed by order derivative+SNV, SG+SNV and other methods, and the 10 principal component regression models of the global spectrum were used for evaluation. By adjusting the calculation scale of principal components, the optimal calculation scale of principal components is determined to be 10. By adjusting the number of interval divisions and using the R2 and RMSECV values of the corresponding model as evaluation criteria, the optimal number of interval divisions is finally determined to be 30. Through experiments and calculations, the principal component score of 6 was obtained in the range of 7 887.87~7 590.87 cm-1, the correlation coefficient was 0.945 1, and the RMSECV value was 0.200 1, was the best prediction model for camel milk adulterated hydrolyzed animal protein. After internal interactive verification, the modified model can well predict the situation of adulterated and hydrolyzed animal protein in recovered camel milk in this system, which can provide technical reference for research in related fields.
Oct. 01, 2022Vol. 42 Issue 10 3143 (2022)
Guo-tian HU, Hui-wei SHANG, Rui-hong TAN, Xiang-hu XU, and Wei-dong PAN
Soil properties can be estimated accurately and quickly using visible and near-infrared (VNIR) diffuse reflectance spectroscopy. However, a key problem is the lack of universal nutrient content calibration models for different soils. To improve the universality of the soil organic matter (SOM) content calibration model for different types of soils and the speed of online detection of the SOM in farmland, sixty-six samples of soil from M107B in the United States were used to establish the SOM content. Calibration model using the particle swarm optimization-based least squares support vector machines (PSO-LSSVM) method using VNIR spectroscopy. Then this calibration model predicted 23 samples of the validation set from M107B. The results gave the coefficient of determination (R2) and the ratio of standard deviation to root mean square error of prediction (RPD) of 0.859 and 2.660, respectively. Subsequently, we predicted the SOM content of the validation set, including 20 samples from N116B, by the PSO-LSSVM calibration model of all 89 soil samples from M107B. The results showed decreases in the R2-value (0.562) and RPD (0.952). These decreases in R2 and RPD values by 34.6% and 64.2%, respectively, indicated that the prediction accuracy was significantly decreased when the PSO-LSSVM calibration model of SOM content in M107B was directly used to predict SOM content in N116B. The PSO-LSSVM calibration model established by the calibration set, a combination of some soil samples from N116B and all 89 samples from M107B was also used to predict SOM content of the previous validation set from N116B and gave the R2 values that were more than 0.80 and RPD values that were more than 2.0 when the number of soil samples from N116B was added over 35. In addition, R2 increased from 0.562 to 0.811. RPD increased from 0.952 to 2.274 when the number of soil samples from N116B added to the calibration set increased from 0 to 50. The results showed that calibration model accuracy could be effectively improved by adding some soil samples from N116B to M107B calibration set when predicting SOM content in N116B. The prediction performance of models was stable, whereas the prediction accuracy met practical requirements when the number of soil samples from N116B added to the calibration set was more than 50. In addition, the calibration model of SOM in M107B was successfully transferred to the soil in N116B, and the samples in N116B with large differences in organic matter content or spectral curve from samples in M107B are preferred to adding to the calibration set because this method can effectively avoid the mutation of model transfer performance. In conclusion, the results provided a method to improve the SOM prediction accuracy of N116B soil using the SOM calibration model of M107B soil. Furthermore, the results provided a new, economical and feasible model transfer method for real-time estimating of SOM content in farmland based on VNIR. The results also provided an effective solution to improve the universality of the SOM content calibration model for different soil types.
Oct. 01, 2022Vol. 42 Issue 10 3148 (2022)
Qian ZHANG, Xiang-hui DONG, Wei-rong YAO, Hang YU, and Yun-fei XIE
Flunixin meglumine (FM) is the only animal-specific non-steroidal anti-inflammatory drug, and it is the most commonly used anti-inflammatory and analgesic drug in veterinary clinics. In recent years, with the expansion of its application scope, its adverse reactions gradually appeared, and the residues of Flunixin meglumine in animal meat gradually attracted people's attention and attention. The current detection methods of FM include liquid chromatography-tandem mass spectrometry, and liquid chromatography. However, this method has disadvantages such as expensive equipment, cumbersome and complicated operation, which is highly unfavourable for rapid on-site detection. Surface-enhanced Raman spectroscopy (SERS) has the advantages of portability, rapid detection, fingerprint recognition, etc., which can overcome the chromatographic technology brought by on-site detection. Because of the inconvenience, it has been widely used in the rapid screening and detection of veterinary drug residues in recent years. Therefore, in order to realize the rapid detection of FM in pork, a rapid detection method of levamisole residues in pork by SERS was established. The gold sol was prepared by reducing potassium chloroaurate with sodium citrate. Through a single factor experiment, it was determined that when the volume ratio of sample to gold gel was 1:3, the pH of the sample was 6, and no coagulant was added, the detection effect was the best. Combining density functional theory to calculate theoretical spectra, compare theoretical calculation spectra with solid Raman spectra, assigning vibration modes to characteristic peaks. Among them, the pyridine ring and benzene ring swing at 731, 1 085 and 1 376 cm-1 are C—H vibration on the benzene ring. After optimizing the extraction pretreatment method and the selection of extractant, a qualitative and quantitative detection method for FM in pork was established under the best detection conditions. In this method, the characteristic peaks of FM in the pork matrix are 731, 1 085 and 1 376 cm-1. Choose 731 cm-1 as the qualitative and quantitative peak, where the Raman intensity and the FM concentration have a good linear relationship within 1~250 mg·L-1, and R2 is 0.99. The actual concentration of the spiked samples was tested, the recovery rate was 89.61%~95.63%, and the RSD was 1.80%~3.30%. The method is simple, fast and stable in operation, and is beneficial to the rapid on-site detection of FM residues in pork.
Oct. 01, 2022Vol. 42 Issue 10 3155 (2022)
Yuan-chao FAN, Xiao-jing CHEN, Guang-zao HUANG, Lei-ming YUAN, Wen SHI, and Xi CHEN
An accurate evaluation of the aging state of wire insulation materials can be used to reduce fire incidences caused by wire insulation aging. In this study, Raman spectrum detection platform, self built aging equipment, accelerated temperature aging and accelerated UV aging tests were applied to evaluate the aging state of 13 kinds of wire insulation materials(polyvinylidene-fluoride,polypropylene,polytetrachloroethylene,nylon,Yada-nylon,polyurethane,latex,perfluoroethylene-propylene-resin,rubber,polyethylene,polyvinyl-chloride). The samples were tested regularly based on temperature aging for 10 time periods. Using 32 hours interval and 15 sample data per aging time, the spectral data of 150 samples of each material (aged) were obtained. Similarly, 13 time periods of UV aging, at a time interval of 16 hours and 15 samples data per aging time, spectral data of 195 UV aging samples were recorded. According to aging period, temperature aging is divided into 10 categories, and UV aging was divided into 13 categories. Linear regression classification and a support vector machine was used to classify the original spectral data. It was found that nylon, polyurethane, Teflon, rubber, etc., have more than 80% accuracy of the two classification algorithms. However, the classification accuracy of some materials was less than 70%. The support vector machine classification of original spectral data consumed a longer time due to alarge number of samples and high spectral dimension. In order to further improve the classification accuracy and speed, the original spectral data were preprocessed by iterative adaptive weighted penalty least square method and five-point cubic smoothing. PCA compression was used to reduce the sample spectral dimension from 2048 to 3.Because the spectral dimension of the reduced sample is less than the number of samples, it can not meet the requirements of linear regression classification.So support vector machine was used for classification. After preprocessing and feature extraction, the classification effect of data was greatly improved, and the classification accuracy of temperature aging and UV aging of all the materials was more than 90%. Furthermore, the classification speed of the support vector machines has also been greatly improved. These results provide a theoretical basis for the effective evaluation of the aging state of wire insulation materials and provide technical support for preventing accidents caused by insulation aging.
Oct. 01, 2022Vol. 42 Issue 10 3161 (2022)
Yilizhati JUMAHONG, Xi-juan TAN, Ting LIANG, and Yi ZHOU
In this work, nine heavy metals (Cr, Co, Ni, Cu, Zn, Zr, Cd, Ba and Pb) and sixteen rare earth elements in waste incineration were determined by ICP-MS combined with a high-pressure closed digestion method. The samples were completely decomposed by a mixture of acid of HF-HNO3-HCl (1:2:1) at 185 ℃ in high-pressure sealed bombs and a digestion time of 12 h. The operating conditions for ICP-MS (such as temperature of spray chamber, nebulizer gas flow rate, auxiliary gas flow rate, cooler gas flow rate and sampling depth) were also optimized. Here, with Rh as the standard internal element, the obtained linear calibration plots of the studied 25 elements showed relative coefficients (r) were higher than 0.999 9, and the corresponding detection limits were within 0.001~1.01 ng·g-1. This proposed method'sdetermination relative standard deviations (RSDs) for waste incineration samples were less than 4.5% (n=3). Results showed that heavy metals of Cr, Cu, Zn, Zr, Cd, Ba and Pb were relatively high in the studied waste incineration samples, with Pb concentrations as high as (1 459±8) mg·kg-1. While the average total REEs was (199±2) mg·kg-1 with a decreasing trend and enrichment of light REEs. The successful application of this high-pressure closed digestion ICP-MS method to heavy metals and REEs quantification in waste incineration samples is of valuable guidance in the subsequent waste disposal, and future metal recycling.
Oct. 01, 2022Vol. 42 Issue 10 3168 (2022)
Rui-qian YE, Hao HE, Peng ZHENG, Meng-xi XU, and Lei WANG
Raman spectroscopy is a promising technique widely used in chemistry, biology, and physics. However, as the key part of the Raman spectrometer, the charge-coupled device is vulnerable to cosmic rays, resulting in a random narrow bandwidth and a high-intensity spikes. It will cause a significant reduction in signal contrast. In this paper, we propose a practical spike removal algorithm. Firstly, the algorithm obtains deviation data by separating the median filtered data from the original data. Then, deviation data is sorted from small to large by quantile method, and the intermediate 99% data are selected for Gaussian distribution fitting. Considering the characteristics of high-intensity and sparsity of the spike, the occurrence probability of high intensity data in the spectra is used as the threshold standard to remove spike. Finally, the spikes are replaced by new data using median filtered at corresponding positions. This algorithm restores the original sample information without any debugging parameters. Different intensities of spikes are added in Raman spectra to verify the algorithm, and the experimental results show that this algorithm's sensitivity can reach 99.5%. Besides, this algorithm is applicable for one-dimensional Raman spectra, two-dimensional Raman images and three-dimensional Raman data cubes, and the performance improves with the increase of dimensionality. Specifically, the one-dimensional spike removal algorithm can detect spikes exceeding 40% of the maximum peak intensity. The Raman data cubes can be detected exceeding 20% of the peak value. The algorithm is used to process 40 000 real Raman spectra and can effectively remove spikes without distorting the real signal, proving the algorithm's practicability.
Oct. 01, 2022Vol. 42 Issue 10 3174 (2022)
Yu HUANG, Xin-ping LI, Na ZHAO, Xiao-li NIU, Dong-xue YIN, and Long QIN
Land use/cover change (LUCC) is one of global environmental change hot issues. The study of land-use changes in the Yiluo River Basin is significant to ecological protection and high-quality development of the Yellow River Basin. Based on long-term LandsatTM satellite remote sensing images, R language string diagram visualization model and linear model redundancy analysis(RDA analysis), this paper analyzed the temporal and spatial change characteristics of land use, land cover flow rate, directionand internal driving factors in the Yiluo River Basin from 1990 to 2020. The results showed: (1) From 1990 to 2020, the land change in the Yiluo River Basin showed a trend of change in forest land firstly decreasing and then increasing, arable land first increasing and then decreasing, construction land increasing as a whole, and water area decreasing as a whole. (2) In terms of quantity Every 10 years from 1990 to 2020, the total amount of change in cultivated land and forest land is the largest, followed by construction land, and the amount of change in water, grassland and unused land are very small. (3) 1990—2000, 2000—2010, 2010—2020 The mutual conversion activity of land use types and the degree of land-use change showed an upward trend, reaching the highest in 2010—2020. (4) From 1990 to 2020, the center of gravity of forest land shifts to the northeast as a whole, and the center of gravity of cultivated land migrates to the south. The change in the center of gravity of forest land and cultivated land is related to the policy of returning farmland to the forest. The construction land is generally centered around the main urban area of Luoyang City, which is related to the direction of social and economic development and urban development; (5) In terms of the driving force, rapid economic development is the main driving force for the change of land use area in the Yiluo River Basin. The promulgation and implementation of the policy of returning farmland to forest is the main reason for the change of forest land and cultivated land area. The results of this study can provide a scientific basis for the ecological protection and sustainable development of the Yellow River Basin.
Oct. 01, 2022Vol. 42 Issue 10 3180 (2022)
Xiao-juan HUANG, Jing YAN, Yang-li-zheng ZHANG, Li-qin WANG, and Wei-hong XU
Multiple methods composed of three-dimensional ultra-depth of field video microscope, laser Raman spectroscopy, X-ray fluorescence spectroscopy, Scanning electron microscopy with energy dispersive spectrometer, and colorimeter were applied to analyse the composition and microstructures of two kinds of Liubo chess pieces with different textures and colors uncovered from the tomb of Warring States period in Shaanxi province. The blue samples were identified as lead-barium glass, and the purple samples were Chinese Purple products. Moreover,a new kind of product of Chinese Purple in the Warring States period was discovered. The composition of lead-barium and the glass products of the samperiod recovered from Shaanxi, Hunan, Hubei, and Sichuan was also compared. It is speculated that the fabrication of lead-barium glass in the Warring States period has matured, and different composition ratios can be carried out according to the needs of the shape of the objects. What's more, glass production also had the phenomenon of remelting old materials to make new ones. Based on determining the composition of Chinese Purple, the colorimeter was used to get spectral data, according to which the characteristic spectral peaks were determined for the artificial copper barium silicate pigment for the first time. It is possible to identify this kind of pigment rapidly and non-destructively.
Oct. 01, 2022Vol. 42 Issue 10 3187 (2022)
Ruo-su WANG, Feng SUN, and Yi-heng XIAN
In order to study the composition and weathering of the ancient artificial silicate bead, the super depth of field microscopy, scanning electron microscopy and energy spectrum(SEM-EDS) and micro-Raman were carried out on a silicate bead unearthed from the M21 graveyard in Ma-Jia-Yuan to obtaining its apparent appearance, elemental composition and phase composition. The results revealed that its main component is Chinese Blue which mixed impurities like BaSO4, PbCO3, Pb5Si4O8(OH)10 and Cu2Pb5(SO4)3(CO3)(OH)6. So the silicate bead appears as light blue particles. It's produced by solid-phase sintering, and the weathering layer is composed of Pb8O5(OH)2Cl4. The article expounds on the technological development of Chinese Blue and the cause of the formation of alkaline lead compounds by weathering. The element analysis of the silicate bead shows that the content of Si is the highest, the content of Cu and Ba is roughly the same, and the content of Pb is lower, which may indicate that the firing of the copper barium silicate bead has begun to control the proportion of raw materials deliberately. Alkaline lead compounds should be formed in the process of burial. The oxides produced in the process of firing silicate beads at high temperatures did not react completely, and then they were buried underground and hydrated with alkaline soil water to form alkaline lead compounds. This article provides references for the research of ancient Faience products and copper barium silicate products and promotes the in-depth study of the history of science and technology in ancient China.
Oct. 01, 2022Vol. 42 Issue 10 3193 (2022)
Lu WANG, Feng SUN, Ruo-su WANG, Ya-xin LIANG, Xue YAO, and Fan ZHAO
Sichuan Qionglai is located in the Chengdu Plain, where the largest scale and most concentrated stone carves were found in Chengdu. Due to the wet and semi-open storage environment, the statues were seriously damaged, and there is a lack of relevant scientific analysis and research. In this paper, 12 paint samples collected from cliff images in Huazhi Temple, Pantuo Temple in Linqiong Town and Stalagmite Mountain in Datong Town in the Qionglai area were used to obtain the paint information through ultra-depth of field microscopic observation, X-ray fluorescence analysis, X-ray diffraction and micro laser Raman spectroscopy analysis. The results show that the red pigments are hematite [Fe2O3] and lead red [Pb3O4]. The green pigment is copper arsenate [Cu(AsO3)(OH)·2H2O] and Euchlorine [KNaCu3O(SO4)3]; The white pigment is gypsum [CaSO4]; The yellow pigment is yellow ochre [Fe2O3]. The black pigment is the change product of red lead [Pb3O4], and the blue pigment is lapis lazuli [Na6Ca2Al6Si6O24(SO4)2]. It is worth noting that the analysis results of green pigments, in which copper arsenate substances are often detected in the analysis of color painting in recent years, and most of them appear in southwest China. It is judged that it is the product of the change of modern and modern synthetic pigment Paris green, and then it is speculated that there is the possibility of modern and modern repainting here. In addition, the green pigment with Euchlorine has been detected for the first time in this paper, which enriches the analysis of examples of ancient coloring pigments, and it is judged that it may be the result of the change of some green copper minerals. Sichuan area humid environment, some unstable mineral pigments are prone to chemical changes, some produce color change, some color change is not obvious, but the composition has produced new substances. In this paper, the color paints in Qionglai caves were analyze to obtain the relevant information about the pigments used in cliff statues in Sichuan, which provided a scientific basis for the pigment restoration. It was also helpful for cultural relic workers to carry out targeted protection work and provided a reference for the research and protection of color painted grottoes in Sichuan.
Oct. 01, 2022Vol. 42 Issue 10 3198 (2022)
Jia-yi TIAN, Fang MA, and Ling-yu HAN
Based on the Attenuated Total internal Reflectance Fourier Transform Infrared spectroscopy (ATR-FTIR) to study the main differencesof chemical constituents in water extraction of fresh Radix Rehmanniae (RR), a decoction of crude RR and processed RR. In addition, ion chromatography was used to analyze the different components quantitatively. This study aims to reveal the whole composition and variation of fresh RR and its processed products. In ATR-FTIR, there were differences among the three RR in the region of saccharides. The characteristic peaks of fresh RR were located at 1 140, 1 047 and 1 000 cm-1, raw RR were 1 140 and 1 045 cm-1, and processed RR were 1 142 and 1 029 cm-1. Moreover, the peak shapes of the three kinds of RR were quite different. Meanwhile, the second derivative infrared spectra (SDIR) showed that the characteristic peaks of saccharides in the range of 1 200~600 cm-1 changed most significantly during the processing of RR. The positions of characteristic peaks of three kinds of RR extracts were similar, but the relative peak intensities were different, and they changed regularly with the processing process. It can be inferred that during the processing of fresh RR, the polysaccharides in fresh RR hydrolyzed into oligosaccharides or monosaccharides. Furtherly, 8 monosaccharides and oligosaccharides were analysed quantitatively using ion chromatography with good linear relationship (R2≥0.999 0). The results indicated that the contents of glucose, melibiose, galactose, mannose, manninotriose, stachyose and acteoside were different in the extracts of the fresh RR, crude RR and processed RR (p<0.05). The content of stachyose and fructose was the highest in fresh RR and raw RR, respectively. The other 6 saccharides trend to increase in processing, presumingthat the stachyose in fresh RR might havea multi-channel hydrolytic process. This study explored the regulation of the whole chemical components of fresh RR in the processing process and provided data support for laboratory investigation and the clinical application of fresh RR. Moreover, these data provided a reference for quality control of fresh Chinese herbal medicine and gave new ideas for traditional Chinese medicine processing research.
Oct. 01, 2022Vol. 42 Issue 10 3203 (2022)
Xiong-wei ZHAO, Dong-ming WU, Qin-fen LI, Xu WANG, and Miao CHEN
Dissolved organic matter (DOM) is the most active part of the soil, which is important ecological environment significance. It can provide a basis for soil fertilization management to clarify the impact of different fertilization methods on the chemical properties of DOM. Based on different fertilization methods for four years, this experiment is combined with UV-Visible absorption spectroscopy to explore the changes in dissolved organic matter chemical properties in soil. Four treatments were set up in the experiment: CK (non-fertilization); CF (chemical fertilization); OG (organic fertilization); ST (straw). The results show that, compared with the CK group, the DOC content of OG and ST are 95.97 and 104.89 mg·kg-1, which are 129% and 141% of the CK group. On the contrary, the DOC content of CF is 15.32 mg·kg-1, which is 21% of the CK group. OG significantly increase the content of colored dissolved organic matter (CDOM, represented by α(355)), which is 2.76 times that of the CK group, and there is a change in ST inconspicuous; CF significantly reduces the CDOM content, which was only 0.55 times of the CK group. The application of OG caused redshift phenomenon in the ultraviolet absorption curve of soil, indicating the application of OG can increase the conjugated double bond substances and the degree of humification of the soil DOM; Compared with CK, the characteristic constants SUVA254, SUVA260, and SUVA280 of DOM in OG were increased, revealing that the application of organic fertilization could improve the aromaticity, hydrophobic components and humification degree of DOM, the increase in straw treatment was not obvious, but the application of CF showed a significant decrease; The absorbance ratio A250/A354 was significantly increased compared to CK and CF, indicating that the application of chemical fertilization reduced the DOM molecule, but OG and ST treatments did not change significantly; the application of straw resulted in a significant increase in A465/A665, indicating that straw could effectively increase the content of protein and carbonhydrate in DOM; A300/A400 was greater than 3.5 under the application of OG and ST, and it showed this main soil DOM was rich in fulvic acid, while under the application of CF, A300/A400 was significantly lower than 3.5, showing that the main soil DOM was humic acid. Application of CF showed SR>1, SR<1 of CK, OG, and ST which also showed that organic fertilizer and straw could increase molecular weight. In summary, the organic fertilization and straw can effectively increase the soil DOM content and improve soil fertility; especially the application of OG, can increase the conjugated substances, humification degree, hydrophobic ratio, aromaticity and molecular weight of soil DOM. On the contrary, long-term application of CF cause the fertility of the cultivated layer reduced.
Oct. 01, 2022Vol. 42 Issue 10 3210 (2022)
Acquiring the plant nitrogen content (PNC) information of crops quickly and accurately is the key to agricultural meticulous management and a research hotspot in the development of digital agriculture. In recent years, with the development of UAV and sensor technology, the use of various sensor information to monitor the physical and chemical parameters of crops has gradually attracted the attention of scholars at home and abroad. This study takes potato as the research object. Firstly, based on the UAV, the hyperspectral images and digital images of the potato budding stage, tuber formation stage, tuber growth stage, starch accumulation stage and maturity stage were obtained. At the same time, the digital camera was used to synchronously obtain the ground digital images of five growth periods, and the three-dimensional spatial coordinates of eleven ground control points (GCPs) and plant height (H), PNC were measured. Secondly, the digital surface model (DSM) of the test area was generated by using UAV digital images combined with GCPs. The accuracy of the extracted VCuav and Hdsm is verified by the calculated coverage (VC) of the digital image and the measured H. Then, the green edge parameters (GEPs) were calculated according to the hyperspectral images, and four fusion feature parameters (FFPs) of GEPs×Hdsm*VCuav, GEPs/(1+VCuav), (GEPs+VCuav)×Hdsm and GEPs/(1+Hdsm) were constructed, fusion of hyperspectral image information and digital image information. Finally, the correlation between GEPs extracted and FFPs constructed in each growth period with PNC were analyzed, and the PNC linear estimation models of five growth periods were constructed based on the optimal GEP and optimal FFP respectively. According to the GEPs and FFPs with high correlation, the multiple parameters estimation models of PNC were constructed by using partial least squares (PLSR) and artificial neural network (ANN). The results show that: (1) Hdsm and VCuav extracted from UAV digital images have high accuracy , which can replace the measured H and VC to estimation physical and chemical parameters (2) Compared with GEPs, most of the constructed FFPs have stronger correlation with PNC in the first four growth stages, and could better reflect the nitrogen nutrition status of potato. (3) Linear estimation models of potato PNC were constructed based on the optimal green edge parameter (OGEP) and the optimal fusion feature parameter (OFFP), respectively. The results showed that the effect of OFFP in estimating PNC was better than that of OGEP. (4) Compared with the single-parameter model, the accuracy and stability of the model constructed by using PLSR and ANN based on GEPs and FFPs are significantly improved. Among them, the models constructed with FFPs as the model factor have the best effect. (5) The ANN method is better than the PLSR method in estimating PNC in each growth period. Therefore, the fusion of the hyperspectral green edge parameters and the plant height and coverage information extracted by the high-definition digital camera sensor can improve the estimation accuracy of PNC, which provide a reference for the non-destructive dynamic monitoring of potato nitrogen nutrition status and the application of multi-source sensors information.
Oct. 01, 2022Vol. 42 Issue 10 3217 (2022)
Rong-hua GAO, Lu FENG, Yue ZHANG, Ji-dong YUAN, Hua-rui WU, and Jing-qiu GU
Automatic early detection of plant diseases is essential for precision crop protection. This paper proposes an early diagnosis and detection method for tomato gray mold based on multi-dimensional spectral series (MDSS) and weighted random forest (WRF) algorithm. The aim was to establish a crop disease detection model by utilizing the overall trend of the spectral curve among multiple observation dimensions of the target leaves to realize the diagnosis before the leaf spot is visible. Generally, the third day after healthy leaves were inoculated with the Botrytis cinerea was treated as the first day that was successfully infected. Therefore, hyperspectral images were recorded from both healthy and infected leaves for 7 days after infection respectively. Then extracted, the region of interest and calculated the average spectrum to form the original spectral samples, whilst (156×7) groups were obtained in total after selection. The group samples were split into multi-dimensional spectral series with 1~7 dimensions per the course of the disease to make up multi-dimensional original spectral series. In order to increase the difference between dimensions, the adjacent original spectral series were subtracted to generate multi-dimensional related spectral series. Afterwards, two symbolic methods, symbolic aggregate approximation (SAX) and symbolic Fourier approximation (SFA), were employed to discretize each spectral series into local discriminant features. Finally, a weighted random forest classification model (MDSS-SAX-SFA-WRF) based on the local discriminant features of multi-dimensional spectral series is established to realize early disease detection. Accordingly, the model based on single-dimensional spectral series (SDSS) is also built as the benchmark to compare with the MDSS-SAX-SFA-WRF model. The experiment results indicate that the MDSS-SAX-SFA-WRF detection model achieves detection accuracies of more than 90% in 56 testing samples containing 2 to 7 spectral series dimensions, and the highest accuracy up to 99% reached in the 5-dimensional sample data, which is 8.2 percentage higher than that of SDSS-SAX-SFA-MRF detection model on the 5th day of infection. Different from the SDSS-SAX-SFA-MRF model detection performance dropped significantly to the lowest 84% in the 5th~7th days of infection due to random interference. While the discrimination accuracy of the MDSS-SAX-SFA-WRF model still retained a high level of more than 98% in the visible stage of infection without excessive decline. Therefore, the classification model based on the overall change trend of the multi-dimensional spectral curve and weighted random forest (MDSS-SAX-SFA-WRF) proposed in this paper can effectively realize the early detection of tomato gray mold with the strong robustness, which provides a new idea for the early differentiation of crop disease.
Oct. 01, 2022Vol. 42 Issue 10 3226 (2022)
En-jun KUANG, Feng-qin CHI, Jiu-ming ZHANG, Ming-gang XU, Colinet Gilles, Qing-rui SU, Xiao-yu HAO, Bao-guo ZHU, and [in Chinese]
Taking black soil as the research object, the difference in the three-dimensional fluorescence spectrum of soil dissolved organic carbon (DOC) after returning maize straw to the field at different soil depths (0~2, 3~10, 11~20, 21~30 and 31~40 cm) were analyzed. The change characteristics of humification degree of maize straw return to deep soil were discussed. The results showed that straw return could increase the content of soil DOC. The characteristics of three-dimensional fluorescence spectra showed that there were two kinds of fluorescence components of soil DOC. CK~T4 treatments were humus like components (Ex/Em=250~275/455 nm) and tryptophan like components (Ex/Em=225~237/340~350 nm), while T5 treatment was humus-like components (250~275/455 nm) and tyrosine like components (Ex/Em =225/304 nm), there were small authigenic components at a depth of 31~40 cm, and the humification coefficient was the highest. The fluorescence intensity of soil DOC component C1 increased with the deepening of straw returning depth, while the C2 component showed a fluctuating state, and the fluorescence intensity increased first and then decreased. Soil DOC was affected by both endogenous and exogenous sources (FI>1.4, 0.6<BIX<0.8), showing a state of weak humification (HIX<1.0), and the FI values of each treatment were between 1.4 and 1.6, indicating that the main source of DOC in soil was the microbial decomposition of straw after returning to the field. The FI value of each treatment was slightly higher at a depth of 21~30 cm. Correlation analysis showed that the effects of soil depth, straw return, and their interaction on DOC and its components were very significant. With the help of indigenous microorganisms in the soil, soil DOC improves and speeds up the transformation of soil humus. Straw returning can store more carbon, improve the quality of soil available carbon pool, and maintain the balance of soil organic carbon.
Oct. 01, 2022Vol. 42 Issue 10 3243 (2022)
Hua HUANG, Meng-di NAN, Zheng-hao LI, Qiu-ying CHEN, Ting-jie LI, and Jun-xian GUO
Apple's origin traceability has important application value and practical significance. To explore new ways to trace apple's origin, taking 671 Samples of Red Fuji apples from Aksu of Xinjiang Province, Yantai of Shandong Province and Luochuan of Shanxi Province as the research objects. The near-infrared transmission spectra of the samples at 590~1 250 nm are collected respectively, and then the techniques of Fractional Differential (FD) and Principal Component Analysis (PCA)-Spectral Regression Discriminant Analysis (SRDA) are used to fuse multiple models. An integrated learning model of the red Fuji apple's origin traceability is constructed. Firstly, spectral data after spectral correction are divided into a training set and test set, and the fractional-order differential technique is used to preprocess the spectrum of the training set to obtain fractional-order differential spectra of different orders (order 0~2 and step size 0.1 in this paper). A new training set is constructed based on the prediction results of the base learner, built by combining different orders of fractional differential spectra and the PCA-SRDA algorithm, and the final classification prediction model is obtained by fusing the decision tree algorithm. Then, the corresponding order fractional differential is used to preprocess the spectrum of the test set, and the corresponding prediction results are obtained based on the established base learner. Finally, the results are formed into a new test set, and the final prediction results are output based on the established classification prediction model. The sample-set is randomly divided according to the ratio of 7:3, and the experiment is repeated 200 times. The results show that the multi-model fusion and integration learning model combined with the fractional-order differential preprocessing, Linear Discriminant Analysis (LDA), SRDA, PCA-LDA and PCA-SRDA algorithms has a good Discriminant effect and strong robustness. Among them, The FD-PCA-SRDA multi-model fusion and integration learning model is the best, and the average accuracy and standard deviation of the training set are 97.33% and 0.49%, and the average accuracy and standard deviation of the test set are 94.84% and 1.48%, respectively. Therefore, the fractal-order differential technique and PCA-SRDA algorithm combined with the near-infrared transmission spectrum can successfully and effectively realize apple's origin traceability.
Oct. 01, 2022Vol. 42 Issue 10 3249 (2022)
Tea is one of the most popular beverages globally, which is greatly affected by the content of nitrogen (N) in quality. Due to the complicated and time-consuming method for determining N content in fresh tea leaves by traditional chemical analysis, this paper proposes a means for N content prediction by hyperspectral technique. The wavelet coefficients extracted by continuous wavelet transform (CWT) technology are used to estimate N content by different decomposition layers of CWT. Moreover, the predictive effects of models built by different wavelength selection algorithms are also discussed. Several 151 hyperspectral data of tea samples were collected from tea gardens in the Yingde City of Guangdong Province. The original spectra data are preprocessed by smoothing (SG), detrending (Detrending), first derivative (1st), multiple scattering correction (MSC), and standard normal variable transformation (SNV) while comparing with CWT. Then, continuous wavelet multi-scale analysis is applied to process the original spectrum for generating wavelet coefficients, and Pearson correlation analysis was also performed. Next, three kinds of methods, including successive projections algorithm (SPA), competitive adaptive weighted sampling (CARS) and variable combination population analysis (VCPA), are adopted to optimize the variable space of the spectral data after CWT transformation. At last, quantitative models of N content prediction are established and compared by PLSR with characteristic variables selected by the three above mentioned methods as input. The overall results show that the continuous wavelet analysis algorithm can improve the model's efficiency for estimating the N content of the fresh tea leaves by hyperspectral data. Furthermore, it has better performance than other conventional spectral preprocessing methods significantly. With continuous wavelet decomposition, the precision of the model for N content prediction gradually decreases with the increase of the decomposition scale.There is a good correlation between the spectrum after the continuous wavelet transforms on the scale of 1~6 and the N in fresh tea leaves,which shows that the small-scale continuous wavelet algorithm can be well applied to monitor N content in fresh tea leaves. The model established by CWT (1scale)-VCPA method has the best performance, andthe number of variables is reduced by 99.34% compared to the full band. The R2 of the calibration model and prediction model respectively, are 0.95 and 0.90. Compared with the traditional spectral processing method, the accuracy is improved by 11%. It is proved that the combination of CWT-VCPA can obviously reduce the spectral dimension and improve the accuracy of the model. This research achieves an efficient way for N content prediction of tea, which provides a technical basis and reliable reference for other components evaluation of tea.
Oct. 01, 2022Vol. 42 Issue 10 3253 (2022)
Bing WU, Ke-ming YANG, Wei GAO, Yan-ru LI, Qian-qian HAN, and Jian-hong ZHANG
Heavy metal pollution of agricultural products has attracted much attention along with the improved human quality of life. The heavy metal elements in crops will harm human health through the food chain, and different heavy metal elements have a large difference in toxicity to the human body. Therefore, it is crucial to distinguish the types of heavy metal elements in crops. There are many shortcomings in the traditional methods of detecting heavy metals such as many links, long time, and high cost. However, hyperspectral remote sensing technology has the advantages of abundant information usage, strong physical and chemical inversion capabilities, fast analysis speed, non-destructive monitoring and so on. It has gradually become one of the important methods for analysing heavy metal pollution in crops.Taking the leaf spectra of a typical corn crop growing under soil stressed by different CuSO4·5H2O and Pb(NO3)2 concentration gradients as the research object, the copper (Cu) and lead (Pb) identification index (CLI) was builtbased on spectral processing results of continuum removal (CR), spectral ratio (SR)and fractional-order derivative (FOD) combining with modified red edge simple ratio index (MSR). Then the Cu and Pb element discrimination feature points (CLDFP) were established by selecting the three CLI values of fractional differential orders that have the strongest correlation with the types of Cu and Pb elements. And then, the Cu and Pb elements discriminant rule line (CLDRL) under the two-dimensional coordinate system (2D) and the discriminant rule plane (CLDRP) under the three-dimensional coordinate system (3D) were structured to identify the types of Cu and Pb elements. Based on the Euclidean cluster (EC)- the perpendicular bisector (PB) by using the EC to divide the training samples into two sets of Cu pollution and Pb pollution and combining with the PB to connect the circle enters the sets so that the types could be accurately identified on the heavy metal Cu and Pb elements in the spectral information of corn leaves. The results showed that the correlation between the spectral information of corn leaves and the types of Cu and Pb elements was enhanced because of the CR-SR-FOD spectral transformation processing. The correlation coefficients of the CLI corresponding to each order of FOD and the types of Cu and Pb elements were different. With the increase of orders, the correlation showed a trend of increasing first and then decreasing. Among them, the three values of orders of the highest correlation coefficients were 1.2, 0.7, and 1.0 respectively. The accuracy rate of the training set samples was 78.95% andthe accuracy rate of the verification set samples was 75.0% when discriminated under the 2D, and the accuracy rate of the training set samples was 76.32% and the accuracy rate of the verification set samples was 75.0% when discriminated under the 3D, it is proved that the spectral discriminant rulesof 2D CLDRL and 3D CLDRP based on EC-PB could effectively identify the types of Cu and Pb pollution elements when they polluted the corn leaves.
Oct. 01, 2022Vol. 42 Issue 10 3256 (2022)
Zi-zhao LI, Shou-dong BI, Yu-huan CUI, and Shuang HAO
Remote sensing monitoring of forest resources is one of the important application directions of remote sensing. Traditional measurement methods cost a lot of workforce and material resources. Scientific forest resource prediction can improve work efficiency and reduce measurement costs. Forest stock volume is an important index to evaluate the quality of forest ecosystems. The forest stock volume inversion model is a mathematical model used to estimate the forest stock volume, which has the functions of learning and prediction. The same ground features are quite different in different light or shadow areas. The band ratio can be used to reduce the error of the results in modeling light and shadow areas to a certain extent. The forest stock volume prediction model usually selects spectral information and texture features as the main modeling factors. It does not fully consider the impact of different models on the prediction accuracy when selecting multi-characteristic variables such as band ratio, vegetation index, and topographic factors. In order to compare the accuracy of different models, this article takes Milin County in Tibet Autonomous Region as the research area, and uses Landsat OLI images, DEM data and forest resource survey data as data sources to extract analyze spectral information, texture features and topographic factors. Three forest volume inversion models based on multi-features are established. The three models are multiple stepwise regression models, BP neural network models and random forest models. The effects of different methods on the inversion of forest stock are studied. The coefficient of determination (R2), mean absolute error (MAE), and root mean square error (RMSE) are used to evaluate the fit and accuracy of the model. The results showed that the fit and accuracy of the random forest model are the best (R2=0.739, MAE=55.352 m3·ha-1, RMSE=63.195 m3·ha-1). The result is higher than the multiple stepwise regression model (R2=0.541, MAE=58.317 m3·ha-1, RMSE=71.562 m3·ha-1) and BP neural network model (R2=0.477, MAE=67.503 m3·ha-1, RMSE=73.226 m3·ha-1). The predicted value range of the model is 121.3~372.8 m3·ha-1 and it is relatively close to the actual value. The results showed that the inversion of forest stock volume based on multi-features is effective in practical applications, and different models have different effects on the inversion accuracy of forest stock volume. The random forest regression model has the highest accuracy in this inversion study of forest stock volume, and it can be better applied to remote sensing monitoring of forest resources. This study can provide a reference for selecting forest stock volume inversion methods and help continuously improve the forest resource remote sensing monitoring system.
Oct. 01, 2022Vol. 42 Issue 10 3263 (2022)
Xin YANG, Zi-ran YUAN, Yin YE, Dao-zhong WANG, Ke-ke HUA, and Zhi-bin GUO
Nitrogen is one of the necessary nutrient elements for crops' growth and development, and crops' total nitrogen content is the main index to characterize its nitrogen status. Monitoring the spatial distribution of winter wheat total nitrogen content at the field scale can assist in accurate and quantitative topdressing and reduce environmental pollution. UAV (Unmanned aerial vehicle) hyperspectral data can provide an important data source for crop growth information inversion due to its high resolution, high timeliness and low cost. XGBoost (Extreme Gradient Boosting), a new ensemble learning algorithm with high efficiency and strong generalization ability, can be effectively applied to build a winter wheat total nitrogen content estimation model based on remote sensing data and predict the spatial distribution of winter wheat total nitrogen content at field scale. Therefore, this study selected the winter wheat at the jointing stage in the national soil quality observation and experimental station as the study object and carried out the following work: (1) we obtained the canopy imaging spectral image of winter wheat at the jointing stage with a hyperspectral imager mounted on a low-altitude UAV, and total nitrogen content data of 126 samples combined with ground sampling data. (2) The spectral characteristics of the winter wheat canopy at the jointing stage were analyzed, and the correlation between spectral reflectance of 176 bands and total nitrogen content was analyzed according to the Person correlation coefficient. (3) A winter wheat total nitrogen content estimation model based on UAV hyperspectral at the jointing stage was built with the XGBoost algorithm under different soil fertility conditions. The results showed that: (1) there was a strong correlation between spectral reflectance and total nitrogen content of winter wheat in 176 bands, and the correlation coefficients between spectral reflectance and total nitrogen content in all bands except 735.5 nm were greater than 0.5; (2) The UAV hyperspectral remote sensing estimation model of winter wheat total nitrogen content at jointing stage based on XGBoost algorithm shows high accuracy (R2=0.76, RMSE=2.68); (3) The estimation model of winter wheat total nitrogen content based on XGBoost algorithm can obtain the spatial distribution map of total nitrogen content at field scale under different soil fertility conditions, which shows a significant spatial difference on the whole. This study can provide a scientific basis for the accurate and quantitative topdressing of winter wheat and also provide a reference for the application of UAV hyperspectral remote sensing in precision agriculture.
Oct. 01, 2022Vol. 42 Issue 10 3269 (2022)
Yang-ping WANG, Shu-mei HAN, Jing-yu YANG, Jian-wu DANG, and Zhan-ping ZHANG
In recent years, the rapid development of high-resolution remote sensing technology has provided an effective technical means for detecting ground objects along the railway. The regression-based one-stage target detection method YOLOv4 has the advantages of high detection accuracy and fast speed. However, when it is used for remote sensing image detection, small targets are still missed due to the loss of some detailed feature information, and large-area ground object detection. Due to the problem of low efficiency, this paper improves the YOLOv4 network model to detect ground objects along the railway in remote sensing images. This paper improves the YOLOv4 network model to detect the ground features in remote sensing images along the railway. First, the CBM (Convolution Batch Normalization Mish) module is designed with composing of convolution, batch normalization, and Mish activation, and the DCBM (Double CBM) module is used for the transmission layer of the densely connected network (DenseNet) for the YOLOv4 network feature extraction. It can achieve feature transfer and information reuse and enhance small target feature detection capabilities. Then, to address the defects of YOLOv4 in the inefficiency of large area detection and the large space of model parameters, the SE (Squeeze Excitation) channel attention mechanism is used after each residual cell of Cross Stage Partial (CSP) in the backbone network to reduce the number of repeated calls of the SE attention module. Hence the performance of the network is improved while reducing the number of model parameters and improving detection efficiency. Finally, for the problem of difficult extraction of railroad targets in images, an improved channel space attention mechanism ICBAM (Improved Convolutional Block Attention Module) is introduced before the network result output to retain the original feature information. It can solve the problem of poor feature extraction ability of railroad targets, and improve the detection efficiency of large-scale targets. To verify the effectiveness of the proposed method, 1 676 remote sensing image samples are selected along a particular section of the railway with a resolution of 1 920×1 080. Railways, houses, buildings, farmland, and ponds in the data set are selected as targets for inspection, and some current popular target detection methods are compared. The experimental results show that the improved method enhances the detection ability of small targets, improves the accuracy and speed of detection, and improves the detection efficiency of large-scale targets. Compared with the YOLOv4 algorithm, the improved method mAP has increased by 2.11%, accuracy increased by 2.93%, the recall rate has increased by 3.79%, and the model size is reduced by 8.53%. The proposed method also provides an effective method for rapidly and accurately detecting ground objects in remote sensing images along the high-speed railway.
Oct. 01, 2022Vol. 42 Issue 10 3275 (2022)
Hyperspectral images are characterized by continuous bands, high dimensionality, large data volume and strong correlation between adjacent bands, which can provide richer detailed information for feature classification. However, there is a lot of redundant information and noise in data, and the direct use of all band features without effective analysis and selection in image classification will lead to low computational efficiency and high computational complexity, and the “Hughes phenomenon” that the classification accuracy may increase and then decrease with the increase of band dimension. In order to quickly extract a subset of features with good recognition ability from hyperspectral images with tens or even hundreds of bands to avoid the “dimensional disaster”. This paper combines the filtered ReliefF algorithm and the wrapped recursive feature elimination algorithm (Recursive feature elimination, RFE) to build the ReliefF-RFE feature selection algorithm, which can be used for feature selection in hyperspectral image classification. The algorithm uses the ReliefF algorithm to quickly eliminate many irrelevant features based on weight thresholds to narrow and optimize the range of feature subsets. The RFE algorithm is used to further search for the optimal feature subsets, and the recursive elimination of the less relevant features and redundant to the classifier in the narrowed feature subsets is performed to obtain the feature subsets with the best classification performance. In this paper, three standard datasets, including the Indian pines dataset, Salinas-A dataset and KSC dataset, are used as experimental data to compare the application effect of the ReliefF-RFE algorithm with ReliefF and RFE algorithms. The results show that the hyperspectral image classification by applying the ReliefF-RFE algorithm has an average overall accuracy (OA) of 92.94%, F-measure of 92.81%, and Kappa coefficient of 91.94%; in the three datasets, the average feature dimension of ReliefF-RFE algorithm is 37% of that of ReliefF algorithm, while the average operation time is 75% of that of the RFE algorithm. It shows that the ReliefF-RFE algorithm can ensure the classification accuracy while overcoming the defects of the filtered ReliefF algorithm, which cannot effectively reduce the redundancy among features and the wrapped RFE algorithm, which has high time complexity and has a more balanced comprehensive performance, which is suitable for feature selection in hyperspectral image classification.
Oct. 01, 2022Vol. 42 Issue 10 3283 (2022)
Fu ZHANG, Xin-yue WANG, Xia-hua CUI, Wei-hua CAO, Xiao-dong ZHANG, and Ya-kun ZHANG
Qianxi tomatoes are rich in nutrition, tasting sweet, sour and delicious, different varieties of qianxi tomato's flavor and nutritional value is obviously different, especially lycopene, citric acid, vitamin C and amino acid content varies greatly and the traditional artificial classification method of low efficiency, strong subjectivity, high rate of error detection and other issues are pressing to be solved. Therefore, in order to screen the high comprehensive nutritional value and good flavor of the qianxi tomatoes to achieve the rapid and accurate classification of the qianxi tomatoes, a classification model based on qianxi tomatoes spectral features and a GWO optimized SVM algorithm was proposed to solve the problem of automated qianxi tomatoes classification. In this study, a total of 240 qianxi tomatoes of four varieties were taken as the research objects, divided into 160 training sets and 80 test sets according to the ratio of 2:1. The qianxi tomatoes fruit reflective intensity in the range of 350 to 1 000 nm was obtained by using a visible/near-infrared spectral acquisition system, and the sample reflectance by spectrally corrected was obtained and analyzed. The effective information of the qianxi tomatoes spectrum in the range of 481.15 to 800.03 nm was intercepted to enhance the signal-to-noise ratio. Since the modeling effect is affected by the interference of irrelevant information in the data acquisition process, Savitzky-Golay (SG) smoothing pretreatment was performed with the smoothing point to 3. After SG smoothing pretreatment, the characteristic wavelength variables are extracted by successive projections algorithm (SPA), the reflectance of the optimal selected 11 characteristic wavelength variables as the input matrix X, preset sample variables 1, 2, 3, and 4 as output matrix Y, the SPA-SVM qualitative classification model of qianxi tomatoes was established. The average classification accuracy of the training set is 59.38%, the test set is 48.75%. On this basis, the gray wolf optimization (GWO) algorithm was introduced to train 160 samples training set, seeking the optimal penalty coefficient (c) and the nuclear function parameter (g) of the SVM. Based on the training results of the model, the classification results of 80 test set samples were predicted to establish the SPA-GWO-SVM qualitative classification model of qianxi tomatoes and the average classification accuracy of the training set is 100%, the test set is 81.25%. The research results show that the performance of the support vector machine model optimized by the grey wolf algorithm has been improved significantly. The average classification accuracy of the training set is improved by 40.62%, and the average classification accuracy of the test set is improved by 32.50%, which shows that the gray wolf optimization algorithm can be used to improve the performance of the support vector machine classification model and realize the classification of qianxi tomatoes. This study provides a new idea and method for the rapid and accurate classification of qianxi tomatoes and other fruits and vegetables.
Oct. 01, 2022Vol. 42 Issue 10 3291 (2022)
Yang ZHANG, Jun YUE, Shi-xiang JIA, Zhen-bo LI, and Guo-rui SHENG
At present, Convolutional Neural Network (CNN) has made a breakthrough in species recognition. As an important part of the agricultural economy, shellfish has a wide variety of species with complex characteristics. Some of the shellfish are highly similar and the distribution of various samples is unbalanced, which causes a low accuracy of CNN classification. In view of this situation, a shellfish recognition method based on visible spectrum and CNN is proposed in this paper, which aims to extract more effective shellfish features to improve the classification accuracy of shellfish. Firstly, a filter information measurement and feature selection method including output entropy measurement and orthogonality measurement is proposed, which reinitializes the pruned filter and makes it orthogonality, captures different directions in the network activation space, so that the neural network model can learn more useful shellfish feature information and improve the classification accuracy of the model; secondly, a shellfish classification objective function including regularization term and focal loss term is proposed, which reduces the weight of easily classified samples by controlling the shared weight of each sample to the total loss, it tilts the attention of the model to the samples with inaccurate prediction, so as to balance the distribution of samples and the difficulty of sample classification, and improve the accuracy of shellfish classification. The shellfish image dataset in this paper consists of 74 shellfish species with 11 803 pictures in total. After obtaining the original dataset, data augmentation which consists of horizontal flipping, vertical flipping, random rotation, rotation within the range of [0, 30°], scaling and moving within the range of [0, 20%] and moving is performed on the images of the dataset, increasing the number of images from 11 803 to 119 964. The whole image dataset is randomly divided into training set with 95 947 pictures, validation set with 11 996 pictures and test set with 12 021 pictures in an 8:1:1 ratio. In this paper, based on the establishment of the shellfish image dataset, the experimental verification has reached the classification accuracy of 93.38%, which increases the accuracy of the benchmark network (Resnest) by 1.18%. Compared with SN_Net, and MutualNet, the accuracy of the proposed method is increased by 4.34% and 0.85%, respectively. And the training time is 22 320 seconds, which shortens the training time of the benchmark network (Resnest) by 960 seconds, the training time of the proposed method is 3 180 seconds and 2 460 seconds shorter than SN_Net and MutualNet, respectively. The experiments results demonstrate the effectiveness of the proposed method.
Oct. 01, 2022Vol. 42 Issue 10 3298 (2022)
Yun-you HU, Liang XU, Han-yang XU, Xian-chun SHEN, Yong-feng SUN, Huan-yao XU, Ya-song DENG, Jian-guo LIU, and Wen-qing LIU
The infrared hyperspectral image data collected by the passive Fourier transform infrared (FTIR) scanning remote sensing imaging system has spatial and spectral information and can be used to identify, quantify and visualize toxic and harmful gases in the atmospheric environment. The system has high spectral resolution and non-contact and long-distance detection advantages. However, the single-frame image has a small number of pixels, and some have gas absorption or emission, which cannot be directly used for target detection in infrared hyperspectral images.This paper proposes an adaptive matched filter (AMF) detection method for leaking gas based on multi-frame infrared hyperspectral image data in the same area in a short time. The background spectra without target gas feature are screened out and used for maximum likelihood estimation of the background in the detection area and then applied to target gas leak detection in subsequent frames. The infrared hyperspectral image collected by the remote sensing experiment of SF6 has four frames (120 pixels/frame) scanned in total. The data containing the target gas feature in the first three frames are removed, and the remaining background spectrum is used to calculate the maximum likelihood estimation of the background. The AMF detection of SF6 is implemented on the fourth frame of infrared hyperspectral data pixel by pixel, and the result is compared with the SF6 column concentration image retrieved by the nonlinear least square method. To verify the performance of multi-frame background in different detection spaces, adaptive subspace detection (ASD) based on orthogonal subspace, adaptive cosine detection (ACE) based on hybrid space, and maximum likelihood ratio detection based on oblique subspace (OGLRT) detects the fourth frame data separately. Compared with the SF6 column concentration image, the results show that the multi-frame background is suitable for detection methods in different spaces. In addition, to study the influence of the target absorption spectrum on the background space. Adding multiple spectra containing the absorption of SF6 to the background space after ROC curve inspection, the results show that mixing target features in the background space will reduce the detection performance of the AMF method.The false color image of AMF detection value can also be applied to a passive FTIR scanning remote sensing imaging system. The leakage source and diffusion tendency are more obvious than the column density false color image. The detection method based on hyperspectral data relies on the statistical feature of the overall background. Compared with the inversion algorithm of a single-pixel spectral band, it greatly reduces the dependence of the background.The AMF leak gas detection method based on the multi-frame background can be well applied to the passive FTIR scanning remote sensing imaging system and meet the requirements of online monitoring.
Oct. 01, 2022Vol. 42 Issue 10 3307 (2022)
Hong-mei REN, Ang LI, Zhao-kun HU, Pin-hua XIE, Jin XU, Ye-yuan HUANG, Xiao-mei LI, Hong-yan ZHONG, Hai-rong ZHANG, Xin TIAN, Bo REN, Jiang-yi ZHENG, Shuai WANG, and Wen-xuan CHAI
The absorption of atmospheric water vapor gradually weakens from the microwave to the visible band, but the absorption in the ultraviolet band has been ignored. Multi-AXis Differential Optical Absorption Spectroscopy (MAX-DOAS) is a passive optical remote sensing technology that can simultaneously retrieve a variety of trace gases such as NO2, SO2, HCHO, HONO and water vapor. It is often used for regional atmospheric three-dimensional distribution and transportation monitoring, and has the characteristics of low cost, high time resolution stability, and real-time monitoring. Water vapor is an important greenhouse gas, and the water vapor absorption in the ultraviolet band is often not considered when we retrieve trace gases, which may affect the retrieval of trace gases in the ultraviolet band, resulting in systematic errors. This study introduced the atmospheric water vapor retrieval in the ultraviolet band using MAX-DOAS observations in Qianxian, Xi'an, from June 1 to September 24, 2020. The optimal retrieval band in ultraviolet and visible were selected andcompared. The comparison results confirmed the water vapor absorption in the ultraviolet band, and we also evaluated the influence of ultraviolet water vapor absorption on the retrieval of trace gases in the same band. First, the optimal retrieval bands for water vapor in the ultraviolet (351~370 nm) and visible blue bands (434~455 nm) were selected according to the root mean square (RMS) and the absorption cross-sections of H2O and O4. Secondly, the O4 and H2O DSCD in the ultraviolet and visible blue bands were obtained by DOAS fitting, and the correlation between the two bands was analyzed. The two bands' correlation coefficient of O4 and H2O DSCD in the two bands were 0.85 and 0.80. The ratio of O4 and H2O DSCD in the same band has also been analyzed, and the correlation coefficient in the two bands was 0.89. The high correlation coefficients of H2O DSCD and the ratio of H2O DSCD/O4DSCD in the ultraviolet and visible blue bands indicate that even Xi'an, which has a lower water vapor concentration relative to coastal cities, also has water vapor absorption in the ultraviolet band near 363 nm. It will affect the retrieval of other trace gases in the ultraviolet band using DOAS technology. Finally, the retrieval errors of gases (O4, HONO, and HCHO) that may be affected by water vapor absorption in the ultraviolet band were evaluated. The water vapor absorption in the ultraviolet band will increase O4DSCD, HONO DSCD, and HCHO DSCD during the fitting process, corresponding to the changes of +1.16%, +8.55%, and +9.04%, respectively.
Oct. 01, 2022Vol. 42 Issue 10 3314 (2022)
© Copyright 2018-2021 | Chinese Laser Press.
All Rights Reserved 沪ICP备15018463号-20