


 View fulltext
Guang-lie HONG, Xin-dong LIANG, Hao LIU, Hua-ping ZHANG, and Rong SHU
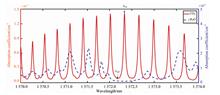
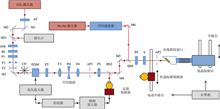
As one of the most important greenhouse gases, CO2 has attracted much attention for its change and distribution. The differential absorption laser radar (DIAL) system is an effective means to detect the concentration of CO2, which is of great significance for studying the source and sink of greenhouse gas. This paper mainly studies the detection of CO2 average concentration by sinusoidal modulated continuous wave (cw) DIAL on the horizontal path. Using the absorption spectrum of CO2 and H2O in HITRAN database, considering the absorption cross section of CO2 and the interference of H2O, the detection wavelength of DIAL is selected as: On-line is 1 572.335 nm and Off-line is 1 572.180 nm; Acousto-optic modulator replaces electro-optic modulator to transmit cw laser and the frequency of the two modulation signals is slightly different. The On-line modulation frequency is 101.833 kHz, and the Off-line modulation frequency is 99.733 kHz. On-line is locked at the frequency of absorption peak of the gas pool at 1 572.335 nm by spectral modulation technology, and the residual amplitude modulation (RAM) of the phase modulator is eliminated by applying DC bias feedback voltage on the phase modulator in the research process. The system achieves a continuous output wavelength RMS error of 0.05 pm at 12 hours. Fast Fourier transform (FFT) is used to acquire the power spectrum of the echo signal and the laser intensity at the monitor in the CPU. The ranging of the target is possible by utilizing the phase difference between the monitored and the received signals; The optical circuit is fiber based, and this makes the system compact and reliable. The field experiment and comparative experiment were carried out to obtain the average concentration of CO2 on the 1.3 km path in Shanghai. The experimental data showed that the system observation accuracy was 4 ppm(ppm is parts per million), and the detected daily variation trend coincides with the in situ CO2 sensors (LI7500A).
Dec. 01, 2020Vol. 40 Issue 12 3653 (2020)
Xiao-yu WANG, Yong-zhao CUI, Wei-hong BI, Guang-wei FU, Si-cheng KE, and Wen-xin WANG
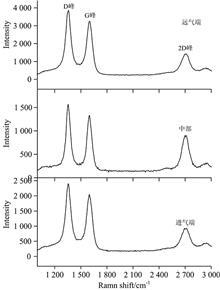
Graphene and photonic crystal fiber have good optical properties, but it is difficult to transfer/coat graphene on the inner holes with small diameter by the wet-transfer method which can be only transferring graphene on the surface or end of the PCF. Therefore, the chemical vapor deposition was used to decompose the carbon source into carbon atoms, allowing it to form nucleation points in the air holes of the optical fiber, and then by controlling the growth conditions, the graphene with different layers can be directly grown on the inner holes of the photonic crystal fiber. By scanning electron microscopy, it can be clearly noticed that the presence of graphene film which was tightly in combination with air holes of the photonic crystal fiber. In addition, all three characteristic peaks of graphene were shown by Raman spectroscopy. By changing the growth conditions such as temperature, growth time, methane gas concentration, it was found that the ratio of D peak to G peak of the graphenein the air holes of the photonic crystal fiber significantly reduced to around 0.5, which can effectively reduce the rate of the defects. The results of the Raman spectra showed that the growth time was the most effective for reducing defects in graphene. When the growth time was 5 h, bilayer graphene was achieved grown. By extending the growth time, the defects in graphene can be continuously reduced. The nucleation points of carbon atoms were influenced by temperature, which speeded up the formation of graphene film, but greater defectswere caused with excessive temperature in graphene, resulting in decreasing of the ratio of D peak to G peak after 1 050 ℃. With increasing of the methane concentration, on the other hand, affected by the diameter of the air hole, the number of graphene layers were increased in fluctuation. This research provides a basis for the subsequent design of devices based on graphene fiber and the applications in optics.
Dec. 01, 2020Vol. 40 Issue 12 3659 (2020)
Yu JU, Hao CHEN, Li HAN, Yang CHANG, and Xue-jian ZHANG
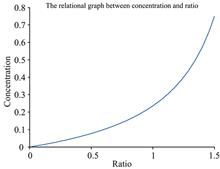
Gas concentration detection has always been a very important task. It is closely related to human life, environmental changes and industrial production, especially the detection of toxic and harmful gases. With the development of spectroscopy, tunable diode laser absorption spectroscopy (TDLAS) has been widely used in industrial production, environmental monitoring, meteorological sounding, etc. TDLAS has the advantages of high sensitivity, fast response, real-time monitoring and excellent portability which makes it become one of the important technologies for gas detection. It is well known that any sensor needs to be calibrated. The result of the calibration is related to the measurement accuracy of the sensor. In this paper, the direct spectral calibration algorithm based on TDLAS technology is studied. The relationship between gas concentration and transmittance logarithm in a large range is deduced and simplified. For fitting calibration 1/c fitting calibration algorithm using the relationship between gas concentration reciprocal and transmittance logarithm reciprocal is proposed. The relationship between gas concentration and transmittance logarithm is reversed by fitting the calibration curve. In the experiment, TLDAS water vapor detection platform was built. The water vapor concentration of the Vaisala HMT377 online humidity detector was used as the standard value. The water vapor concentration of 0.7%~50% was calibrated. The direct fitting algorithm and the 1/c fitting algorithm were compared. The experimental results show that the direct fitting algorithm is used to fit gas concentration to transmittance logarithm curve. The correlation coefficients of the primary function, quadratic function and quintic function are 0.946 8, 0.996 7 and 0.999 9, and the root means square error is 0.031 2, 0.007 8 and 0.001 6, the maximum relative error exceeds 100%. While utilizing the 1/c fitting calibration algorithm, the fitting curve of the relationship between gas concentration reciprocal and transmittance logarithm reciprocal is a linear function, which is consistent with the theory. The correlation coefficient is 0.999 6, and the root means square error is 0.490 1. After inverting the fitting curve, the fitting curve of gas concentration and transmittance logarithm is obtained. The correlation coefficient was 0.999 9, the root mean square error was 0.001 5, and the maximum relative error in the whole concentration range was less than 4%. The results show that the 1/c fitting algorithm is very effective. It improves measurement accuracy and expands the calibration range.
Dec. 01, 2020Vol. 40 Issue 12 3665 (2020)
Hao-yue LIANG, Xue-lian CHENG, Wan-zhu YANG, Wei WEN, Shu-xu DONG, Shi-xuan ZHAO, and Yong-xin RU
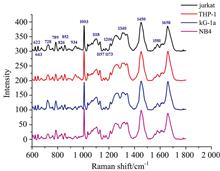
The diagnosis of acute leukemia is based on a series of essays. Cytogenetics and fluorescence in situ hybridization are designed to identify specific genes and chromosomal changes involved in the development of leukemia. Immunophenotypic analysis by flow cytometry and molecular biology is also present. It can be used to check the diagnosis. The invasiveness and timeliness of these tests prompted people to look for new methods and techniques, represented by Raman spectroscopy, to reduce the time interval between hypotheses and diagnostic conclusions, and to help patients achieve good prognosis. Raman spectroscopy can be used to non-label identify spectral information of blood cells and biochemical elements present in the blood, such as amino acids, proteins, lipids, nucleic acids, and carotenoids, and the technique is performed using cell lines, blood smears, and serum samples. The diagnosis of different types of hematological diseases becomes more and more important and has broad application prospects. This experiment investigated the Raman spectral characteristics of human acute T cell leukemia cell line (Jurkat), human acute myeloid leukemia cell line (KG-1α), human acute promyelocytic leukemia cell line (NB4) and human acute monocytic leukemia cell line (THP-1), build a novel Raman label-free method to distinguish four kinds of acute leukemia cells, and provide the basis for clinical experimental research. Raman spectra were obtained using Horiba Xplora Raman spectrometer, and Raman spectra of 25~30 cells from four kinds of acute leukemia cell line were recorded. Spectral analysis methods, including principal component analysis, partial least squares discrimination analysis and cluster analysis were used to build the discrimination model and classify the spectra of leukemia cells. There were differences among Raman spectra of acute leukemia cells, which were distinguished primarily by peaks in 769, 826, 844, 957, 1 048, 1 141, 1 255, 1 313, 1 415, 1 539, 1 575 cm-1, which reflects the active metabolism of Jurkat cells, the nucleic acid-related energy metabolism of KG-1α cells, and the strong cellular respiration of NB4 cells. The identification models built by PLS-DA can accurately distinguish these Raman spectra of different acute leukemia cell lines. The model has good fitting stability, predictive ability and application prospect.
Dec. 01, 2020Vol. 40 Issue 12 3670 (2020)
Hong-bo LIU, Xue-shun SHI, Wen-bin XU, Chang-ming LIU, Hong-yuan LIU, and Heng-fei WANG
Long-wave infrared spectrum (8~14 μm) is important electromagnetic radiation between middle infrared and terahertz wave, corresponding to the spectral radiation band of the target object at room temperature on the earth surface and the “Third Atmospheric Window” of the earth. Compared with short-wave and medium-wave spectral radiation, long-wave infrared radiation is less affected by atmospheric scattering. Therefore, the long-wave infrared photodetector is widely used in infrared spectral imaging, infrared reconnaissance, spectral detection and other fields. So the absolute spectral responsivity, as one of the main parameters to characterize the response ability of detectors, needs to be solved urgently for its high-precision calibration. At present, the traditional calibration method based on the standard radiation source can no longer meet the requirements of high precision absolute spectral responsivity. At present, there is no long-wave infrared absolute spectral responsivity calibration device based on laser source and cryogenic radiometer in China. The main reason is the lack of laser source with stable power, high beam quality, and long-wave infrared standard transfer detector with stable performance. In order to measure the absolute spectral responsivity of detectors with high accuracy, we are reporting a laser-based absolute spectral responsivity calibration device in the long-wave infrared spectral range. The tunable CO2 stable frequency laser was selected as the light source, and the cryogenic radiometer was used as the light power measurement benchmark. CdTe crystal electro-optic modulator is used to construct the laser power stability control system. Based on the beam transmission theory, a long wave infrared spatial filter is constructed to optimize the beam quality. A standard transfer detector with stable and reliable performance was developed by integrating/sphere HgCdTe detector, and a calibration device with high absolute spectral response rate and high accuracy of long-wave infrared detector was established. We measured the HgCdTe/sphere detectors at 9.62 and 10.60 μm, respectively. The experimental results show that the extended uncertainty of optical power measurement was less than 0.30%~0.42%(k=2) by using cryogenic radiometer; The extended uncertainty of the absolute spectral responsivity measurement has been analyzed to be 0.80%~1.02% (k=2), other wavelengths can be referenced for analysis. The work realizes the high accuracy calibration of absolute spectral responsivity of long wave infrared detector based on laser source.
Dec. 01, 2020Vol. 40 Issue 12 3680 (2020)
Yi-jun NA, Ning LI, Xiao-long HUANG, and Chun-sheng WENG
Dec. 01, 2020Vol. 40 Issue 12 3686 (2020)

Tian-yi HAO, Yang HAN, Zi-ping LIU, Zi-ying LI, Yun-sheng ZHAO, Hao-fang NIU, and Hai-yan YAO
According to the current research status, chlorophyll fluorescence is one of the important means of plant physiology research and plant remote sensing research. Previous studies on laser-induced fluorescence (LIF) have mostly used vertical directions, and less consideration has been given to the effects of multi-angle and fluorescence polarization. In this paper, Chlorophytum, Green radish, and Phnom Penh Tiger Piran were used as research objects, and multi-angle and polarization observation methods were used to analyze the laser-induced chlorophyll fluorescence spectra, and the models were established. At the same time, the spatial distribution of laser-induced chlorophyll fluorescence intensity and degree of polarization was plotted in polar coordinates. The results show that the shapes of fluorescence spectra of the three plants were different, and the changes in the Viewing Zenith Angles and Relative Azimuth Angles affect the fluorescence intensity and fluorescence parameters. The mathematical regression models of Viewing Zenith Angles and fluorescence parameter F685/F740 were established at Relative Azimuth Angles. According to the comparison of R2 and RMSE of different models, the Relative Azimuth Angle of 225° is the best angle to study the relationship between F685/F740 and Viewing Zenith Angles for these three plants at the same time. The regression coefficient is significant, which can accurately reflect that F685/F740 has a significant correlation with Viewing Zenith Angles. In addition, we also performed polarization observations on the laser-induced chlorophyll fluorescence of the three plants and calculated the corresponding fluorescence polarization in the 2π space. The studies have shown that the laser-induced chlorophyll fluorescence spectrum has significant polarization, and the Viewing Zenith Angles, Relative Azimuth Angles, and band information have different effects on laser-induced chlorophyll fluorescence polarization spectra. The mathematical regression models were established for the relationship between the fluorescence polarization at 685 and 740 nm for different plants. The regression coefficient is significant, which could accurately reflect the significant correlation between the fluorescence polarization at 685 and 740 nm.
Dec. 01, 2020Vol. 40 Issue 12 3692 (2020)
Hong-zhang NING, Xin TAN, Yu-hang LI, Qing-bin JIAO, and Wen-hao LI
In the process of hyperspectral image(HI) filtering by Savitzky-Golay(SG) filter, the spatial information of HI is ignored which lead to the accuracy of recognition model of wheat HI dataset can only reach 87.088 9%. This paper proposes a method, TSG filter, that combines space-spectrum information of HI. By this way, the accuracy of the model is improved by 12.066 7% compared with SG filter. The algorithm expands one-dimensional SG convolution core into two-dimensional SG convolution core in four directions. Then the HI data can be quickly convoluted using convolution theorem and fast Fourier transform, so that the space-spectrum noise of HI can quickly filter. When the TSG filter core coefficient m=2~4, n=3~5, the SNR of the HI is increased by more than 10%, the PSNR is higher than 30 dB, and the SSIM is greater than 96%, which means TSG filter maintains the original HI characteristics well and improve the SNR significantly. After TSG filtering (m=3, n=4) or SG filtering (m=7, n=3), by comparing with the gray image and spectrogram of Pavia University HI, it can be seen that after TSG filtering, the band noise of the image is suppressed, the peak height of the characteristic peaks is increased by 31.68%, and the average intensity of the characteristic band is increased by 41.83%, while after SG filtering the band noise of the image is still clear and the relative peak height of the characteristic peak is up to 13.40%. The model of wheat HI recognition model based on TSG-PCA-SVM algorithm is constructed. The training set contains 500 sample points and the test set contains 4 500 sample points. The accuracy of this model is as high as 99.155 6% and the kappa coefficient is 0.983 613 while predicting the test set. The total accuracy predicting all 116 880 samples in the wheat HI data set is as high as 99.206 0%, which means the classification model has high accuracy and good consistency, and the classification accuracy is significantly improved compared with SG filtering that only reaches 87.088 9%. In conclusion, this paper provides a new idea for HI filtering and provides a reference for the construction of a hyperspectral identification system of wheat Hi dataset.
Dec. 01, 2020Vol. 40 Issue 12 3699 (2020)
Xin-xing LI, Bu-wen LIANG, Xue-bing BAI, and Na LI
Soil moisture is one of the important factors affecting agricultural production, and plays a key role in crop growth and development and final yield. However, the waste of agricultural water is widespread, and the utilization rate of water is low. It is estimated that by 2020, China’s irrigation water utilization coefficient will only be It is 0.55, far below the advanced world level of 0.7~0.8. Therefore, the accurate and effective judgment of soil water content abundance is of great significance to agricultural production practice. The detection of soil moisture content has gradually become a research hotspot at home and abroad. Spectral technology can obtain the image information and spectral information of the target simultaneously by utilizing the different characteristic lines of the object, thereby more intuitively expressing the characteristics of the target, and can dynamically and accurately detect the soil moisture content accurately and non-destructively. The technology has greatly promoted the precision, intelligence and modernization of agriculture, and plays an important role in the detection of soil moisture content. This paper reviews the latest literature on soil moisture content detection at home and abroad, systematically discusses the research progress of soil moisture content detection based on spectroscopy technology, analyzes the shortcomings of traditional methods, and expounds the advantages of spectral imaging technology: (1) Real-time; (2) non-destructive; (3) accuracy; and its limitations in the detection of soil moisture content: (1) complex soil structure; (2) insufficient generalization ability; (3) climatic conditions. Three key technologies of spectrum in soil moisture detection are highlighted: (1) Spectral data pretreatment technology, which focuses on the common pretreatment technology principles and effects; (2) Spectral feature extraction technology, which compares common feature spectrum extraction and focuses on the sensitive band of soil moisture. (3) Spectral modeling technology, which focuses on the linear and nonlinear models of soil moisture content detection, analyzes its principle, application range and model accuracy, concludes that the nonlinear model will become the mainstream modeling method of spectral technology in soil moisture content detection. Finally, based on the above analysis, the application prospects and research trends of spectroscopy in the field of soil moisture detection have prospected: Firstly, the generalization ability and robustness of the technology should be improved, and a moisture detection model that can be used for various soil types is established. Secondly, establish a large-area field and dynamically update the soil moisture spectrum database to improve the accuracy of the model.
Dec. 01, 2020Vol. 40 Issue 12 3705 (2020)
Yuan ZHAO, Zhao-yue LÜ, Jian DENG, and Guo-qing ZENG
The emissive mechanism of conventional fluorescent material coumarin C545T was studied at the 3DTAPBP/TPBi-based exciplex interface and CBP/TPBi-based non-exciplex interface. 3DTAPBP is short for 2,2’-Bis(3-(N, N-di-p-tolylamino) phenyl) biphenyl, CBP for 4,4-bis(N-carbazolyl)-2,2-biphenyl and TPBi for 1,3,5-tris(1-phenyl-1H-benzimidazol-2-yl) benzene. The device structures were ITO/MoO3/3DTAPBP/C545T/TPBi/LiF/Al and ITO/MoO3/CBP/C545T/TPBi/LiF/Al, respectively. The photo-luminescence (PL) spectra of 3DTAPBP, CBP and TPBi films are peaked at 415, 411 and 380 nm, respectively. The PL of 3DTAPBP/TPBi heterojunction is centered at 412 and 490 nm. The peak of 412 nm is originated from 3DTAPBP. Nevertheless, the peak at 490 nm neither belongs to the emission of 3DTAPBP nor TPBi, which should be from the emission of exciplex at the 3DTAPBP/TPBi interface. There is no additional peak for PL of the CBP/TPBi heterojunction film, which is the superposition of PL of CBP and TPBi films. That is, exciplex cannot be formed at the CBP/TPBi interface. The electroluminescent (EL) emission of C545T is dominant for the ITO/MoO3/3DTAPBP/C545T/TPBi/LiF/Al and ITO/MoO3/CBP/C545T/TPBi/LiF/Al devices. In both types of devices, C545T can be diffused into 3DTAPBP and TPBi or CBP and TPBi layers. For a doping system, the emissive mechanism of guest material could be divided into two possibilities: one is energy transfer between the host and the guest, and the other is direct charge trapping of the guest. In the exciplex system of 3DTAPBP/TPBi, the F?rster energy transfer from the host (3DTAPBP/TPBi) to guest (C545T) is predominant since there is a large overlap between the emission spectra of 3DTAPBP/TPBi and excitation spectrum of C545T. Consequently, the curves of current density vs. voltage (J-V) have been little or no influence by C545T thickness (concentration). In the non-exciplex system of CBP/TPBi, direct charge trapping is the main emission mechanism due to the small overlap between photoluminescence of CBP/TPBi and C545T excitation. The J-V characteristics show a reduction trend with the increase of C545T thickness for operating voltage could be increased with the thickness of C545T induced by the recombination of C545T via direct charge carrier capture.
Dec. 01, 2020Vol. 40 Issue 12 3711 (2020)
Dian JIAO, and Si-guo XIAO
Long afterglow materials have broad application prospects in biomedicine, information storage and so on. Materials with blue, green and yellow afterglow in different systems have successfully prepared, and some of them with good long afterglow properties have met the requirements of practical applications. However, the red long afterglow materials are not ideal in terms of their luminosity and afterglow time. In this paper, In3+ and Si4+ co-doped Zn(Bi)Ga2O4:Cr3+ materials with deep red light luminescence were prepared by high temperature solid-state reaction through. The properties of the luminescent spectra, long afterglow and thermoluminescence of the as-prepared materials were systematically studied. XRD shows that In3+ and Si4+ ions participate in the solid state reaction and occupy the appropriate lattice position of Zn(Bi)Ga2O4, and the co-doped In3+ and Si4+ ions have not changed the structure of the host of ZnGa2O4. The excitation spectra of Zn(Bi)Ga2O4:1%Cr3+; Zn(Bi)Ga2O4:1%Cr3+, 9%In3+ and Zn(Bi)Ga2O4:1%Cr3+, 9%In3+, 7%Si4+ have been measured by monitoring emission wavelength at 687 nm. The co-doped In3+ and Si4+ ions change the local environment of Cr3+, thereby causing the red-shift of the excitation band corresponding to the charge transfer from the 2p orbital of O2- to the 4s4p orbital of Ga3+. Meanwhile, the strength of the 4A2-4T1 and 4A2-4T2 transitions of Cr3+ is also significantly enhanced by the In3+ and Si4+ co-doped. From the emission spectra excited by the 440 nm light of xenon lamp, it is found that the introduction of In3+ ions changes the local environment of some Cr3+ ions in octahedrons, results in the different emission peak positions of Cr3+ in different lattice sites. This leads to the inhomogeneous broadening of the luminescence spectra in the In3+ doped samples. At the same time, the change of the local environment of Cr3+ ions caused by In3+ doping also improves the emission intensity of the samples. The In3+ and Si4+ co-doping further enhances the inhomogeneous broadening of the emission spectra and the luminescence intensity is also intensified. It is found that Zn(Bi)Ga2O4:Cr3+ co-doped with 9%In3+, 7%Si4+ presents the best photoluminescence properties in our experiment. Based on the measured afterglow decay curves, it is found that the introduction of In3+ can greatly improve the afterglow brightness of the sample and prolong the afterglow time. Moreover, the further introduced Si4+ ions can ulteriorly improve the afterglow brightness and prolong the afterglow time. Thermoluminescence tests show that the introduction of In3+ ions can increase the depth of trap levels in the sample, while the co-doped In3+, Si4+ ions with appropriate concentrations not only increase the depth of the trap but also enhance the concentration of traps in the sample. The investigation in the present work proves that Zn(Bi)Ga2O4:Cr3+ co-doped with 9%In3+, 3%Si4+ have the best long afterglow properties. Related studies provide a meaningful reference for further optimization of long afterglow gallate materials.
Dec. 01, 2020Vol. 40 Issue 12 3716 (2020)
Chang-guo XUE, Yu TANG, Shi-qin LI, Song LIU, and Ben-xia LI
The development of industry has caused a large number of dyes to be discharged into water bodies, causing serious pollution to the water environment and harming the entire ecosystem. Therefore, it is important to develop portable and rapid detection technology. Surface-enhanced Raman spectroscopy has the advantages of high single-molecule level detection sensitivity, short detection cycle, and molecular fingerprint specificity. Its application in the field of water organic dye detection has received widespread attention, but this technology relies on reliable substrates with high enhancement and high signal reproducibility, but the synthesis of substrates mostly uses toxic and hazardous materials, posing potential environmental risks. The use of non-toxic chemicals, non-polluting solvents and renewable materials are important considerations in green synthesis strategies. In summary, this paper adopts a hydrothermal method to green synthesize nano-silver and use it in surface-enhanced Raman technology to detect organic dyes in water. First, a simple, fast, and green synthesis method was adopted, using sodium alginate as the reducing agent and stabilizer, and water as the reaction medium. The nano-silver hydrosol was prepared by hydrothermal reduction of silver nitrate, and a reliable substrate for this experiment was obtained. The structure and surface morphology of nano-silver were analyzed by UV-visible spectrophotometry and transmission electron microscopy. The results showed that the prepared nano-silver hydrosol had a large particle size, a wide distribution, a good dispersion and a spherical shape, and an average particle diameter 46 nm. Three dyes (methylene blue, rhodamine B, and basic fuchsin) were formulated into solutions of different concentration gradients and then mixed with the prepared silver gum for surface-enhanced Raman detection. The Raman spectrum of the dye solution was detected, and the characteristic peaks were identified by reference to the literature. Raman characteristic peak can be detected when the concentration of the pure solution is 1×10⁻³ mol·L-1. However, there was no characteristic peak at 1×10⁻⁴ mol·L-1 concentration or lower. The detection of the Raman spectra of the silver gum showed that there was no Raman peak, indicating that the silver gum had no background effect on the Raman spectra of the mixture. The Raman spectral characteristic peak position of the silver gum mixture is still relatively obvious at low concentration gradients. These results show that the Nano-silver synthesized by this method has a good Raman enhancement effect on the three dyes, and the sensitivity can reach 10-6 mol·L-1. With the emphasis on environmental protection, the surface-enhanced Raman technology using Nano-silver synthesized by green method as a reliable substrate will have a broader application prospect in the field of dye wastewater detection.
Dec. 01, 2020Vol. 40 Issue 12 3722 (2020)
Ying-tao YU, Ji-feng WANG, Yu-ye SUN, Fu-juan LI, and Chao WAN
The doping of inferior or low-priced oils into the edible oil infringes consumers’ rights and harms public health. Therefore, the anti-counterfeiting identification of edible oils is of great significance. When the content of counterfeit components in the adulterated oil decreases, the similarity between the genuine oil and the adulterated oil becomes higher so that the identification of low-doping oil is generally difficult. In this paper, synchronous two-dimensional Raman correlation spectroscopy with cooling as a perturbation factor was used for the identification of the pure and the low-doping (5%, 10%, 20%) olive oils. Soybean oil with high similarity to the olive oil was selected as a counterfeit component. In the range of 15 to 0 centigrade degree, the Raman spectra of the pure and the adulterated olive oils were similar and changed slightly when the temperature decreased. The characteristic peaks appeared at 2 850, 2 874, 2 906, 2 933, 2 958, 3 005 cm-1. The characteristic peak at 2 850 cm-1 corresponding to the symmetric stretching vibration of methylene (CH2) was the strongest peak. When the temperature dropped below 0 centigrade degree, the Raman spectra of the pure and the adulterated olive oils changed significantly along with the decrease of temperature. In the range of -5 to -20 centigrade degree, the characteristic peaks appeared around 2 848, 2 883, 2 933, 2 956, 3 005 cm-1. The peak at 2 848 cm-1 was attributed to the redshift of the peak (2 850 cm-1) of the symmetric stretching vibration of CH2, and its relative peak strength decreased with the dropping of temperature; meanwhile, the peak at 2 883 cm-1 corresponding to the asymmetrical stretching vibration of CH2 gradually increased and became the strongest peak. Synchronous two-dimensional Raman correlation spectra showed that the strength of the auto peak around 2 925 cm-1 and that of the negative cross peak at (2 925, 2 883 cm-1) remarkably decreased with the increase of doping ratio, and the two-dimensional spectral difference among the pure and the low-doping (5%, 10%, 20%) olive oils was significant. Hierarchical clustering analysis based on the synchronous two-dimensional Raman correlation spectra showed that the blind samples of the pure and the low-doping olive oils were all accurately identified. Synchronous two-dimensional Raman correlation spectroscopy with cooling as a perturbation factor is efficient to distinguish the low-doping oils from the genuine olive oil and can be also helpful for the identification of other kinds of oils.
Dec. 01, 2020Vol. 40 Issue 12 3727 (2020)
Yu CHEN, Yu-zhu LIU, Xing-chen WANG, and Bumaliya ABULIMITI
Aromatic compounds are widely existing in nature. They are stable, highly toxic, carcinogenic and teratogenic chemicals. Among them, bromobenzene (C6H5Br) is one of the organic pollutants that damage the natural environment and pose a serious threat to human health. The study of the influence of external electric field on the spectrum of bromobenzene has been widely used in atmospheric chemistry, combustion chemistry, environmental monitoring and other fields. In the present paper, density functional theory(DFT) at BPV86/6-311G(d, p) level are employed for the study of IR spectrum of bromobenzene in the external electric field. Based on the density functional theory, the UV-Vis spectra of bromobenzene molecules are obtained by the same method and basis set. In the actual measurement, it is difficult to obtain physical characteristics such as the infrared spectrum and UV-Vis spectrum of bromobenzene molecules under an electric field of a specified size and direction. The research shows that by comparing with the experimental values, the infrared spectrum and UV-Vis spectrum of bromobenzene calculated based on density functional theory have high accuracy and good resolution, and include a wider range of wavelengths. Therefore, these results can be used as a supplement to the experimental values, which provides a new method for theoretically studying the influence of the external electric field. Without the external electric field, due to the C—H bond vibration, the infrared spectrum of bromobenzene molecule has the strongest absorption peak at a wave number of 718 cm-1, and an absorption peak with an intensity second only to the strongest peak at 1 455 cm-1. The C—Br bond has two strong absorption peaks near 727 and 1 185 cm-1. As the external electric field increases from 0 to 0.03 a. u., both infrared absorption peaks of the C—Br bond are red-shifted and the vibration intensity increases, C—H bond vibrations have similar changes. The charge transfers the Br atom from the 6C atom along with the C—Br bond, which greatly enhances the electronegativity of the Br atom, and the negative charge density of the 6C atom decreases slightly. Therefore, the Coulomb force between the 6C atom and the Br atom increases, and the vibration intensity of the C—Br bond infrared spectrum increases. In addition, the wavelength corresponding to the strongest peak of the UV-Vis spectrum shifted from 191.6 to 187.4 nm, and the molar absorption coefficient increased from 23, 402.171 to 28, 885.125. These results provide a theoretical reference for studying the spectral detection of bromobenzene under an external electric field, and also have implications for studying the spectral detection methods of other organic pollutants.
Dec. 01, 2020Vol. 40 Issue 12 3732 (2020)
Xian-hua YIN, Yu LIU, Mu-lin FENG, An LI, and Wei MO
With the deepening of the concept of “green tires”, the effective composition of tire rubberis directly related to the qualification of rubber. But tire rubber is a “black” analysis system for the inspection department, and it’sexceedingly crucialto accurately detect rubber components by the existing methods. Terahertz time-domain spectroscopy (THz-TDS) technology has been successfully applied to material detection and analysis, but the terahertz spectral data observed from a complex sample of rubber represents the comprehensive results of several interrelated components or interaction of characteristic components in many cases, where as the actual information contained in the raw data may overlap, which will conversely affect the analysis of the components in the rubber mixture. In order to solve the problem of terahertz spectral overlap, the characteristics of continuous smoothing of terahertz spectral matrix and sparse concentration matrix are combined this paper, then the 2 norms with smoothing characteristics and the 1/2 norm with sparsity characteristics into the non-negative matrix factorization method is introduced, which are applied to the separation of terahertz aliased spectra, so as eparation method of terahertz aliasing spectral based on spectral feature Constrained Non-negative Matrix Factorization (CNMF) is proposed. Firstly, nitrile-butadiene rubber combined with vulcanization accelerator 2-Mercaptobenzothizzole(MBT) to form a binary mixture in diverse proportions, and it combined with vulcanization accelerators MBT and tetramethy1 thiuram monosulfide (TMTM) to form a ternary mixture in different proportions. Then the terahertz time domain spectrum of all samples ismeasured by terahertz spectroscopy system, which the measured data is subjected too btain a corresponding absorbance spectrum. Further, principal component analysis is performed on the obtained spectral matrix to initially determine the number of components of the mixture. Finally, the Non-negative Matrix Factorization (NMF), Non-negative Matrix Factorization based on pure variables initialization(PNMF) and CNMF methods are used to the decomposition of the mixture data matrix and spectral analysis of the aliased spectrum. The results show that the separation effect of the CNMF algorithm is better than that of NMF and PNMF method, and the corresponding results of the characteristic absorption peak are accurate. In addition, the correlation coefficients of separation results for different component mixtures are higher than 89%, and the spectral angles are less than 0.5 with a higher reduction degree of purity spectrum. Therefore, the constrained non-negative matrix factorization algorithm is introduced into the separation of terahertz aliasing spectra, which is preferable to extract the characteristic information of single components in complex mixtures and provides a better foundation for the qualitative analysis and quantitative calculation of subsequent terahertz multi-component mixtures as well as the considerable research prospects in the field of quality testing of green tires and rubber.
Dec. 01, 2020Vol. 40 Issue 12 3736 (2020)
Li-juan DAI, Le-ming DING, Wei-tao LI, and Zhi-yu QIAN
A new method of pain measurement using scattering spectrum with a small source-detector separation is proposed. First, the relationship between the change of oxy-hemoglobin and deoxy-hemoglobin concentrations and the change of scattering spectrum intensity sampled through an optical probe with a small source-detector separation is established based on the modified Beer-Lambert’s law. The formula calculating results are compared with those measured by tissue oximeter in experiments using Intralipid mixed with blood. Secondly, the formalin solution was injected to seven rats’ hind paws to create pain stimulation. The spectrum system with a small source-detector separation was used to measure the scattering spectrum of the anterior cingulate cortex (ACC) of rats before, and after injection, meanwhile, the local field potential of ACC before and after injection were acquired by the bioelectrical signal acquisition system. Finally, the change of oxy-hemoglobin, deoxy-hemoglobin and total hemoglobin concentration were calculated. The power spectrum intensity of β wave (13~30 Hz) was obtained every 10 seconds, respectively. The changes in these parameters before and after injection were analyzed. The results showed that the values of the oxy-hemoglobin and deoxy-hemoglobin concentration change calculated by the formula are in good agreement with those measured by the Oximeter in the liquid model experiment, in which the average relative error with the standard deviation is 14%±5%. Therefore, the analysis of the change of oxy-hemoglobin and deoxy-hemoglobin concentration by the spectrum system with a small source-detector separation could have high accuracy. In the pain stimulation experiments of rats, the oxy-hemoglobin concentration of ACC increased rapidly for a short time within 5 minutes after the injection of formalin and then decreased monotonously. Meanwhile, the deoxy-hemoglobin concentration decreased in a short time within 5 minutes after injection and then increased monotonously. There was no significant change in total hemoglobin concentration after injection. The local field potential power of ACC gradually increased after the injection and reached the peak value about 20 minutes after injection, and then remained near the peak value, which was significantly different from that before injection. It can be confirmed that the oxy-hemoglobin and deoxy-hemoglobin concentration changes were correlated highly with ACC’s functional activation. It can be seen that the local scattering spectrum with a small source-detector separation can be effectively used to mark the functional activation and analyze the neural-vascular coupling mechanism of the nuclei related to pain, which provides an effective new way to improve the understanding of cerebrovascular function related to pain and pain measurement in small animal models.
Dec. 01, 2020Vol. 40 Issue 12 3743 (2020)
Jian-hua ZENG, Yan MENG, Lin-lin LIU, Yang YANG, Mei-ying LI, Zi-yue WANG, Xiu-qing ZHU, and Yan-guo SHI
Hemp seeds are the important resource of high-quality vegetable oil, while the numerous high-quality protein in the hemp seed meal has not been fully exploited. Hemp protein isolates (HPI) are the resource of the high-quality protein, containing 20 kinds of amino acids with a relative equilibrium of the content of 8 essential amino acid and a high content of Agr. However,the application of HPI in food processing was severely hindered by the poor protein solubility. At present, there was a few pieces of literature on the conformation of HPI, and the effect of pH change on its conformation during processing has not been reported. In this study, the conformation of hemp protein isolate (HPI) was characterized by Circular dichroism (CD) spectrum, Fourier transforms infrared (FTIR) spectroscopy, Fluorescence spectrum and Ultraviolet (UV) spectrum, which compared with soybean protein isolate (SPI). The effects of different pH conditions on the conformation of HPI were investigated. Conformation results showed that comparing with SPI, there was more α-helix content in HPI, determined by CD and FTIR, which was 39.1% and 33.1%, respectively, while SPI contained β-sheet. The exposure of aromatic amino acid residues from HPI was lower than SPI, revealed by intrinsic fluorescence and UV spectroscopy. Moreover, the content of disulfide bond of HPI (10.06 mmol·g-1) was more than SPI, as was as higher surface hydrophobicity (374), but the value of free sulfydryl/total free sulfydryl of HPI was significantly lower than that of SPI. These results suggested that the tertiary structure of HPI was more compact than SPI, leading to a smaller particle size of nature HPI. The structure characteristics of HPI were changed in strong acid and strong alkaline conditions, which induced the structure of HPI to unfold and increased the size. As a result, the distance between aromatic amino acid residues was increased, and the energy transfer efficiency of Phe to Tyr and Trp was decreased. Finally, the fluorescence intensity of Try residues was decreased, and the fluorescence of Phe and Tyr residues was partly showed. Comparatively speaking, under acidic conditions, the conformation stability of HPI was relatively poor, and dissociation-association reactions were prone to the protein subunits. However, the conformation of HPI was relatively stable and with more flexibility. Therefore, with the help of fluorescence spectrum and UV second derivative spectrum, changes in the microenvironment of amino acid residues of HPI could be predicted, so as to understand changes in the three-dimensional structure of protein molecules. In conclusion, further understanding of HPI conformation and clarifying the influence of pH changes on HPI conformation are conducive to providing a theoretical reference for specific modification of HPI to prepare high-quality HPI and active physiological polypeptides.
Dec. 01, 2020Vol. 40 Issue 12 3748 (2020)
Lu ZHANG, Liang XU, Zong-cai TU, Qi-ming ZHOU, and Wen-na ZHOU
Fluorescence spectroscopy has the advantages of high sensitivity, strong selectivity, small sample amount, simple operation, and can provide a variety of physical parameters of intermolecular interaction. So it is widely used to study the interaction between small molecules and proteins. To elucidate the potential of isoquercetin suppressing the formation of (advanced glycation end products, AGEs) during thermal processing of high-protein foods, intrinsic fluorescence, synchronous fluorescence and three-dimensional fluorescence spectroscopic techniques were employed to evaluate the inhibition through α-lactalbumin (α-La)-fructose model, and the mechanism was elucidated from the perspective of intermolecular interactions. The results showed that isoquercetin significantly decreased the conformational change of α-La induced by glycosylation, resulting in the inhibition on AGEs formation. The inhibition rate reached up to 74.66% when the sample concentration was at 36.58 μmol·L-1. As revealed by synchronous and three-dimensional fluorescence spectroscopy, isoquercetin could change the conformation of α-La, promote the exposure of tryptophan to a more hydrophilic environment, and increased the hydrophilicity of its micro-environment. Inhibition kinetics and thermodynamic analysis showed that isoquercetin quenched the intrinsic fluorescence of α-La by static mechanism, and bound with α-La in a molar ratio of 1:1 to form a stable complex. The formation of isoquercetin-α-La complexes is a spontaneous and endothermic progressing, van der Waals forces and hydrogen bonds are the main driving forces.
Dec. 01, 2020Vol. 40 Issue 12 3755 (2020)
Jian XING, Zhao MA, and Yan BAI
In recent years, in order to reduce the dependence on fossil fuels and the strong demand for energy conservation and environmental protection, biomass boilers with rice husk, straw and other renewable resources as fuel have attracted more and more attention in the industry. In order to further improve the combustion efficiency of the biomass boiler and optimize the furnace structure, it is necessary to monitor the flame temperature real-time. The traditional thermocouple temperature measurement method is not conducive to long-term high temperature measurement, and the CCD temperature measurement method is difficult to measure the real temperature, while the multispectral radiation temperature measurement method has the advantages of fast response, no upper limit of measurement and can obtain the real temperature, which is one of the most powerful tools for measuring the flame temperature of a biomass boiler. Multispectral radiation thermometry is to obtain the real temperature by measuring the spectral radiation intensity information of a certain point of the object to be measured and inversing it with Planck formula. However, the unknown spectral emissivity is the biggest obstacle in the inversion process of multi-spectral radiation thermometry. At present, a group of emissivity models (emissivity wavelength or emissivity temperature models) are usually assumed in advance. If the assumed models are consistent with the actual situation, the inversion results can meet the requirements. If the assumed models are inconsistent with the actual situation, the inversion results have a large error. Whether the direct inversion of true and moderate spectral emissivity can be realized without any spectral emissivity hypothesis model is always a hot and difficult topic in the theoretical research of multispectral radiation thermometry. For this reason, a constrained optimization algorithm of penalty function is proposed, which transforms the inversion problem of multi spectral radiation temperature measurement into a constrained optimization problem. Because the outer point method is adopted, it is not affected by the initial value of emissivity, which further improves the adaptability of the algorithm to the emissivity of different materials. Based on the flame-s model optical fiber spectrometer produced by American ocean optics, a flame temperature measuring device of rice husk biomass boiler furnace was built. After the calibration of blackbody furnace in the laboratory, the temperature of the furnace flame of rice husk biomass boiler from initial combustion to stable combustion was measured, and the results were compared with those of thermocouple. The results show that the maximum absolute error is 35.7 K, and the maximum relative error is 3.2% compared with the thermocouple. The results show that the measurement device and the inversion algorithm can realize the measurement of the combustion temperature in the furnace of the biomass boiler, which provides the preliminary research basis for the subsequent combustion diagnosis and boiler design optimization of the biomass boiler.
Dec. 01, 2020Vol. 40 Issue 12 3761 (2020)
Chun-li GUO, Min HUANG, Yong-hui XI, and Jie PAN
In order to investigate the influences of different primary colors and viewing fields on observers’ color perceptions, three groups of color matching experiments were designed, and 18~23 observers aged from 19 to 25 were organized to carry out the visual experiments. The CIE recommended 5 colors and 4 different field sizes(2°, 4°, 10°, 22°) were used in the experiments, and 1 260 datasets were gathered. The CIE1931, CIE1964 and CIE2006 color matching functions (CMFs) were used to compute the colorimetric values of the target and matched colors, and then CIE DE2000 color difference values were used to test the performances of different CMFs. The distributions of the matched colors from different field sizes and different groups were plotted in a*b* and L*Cab* plane, it can be found that there are larger discrepancies in CIE1931 and CIE1964, as well as CIE2006, especially in red and green colors. The CIE DE2000 color difference values computed by CIE2006 CMFs are the smallest, and CIE2006 CMFs outperformed others in small field sizes (2° and 4°), large filed size (22°). In the filed size of 10, CIE1964 have the best performance. CIE2006 CMFs was used in the following data analysis, and the results indicated that with the increasing of the field size, the hue of the matched red, yellow, blue and gray colors would be shifted with the direction of the bottom right in a*b* plane, the chroma of the red and blue colors would be increased, the chroma of the yellow colors would be decreased, there is no obvious variation of the lightness of the matched colors. The primary colors have some influences on the experimental results, the shift of the peak wavelength in blue channels can enlarge the color differences of the target and matched colors, followed by green channel, and finally the red channel. The results can provide datasets and theoretical support to extend the range of the existing CIE proposed CMFs, and also provide guidance for weak or enlarge the observer metamerism in the process of color transmission and reproduction.
Dec. 01, 2020Vol. 40 Issue 12 3765 (2020)
Shan-ke HU, Yu-hua QIN, Ru-min DUAN, Li-jun WU, and Hui-li GONG
Aiming at the problem that the high-dimensional, high-noise, overlap and nonlinear features of the near-infrared spectrum seriously affect the modeling accuracy, a feature extraction method based on joint matrix local preservation projection (JMLPP) is proposed in this paper. First, the cluster-based spectral feature selection is used for effective features extraction. According to kinds of indicators with a strong correlation of classification, the samples are divided into kinds of different clustering modes. Based on the idea of strong intra-class correlation and great inter-class difference, the intra-class threshold and the inter-class threshold are determined by adjusting the intra-class parameter and the inter-class parameter . The spectral feature regions are selected according to kinds of different clustering modes, and feature matrices are obtained, whereas a joint matrix is generated by the union operation. Cluster-based feature extraction eliminates features with low intra-class correlation and high correlation between classes, and realizes the elimination of noise information in the spectrum. Secondly, the local preservation projection algorithm (LPP) is improved in this paper from two aspects: the geodesic distance is introduced to construct the neighborhood distance matrix, and the topology between the high-dimensional sample data is better expressed than the Euclidean distance. Meanwhile, the edge weight matrix is also improved, which solves the uncertainty caused by sample sparseness and avoids the loss of effective information. Finally, the improved LPP algorithm is used to reduce the dimensionality of the joint matrix, and the optimal spectral feature subset of the low-dimensional mapping is obtained. In order to verify the effectiveness of the JMLPP algorithm, this paper first compares the JMLPP with PCA and LPP from the perspective of spectral projection. The results show that JMLPP has better classification ability, and the tobacco samples in the projection space are clearly classified, and the effect is obviously better than PCA and LPP. In addition, the results of the model classification are also compared. The classification models were established by using the full spectra and dimension reduction features of the PCA, LPP and JMLPP. The experimental results show that the accuracy of the classification model established by JMLPP algorithm is 93.8%. The sensitivity of the five categories of tobacco grading classification are 95.2%, 93.1%, 94.2%, 92.1%, 92.5%, and the specificities are 99.3%, 98.4%, 98.6%, 97.5%, and 97%, respectively. The accuracy, sensitivity and specificity of the model are significantly higher than the other three methods. The JMLPP algorithm effectively extracts useful information of classification based on cluster-based feature extraction and local preserving projection algorithm, and maintains the local linear relationship of the original data. The stability and accuracy of model are desirable.
Dec. 01, 2020Vol. 40 Issue 12 3772 (2020)
Yan-long CHEN, Xiao-lan WANG, En LI, Mei-ping SONG, and Hai-mo BAO
Hyperspectral data is rich in information and bands, which can provide a more comprehensive basis for geophysical analysis, but at the same time, it also increases the complexity and interference of data analysis, especially in low signal-to-noise ratio applications such as remote sensing monitoring of water quality. Traditional band selection often uses correlation coefficient and other methods to select the identification band in many spectral bands and to analyze the data on the selected band set. In this paper, based on the constrained energy minimization (CEM), a target-oriented band selection algorithm is proposed, which is called CEM-based band selection (CBS). The signal matching filter is used to find the band with a high matching degree with the target vector from the observation vector, and then combined with the orthogonal principle to maximize the selection of a subset of bands that have a high degree of matching with the target vector and low redundancy of the band vector. Based on the determination of the components in the water quality monitoring, the hyperspectral data of the Liaohe estuary test area was collected and combined with the synchronous field water sample data to predict the nitrogen and phosphorus content in the Liaohe waters. Comparing the band selection results of the CBS algorithm with the band selection results of the Pearson correlation coefficient (PCC), the significant band subsets obtained by the two methods are used as variables to carry out stepwise regression analysis, and multiple regression models are established to further test the accuracy of the model and analyze the average relative error between the predicted value and the true value. In the accuracy test of the total phosphorus concentration model, the average relative error of the model obtained by the PCC algorithm is 20.7%, and the average relative error of the model obtained by the CBS algorithm is 8.17%. In the accuracy test of the total nitrogen concentration model, the average relative error of the model obtained by the PCC algorithm is 16.8%, and the average relative error of the model obtained by the CBS algorithm is 12.4%. The results of the data analysis show that the band subset obtained by the CBS algorithm is superior to the traditional selection method based correlation coefficient in the ability of nitrogen and phosphorus concentration inversion.
Dec. 01, 2020Vol. 40 Issue 12 3778 (2020)
Nan SONG, Han-zhou GUO, Chun-yang SHEN, Ci SUN, Jin YANG, and Jin-nan ZHANG
Hyperspectral imaging (HSI) is a new rapid and safe modern medical detection technology. In this paper, a self-developed hyperspectral imager was combined with a microscope to study the imaging spectrum of glioma tissue in human glioma mice and H&E staining pathology slides. The hyperspectral data of glioma and normal tissues were analyzed and processed to find the difference between them so as to realize the distinction of them. The experimental results show that there are some differences in the reflectivity within a specific spectral range between glioma and normal tissues, whether in pathology slides or in vivo data. We can distinguish glioma and normal tissues and provide reference and gist for clinical trials and auxiliary diagnosis in glioma surgery base on these differences.
Dec. 01, 2020Vol. 40 Issue 12 3784 (2020)
Yao-yao CUI, De-ming KONG, Ling-fu KONG, Shu-tao WANG, and Hui-chao SHI
Oil pollution is becoming more and more frequent, which brings a serious threat to human health and the ecological environment. Therefore, it is of great significance to study effective oil identification methods to protect the ecological environment. Three-dimensional (3D) fluorescence spectra are one of the most effective analytical methods for oils identification. 3D fluorescence spectra data are analyzed by using second-order calibration method. And then the concentration score matrix in the analysis results of the second-order correction method is classified by using pattern recognition, which can realize the qualitative identification of unknown samples. However, in the process of classifying and identifying unknown samples, the above methods only apply the concentration score matrix, which is essential to classify the unknown samples by using the relative content difference of the chemical components contained in the samples. The qualitative load matrix is not used, that is, the qualitative analysis of the sample is not achieved from the chemical components contained in the sample. Thus, a new identification method for oil samples was proposed by combining the reconstructed 3D fluorescence spectra with partial least squares discriminant analysis (PLS-DA). First, 80 oil samples were prepared by using four oils (gasoline, diesel, jet fuel and lubricating oil) in different backgrounds (sodium lauryl sulfate solvent prepared from purified water, tap water, river water and sea water); The 3D fluorescence spectra data of the sample was collected by using FS920 fluorescence spectrometer, and the data were preprocessed by de-scattering and standardized; Then, the abnormal spectra data was identified and deleted by using the Leverage value, and the remaining spectral data was reconstructed by using parallel factor analysis algorithm (PARAFAC); Finally, a classification model of reconstructed 3D fluorescence spectra was established by PLS-DA. The classification model established by reconstructing 3D fluorescence spectra was compared with the classification model established by unreconstructed 3D fluorescence spectra. The results show that, after the reconstruction of the 3D fluorescence spectrum, the correct classification rates of the four oils can be increased from 100%, 50%, 60% and 20% to 100%, 100%, 100% and 100%, respectively. It indicates that the reconstructed 3D fluorescence spectra have obvious intra-class characteristics. The sensitivity (SENS), specificity (SPEC) and F-scores of the classification model established by reconstructing the 3D fluorescence spectrum were 100%, 100%, and 100%, respectively. It indicates that the model established has robust and reliable analysis results. In this paper, 3D fluorescence spectra were reconstructed by using concentration score matrix and load matrix in the PARAFAC analysis results. Therefore, the PLS-DA classification model established by reconstructing 3D fluorescence spectra qualitatively identified samples not only from the difference in the relative content of chemical components, but also from the chemical components itself. Its results were convincing. This study provides a reliable method for oil identification.
Dec. 01, 2020Vol. 40 Issue 12 3789 (2020)
Xiao-xu YAN, Pei-lian WANG, and Su-wei YUE
Beryl group belongs to the hexagonal system and contains a series of beryllium-aluminosilicate minerals. Beryl gems normally show various colors, due to the occurrence of different trace elements. Greenish-yellow beryl and aquamarine are usually colored by iron ions in different valence states. Fe3+ and Fe2+ may occupy tetrahedral position (Fe42+), octahedral position (Fe63+) and crystalline channel([Fe2(OH)4]2+). Light blue aquamarine can be obtained by heating treatment of greenish-yellow beryl: (1) in 300~550 ℃ step heating-treatment experiments, the color of samples changes successively from light green, pale yellowish-green, through light yellow, pale blue to light blue; (2) the color turns into pale blue in 550~600 ℃; (3) desirable color modification occurs in 500~550 ℃. Mid FT-IR, UV-Vis and EPR spectroscopic analyses were conducted on beryl samples before and after heating treatment. The mid-FT-IR spectra of heated and unheated samples show similar molecular vibration spectroscopy characteristics. The absorption peaks in the region of 1 250~600 cm-1 which correlate to the typical vibration of [Si6O18] group shift to the direction of low wave number, along with the reduction of absorption intensity, indicating changes in Fe3+-O2- charge transfer and the bending vibration of the structural water during heating: (1) the weakening of Fe3+-O2- charge transfer was caused by the reduction of Fe3+ in the structural channel; (2) the weakening of bending vibration of structural water was caused by the water loss in heating treatment. The UV-Vis spectra show that same characteristics in both reductive and oxidative environment. However, there are some changes indicating the weakening of Fe3+ forbidden transition which leads to the disappearance of yellow color compared to unheated samples: (1) the absorption peak which attributed to O2-→Fe3+ charge transfer shifts towards the ultraviolet-light region and forms 322 nm absorption; (2) 6A1g→4T2g transfer shifts towards violet-light region and form 370 nm absorption; (3) 6A1g→4Eg+4A1g transfer shifts towards red-light region and form 427 nm absorption. Also, a wide absorption band near 823 nm was enhanced and shifted towards the visible-light region indicating a content increase of Fe2+ in structural channels which led the appearance of blue color. The ESR spectrum of natural greenish yellow beryl shows that Fe3+, Mn2+ and OH radical exist both in Al—O octahedron and structural channels. Following conclusions can be drawn from combined UV-Vis spectra: (1) Fe3+ in structural channels has been reduced to Fe2+ in heating treatment; (2) the forbidden transition of Fe3+ in Al—O octahedron is weakened during heating treatment; (3) the blue color acquired from heating treatment is caused by a combination of the above two changes in beryl crystals.
Dec. 01, 2020Vol. 40 Issue 12 3795 (2020)
Ran SUN, Xiao-jian HAO, Yan-wei YANG, and Long REN
Laser-induced Breakdown Spectroscopy (LIBS) is a material composition analysis technology. It uses a pulsed laser to focus on the surface of the sample. When the laser ablates the sample, the plasma is generated. The spectrometer collects the spectrum, and the computer performs the elemental analysis. It has the advantages of simple and rapid operation and comprehensive detection elements. Traditional LIBS has the disadvantages of low detection sensitivity and high spectral background noise. Combining LIBS technology with cavity confinement can enhance spectral intensity, while some parameters such as signal-to-noise ratio (SNR) and plasma temperature are also effectively improved. In this paper, the cylindrical cavity of PLA and aluminum were fixed on the surface of the brass sample, with diameters of 5 mm and 6 mm. And each diameter corresponded to five different heights:1, 2, 3, 4, and 5 mm, respectively. Three Cu plasma lines of Cu Ⅰ 510.55 nm, Cu Ⅰ 515.32 nm and Cu Ⅰ 521.82 nm were collected by the spectrometer and then were analyzed. The experimental results show that the spectral intensity is enhanced under each cavity confinement compared to without cavity. For the Cu 515.32 nm spectral line, the enhancement factor and signal-to-noise ratio under each cavity were studied. With the increase of the height of the cylindrical cavity, the enhancement factor firstly increases and then decreases, it reaches the maximum at the height of 4 mm. For a cavity of the same height and different diameter, it is larger at 5 mm than 6 mm in diameter. For a cavity of the same height and diameter, it is larger at the cavity of the aluminum material than PLA material. Under the current experimental conditions, when the height is 4 mm, and the diameter is 5 mm, the cavity of the aluminum material has the most obvious enhancement effect, the maximum enhancement factor is 28.29. The signal-to-noise ratio is consistent with the trend of the enhancement factor and reaches a maximum of 44.03 under the cavity of the aluminum material with a height of 4 mm and a diameter of 5 mm, which is 13.89 times compared to without cavity. In addition, the plasma temperature was calculated. The PLA cavity has little effect on the plasma temperature, while the plasma temperature increases obviously under the aluminum cavity, and excess value reaches a maximum of 467.35 K at 5 μs compared to without cavity. The cavity confinement device is simple and is convenient to combine with the LIBS system, and the enhanced spectral effect is obvious, so it has broad application prospects. This paper studied the influence of LIBS combined with cavity confinement of different materials on the spectrum of laser-induced breakdown Cu plasma, which has certain reference value for the selection of cavity materials.
Dec. 01, 2020Vol. 40 Issue 12 3801 (2020)
Jin-li XU, Meng-ying HU, Peng-peng ZHANG, Xia XING, Jin-feng BAI, and Qin ZHANG
The traditional laser induced breakdown spectroscopy (LIBS) was mostly used in the qualitative analysis of materials, because the instruments have such shortcomings as low repeatability and poor accuracy in quantitative analysis, which fails to meet the requirements of quantitative analysis on accuracy and precision. In recent years, both in hardware and software, LIBS technology has developed rapidly. Based on the outstanding advantages of LIBS technology, such as simple and fast, this method achieves multi-element quantitative analysis by one injection at the same time, and the satisfactory results have been obtained. In order to apply LIBS technology to the quantitative analysis of rare earth elements in soil samples, this paper optimizes the working conditions of LIBS technology and determines the best working conditions: Output (1.6 mJ), Gate Delay (0.1 μs), Spot Diameter (100 μm), Laser Repetition Rate (20 Hz), He (0.3 L·min-1). The analysis samples use the ultra-high pressure sample preparation technology, which improves the plasticizing effect of the sample, makes the surface more compact and flat, and effectively reduces the powder effect of the sample. With the increase of the sample preparation pressure, the characteristic spectrum of the sample shows that the baseline is obviously less, the noise is reduced, and the signal to back ratio and the precision of the measurement results are improved. The laser ablation of fresh surface greatly reduces the influence of thermal effect and improves the accuracy of the measurement results. The soil standard material (matrix matching) is used as a calibration curve, which decreases the influence of matrix effect and increases the accuracy of determination results. The method has been verified by the soil certified reference materials, and the measured value is consistent with the certified value. Although the relative error of the LREE analysis results is large, this method realizes the simultaneous determination of multiple elements using LIBS technology, promotes the application and development of LIBS technology in the field of exploration geochemistry and also provides a new idea for the popularization and application of LIBS technology in other fields.
Dec. 01, 2020Vol. 40 Issue 12 3806 (2020)
Shao-nong ZHU, Yu DING, Yu-juan CHEN, Fan DENG, Fei-fan CHEN, and Fei YAN
The detection of heavy metals in soil is one of the emphases of environmental protection. This paper aims to establish a fast and quantitative method for the determination of heavy metal elements in soil, based on LIBS and combined with the PLS method. We used PLS model to quantitatively analyze and predict the contents of Cu and Ni elements in oil-contaminated samples. On this basis, the variables of the full spectrum were screened by combining the Interval method and the Backward Interval method, which formed the Interval Partial Least Square (iPLS) and the Backward Interval Partial Least Square (BiPLS). The experimental results showed that the BiPLS method retained more spectral information after removing the interference information, and obtained better-predicted results than PLS and IPLS. The R2P and RMSEP of the predicted results of the test set for the copper element are 0.944 9 and 0.036 3, respectively, and the RPD reached 3.0. Those of the predicted results of the test set for nickel element are 0.933 7 and 0.041 4, respectively, and the RPD reached 2.6. Compared with the PLS and iPLS methods, the prediction results of the BiPLS method of the two elements were significantly optimized, the predictive ability was significantly improved, and the accuracy was much better. Therefore, In the analysis of heavy metal elements in oil-contaminated soil by LIBS technique, BiPLS is more suitable than iPLS and PLS for screening the feature variables that contribute greatly to the quantitative analysis of Cu and Ni elements, so as to improve the prediction effect. This method will promote the application of LIBS technology to the online evaluation of soil quality.
Dec. 01, 2020Vol. 40 Issue 12 3812 (2020)
Cui-ying LIU, Jin-rui ZHANG, Tao ZENG, and Jian-ling FAN
Soil aggregates are the main soil components, in which carbon (C) and nitrogen (N) content and dynamics significantly influence the soil Cand Ncycle process, stability and soil fertility. Due to the difference of aggregates fractionation methods, the size of aggregate fractions obtained from different studies was not the same. Therefore, a large quantity of aggregates samples was required when using infrared spectroscopy to predict the properties of soil aggregates, while it is difficult to reasonably predict each fraction. Comprehensive modeling and prediction of samples from different aggregate fractions were conducted. Fourier-transform infrared spectroscopy analysis was carried out on the soil samples of the light chestnut soil in Inner Mongolia, using a genetic algorithm to select the characteristic wavelength. Prediction models of soil organic carbon (SOC) and total nitrogen (TN) in aggregate fractions were established based on partial least squares (PLSR), support vector machine (SVM), artificial neural network (ANN) and random forest (RF) methods. Based on the characteristic spectral interval screened by genetic algorithm, the ANN model showed the best modeling and prediction abilities of SOC and TN content in soil aggregates(RPD>2), which is significantly better than PLSR, SVM and RF models. The prediction ability of the ANN model based on full-spectrum data is lower than that of the ANN model based on GA-selected characteristic spectral intervals. The results indicated that the selection of GA-based characteristic spectral intervals could not only simplify the model structure and eliminate irrelevant information but also improve the accuracy and prediction ability of the model. In the present study, FTIR data from different aggregate fractions were mixed for modeling. By using a genetic algorithm to filter the characteristic spectrum, we found that the artificial neural network model can reliably predict the SOC and TN contents in soil aggregates, which was not affected by aggregate size.This might be mainly due to the fact that some wavelength ranges reflecting soil minerals, clay particles, etc. have been included in the selection of characteristic spectra by genetic algorithms, and that the effect of particle size on the SOC and TN might have already been included in the ANN model. The result highlights that the screening of characteristic wavelength intervals based on genetic algorithms and the use of artificial neural networks can model soil aggregates of different particle sizes in a unified manner, and can be used to estimate SOC and TN contents of aggregates.
Dec. 01, 2020Vol. 40 Issue 12 3818 (2020)
Nan LIN, Hai-qi LIU, Jia-jia YANG, Meng-hong WU, and Han-lin LIU
Organic matter (OM), phosphorus (P) and potassium (K) in black soil play a crucial role during crop growth. Studying the distribution of nutrient elements in black soil and carrying out quantitative calculation of element content is of great significance to the scientific management of black soil and environmental protection. Based on 80 black soil samples collected from Nehe city, Heilongjiang province and hyperspectral measured data, the correlation between 4 forms of spectral reflectance including original, first differential, absorbance transformation, and first differential of absorbance and soil OM, P, K contents were calculated, and the correlation coefficient method was used to extract the sensitive bands. For the optimization of parameter values in the machine learning model, the bat algorithm (BA) was introduced and combined with Adaboost model. Using BA to optimize the two important parameters of Adaboost, namely, maximum iterations n and weak learner weight reduction factor v, selecting CART decision tree and determination coefficient as the weak regression learner of the model and objective function value of the parameter optimization respectively, the BA-Adaboost model was constructed for estimating soil OM, P, K contents. The results showed that the BA-Adaboost model could quickly search the optimal global parameters, and the accuracy and reliability of the Adaboost were improved significantly after BA optimization, where the prediction accuracy of OM was the highest among the three nutrient elements. And determination coefficient and root mean square error were 0.864 and 0.152 g·kg-1 respectively, which were improved by 14.2% and 25.4% compared with before optimization. Therefore, the constructed BA-Adaboost model has potential in the hyperspectral estimation of soil element content and is an efficient estimation method.
Dec. 01, 2020Vol. 40 Issue 12 3825 (2020)
Chuang-he MIAO, Yi-zhong LÜ, Yue YU, and Kang ZHAO
Dissolved organic matter (DOM) is an important component of soil organic carbon pool, which plays a vital role in soil biochemical processes such as carbon and nitrogen cycle, nutrient conversion and pollutant migration. Exploring the adsorption behavior of DOM onto soil can provide a theoretical reference for the application of compost and the behavior of DOM in soil environmental. In this study, two different types of soils (black soil and fluvo-aquic soil), and quartz sand, were selected to carry out the adsorption experiment. UV-Visible spectroscopy and three-dimensional fluorescence spectroscopy combined with parallel factor method was applied to analysis the spectral characteristic of the DOM in the solution. The results showed that DOM was adsorbed by soil particles quickly. The adsorbed amount of DOM would gradually decrease with time. Due to the difference in properties of the three medium, the adsorbed amount of DOM is different. The adsorbed amount of DOM onto black soil, fluvo-aquic soil and quartz sand at 20 minutes,accounts for 61.94%, 67.43%, 61.57% of the adsorbed amount at 260 minutes. The adsorbed amount of DOM onto black soil, fluvo-aquic soil, and quartz sand up to 9.30, 9.18 and 8.90 mg·g-1 at 260 minutes. The UV-Vis spectroscopy showed that the absorbance of DOM in the solution decreased with adsorption time in the wavelength range of 200~600 nm, and the decrease degree of absorbance was larger in the first 5 minutes than that at 5~260 minutes. In addition, SUVA254 values increased firstly and then decreased with time. The results of PARAFAC analysis showed that there were three organic fluorescent components in the adsorption equilibrium solution. The C1 component (325/410 nm) was identified as UV humic-like, originating from terrestrially-derived organic matter, and the C2 component (two peaks are 260/435 nm, 350/435 nm) identified as humic-like, aromatic and derived primarily from terrestrial plant material, C3 component (two peaks are 280/500 nm, 375/500 nm) is a typical humus-like component of terrestrial origin, the poor contribution of macrophytes, allochthonous. The relative molecular weight of the C3 component is higher than that of the C1 and C2 components, but the degree of aromatization is lower than that of the C1 and C2 components. Black soil shows lower adsorption capacity for C1 and C2 components than fluvo-aquic soil and quartz sand, but for C3 component higher than fluvo-aquic soil and quartz sand. Fluvo-aquic soil has the largest adsorption capacity for C1 component, and quartz sand has the largest adsorption capacity for C2 component. In summary, the soil types and the structural characteristics of DOM was the main factor that affect the adsorption behavior of DOM onto the soil. Therefore, this study could provide a theoretical reference for the rational application of compost on different types of soil.
Dec. 01, 2020Vol. 40 Issue 12 3832 (2020)
Feng-xia CHEN, Tian-wei YANG, Jie-qing LI, Hong-gao LIU, Mao-pan FAN, and Yuan-zhong WANG
China is the world’s largest exporter of Boletus, and Yunnan Province is the largest producer of Boletus eduils in China. The delicious Boletus eduils is fragrant and nutritious, and it is popular among consumers. However, due to different geographical climates and environmental differences, the quality is uneven. The production of Boletus edulis in different production areas in Yunnan Province was identified and the quality control was improved. In this study, 124 samples of delicious Boletus edulis from 13 producing areas around Yunnan were collected, using Fourier to transformed mid-infrared spectroscopy (FTIR-MIR), Fourier transform near-infrared spectroscopy (FTIR-NIR), and UV-visible spectroscopy (UV-Vis). Inductively coupled plasma atomic emission spectrometry was used to determine the spectral information and mineral content of different parts and analyze them. The original spectrum is smoothed (Savitzky-Golay SG), second derivative SD, standard normal variate (SNV) and other pre-processing. The data is divided into a training set and prediction set by Kennard-Stone classification. The classification model is established by partial least square discriminant analysis (PLS-DA) and support vector machine (SVM), and then the comparative analysis is carried out to find the best method of origin identification. The results show that: (1) The recovery rate of standard tea materials in the element determination method is between 91.00% and 106.00%, and the method is accurate and reliable. (2) Boletus edulis is rich in elements K, P, Mg, Na, Ca and the same place of origin in different parts. There are differences between the same parts in different places, which may be different from the enrichment ability of different parts of Boletus eduils. The geographical environment of the place of origin is related. (3) Intermediate fusion extracts important information through Principal component analysis (PCA). The cumulative contribution rate of FTIR-MIR and UV-Vis spectral data reaches 83.50% and 66.70%, which can represent important information variables. (4) In the PLS-DA and SVM models, the identification effect of the data after fusion is higher than that of the single data identification, indicating that the data fusion strategy is effective in the identification of delicious bovine liver. (5) Using the Hoteling T2 to perform the outlier tests on data fusion. The results show that the model establishment does not exceed the confidence interval, and the model has accuracy and credibility. (6) The primary fusion and intermediate fusion results of the PLS-DA model are higher than the SVM, indicating that the PLS-DA models intermediate fusion can be used as the best method for identification. Multi-spectral combined with mineral elements in different parts can accurately identify the delicious Boletus eduils from different habitats, and provide an effective analysis method for the regional quality difference evaluation of Yunnan Boletus eduils.
Dec. 01, 2020Vol. 40 Issue 12 3839 (2020)
Qing-xu LI, Qiao-hua WANG, Wei GU, Sheng GAO, and Mei-hu MA
China is a big country for the production and consumption of duck eggs and duck meat. For this reason, a large number of ducklings need to be hatched each year to meet production needs. Since the Infertile egg cannot hatch the duckling during the hatching process, it can be avoided by eliminating it as early as possible. At present, it is necessary to carry out artificial photographing eggs in the country for about 7 days after hatching, so that the infertile eggs can be removed. For the low-efficiency and elimination of artificial eggs, there is no edible value problem. In this paper, the duck eggs before hatching were taken as research objects, and the visible/near-infrared transmission spectroscopy combined with the convolutional neural network was used to realize the duck eggs before hatching Non-destructive identification of fertilization information. The method preprocesses the acquired 400~1 000 nm raw spectral information (removing the noise band and Savitzky-Golay convolution smoothing) to eliminate noise and extraneous information, and applies the competitive adaptive re-weighting algorithm (CARS) and continuous projection algorithm (SPA) to select the characteristic wavelengths, and converts the selected characteristic wavelengths into spectral two-dimensional information matrix. The spectral two-dimensional information matrix can not only represent the effective information of the characteristic spectrum, but also can transmit the spectral information to the neural network for training. For the characteristics of spectral data, the network is too deep to cause over-fitting of the model, and the shallow network will cause under-fitting of the model. A four-layer convolutional neural network (CNN) is built to train the spectral information, including three convolutional layers and one fully-connected layer. The convolutional layer is used to extract the spectral two-dimensional information matrix automatically. Effective information, the fully connected layer is integrated for the output layer by integrating the local features extracted by the convolutional layer. In addition, the introduction of local corresponding normalization layer, pooling layer and dropout in the convolutional neural network can accelerate the convergence speed of the network and prevent model overfitting. The accuracy of the model training set established by the SPA extracted feature wavelength is 97.71%, the test set accuracy rate is 97.41%, and the verification set accuracy rate is 98.29%. The model training set accuracy rate established by CARS extraction is 97.42%, the test set accuracy rate 97.41%, the verification set accuracy rate is 97.44%, the traditional machine learning model test set established using the characteristic wavelengths extracted by SPA and CARS has a precision of only 87.39%. The results show that the combination of deep learning and spectroscopy can realize the non-destructive identification of the fertilization information of duck eggs before hatching, which can provide efficient, non-destructive and rapid model support for the subsequent development of dynamic online detection equipment.
Dec. 01, 2020Vol. 40 Issue 12 3847 (2020)
Xian-yong LU, Wen-xuan HE, Hao-cong CHEN, Rui HUANG, and Yan-jie ZHANG
The fatty acid composition of camellia oil is similar to olive oil which is known as the “golden liquid”. The price of camellia oil is high. Some unscrupulous merchants add some cheap oils or waste oil in the high-priced oil to make huge profits, which seriously infringes on the rights and interests of consumers. To establish an efficient method for the identification of camellia oil is of great significance for preventing camellia oil from adulteration and safeguarding consumer rights. In this paper, three-dimensional fluorescence spectra of 54 samples including camellia oils, soybean oils and corn oils from different brands and processing techniques were analyzed. The analytical results show that the three-dimensional fluorescence spectra of camellia oils by different processing techniques are quite different; however, the difference between three-dimensional fluorescence spectra of camellia oils and soybean oils or camellia oils and corn oils is small. So, it is difficult to distinguish camellia oil from soybean oil or corn oil only by observing the three-dimensional fluorescence spectrum of camellia oil. A small program was written, and then the program was run on the 9.4 SAS software platform to transfer the two-dimensional function z=f(excitation, emission) into a one-dimensional function z=f(excitation-emission). The samples data matrix of the training set based on the one-dimensional function of the three-dimensional fluorescence spectra of plant oils was obtained. Orthogonal partial least squares discriminate analysis (OPSL-DA) on Simca 15. 0.2 software platform was used to construct the model for identification of camellia oil based on the training set. The parameter R2 representing the fitting ability of the model is 0.84; the parameter Q2 representing the predictive ability is 0.72, and the number of variables is 2. So the model is excellent. On this basis, a well-represented testing set is designed. There are 7 different brands of camellia oil, 18 adulterated camellia oils and 2 blind samples at the test set. The adulterants are soybean oil or corn oil or palm oil or cottonseed oil or cheap mixed oils, and the added levels are 4%, 10% and 16% respectively. Using the constructed model for identification of camellia oil, the 27 samples in the test set are predicted. The predicted results are all correct. The model can identify the adulterated camellia oil in the level of 4% adulterant, whose main components are very similar to camellia oil such as corn oil or soybean oil or mixed oil. Therefore, the model can quickly and effectively carry out the identification of camellia oil. The research of this paper provides a new way to apply three-dimensional fluorescence spectroscopy for rapid and effective identification of vegetable oil.
Dec. 01, 2020Vol. 40 Issue 12 3854 (2020)
Hui-qin YANG, Bo ZHANG, Ling MA, Yi SHANG, and Dong-li GAO
Potato is the fourth largest food crop in China, which has a comprehensive and reasonable nutrient composition and is easy to digest and absorb. Potato tuber is rich in phenolic substances such as chlorogenic acid, which has many health functions such as anti-oxidation, disease resistance, anti-cancer and lipid-lowering. Since chlorogenic acid is closely related to potato flavor, nutrition and resistance quality, systematic determination and analysis of chlorogenic acid content and distribution in different tissues of potato will provide a theoretical basis and reference for improving crop quality. The common cultivars of potato are autotetraploid, so it is difficult to improve potato varieties by cross breeding. While the diploid potato has more advantages in breeding and genome research due to its simple genetic background compared with the tetraploid potato. In this paper, natural variation population (C series) and self-cross separation of F2 population (151 series and RH series) of diploid potatoes were used. The content of chlorogenic acid in different tissues was determined by UV-Vis and the results were statistically analyzed by SPSS16.0. The results showed that, among the 131 samples selected, the chlorogenic acid content in potato leaves of series C is significantly higher than 151 series and RH series. The highest chlorogenic acid content in potato leaves of series C is 12 022.25 mg·kg-1 FW, the highest chlorogenic acid content in potato leaves of series 151 is 7 685.41 mg·kg-1 FW and the highest chlorogenic acid content in potato leaves of series RH is 5 486.46 mg·kg-1 FW. However, the uniformity and stability of C series are lower than 151 series and RH series. The content of chlorogenic acid in potato skin and flesh of C series (181 samples) was further determined and analyzed. The content of chlorogenic acid in potato skin is significantly higher than flesh. The highest content of chlorogenic acid in potato skin is 19 679.59 mg·kg-1 DW, while the highest content of chlorogenic acid in potato flesh is 2 927.52 mg·kg-1 DW. On the whole, the content of chlorogenic acid in potato flesh increased with the skin, but there is no linear relation ship. The content of chlorogenic acid in diploid potato was determined and analyzed, which provided a theoretical basis for the application of spectroscopic analysis in the study and breeding new potato varieties with a high content of chlorogenic acid and good flavor. At the same time, the results of the spectrometric analysis are of great significance in guiding breeding, determination and analysis of natural active substances and agricultural genome research, and also provide research and technical application basis for UV-Vis spectroscopy application in national potato program “Upotato Plan”, international agricultural genome program and intelligent agriculture.
Dec. 01, 2020Vol. 40 Issue 12 3860 (2020)
Chen YAN, Xue-song JIANG, Fei SHEN, Xue-ming HE, Yong FANG, Qin LIU, Hong-ping ZHOU, and Xing-quan LIU
Peanut is an important oil crop that is susceptible to Aspergillus infection to produce aflatoxins, of which Aflatoxin B1 (AFB1) poses a higher threat to humans and animals. The traditional AFB1 detection method is more complicated, such as cumbersome operation, the material is destroyed and long time-consuming. Therefore, it is of great significance to develop a rapid, non-destructive and suitable online detection method for peanut production and processing. Firstly, peanuts were purchased and stored at 28 ℃ and 85% relative humidity to mold. In the 0, 4, 6, 7 and 8 d time periods, the spectral and image information of peanut samples were collected dynamically at a rate of 0.15 m·s-1. After collecting the information, the AFB1 content in peanuts was determined by enzyme-linked immunosorbent assay (ELISA). Data processing steps are: pre-processing of spectra by multiple scatter correction, baseline correction, standard normal variable correction, and Savitzky-Golay smoothing, principal component analysis of spectral data in the range of 600~1 600 nm, 8 characteristic wavelengths (630, 1 067, 1 150, 1 227, 1 390 and 1 415 nm) are determined according to the principal component weight coefficient; the image is subjected to grayscale and threshold segmentation processing, and 12 image color feature parameters are extracted. Finally, using linear discriminant analysis (LDA) and support vector machine (SVM) to establish a qualitative discriminant analysis model for peanut samples (with a national standard of 20 μg·kg-1). ELISA results showed that AFB1 peanut exceeding 58%. Visible/near-infrared spectrum analysis showed that the absorbance gradually decreased with the increase of toxin intensification at the peak of 1 180 nm. Machine vision analysis showed that with the increase of storage time, the RGB value of peanuts decreased overall, the surface gradually dimmed and covered with hyphae, and the level of toxin infection gradually increased. The principal component analysis showed that the spectrum showed a clear clustering trend, but the clustering trend of image and data fusion was not obvious. LDA and SVM models constructed based on full-spectrum and characteristic wavelengths can quickly identify over- and under-standard samples, the best recognition rate based on the full-spectrum model is 92%, and the best recognition rate based on the characteristic wavelength is 88%; compared with spectral information modeling, the nonlinear SVM model performs better on image color feature parameter modeling , and the best recognition rate is 90%; combining the internal and external information of peanut samples, the SVM model based on spectral and image information fusion has the best discrimination accuracy of 92%. It is feasible to use the visible/near-infrared spectroscopy and machine vision technology combined with stoichiometry to realize the dynamic discrimination of peanut AFB1 content exceeding the standard, which provides a theoretical basis for the quality and safety detection of peanut.
Dec. 01, 2020Vol. 40 Issue 12 3865 (2020)
Shu-ning XUE, Yong YIN, Hui-chun YU, Yun-xia YUAN, and Shuai-shuai MA
In order to realize the spoilage warning of bananas during storage, hyperspectral data of bananas with different storage time was collected. The original spectrum was smoothed by Savitzky-Golar (SG) so as to obtain the spectral data with less noise interference. And a method of extracting the feature wavelength from hyperspectral information based on Wilks Λ statistic combined with principal component information fusion is proposed. The method could be described as follows: firstly, principal component analysis (PCA) was applied to the hyperspectral data after SG treatment, then the corresponding Wilks Λ statistics value was calculated for the each obtained principal component, and then the principal component variable with the lowest Wilks Λ value (the third principal component, PC3) could be selected. And the variation curve of combination weight coefficient corresponding to the original variable (each wavelength) of the PC3 was plotted. The wavelengths variable corresponding to the wave peaks and valleys in the weight coefficient curve were picked to be as the feature wavelengths. According to this method, totaling 9 feature wavelengths were extracted. At the same time, the color difference data of the banana was analyzed. By analyzing the trend of the L*, a*, b* and ΔE values of the test samples with the storage time, the position of the abnormal data point (inflection point) was found. Combined with the actual sensory situation, the spoilage benchmark was initially determined as the sixth storage day. In order to further illustrate the rationality of the given spoilage benchmark, the feature spectral data was used to make the average spectral reflectance curves of different storage time samples. It was found that the spectral reflectance values reached the minimum value at the 6th day of storage for the different feature wavelengths, which was consistent with analysis results based on the color difference index, it was further determined that the spoilage benchmark was indeed the sixth storage day. Thus, the benchmark information could be characterized by the feature spectral data of the sixth storage day, and then the feature spectral representation vector and corresponding covariance matrix of the spoilage benchmark could be generated. Finally, took the hyperspectral feature vector characterizing the spoilage benchmark as a reference point, a spoilage early warning model based on feature wavelength spectrum information during banana storage was established by Mahalanobis distance (MD) and was verified effectively. The results showed that the MD between the test samples and spoilage benchmark given by the early warning model was getting closer and closer with the extension of banana storage time, which was consistent with the actual process of banana spoilage. Therefore, the proposed hyperspectral feature wavelength extraction method, determination method of spoilage benchmark, the representation method and the hyperspectral warning model are suitable and effective for early warning of banana spoilage.
Dec. 01, 2020Vol. 40 Issue 12 3871 (2020)
Ya-hui LI, Yan-xiao LI, Wei-long TAN, Xiao-xia SUN, Ji-yong SHI, Xiao-bo ZOU, Jun-jun ZHANG, and Cai-ping JIANG
Lycium ruthenicum Murr. is a kind of traditional food with abundant nutrition such as polysaccharides, proteins, minerals and anthocyanins. It has a long history used as medicinal and food plants in China, meanwhile it has functions of scavenging free radicals, anti-oxidation, beautifying and regulating the human immune system. Lycium ruthenicum Murr. is mainly distributed in Tibet, Xinjiang, Inner Mongolia, Qinghai and Ningxia and so on. Different kinds Lycium ruthenicum Murr. have different kinds of quality. All of that can be calculated to high altitude, big diurnal amplitude and environmental aspect in different regions. Thereby, with the increase of demand for black Goji berry, there are miscellaneous black Goji berry priced at different price in the market. In order to rapidly and efficiently deter minute geographical origin and categories in Lycium ruthenicum Murr., Near infrared (NIR) and Fourier transform infrared (FTIR) spectroscopy was employed with the help of chemometrics. Five kinds of Lycium ruthenicum Murr. were analyzed. The 175 Lycium ruthenicum Murr. can be classified into 5 groups. Least-squares support vector machine (LS-SVM) was first performed to calibrate the discri mination model to identify the geographical origins and categories of Lycium ruthenicum Murr. LS-SVM model based on the combination of two spectroscopies were superior to those from either FTIR or IR spectra and the recognition rate of LS-SVM reached up to 99.17%, which showed excellent generalization for identification results. Polysaccharide contents were closely related with the quality of Lycium ruthenicum Murr. Synergy interval partial least squares (Si-PLS) was applied to develop the prediction model of polysaccharide contents. The model was optimized by a leave-one-out cross-validation, and its performance was tested according to the root mean square error of the cross validation (RMSECV) and correlation coefficient (Rc) in the calibration set. Experimental results showed that the optimum results of the Si-PLS model were achieved as follow: RMSECV=2.08%, Rc=0.976 9 and root mean square error of prediction (RMSEP)=2.40%, and correlation coefficient (Rt)=0.967 0 in the prediction set. Finally, the robustness of the LS-SVM model obtained was checked with the 15 new samples that did not belong to the calibration set. And, the calibration model obtained during the work was applied and the calibration values were compared with the external validation values. Si-PLS model provided RMSEP and Rt were 0.947 7 and 2.57% in external validation The overall results sufficiently demonstrate that the spectroscopy coupled with chemometrics has the potential to distinguish Lycium ruthenicum Murr.
Dec. 01, 2020Vol. 40 Issue 12 3878 (2020)
Wen-ke LIU, Yu-bin ZHANG, Ling-yan ZHA, and Yi-fei LIU
Red light and blue light are the main active spectra for plant photosynthesis and photomorphogenesis, also red and blue light LEDs have been the dominant light sources for hydroponic leafy vegetable production in plant factory. It is suggested that continuous light (CL) of red and blue light before harvest can improve the yield and quality of hydroponic leafy vegetables. In this study, effects of nitrate levels supplied and 72 h continuous light before harvest with the red and blue light on shoot dry weight and nutrient element content as well as accumulation were conducted using hydroponic method and ICP-AES analysis technology. Three nitrate levels (8, 10 and 12 mmol·L-1, N8, N10 and N12)and two light qualities (2R:1B and 4R:1B) of 150 μmol·m-2·s-1 were designed. The results showed that shoot dry weight increased with supplied nitrate level, and CL also improved shoot dry weight. Nitrate level did not alter N, C and P contents in lettuce shoot. However, Ca and Mg contents were improved with nitrate level increment, also K, Fe, Mn, Cu and Zn contents were decreased with the increase of supplied nitrate level. Moreover, nitrate level did not alter C, K, P and Fe accumulation in lettuce shoot. However, N, Ca and Mg accumulation were improved with nitrate level increment, also Mn, Cu and Zn accumulation were decreased with the increase of supplied nitrate level. Except for C element, contents and accumulation of other nutrient elements were subjected to nitrate levels and CL light qualities. Under N10 and N12 conditions, CL with 4R:1B is easier to obtain relatively high nutrient element content and accumulation. Through CL, C content in lettuce shoot was improved, but K, P and Fe contents were decreased, and N, Ca, Mg, Mn, Cu and Zn contents did not change significantly. However, CL promoted N, C, K, P, Ca and Mg accumulation in lettuce shoot, but did not alter microelement accumulation. In summary, high nitrate level and CL before harvest with 4R:1B spectrum facilitates high dry shoot yield of hydroponic lettuce and high contents and accumulation of most major and medium nutrient elements.
Dec. 01, 2020Vol. 40 Issue 12 3884 (2020)
Qun-wei LIU, Yong-ni SHAO, Xiao-wan CHEN, and Lin-hua JIANG
Heavy metals released by industry and transportation in daily life have a certain impact on the natural water environment. Microalgae, as the primary producer of the water environment is the first to be affected by lead. The subject tried to determine the degree of water pollution by studying the changes in the material composition of the algae. Traditional methods for studying biological macromolecules are complex and require the use of a large number of chemical reagents, so it is urgent to find new technology for the detection of microalgae substances. Terahertz and far-infrared technologies have high resolution, and the vibration frequencies of lipids, proteins and other substances are in the terahertz band, which provides a new technical means for studying the changes of microalgal matter. The terahertz and far-infrared spectroscopy was used to characterize the changes in biomacromolecules in S. obliquus cells under Pb stress. Fourier transform infrared spectrometer was used to collect the control group (0 mg·L-1) and experimental group (0.5, 5, 20 mg·L-1) Spectra of S. obliquus over time. Based on the characteristic absorption peaks of starch (9.1, 10.5, 17.2 THz) and carotenoids (16.7 THz), the starch content and carotenoid the change. At the same time, combined with chemometric methods, the principal component analysis was performed on the spectral data of 12 and 24 h stress time, which can easily distinguish the different experimental group samples of Pb stress from the control group. The results showed that under lead stress, the carbohydrate and carotenoid content in Scenedesmus obliquus gradually increased. Pb inhibits photosynthesis and affects the synthesis of polysaccharides and other macromolecules. The experimental results show that terahertz and far-infrared spectroscopy can be used as a fast and non-destructive method for the study of the changes in the composition of algae cells under lead stress, so as to determine the degree of water pollution.
Dec. 01, 2020Vol. 40 Issue 12 3890 (2020)
Hao-yue JIA, Gu-qing GUO, Fu-qiang ZHAO, Yong HU, and Chuan-liang LI
Surface hardness is a critical parameter to characterize steel properties. Its monitoring plays a key role in Industry. In the present paper, the spectral line intensities between element Fe Ⅰ 404.58 nm and Mn Ⅰ 403.07 was compared with 6 different hardness samples by using laser induced breakdown spectroscopy (LIBS) in self-built device in which laser energy was 30 mJ. The coefficient of determination for Mn (0.964) was better than Fe (0.916). The ratio of the Ferrum ionic to atomic spectral lines intensities(Fe Ⅱ/Fe Ⅰ)and laser induced plasma temperature have been characterized by the hardness of D2 steel for different heat treatments. The relationship has been obtained between surface hardness and the ratio of the Ferrum ionic to atomic spectral lines intensities (the coefficient of determination was 0.964). Fe Ⅱ 275.57 nm and Fe Ⅰ 276.75 nm were selected as analytical spectral lines. The relationship between surface hardness and laser induced plasma temperature has been established too (the coefficient of determination was 0.977). The hardness of D2 steel could be changed by different heat treatments, as well as the addition of alloying elements. For example, adding manganese into D2 steel could improve the hardness by refining grains. The correlation between Rockwell hardness of D2 steel for different content of manganese and Spectral signal intensity (Mn Ⅰ 403.07 nm) was established. The hardness of D2 steel does not increase monotonically with the increase of Mn content, but the spectral intensity changes consistently with the hardness. The experimental results validated that the element Fe and Mn, the Fe Ⅱ/Fe Ⅰ spectral lines intensities and laser induced plasma temperature had a good linear correlation with the hardness of D2 steel. And the different hardness obtained by different addition of Mn in D2 steel had a good linear correlation with a spectral intensity which verified the relation between hardness and spectral intensity. The determination of the surface harness via LIBS shows the feasibility of using LIBS as a reliable method for in situ industrial application for production control.
Dec. 01, 2020Vol. 40 Issue 12 3895 (2020)
Jia LIU, Xue-jing SHEN, Peng XU, Fei-peng CUI, Xiao-xia SHI, Xiao-peng LI, and Hai-zhou WANG
Aluminum alloy materials have been widely used in many industrial fields due to their advantages of easy processing, corrosion resistance and recyclability, and has become the second largest metal material after steel. In the face of the scarcity of mineral resources and the large number of aluminum products reaching the service life, the recycling of aluminum alloy is particularly important. Recycled aluminum is of great significance to the sustainable development of economy, environment and energy. At present, it is difficult to classify scrap aluminium alloys efficiently because of their various types and shapes, which leads to the degradation of high-quality aluminium alloys and the direct casting of aluminium ingots. Aluminum for aerospace is mainly made of 2xxx and 7xxx aluminum alloys. Due to the special use environment, aviation aluminum products have good quality and high value, and degraded use will cause huge waste. This paper automatically classifies aluminum alloys of aluminum 3xxx, 7xxx and A356 into a research target. Based on laser induced breakdown spectroscopy technology, an automated classification detection experimental platform was built. Image recognition is used to locate the dynamic sample, which is accurately captured by laser induced breakdown spectroscopy (LIBS). For the single-pulse LIBS spectral signal, the multi-dimensional Gaussian probability density distribution discriminant function of three series of aluminum alloys is established. Completed high-efficiency, high-precision continuous classification detection of 2xxx, 7xxx and A356 aluminum alloys. The experimental results show that the recognition time of the material in the 1.2 m·s-1 transmission process is 18 ms, the laser excitation control deviation is less than 20.83 ms, and the minimum size of the test sample is 25 mm. For the three series of aluminum alloy samples with a height difference of less than 3 mm, the average prediction classification accuracy of the multi-dimensional Gaussian probability density distribution method can reach 99.15%, and the average modeling time only takes 7 ms. Compared with the widely used support vector machine (SVM) classification method, the prediction accuracy is equivalent, and the modeling time is increased by order of magnitude. The generalization ability of the classification prediction is good and the modeling efficiency is high. This study validated the effectiveness of automated rapid classification and detection of aluminum alloys based on laser-induced breakdown spectroscopy. It provides a theoretical and technical basis for the establishment of a fully automated scrap metal sorting system.
Dec. 01, 2020Vol. 40 Issue 12 3901 (2020)
Hui WANG, Cheng JIN, Lei ZHAO, Lei YU, Fei LIN, Xiao-fei SUN, and Yun-hai JIA
Central segregation will inevitably occur in the continuous casting process, which will affect the homogeneity of steel. Serious central segregation will have a great impact on the structure, quality and performance of the steel. Therefore, accurate, rapid and convenient analysis of the element content distribution in steel will help guide metallurgists to quality control and process improvement. Original position statistic distribution analysis (OPA) is a quantitative statistic distribution technique of chemical composition and morphology in a large scale (cm2). It has been successfully used in the analysis of element segregation, porosity and inclusions in steel and super-alloy. In this paper, the element distribution of continuous casting round billet of 18CrNiMo7-6 low and middle alloy steel from the center to the edge was analyzed by original position statistic distribution analysis (OPA). The statistic conformity and statistic segregation of each sample at different positions were obtained. Meanwhile, each sample was analyzed 11 times by spark optical emission spectroscopy (OES)to obtain the relative standard deviation. The correlation of element distribution with statistic conformity, statistic segregation and the relative standard deviation was studied. The research showed that there was obvious segregation of P, Nb and S in each sample, and the statistic conformity was low. Their statistic segregation and relative standard deviation were high. The distribution of Cr, Ni, Mn, Mo and Si was relatively uniform, and the overall statistic conformity was high. Their statistic segregation and relative standard deviation were low. The sample of 6# in the center of the round billet had the most obvious segregation, the lowest statistic conformity and the hightest statistic segregation and the relative standard deviation. The samples of 3#, 7# and 4# near the center had obvious segregation, low statistic conformity, high statistic segregation and relative standard deviation. The samples of 9# and 10# at the edge of the round billet had minimal segregation, the highest statistic conformity, and the lowest statistic segregation and relative standard deviation. On the whole, each element distribution from the center to the edge was that the statistic conformity gradually increased, and the statistic segregation and the relative standard deviation gradually decreased. The results of statistic conformity, statistic segregation of OPA and that of the relative standard deviation of spark OES showed the same regularity in the element segregation of each sample. The trend of elemental content contours of each sample obtained from OPA also showed the same regularity with statistic conformity, statistic segregation and relative standard deviation. Therefore, the OPA technique can provide an accurate and rapid characterization of element distribution in materials, and provide a criterion method for material and process research to reflect the internal quality of materials.
Dec. 01, 2020Vol. 40 Issue 12 3906 (2020)
Wei-yi LIU, Yuan MENG, Bai-chuan JIN, Meng-yun JIANG, Zu-hong LIN, Li-yang HU, and Ting-ting ZHANG
The ecological risk assessments of heavy metal in river sediments is of great significance to study heavy metals pollution level, migration and transformation. The North Canal is an important sink in the Beijing-Tianjin-Hebei region, but the distribution characteristics and ecological risk assessments in the whole river are less known. In order to survey the occurrence of heavy metals in the sediments of the whole basin, 17 national and provincial control sections were selected from the upper, middle and lower reaches of the North Canal. Sediment samples were pretreated by aqua regia extraction, water bath digestion and BCR extraction. The contents of As, Cd, Cr, Cu, Mn, Ni, Pb, and Zn were measured by inductively coupled plasma emission spectroscopy (ICP-OES). The results indicated that the average content of heavy metals in the surface sediments declined as the following order Mn, Pb, Zn, Cu, Cr, Ni, Cd, As. The contents of Pb, Zn and Cu were higher than background values. It is noteworthy that the average value of Pb was 4 times more than their background value. Moreover, the values of different heavy metals varied significantly with the spatial reaches, and the contents in middle and lower reaches are relatively high. The metal speciation analysis indicated that Cd and Zn in the sediments were dominated by acid soluble and reducible species, and have high mobility and bioavailability. While As, Cr, Cu, Mn, Ni and Pb in the sediments were dominated by oxidizable and residual species, and have weak biological activities and pose little harm to the environment. The geological accumulative index (Igeo) indicates that anthropogenic sources mainly contaminated the surface sediments of heavy metals. Pb (Igeo=2.24) reaches the level of moderately to heavily polluted, Cu (Igeo=1.44) and Cr (Igeo=1.45) reaches the level of moderately polluted, Zn (Igeo=0.99) reaches the level of unpolluted to moderately polluted. The calculated values of Igeo for As, Cr, Mn and Ni were less than 0, indicating that As, Cr, Mn and Ni are all at practically unpolluted levels. The potential ecological risk index (PERI) indicated that the comprehensive ecological risk of the surface sediments was generally focused on Cd. The principal component analysis showed that the heavy metals in the surface sediments mainly originated from the discharge of industry and traffic, the unreasonable use of chemical fertilizers and atmospheric precipitation. Compared with other main rivers in China, the North Canal has lower heavy metal content in sediments. These results highlighted the effectiveness of remediation strategy in Beijing, Tianjin and Hebei, which has effectively reduced the risk of heavy metals in the North Canal and will provide important information for the management of the North Canal pollution control.
Dec. 01, 2020Vol. 40 Issue 12 3912 (2020)
Ming YIN, Jian-lin WANG, Hao-liang HUANG, Qiu-ping HUANG, Meng-meng YANG, Zheng-ping FU, and Ya-lin LU
Flavonoids are a large class of polyphenols widely distributed in plants in the form of free or glycoside, which has anti-oxidation, anti-bacterial, anti-viral, anti-tumor growth and other pharmacological effects. As an important active component of traditional Chinese medicine, they have high medicinal value and development prospect. In this paper, the biomolecular properties of eight common flavonoids, including baicalein, quercetin, naringenin, daidzein, baicalin, puerarin, genistein and gastrodin, were studied by terahertz time-domain spectroscopy (THz-TDS) in the 0.2~2.5 THz band. The results showed that these flavonoids have different characteristic absorption peaks in the terahertz band. The terahertz absorption characteristics with temperature variation in the range of 78~320 K were studied. The results showed that the characteristic absorption peaks gradually increased with the decrease of temperature, and the frequency position of absorption peak was blue-shifted. In addition, Qualitative identification and quantitative analysis of flavonoids were carried out by chemometrics combined with terahertz absorption spectra. First, the spectral characteristic variables were extracted by principal component analysis (PCA), then the first five principal components were used as input variables of support vector machine (SVM) to establish a classification model, and the optimal parameters were selected through the optimization model, and finally, the classification accuracy of 100% was obtained. In addition, the partial least squares regression (PLSR) model and the artificial neural network (ANN) model were used to analyze the flavonoids with different concentrations in starch quantitatively. By comparing the two methods, the ANN model obtained the highest prediction accuracy. The correlation coefficients of naringenin and daidzein in the prediction set were R2=0.994 4, R2=0.996 4, and the root means square error was RMSE=1.932 5 and RMSE=1.544 1, respectively. In summary, the biomolecular properties of flavonoids were studied by THz-TDS technology, and a rapid, effective and non-destructive qualitative identification and quantitative analysis of flavonoids were provided. This method has potential application value in the detection of Chinese herbal medicine, and has better reference significance for the study of other biomolecules.
Dec. 01, 2020Vol. 40 Issue 12 3919 (2020)
Cui-mei LIU, Yu HAN, Wei JIA, and Zhen-dong HUA
In this study, the infrared spectra (IR) of 301 new psychoactive substances (NPS) reference substances, including 100 synthetic cannabinoids, 81 synthetic cathinone, 42 phenethylamines, 9 tryptamines, 5 piperazines, 7 phencyclidine-type substances, 2 aminoindanes, 55 other types, were analyzed. The discriminant ability of IR for NPS, especially for NPS structural analogues, was investigated. The result showed that IR could well distinguish all kinds of NPS, even for some analogues with high spectrum similarity. IR has a high discrimination ability for 97% NPS, including alkyl chain-substituted regioisomers, ring-substituted regioisomers, different benzene ring disubstituted analogues, etc. The matching coefficient method is commonly used for spectral library search. The calculated matching coefficient value depends on several factors such as the quality of spectrum, software, algorithm, etc., so it is difficult to determine a universal threshold for positive detection. Therefore, the matching coefficient method can be only used for preliminary screening. Compared with the matching coefficient method, the characteristic peak method is more accurate and reliable for qualitative identification. Generally, eight absorption peaks with relatively high intensity in the range of 2 500~650 cm-1 are selected as characteristic peaks, but for some NPS structural analogues with similar spectra, it is necessary to select some low intensity but distinguishable peaks as characteristic absorption peaks. Only when all the characteristic absorption peaks are detected can the positive detection be concluded. According to this principle, characteristic absorption peaks of 168 regulated NPS were determined, and formed the IR method part of the industry standard “Forensic sciences—Examination methods for 168 new psychoactive substances including 2-FA in suspected drugs—GC-MS, IR and LC”. The rapid qualitative analysis of NPS by infrared spectroscopy based on a characteristic peak method will greatly improve the efficiency and reduce the cost of NPS qualitative identification analysis.
Dec. 01, 2020Vol. 40 Issue 12 3925 (2020)
Xue-yuan WANG, Jian-feng HE, Lin LIU, and Feng-jun NIE
The ability to resolve overlapping and weak peaks is the key index to measure the peak-finding ability of X-ray fluorescence spectroscopy. It is difficult for common peak-finding methods to simultaneously satisfy higher peak resolution ability and weak peak recognition ability. It is difficult to identify all characteristic peaks in X-ray fluorescence spectra of complex geological samples by a single common peak-finding method. Through the analysis of the derivative method, wavelet transform method and other classical peak-finding methods, we can see that derivative method has a strong ability to identify weak peaks, but the smoothness of the spectrum affects the results of peak-finding; wavelet transform method has a strong ability to distinguish overlapping peaks, but the choice of wavelet decomposition scale affects the results of peak-finding. In this paper, an adaptive peak-finding algorithm of X-ray fluorescence spectrum based on the derivative method and wavelet transform method is proposed. In the algorithm, continuous wavelet transform is applied to the original spectrum to obtain the wavelet transform coefficient spectra of different decomposition scales; then the first derivative peak-finding is performed on the wavelet transform coefficient spectra, and the results are combined; finally, the elements in the original spectrum are determined according to the energy scale of the X-ray fluorescence analyzer and the X-ray parameter table of element characteristics. In the process of peak finding, the algorithm does not need to smooth the original spectrum, nor does it need to determine the wavelet transform decomposition scale of the spectrum. The first derivative method, continuous wavelet transforms method, and the adaptive peak-finding algorithm was used to find peaks of the X-ray fluorescence spectrum of a standard sample. The experimental results show that the adaptive peak-finding algorithm has a high resolution of overlapping peaks and high recognition of weak peaks, which is better than the derivative method and the wavelet transform method in peak finding. The algorithm performs well in practical application.
Dec. 01, 2020Vol. 40 Issue 12 3930 (2020)
Shang-kun SHAO, Xue-peng SUN, Xiao-guang DU, Yu-fei LI, Ya-bing WANG, Xiao-yun ZHANG, Zhi-guo LIU, and Tian-xi SUN
In order to solve the problems of conventional pearl identification methods, which require the testing personnel to have rich experience, sample pretreatment, sample destruction and long detection time, a dual-mode pearl detection system based on X-ray transmission imaging and fluorescence was designed. X-ray attenuation coefficient could be calculated by the introduction of a thickness measurement system on X-ray transmission imaging system. The attenuation coefficient of the material can be calculated, which makes samples with the same X-ray absorption, different thickness and similar attenuation coefficient can be distinguished, and the resolution of the imaging system can be improved. The thresholds database of attenuation coefficients was established by measuring a large number of samples. By comparing the attenuation coefficient with the threshold value, the identification between different imitation pearls, pearls and imitation pearls could be realized. The content of Ca in freshwater and seawater pearls with similar attenuation coefficients is much larger than that of Sr, and the content of Sr in freshwater and seawater pearls is different. The ratio of contents of Sr and Ca be used to distinguish between freshwater and seawater pearls. Therefore, X-ray fluorescence analysis system is introduced. The fluorescence intensity ratios of Sr and Ca in fresh water and seawater pearls were measured, and the threshold value of the fluorescence intensity ratio between freshwater and seawater pearls was calculated by a large number of sample measurements, and the identification of freshwater and seawater pearls was performed based on the comparison between the measured values and the threshold values. The X-ray transmission imaging system and the X-ray fluorescence system introduced into the thickness measurement system cooperate to form a dual-mode system for identifying pearls. The experimental results show that the dual-mode system can distinguish between different imitation pearls, pearls and imitation pearls, freshwater and seawater pearls without destroying the sample. The dual-mode detection system can be used for online many-sample inspection in conjunction with the sorting system and has potential applications in such fields like the analysis identification of jewelry, ore, and lithoid flooring.
Dec. 01, 2020Vol. 40 Issue 12 3936 (2020)
Fang CHEN, Chao GAO, and Jie BAI
The high spectral resolution Fourier transform spectrometer used in the aerospace field mostly adopt the scheme with a beam splitter and compensator for light splitting. However, for the machining error, the thickness between splitter and compensator cannot match perfectly, and the matching error wound impact the interferometer modulation value which is an important parameter of the instrument SNR (Signal Noise Ratio). For the requirement of high SNR, the matching error (ME) between splitter and compensator must be limited, which means thickness matching design. Firstly, the impact caused by the thickness matching under different situation was analyzed with theoretical analysis, and then the formulas of additional optical path difference (OPD) and signal intensity are given. Secondly, the interference signal caused by ME is visually displayed with Zemax simulation and it can be obviously observed that the modulation value decreases with the increase ME. Furtherly, the view field of the extended light source will cause oscillation in the incidence angle of non-central light of field, which can increase the variance range of OPD and enhance the influence on modulation with ME. Beyond that, for the wave number difference between the light source and metering laser, the dispersion effect will be introduced into the spectrometer system and the ME will enhance the influence on the signal with dispersion effect. For phase retrieval requirement, the ME must be limited to ensure that the dispersion phase difference is no more than 2π. Finally, based on the theoretical analysis, the design principle of the thickness matching between splitter and compensator was summarized, and it provided a design method for the tolerance analysis of the interferometer, which will improve the performance of the Fourier transform spectrometer.
Dec. 01, 2020Vol. 40 Issue 12 3941 (2020)
An-bing ZHENG, Hui-hua YANG, Xi-peng PAN, Li-hui YIN, and Yan-chun FENG
With the expansion of online pharmacies, more and more counterfeit drugs without drug patents or licenses will appear in the markets with forged brand packaging. It is inevitable that the low-cost drug products will be sold at a high price if there are no methods to identify the source. These drugs evade drug supervision and approval procedures, harm the interests of consumers and bring great risks to the whole drug market. Near infrared spectroscopy (NIR) has the advantages of low cost, direct measurement, non-destructive testing and on-site testing. It is especially suitable for the rapid modeling and analysis of drugs in the condition that there are effective feature extraction and appropriate classifiers. Meanwhile, Auto-encoding is an important branch of deep learning method, which is mainly used for extracting non-linear dimensional reduction feature of data, and Variational Auto-encoding (VAE) is the most popular Auto-encoding algorithm in recent years, it has strong feature extraction ability and is widely used in computer vision, speech recognition and other fields, yet there is no report on the NIR analysis. Based on VAE, through a specially designed artificial neural network structure and loss function, this paper constructs NIR classification model for multi-category and multi-manufacturer drugs. Four kinds of drugs (metformin hydrochloride tablets, chlorpromazine hydrochloride tablets, chlorphenamine maleate tablets, cefuroxime ester tablets) produced by 29 manufacturers were used as the experimental objects to establish the multi-class classification and identification experiments. Compared with SVM, BP-ANN, PLS-DA and sparse Auto-coding (SAE), deep belief network (DBN), deep convolution network (CNN), etc., the algorithm has excellent classification performance, good robustness and scalability.
Dec. 01, 2020Vol. 40 Issue 12 3946 (2020)
Xian-qing WANG, Tong WEI, Yong YANG, and Yan-guo SHI
Glutamate decarboxylase (GAD) catalyzes an α-decarboxylation reaction of glutamate to produce γ-aminobutyric acid (GABA). Interestingly, two kinds of mung bean [Vigna radiate (L.)] GADs were firstly extracted and purified in this research. Two GADs in mung bean were both dimers with a molecular mass of 155 kDa (GAD1) and 75 kDa (GAD2). The enzymatic properties of GAD1 and GAD2 were detected in this research. Infrared spectroscopy analysis revealed that more higher-ordered structure contents, α-helix and β-sheet structures, was found in GAD2, which determined the higher stability of GAD2. It was analyzed by Raman that the molecular structures of GAD1 and GAD2 are generally “exposed”. Fluorescence analysis revealed that GAD1 had a more flexible and exposed molecular structure, while the conformation of GAD2 was more compact and conservative. It was found that pH and temperature-induced structural change decreased the enzyme activity. Ca2+ was involved in binding the calmodulin-binding domain of GADs and induced a “buried” and compact structure. The unfolding of GAD induced by SDS, impaired the enzyme activity. KI, MgSO4, AgNO3, and SDS significantly inhibited GAD1 and GAD2 activities. Tween 80, Ca2+ and Cu2+ could significantly activate GAD1 and GAD2, and Fe2+ only increased GAD2 activity.
Dec. 01, 2020Vol. 40 Issue 12 3953 (2020)
© Copyright 2018-2021 | Chinese Laser Press.
All Rights Reserved 沪ICP备15018463号-20