


Please enter the answer below before you can view the full text.

2020
Volume: 39 Issue 2
18 Article(s)

Yanwen SHENG, Huasong LUO, Jinping SONG, Jinli ZHAO, and Xuebo ZAHNG
As the strategic core regions of national economic development, the urban agglomerations in the eastern coastal area of China has played a critical role in the implementation of innovation-driven development strategy and construction of the innovative country. Based on the dataset of innovation input and output spanning the 2001-2015 period, the SFA method and spatial Durbin model are applied to measure and examine the innovation efficiency and its influencing factors and spatial spillover effect in the five major urban agglomerations. Our results suggest that the innovation efficiency of five major urban agglomerations showed a steady increase over the studied period. Among the five urban agglomerations, the innovation efficiency in the Beijing-Tianjin-Hebei region rises slowly while that of Shandong Peninsula has increased relatively fast. The growth rate and average of innovation efficiency in the Yangtze River Delta fell behind the Shandong Peninsula and Beijing-Tianjin-Hebei region. Meanwhile, innovation efficiency in core cities of urban agglomerations is low, although they have high-input in innovation resources. Moreover, there is a significantly positive spatial spillover effect of innovation efficiency between cities in the five urban agglomerations. Economic development, agglomeration economies, FDI, the quality of labor force, the financial support by government, infrastructure, secondary industrial ratio and high-tech industries have direct and indirect effects on innovation efficiency in the urban agglomerations.
Feb. 20, 2020Vol. 39 Issue 2 257 (2020)
Guojun ZHANG, Juehan WANG, Kunjin WU, and Zhihua XU
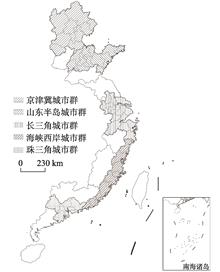
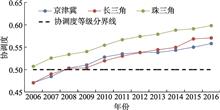
This paper analyzed the spatial-temporal pattern of the degree of coordination between economic and environmental development in Beijing-Tianjin-Hebei region, Yangtze River Delta and Pearl River Delta from 2006 to 2016 by means of entropy method, Theil index, Markov chain and spatial autocorrelation, and then explored the influencing factors with Tobit model. The results showed that: (1) The degree of coordination between economic and environmental development of the three major urban agglomerations grew continuously from 2006 to 2016. In addition, the differences between the cities gradually narrowed. (2) Path dependence played a role in the evolution of the level of economic and environmental coordination. However, the degree of coordination between economic and environmental development tended to reach a higher level with the passage of time. (3) Cities with higher administrative levels and some developed cities along rivers or the sea continued to be at a higher level of degree of coordination between economic and environmental development. (4) The spatial characteristics of the degree of coordination between economic and environmental development of the three major urban agglomerations had changed from decentralization to agglomeration. (5) Regarding the type of development, the economically developed cities tended to develop simultaneously with the environment. (6) Energy consumption, progress in science and technology, investment in fixed assets, dependence on foreign investment and ownership structure have impacts on the degree of coordination between economic and environmental development of the three urban agglomerations as a whole and each urban agglomeration, but the significant degree of the influence of each factor is different.
Feb. 20, 2020Vol. 39 Issue 2 272 (2020)
Qingyu FAN, Shan YANG, and Xin HU
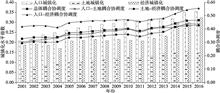
With the transformation of China's urbanization, how to measure the coupling and coordination relationship between population, land and economy in the process of urbanization, and explore the temporal and spatial dynamics of its evolution process, has become an important scientific issue in the study of new urbanization in human geography. By constructing the model of coupling coordination degree, based on the coordinated development level of each subsystem in the process of urbanization in the Yangtze River Delta in the past 16 years, this paper analyzes the interaction process of urbanization coupling coordination, and explores the coupling mechanism of the formation of urbanization coordination space agglomeration in the study region by using spatial variogram, LISA time-space transition and other methods. The results show that: (1) with the remarkable improvement of population, land and economic urbanization level in the region, the evolution of the overall and the coupling coordination of population-land urbanization, land-economy urbanization and population-economy urbanization degree shows a steady convergence phenomenon; (2) the spatial agglomeration degree of the coupling coordination degree of urbanization is increasing year by year, and the scope of spatial correlation has been expanding continuously, basically forming a spatial pattern of "one pole alone, triangle core, peripheral low-level"; (3) from the perspective of the urbanization coupling level transition path of each city, most of the cities show a synergistic growth trend, indicating that the overall coupling coordination degree has obvious path dependence and space locking characteristics; (4) the evolution of urbanization coupling coordination level from the stability and equilibrium to polarization agglomeration state mainly comes from the interaction of land-economy, and the evolutionary power from polarization to equilibrium state comes more from population-land interaction. The study of the interaction process and mechanism of urbanization coordination provides a theoretical basis and direction for the construction and coordinated development of the Yangtze River Delta urban agglomeration.
Feb. 20, 2020Vol. 39 Issue 2 289 (2020)
Haitao MA, Shuo LU, and Wenzhong ZHANG
Urban agglomeration is not only the main form of new urbanization, but also the incubator of innovation. Theoretically, there is a complex interaction between urbanization subsystem and innovation subsystem in urban agglomeration. The Beijing-Tianjin-Hebei urban agglomeration is a national-level urban agglomeration designated by the national new urbanization planning, and it takes "the new engine of national innovation-driven economic growth" as its core function positioning. Therefore, exploring the coupling relationship between urbanization process and innovation and development of Beijing-Tianjin-Hebei urban agglomeration is beneficial to understand the relationship between urbanization and innovation and the development of this urban agglomeration. The comprehensive evaluation index system of urbanization and innovation is constructed by combing the internal theoretical relationship between two subsystems of urbanization and innovation. With the help of coupling coordination degree model and geo-detector factor detection method, this paper analyzes the evolution process and mechanism of coupling coordination relationship between urbanization and innovation in the Beijing-Tianjin-Hebei urban agglomeration. The findings: (1) The comprehensive level of urbanization and innovation in the study area presents a trend of steady growth, and the coupling and coordination relationship between urbanization and innovation also develops in a good direction on the whole, but the comprehensive level and coupling relationship are different in space. Specifically, the gap between the high level of Beijing and Tianjin and the overall low level of 11 cities in Hebei is obvious. (2) The Beijing-Tianjin-Hebei urban agglomeration has been characterized by the coupling coordination type of innovation lag since 2007. Moreover, most of the cities in recent years show the type of coupling coordination of innovation lag, which can be clearly concluded that the main reason for the coupling coordination level of this urban agglomeration in the past period of time is that the innovation level is relatively inadequate to support the urbanization. (3) The interaction between urbanization and innovation in the Beijing-Tianjin-Hebei urban agglomeration is very significant, especially the impact of economic urbanization and social urbanization on innovation, and the impact of innovation resources on urbanization is more prominent. It is also found that the role of innovation ability in promoting urbanization is relatively inadequate during the study period. In the future, the key direction of promoting the coordination level of urbanization and innovation coupling in the Beijing-Tianjin-Hebei urban agglomeration is to accelerate the improvement of urban agglomeration and the comprehensive level of innovation in each city.
Feb. 20, 2020Vol. 39 Issue 2 303 (2020)
Zhiding HU, Fenglong WANG, Ning AN, Yu WANG, Tao SONG, Fei PENG, Guangqiang HE, Teng MA, Qi QIN, and Chenran XIONG
The Western-oriented foreign political geography and geopolitics theories provide a good reference and basis for the development of Chinese political geography and geopolitics. In this sense, it is a very vital issue related to the direction-guiding for the disciplines of Chinese political geography and geopolitics, in particular in regards to how to rationally treat the studies of political geography and geopolitics in the West as well as how to correctly handle the relationship between these subjects' localization and internationalization within China. Nevertheless, the current development of China's political geography and geopolitics still has confusion and even dilemma on this issue. On the one hand, the over-reliance on the Western research frameworks and theories has brought certain risks to the discipline construction of Chinese political geography, while on the other hand, we cannot move towards the extreme of closedness or even xenophobia while being cautious about Western research, and most importantly we must break up the trap of "Chinese particularism" while breaking "Westernism". To this end, young scholars engaged in political geography and geopolitical research in domestic Chinese universities and research institutions have voluntarily organized a Youth Forum themed on "The Frontiers of Political Geography and Geopolitical Theories" in 2019, which focused on the references and reflections on the development of Western political geography and geopolitics, and reached preliminary conclusions. Most specifically, the multi-scale nature of Western political geography topics, the diversity of research methods, the critical spirit of the research atmosphere, the internationalization of research horizons, and the integrity and standardization of research paradigms are worthy of reference for Chinese political geography, and meanwhile Chinese political geographers should avoid the lack of historical perspective, imbalanced knowledge production, inadequate map space expression, excessive discourse analysis, and inadequate solutions to real problems that are identified in the forum discussions. We hope that this discussion will attract more scholars to jointly promote the development of the disciplines of Chinese political geography and geopolitics.
Feb. 20, 2020Vol. 39 Issue 2 217 (2020)
Chen ZHANG, and Zhenfang HUANG
In the information era, both the tourists and destinations are greatly affected by the information over the internet. Referring to tourists, they usually record their needs, hobbies, experiences as well as social relationships through internet; besides, a tourist would make a decision to travel to a particular place largely due to someone else's microblog or online travel note. Referring to destinations, information platforms, such as online social media, are gradually becoming important channels for destination image projection and communication; on the other hand, based on the reception and utilization of multi-source information on the internet, the managers and practitioners of destinations would make or change their decisions referring to the operation and management of the destination, and accordingly change the status of destination in the real world. To a great extent, the arrival of the information age has endowed human-environment relationship with new connotations, characteristics and forms. A new pattern of interaction between tourists and destinations with the intervention of network information has been formed. To understand this new relationship, finding the ways to promote the integration and sustainable development of this relationship based on it, is gradually becoming an important and urgent new proposition given by tourism geography research. In view of this, this study proposes a novel framework of human-environment relationship in "tri-space". Tri-space consists of three different spaces called geographic space, humanistic space and information pace (or cyberspace). Among them, geographic space is the physical space carrying tourism resources, facilities and activities within a specific region; humanistic space is the space constructed by tourists themselves referring to a specific region, which can be viewed as an explicit or implicit space; information space is a virtual space constructed by mass network information related to the tourism of a specific region. The concept of tri-space combines human, place and information together into an organic whole, with each sub-space interacting with each other. Machine learning techniques, the core techniques of artificial intelligence (AI), can be used to construct the metrics and measures of tri-space, discover the interaction mechanism in tri-space, and further build the co-reaction patterns of tri-space. Tri-space and its interaction view extend the traditional 'flat' human-environment relationship into a 'cubic' one, and further disclose a link between virtual/actual tourists and destinations, which provides a novel, systematic view of research on human-environment interaction.
Feb. 20, 2020Vol. 39 Issue 2 232 (2020)
Xingnan LIU, Zhifeng WU, Renbo LUO, and Yanyan WU
With the development of the economy, most cities will expand continuously to the surrounding areas, thus leading to the emergence of urban fringe areas with both urban and rural characteristics. The urban fringe area, located between urban and rural areas, is the most intense area of urban land use change and one of the most likely areas for urban construction land expansion in the future. How to identify urban fringe accurately and quantitatively is of great significance for urban planning and sustainable land use. However, most existing methods about the delineation of urban fringe area is just based on one or one type of indicators, and the judgment result is too fragmented to reflect the continuity of the urban spatial structure. What's more, the urban preset boundary range, the water body and the urban green space have great interference with the judgment results of urban fringe. In view of the above problems and from multi-perspective of nature, population and social economy, this paper defines urban fringe based on deep learning and multi-source data (remote sensing image, population density and POI big data). Furthermore, the proposed method has been used to detect the urban fringe area of Guangzhou city in our experiments. The results show that: (1) This method can divide the city into urban core area, urban fringe and rural area accurately without the impact of the preset boundary range. Eventually, this way can eliminate the fragmentation caused by the internal water and green space of urban areas. (2) The results of urban fringe area are well coupled with the road network. Network distribution of the urban core area is densest, followed by the urban fringe area. (3) The spatial distribution of urban core area of Guangzhou from the experiments is reasonable and consistent with the actual situation. All in all, the proposed method can consider comprehensively multi- perspective factors and detect urban fringe effectively, thus can provide better guidance for formulation of policies for urban development, such as urban planning, sustainable development, and urban statistical analysis.
Feb. 20, 2020Vol. 39 Issue 2 243 (2020)
Xueqin WANG, Wei QI, and Shenghe LIU
Small towns are regarded as an important carrier to promote China's new urbanization. Understanding the spatial characteristics of small towns in China has become an important issue. This paper explored spatial distribution pattern of small towns in China using the nearest neighbor distance, point density and other spatial analysis methods. In addition, the driving factors, including economy, population, location and natural environment, were analyzed. Our main results were summarized as follows: (1) From the perspective of the national level, spatial density of small towns in southeast China was higher than that in the northeast China. There were three clusters of small towns. The first one was the bow-shaped cluster, covering the Yangtze River Delta, Shandong Peninsula and Beijing-Tianjin-Hebei region. The second one was the inverted T-shaped cluster, covering the Pearl River Delta and central Hunan. The third one was a circle-shaped cluster, which was mainly distributed in the Chengdu-Chongqing region. (2) In addition to the clusters, small towns were mainly located along π-shaped belts, along the Lianyungang-Lanzhou Railway, the Yangtze River and the coastline. (3) From the perspective of regional level, small towns in most provincial-level units were evenly distributed. However, the gaps of spatial densities of small towns between different provinces were significant. (4) Only a few provincial-level units were characterized by the concentrated pattern of small towns, including the border provincial-level units and Sichuan province. (5) Spatial distribution of small towns was affected by multiple factors, including natural environment, population density, economic development level, location advantage, road traffic conditions and political factors. In the future, more preferential policies are suggested to enhance the development of small towns in northwest China. Small towns around urban clusters and provincial capitals should focus on improving the development quality. In the small towns located in agricultural areas, mountainous areas and remote rural areas, more attention should be paid to economic construction and enhancement of road accessibility. Our research aimed to promote development of small towns and accelerate the implementation of new urbanization and rural revitalization strategies.
Feb. 20, 2020Vol. 39 Issue 2 319 (2020)
Ze HE, Yu YANG, Yi LIU, and Fengjun JIN
Under the new normal of China's economy development, it is necessary to recognize the leading industries in China's special development zones for promoting economic transformation and industrial upgrading. In this paper, spatial characteristics and influencing factors of leading industries in China's national level economic and technological development zone (ETDZs) are studied based on Ripley's K function and geographically weighted regression methods. The results show that: (1) The manufacturing industry has the absolute advantage in the leading industries of the ETDZs. The spatial agglomeration of leading industries shows the characteristics of spatial scale differentiation and attenuation. (2) From the perspective of industrial organization in the ETDZs, the single and double elements mode play a major role in leading industrial organization. (3) The conditions of the ETDZs have a relatively limited effect on promoting the agglomeration of technology-intensive industries. The supporting function of the city to the industrial agglomeration is negatively related to the investment intensity of the urban fixed assets. The ability of utilizing international capital has a strong correlation with industrial upgrading in the ETDZs. Toward to China's economic transformation and industrial upgrading, the ETDZs should deepen reform in this field. At the same time, two "capital relations" should be handled well, namely, the investment relationship between the ETDZs and the city as well as the relationship between the ETDZs and the international capital.
Feb. 20, 2020Vol. 39 Issue 2 337 (2020)
Haiping ZHANG, Xingxing ZHOU, Guoan TANG, Lei ZHOU, and Xinyue YE
Catering service is an important part of urban life. Extracting urban hotspots for catering services and identifying their spatial distribution patterns is important for our understanding urban space and urban structures. In view of the shortcomings of quantitative analysis of urban morphological features based on POI in the past, the GIS field model was used to identify the spatial distribution patterns of urban feature elements, and the Geo-information Tupu was used to visualize the patterns. Taking the 47100-catering service POIs in the main urban area of Jinan city as the main data source, the catering service hotspots were first extracted based on the density field hotspot detection model and classified according to the density value; then the catering service was expressed by Geo-information-Tupu of generalized symmetric structure and digital field based hierarchical Geo-information Tupu. The spatial distribution structure characteristics and scale structure features of the hotspots are presented, and their Geo-information Tupu of distribution pattern is constructed. Finally, the results are discussed. Research shows that: (1) The digital field hotspot detection model can effectively identify hotspots in different levels from POI. (2) The Geo-information-Tupu of generalized symmetric structure and digital field based hierarchical Geo-information Tupu can analyze and express the spatial distribution structure and hierarchical structure characteristics of the food hotspot from the aspect of vertical and horizontal of space. In summary, this study provides an effective quantitative analysis method for POI-based urban feature extraction and urban morphology research. The method can also be extended to the extraction, analysis and expression of other urban feature elements.
Feb. 20, 2020Vol. 39 Issue 2 354 (2020)
Xiaofei CHEN, Jiehui YANG, Enru WANG, and Changhong MIAO
Structural characteristics and power hierarchy are important elements of urban networks. This paper studied the selection of China's automobile industry supply chain system in 2012 by using "China automobile industry enterprise information Daquan", "China industrial enterprise database" and "China automobile supplier network", and analyzed the characteristics of China's urban network from the perspective of "industry-location". The results showed that: Firstly, based on the supply chain system of automobile industry, China's urban network showed obvious structural characteristics of "low density, multi-core, high clustering, less convergence". Secondly, there existed a "paradox" between the structural characteristics and power levels of cities in the urban network, which means that the network status depended not only on the number of linked cities, but also on the spatial attributes and capital capacity of the associated networks. Thirdly, the urban network power level included not only the leading core cities such as Shanghai and Chongqing, but also the central intensive cities such as Guangzhou and Wuhu, and the power gateway cities such as Suzhou and Chengdu. The result suggested that the "alter-based centrality" and "alter-based power" could not only effectively reveal the real power attribute of China's urban network nodes, but also kept more in line with the unbalanced law of geographical space of economic phenomena. Fourth, leading core cities, including Chongqing, Shanghai, Tianjin, Changchun, Beijing, Shiyan, etc., did not completely take over the six major automotive agglomerations in China, among which Yangtze River Delta region was at the highest level in the power hierarchy whereas the Pearl River Delta region was at the bottom. Finally, it should be noted that the supply chain system of automobile industry was only a special situation between "urban agents", and its research conclusions could not be infinitely copied and promoted, and could not replace the relevant conclusions of other factor flows.
Feb. 20, 2020Vol. 39 Issue 2 370 (2020)
Xiaoming YAO, and Shengjun ZHU
Under the background that the market-oriented reform of China's banking industry, business restrictions and geographical restrictions of some banks are gradually lifted, and competition among banks is becoming increasingly fierce, re-adjusting the spatial distribution of bank sub-branches has become one of the essential ways of development. This paper focuses on the spatial evolution path of sub-branches in China's banking industry from 2007 to 2016. By referring to the industrial association thought in evolutionary economic geography, this paper puts forward two important variables to construct an interpretative framework, namely the financial relationship of local industry and the financial relationship of inter-regional investment flows. Considering gradual reform of China's banking industry, this paper also makes a comparative analysis according to the ownership and assets of banks. It is found that local financial relationship of industrial structure and investment flows can attract bank branches significantly, which will increase with banking market competition. The mechanism of factors can change with the banking market environment and the growth process of banks, showing the characteristics of stages. Finally, the individual heterogeneity can also influence the evolution path of bank sub-branches.
Feb. 20, 2020Vol. 39 Issue 2 384 (2020)
Li XIE, Zhichao ZHOU, Peipei YOU, and Yingkai SUN
The asymmetry of grid corporations' cost information caused by their monopolistic characteristics, not only restricts the effectiveness of government supervision, but also leaves consumers with little trust in electricity pricing. Therefore, it is of great theoretical and practical significance to evaluate the reasonable level of cost expenditure of grid corporations. From the perspective of spatial benchmarking, taking the operation and maintenance costs of different branch companies in state grid corporation of China as study samples, this paper uses Gini criterion to fuse the results calculated by various DEA models, and then conducts a spatial hierarchical cluster analysis. The results show that: First, the total cost of operation and maintenance in most provincial grid corporations are at reasonable level, while the component cost of some provincial grid corporations are not. Secondly, corporations with higher operating performance level have higher marginal cost of performance improvement, which makes it easier to incur unreasonable cost expenditure. Thirdly, when choosing cost benchmarking standards for different grid corporations, we should not only choose the corporations with higher reasonable level of cost expenditure as reference, but also adjust the frame of reference system at any time according to the principle of dynamic reference.
Feb. 20, 2020Vol. 39 Issue 2 399 (2020)
Shengrui ZHANG, Yingjie WANG, Hongrun JU, and Linsheng ZHONG
The land border tourism in China serves as a pillar industry in the local economic development and is becoming an important sector for international cooperation. Based on literature review and field surveys, this paper investigated the quantity, types and quality of land border tourism resources of prefectural-level city in China. In addition, the Chinese Land Border Tourism Development Database was established with another two indicators of land border tourist number and land border tourism revenue between 2006-2015. The paper further analyzed the spatial pattern of land border tourism development from the view of spatial variation and spatial association. The influencing factors and suggestions for land border tourism development were offered. The results showed that there were 3341 units of land border tourism resources in China, 34.36% of which were of high quality. Buildings and facilities were the most common types of tourism resources. The spatial difference of the land border tourism resources was obvious. The overall coefficient of variation (CV) is 70.55% and the CVs of astronomical phenomena and meteorological landscapes, tourism commodities and human activities were higher than 100%. The high-high clusters and low-low clusters were apparent in the southwest and northeast of China, indicating that the land border tourism resources in the southwest region were rich and that in the northeast needs to be better developed. During 2006-2015, the land border tourism economy grew fastest in the northwest of Xinjiang and the east of Heilongjiang province. The hot spots of the land border tourism economy occurred in the northeast of China, while the cold spots appeared in the east and southwest of Xinjiang as well as the southwest of Tibet. The location advantage, terrain, cultural diversity, the relationships between neighboring countries and public facilities were the main factors influencing the patterns of land border tourism resources and economy. It was suggested that the government should adjust the management policies based on the characteristics of local resources, develop different types of resources comprehensively, strengthen the cooperation domestically and internationally, improve the public facilities and protect the local environment and ethnic culture.
Feb. 20, 2020Vol. 39 Issue 2 414 (2020)
Yaxiang LIU, and Yangbing LI
Based on the hypothesis analysis of the land use function evolution of the basin in Guizhou province, this paper quantitatively explores the characteristics and rules of the spatial-temporal evolution of the land use production function under the background of rural transformation and development. The Lianjiang basin, located in Huishui County, Guizhou province, is chosen as the study area. The data comes from high resolution image interpretation and field surveys during 6 periods from 1966 and 2016. The results show that: (1) The spatial pattern of production function of the basin in karst mountainous areas can be effectively identified by the quantitative diagnostic model of the basin's production function; the model of dynamic evolution monitoring can reflect the dynamic spatiotemporal evolution of the basin's production function. This process is dominated by the "Single-Path" at the beginning and then turns to "Multi-Path". (2) During the study period, the reconstruction of the functional space of the basin in Guizhou has indeed occurred, and the overall functional structure of the basin has been transformed from the traditional agricultural production function to the layout of modern agricultural production functions. The microscopic spatial layout in the former is centered on the location of the town in the basin, and then it is reduced like a strip around the same center. The latter expanded in strips along the north-south road of the basin. (3) The traditional agricultural production function presents a changing trend featured by "Slight increase-Smooth reduction-Quick reduction", while the non-traditional agricultural function reflucts the change characteristics of "Stable fluctuations-Small increase-Rapid increase". The diversity of non-traditional agricultural production functions continues to increase, and the turning point of the production function transformation in the basin is 2010. (4) At the same time, this paper qualitatively discusses the driving force system and action process of the spatio-temporal evolution stage in the land use function of the basin. The results have enriched the microscopic cases of land function transformation in typical geomorphic regions (basin), the research methods make up for the deficiencies of the "macro-analysis" and "low space-time identity" of the method of transect research. It is of practical significance to optimize the allocation of local land resources and implement micro-land management and rectification according to local conditions.
Feb. 20, 2020Vol. 39 Issue 2 430 (2020)
Meijiao LI, Fanneng HE, Fan YANG, and Liang ZHAO
Based on the historical registered data on taxes-cropland and military-oriented cropland, population data, and the historical records on taxation system and land system in the Ming Dynasty, this paper analyzed the reliability of these data, and identified the main impact factors which may lead to the difference between historical registered data and real cropland area. Then, the provincial cropland areas for 1393 and 1583 were reconstructed. The results are shown as follows: (1) The main factors which lead to the difference between historical registered data and real cropland area include record errors, classified statistics of taxes-cropland and military-oriented cropland, and registration and taxation of non-cropland, including mountain, pond, lake, and marsh. (2) Because of the record errors, the registered taxes-cropland areas of Henan and Huguang provinces for 1393 were greater than their actual taxes-cropland areas. And the revised results of the two provinces were 0.41×10 6 mu (Chinese area unit, 1 mu=666.7 m 2) and 0.18×10 6 mu. The total military-oriented cropland area of the study area was 56.2×10 6 mu in 1393. (3) According to the historical records, in 1391, the proportion values of non-cropland data to the total taxes-cropland data were 24.7%, 23.3%, 4.4%, and 3.7% in Zhejiang, South Zhili, Jiangxi, and Huguang provinces, respectively. And in 1583, the proportion values of non-cropland data to the total areas of taxes-cropland and military-oriented cropland in the four provinces were 28.9%, 16.2%, 19.2%, and 11.6%, respectively. (4) The total cropland area of the whole study area increased from 495.5×10 6 mu in 1393 to 754.3×10 6 mu in 1583. In the study period, changes of the reclamation rate presented obvious regional differences. The reclamation rates of Henan and Shandong provinces increased by roughly 15 percentage points, Huguang and Sichuan provinces increased by more than 3 percentage points, and Zhejiang, Jiangxi, Fujian, and border areas increased by less than 1 percentage point. Reconstruction of historical land use and cover change at regional level is not only an objective requirement for regional eco-environmental effects simulation, which can provide a reference for enriching and improving global datasets.
Feb. 20, 2020Vol. 39 Issue 2 447 (2020)
Yimeng JIAO, Na ZHAO, Tianxiang YUE, and Jiayin DENG
It had been proved that the process of urbanization had an effect on extreme weather events under the global warming. This study analyzed the urbanization effects on extreme climate events for the period 1980-2014 by classifying 20 meteorological stations into urban, suburban, and rural categories, based on the daily precipitation, temperature data and raster data of socio-economic, population, land cover and the night-time light images combined with cluster analysis and analytic hierarchy methods. The results show that the number of extreme cold events in Beijing showed decreasing trends, while that of the extreme warm events exhibited increasing trends, and the extreme precipitation events showed no obvious change trend. Compared with rural sites, urbanization has a significant impact on extreme temperature events. In urban areas, the number of extreme cold events was reduced faster; that of extreme warm events increased faster; and the daily-temperature-range significantly became smaller than that in urban areas. Compared with the decreasing trends of annual precipitation and annual rainfall days at rural sites, urbanization increased total precipitation amount. Besides, the urbanization in Beijing slowed down the growth trend of consecutive dry days, and at the same time, it intensified the extreme heavy precipitation events. However, the impact of urbanization on extreme precipitation events is not significant.
Feb. 20, 2020Vol. 39 Issue 2 461 (2020)
Lu LU, Erfu DAI, Qianding CHENG, and Zhenzhen WU
Identifying the characteristics of nitrogen output during the paddy field drainage period was critical to control of nitrogen pollution output in the reclamation paddy area. In this study, a paddy field and ditch system in Abujiao basin was selected as the study area. Combined with isotope tracer technique, the characteristics of nitrogen output and the reduction mechanism of nitrogen in paddy fields and ditch systems during the paddy drainage periods were systematically studied. The results showed that ponding drainage period was the most significant period for nitrogen output from paddy fields, mainly controlled by chemical fertilizer application. During this period, total dissolved nitrogen, ammonia nitrogen and nitrate nitrogen discharge load accounted for 42.57%, 69.73% and 54.89% of the year's total amount, respectively. There are distinct differences of nitrogen reduction mechanism in paddy fields and ditch systems for three drainage periods, indicated by results from variation characteristics of nitrogen and nitrate isotopic tracers. During the ponding drainage period, the ammonium nitrogen decreased significantly, almost half ammonium nitrogen reduced during six-day sampling period. Isotopic tracers showed that the removal process was mainly controlled by the nitration process. During the rainfall drainage period, the nitrate nitrogen concentration decreased by 24.00%, while the ammonium nitrogen increased by 26.04%. Mixed with rainfall (high δ 18O-NO3- values and low nitrate concentration) might explain the elevated δ 18O-NO3- values and linear reduction process of nitrate in the ditch. The fluctuation of ammonium nitrogen might be linked to the input of ammonium nitrogen in paddy fields and the minerali-zation of soil nitrogen. During the sunning drainage period, the reduction processes of nitrogen were more complicated, and isotopic tracer signals were not obvious. The ammonium nitrogen concentration decreased by 52.07%, which might be associated with absorption by vegetation.
Feb. 20, 2020Vol. 39 Issue 2 473 (2020)
© Copyright 2018-2021 | Chinese Laser Press.
All Rights Reserved 沪ICP备15018463号-20