


Please enter the answer below before you can view the full text.
2020
Volume: 39 Issue 1
15 Article(s)

Pengfei LIU, and Bindong SUN
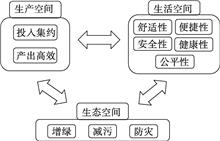
As the main carrier of population and socio-economic activities, cities are also the places that accumulate the problems from production, living and ecological activities. In order to evaluate the quality of urban production-living-ecological space, this paper develops an evaluation index system based on its theoretical framework, and then analyses the overall characteristics and spatial distribution of the production-living-ecological space quality. Moreover, this paper explores the factors that may affect the quality of urban production-living-ecological space. Using data from 289 prefecture-level cities and above in China in 2015, we find that: (1) the urban production-living-ecological spatial quality is generally at a low level and decreases from the southeast coastal areas to the west and northeast inland areas. (2) The quality levels of production space in the northeast region and living space in the western region are significantly lower than those of other parts of China, and the quality level of ecological space depends on local natural ecology and pollution control. (3) While the quality levels of production and living spaces have a significantly positive correlation, the quality levels of production and ecological spaces show an opposite trend in quite a number of cities. (4) The urban production-living-ecological space quality is associated with the population size and administrative level in an inverted U shape. Specifically, cities with a population size between 10 million and 15 million are more conducive to improve the quality level of production-living-ecological space. Urban production-living-ecological space quality is positively associated with per capita GDP, and cities with comprehensive functions or located in urban clusters have a higher level of production-living-ecological space quality. The above conclusions provide important policy implications for deepening and implementing the planning of China's major function oriented zoning, regional development planning, and even the comprehensive spatial planning under construction from the perspective of production-living-ecological space, as well as directive guidance for urban development strategy and overall planning in different regions. On the whole, the optimization potential of urban production-living-ecological space should be fully released, especially more attention should be paid to the coordination of production-living-ecological space. Different regions should take overall consideration and make up for the shortcomings based on actual conditions respectively.
Jan. 20, 2020Vol. 39 Issue 1 13 (2020)
Zhen YANG, Xiaolei ZHANG, Jiangang LI, Jun LEI, and Zuliang DUAN
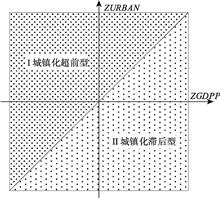
The study on the spatial pattern of the relationship between urbanization and economic development has a more clearly practical significance for the choice of regional urbanization and economic development path. However, the existing research on the relationship between China’s urbanization and economic development (RCUED) lacks the fine depiction of the prefecture-level units. Using 2000 and 2010 census data and the statistical analysis method, we uncovered the evolution characteristics of China’s urbanization and economic development and conducted a quantitative identification for the RCUED with improved methods using the quadrant map approach. In addition, we investigated the spatial correlation effect of the RCUED using the spatial autocorrelation analysis method. The results were as follows: 1) In general, a high degree of matching exists between China’s urbanization and economic development at prefecture-level units at the significance level of 0.01. The correlation coefficients between China’s urbanization and economic development in 2000 and 2010 were 0.684 and 0.741, respectively. 2) A significant regional difference exists in the RCUED at prefecture-level units. Based on a comparative analysis of 341 prefecture-level units in China in the two years, we found that prefecture-level units can be categorized as under-urbanization, basic coordination and over-urbanization in various areas. The distribution of the relationship between the urbanization and the economic development within provinces was similar, that is, most of the provincial capital cities were ahead of urbanization. 3) The distribution of the RCUED presents a significant spatial correlation and agglomeration effect. Over time, the spatial dependency of the RCUED has weakened and the spatial heterogeneity has increased. Northeast China has always been an area characterized by over-urbanization. The number of prefecture-level units classified as under-urbanization has begun to decline in Yangtze River Delta, and that of the Qinghai-Tibet Plateau has gradually increased.Meanwhile, prefecture-level units rich in resources have transformed from over-urbanization into under-urbanization along the northern border. There is a certain degree of path dependence effect in the change of typological areas of the RCUED. Units with “ Under-urbanization-under-urbanization” and units with “over-urbanization-over-urbanization” account for 73% of the total number of prefecture-level units in China, and they have evident spatial differentiation characteristics.
Jan. 20, 2020Vol. 39 Issue 1 25 (2020)
Lizi DENG, and Jigang BAO
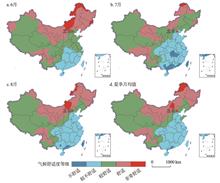
Comfortable climate consists of summer comfortable climate and winter comfortable climate. Insofar there has been little, if any, academic attention paid to the dichotomous climates, especially in terms of the characteristics as well as differences embedded in their spatial distribution across China. Building upon the statistics collected by 2132 national meteorological stations in China during the period of 1981-2010, this study has bridged this insufficiency in the extant literature. Specifically, climate comprehensive comfort index is calculated, using the Temperature-Humidity Index (THI), Wind-Chill Index (WCI) and Index of Clothing (ICL). Also, employing the Cokriging spatial interpolation method, this study sheds light on the characteristics and differences of the spatial distribution of summer comfortable climate and winter comfortable climate in China. As the research result manifests, (1) Summer comfortable climate in China is located in the frontier regions of Northwest and Northeast China lying north of 40°N, the central part of Northwest China and Southwest China. In contrast, the winter comfortable climate is mainly distributed at low latitudes, particularly lying south of the Tropic of Cancer. Specifically, it includes Hainan province and the southern part of Yunnan province, Guangxi Zhuang autonomous region, Guangdong province, and Fujian province. (2) Since the weather and climate in most parts of China are perceived not so comfortable, especially over the Bohai Bay, the Yangtze River Delta as well as other economically developed and densely populated regions, and the development of these dichotomous comfortable climates appears to be potentially rewarding. (3) In addition, the dichotomous comfortable climates show obvious geographical separation characteristics, as there are few places that enjoy both summer comfortable climate and winter comfortable climate. (4) Overall, the winter comfortable climate could be a scarce resource with monopoly characteristic in China, while, the resource of the summer comfortable climate seems not so rare, in view of its relatively wide distribution. This study provides a wealth of insights that potentially hugely enrich the pre-exiting theories concerning spatial distribution of comfortable climates in China. Meanwhile, a scientific basis for the development of favorable climatic resources is contributed, accordingly.
Jan. 20, 2020Vol. 39 Issue 1 41 (2020)
Caizhi SUN, and Qifei MA
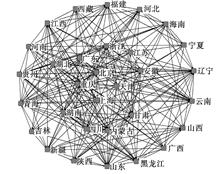
In recent years, China's economic development has maintained rapid growth, and the demand for water resources is also increasing day by day. However, shortage of water resources and inefficient use of water have become an obstacle to the sustainable development of China's social economy. The research on spatial correlation network characteristics of China's water resources green efficiency can lay a foundation for optimizing the overall spatial pattern of China's water resources green efficiency and realizing the cross-regional synergistic promotion of it. Therefore, from the perspective of Group Frontier, this paper divides 31 provincial-level regions in China into three groups: eastern, central and western. It uses SBM model to measure the green efficiency of water resources in different areas, and uses VAR Granger causality test to transform "attribute data" of water resources green efficiency into "relational data". On this basis, the spatial correlation network characteristics of water resources green efficiency in China are studied by means of social network analysis. The results show that the regional differences in China's water resources green efficiency are significant, and the overall performance is characterized by central > eastern > western region. The spatial correlation of the water resources green efficiency of between provinces of China presents a more complex network structure, all regions are in the spatial correlation network of water resources green efficiency, and the network overall has the strong stability. The individual characteristics show that the eastern region is dominated by spillover effect, which plays a role of "engine" in the optimization of national water resources green efficiency, while the western region is dominated by the spillover from other regions, which is in the edge position in the network structure. Block model analysis shows that there are 10 provinces in "net overflow" plate such as Beijing and Tianjin, and 8 in "net benefit" plate such as Qinghai and Xinjiang, and 6 provinces in "two-way overflow" plate such as Hebei and Chongqing, and 7 in "brokers" such as Henan and Shaanxi. The results provide suggestions for the improvement of water resources green efficiency and the coordinated development in different regions of China.
Jan. 20, 2020Vol. 39 Issue 1 53 (2020)
Defeng ZHENG, Shuai HAO, Leting LV, Wenjin XU, Yanyan WANG, and Hui WANG
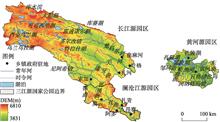
It is of great significance to carry out the research on the changes of National Park ecosystem services and the trade-off and synergy to realize the strictest ecological protection, promote the construction of ecological civilization and realize the sustainable development of the region. In this paper, the Three-River-Source National Park was taken as an example. Firstly, the terrestrial ecosystem service accounting method was used to measure the ecosystem services (including 4 kinds and 11 types) from 1990 to 2015, and we revised the accounting results by using the contribution rate of ecosystem services value. Then the characteristics of its temporal and spatial changes during the study period were analyzed. Finally, the trade-off/synergy relationships among multiple ecosystem services were quantitatively analyzed based on bivariate local spatial autocorrelation and correlation coefficient in different periods. The results showed that: (1) The value of the ecosystem services of the Three-River-Source National Park increased from 54.237 billion in 1990 to 83.47 billion in 2015, an increase of 29.233 billion, or up by 53.90%, and the average growth rate at each stage was 9.01%. The value ratio of ecosystem services of the Changjiang and Huanghe river source national parks is consistent with the overall situation of the park, and the water areas provided the highest value of ecosystem services, followed by grassland and wetland. Grassland and water supply more than 90% of the ecological services of the park. But the grasslands provided the highest (70.58%) value of ecosystem services in the Lancang River Source National Park, and followed by wetlands (23.58%) and water areas (3.38%). (2) The ecosystem services value increased from northwest to southeast in Changjiang and Lancang river source national parks, but the ecosystem services value presented the characteristics of "higher in the east but low in the west" in Huanghe River Source National Park. Correlation analysis showed that synergy was the dominate relationship among ecosystem services in the Three-River-Source National Park, but the correlation degree among ecosystem services varied. (3) In quantity, the global Moran′s I index and the correlation coefficient of the trade-off and synergy among the four typical ecological services were consistent. And there was significant heterogeneity of trade-off/synergy relationships among multiple ecosystem services in terms of spatial pattern.
Jan. 20, 2020Vol. 39 Issue 1 64 (2020)
Jiashu SHEN, Ze LIANG, Laibao LIU, Delong LI, Yatong ZHANG, and Shuangcheng LI
The construction of Xiong'an New Area is crucial for generations and a national affair of China. Under the concept of ecological priority and green development, exploring the associations between ecosystem services is of vital significance for optimizing territory development plan and realizing the sustainable management of natural resources. In this study, four ecosystem services were quantified based on multi-sources data. The associations among ecosystem services were analyzed by using correlation analysis and ecosystem service bundles were identified by applying the self-organizing feature map, in the expectation of providing a scientific basis for balancing the planning and construction of Xiong'an New Area. The results showed that the supply of biodiversity protection service presented an increasing trend from the northeast to the southwest; the delivery of food production service was higher in Anxin county and Rongcheng county than that of Xiongxian county; the higher provision of water yield service mainly occurred in the southwest, while the lower provision of water yield service occurred primarily in the northeast; the recreation service supply was higher in the north-central part of Xiong'an New Area and lower in the southeast. Most of the associations among ecosystem services are synergistic and have less trade-offs. Four ecosystem service bundles were mapped with different main land use classes and supplies of ecosystem services. The food production bundle was predominantly covered by the dry lands and had the highest supply of food production service. The cultural entertainment bundle also primarily contained dry lands and dominated in providing recreation service. The ecological conservation bundle mainly consisted of water bodies, dry lands and forests, which had the highest delivery of biodiversity protection service. The urban life bundle was associated with urban areas and some paddy lands and showed a high provision of water yield service. On the basis of the characteristics of different ecosystem services supplies bundles, the suggestions were put forward for rationally determining the timing and location of changing land use types and promoting the sustainable provision of multiple ecosystem services in Xiong'an New Area.
Jan. 20, 2020Vol. 39 Issue 1 79 (2020)
Ze LIANG, Jiao HUANG, Feili WEI, Jiashu SHEN, and Shuangcheng LI
Urban agglomeration, as an emerging phenomenon in many urbanized areas worldwide, is considered as a highly developed spatial form of integrated cities. Cities are highly linked within an urban agglomeration, which renders the agglomeration one of the most important carriers for global economic development. In recent years, the study of urban agglomeration has become an important agenda both for urban planning and urban sustainable development. However, in the research community, there is still a lack of a consensus with regard to how to delineate the urban agglomerations in geographic space. Particularly, in many urban planning cases, functional links among cities are often neglected, resulting in overestimated spatial ranges of the planned urban agglomerations. The aim of this paper is to develop a method for the identification of the spatial range of urban agglomerations by using night-light remote sensing data, digitally mapped points of interest (POI) and the "point-axis" theory in economic geography. Firstly, based on a review of the "point-axis" theory in economic geography, we developed a concept of "developing axis" with two basic characteristics and used the concept to describe the four development stages of urban agglomerations. Then, we calculated two indexes to quantify the intensity and its changes in socio-economic activities by combining nighttime light remote sensing images and POI data. After that, we conducted a clustering analysis on the two indexes to identify and extract the "point-axis cluster", and overlaid it with the administrative boundaries to obtain a set of candidate urban agglomerations. Finally, we used socio-economic statistic data and formulated criteria based on previous studies to select urban agglomerations. Using this method, a total of 14 urban agglomerations in China are identified. Among which, eight have spatial ranges match their planning documents. As for the mismatching urban agglomerations, three different types of mismatch are distinguished, which indicate that different types of problems need to be considered in the planning. The results show that the proposed method can overcome the restriction of administrative boundaries in the identification of the spatial range of urban agglomerations, objectively reflect the strength of social and economic links among cities, and help to identify potential urban agglomerations with a dynamic perspective. This research can provide useful implications and suggestions for urban agglomeration planning and management.
Jan. 20, 2020Vol. 39 Issue 1 92 (2020)
Jinya LIU, Dongchuan WANG, Ranhao SUN, Feicui WANG, Bingxu HU, Junhe CHEN, and Zhichao SUN
In view of the shortcomings of the existing research which has split the basic change process of ecological land loss. Based on the land use data of the Beijing-Tianjin-Hebei urban agglomeration in 1984, 2000 and 2015, the trajectory analysis method was used in this paper to identify the temporal and spatial dynamics of land use change in the study area. In other words, the spatial correlation characteristic of ecological land loss in the Beijing-Tianjin-Hebei urban agglomeration was explored from the perspective of process integrity. On this basis, the spatial autocorrelation analysis method was used to explore the spatial autocorrelation pattern of forest loss, grassland loss and water loss at different scales, and find out the high-incidence area of ecological land loss in this region. At the same time, from the perspective of the integration of the eco-environment of the urban agglomeration, the exploratory suggestions or countermeasures against the loss of ecological land use was proposed. The results showed that (1) From 1984 to 2015, the main changes in land use of the study area were the loss of forest, grassland, water and farmland, and 40% of the lost area turned into artificial surface. (2) The spatial autocorrelation of forest loss, grass loss, and water loss increased with increasing spatial scale. In the 7 km × 7 km spatial scale, There was a strong spatial positive correlation between the three types of ecological land loss, and the spatial positive correlation gradually decreased with the increase of the distance threshold. (3) Under the distance threshold of 10 km, the high incidence areas of forest loss and grassland loss were concentrated in the northwestern part of Beijing-Tianjin-Hebei urban agglomeration, and the high incidence areas of water loss were concentrated near the eastern Bohai Bay. From the perspective of coordinated development of the study area, the eco-environmental protection should resolve differences and unbalanced development and promote the integrated development of this urban agglomeration.
Jan. 20, 2020Vol. 39 Issue 1 103 (2020)
Shengsheng GONG, and Yun CHEN
(3) In Southern China, residents' health level is moderately positively correlated with the health resources level (r=0.49), but in different cities, the contributions of health resources level to residents' health level are different, which shows significant spatial heterogeneity effects.
Jan. 20, 2020Vol. 39 Issue 1 115 (2020)
Zimo LI
Cholera was a new type of severe infectious disease which was introduced into China around 1820 in the Qing Dynasty (1644-1911), and the "localization" process was completed rapidly. At present, it is still one of the major threats to the health and safety of human life, and sometimes it causes heavy casualties. In this paper, the spatial-temporal analysis, danger simulation, and boundary detection methods are used to analyze the cholera epidemic in the late Qing Dynasty (1816-1911). The results showed that: 1) because of the strong intervention of cholera, the frequency of the cholera was 77% in the last 100 years in the late Qing Dynasty (1816-1911) which was equivalent to outbreak every 1.3 years, and the contribution rate to the epidemic breadth promotion in the late Qing Dynasty (1816-1911) was about 21.32%, which means that nearly a quarter of the epidemics in the whole Qing Dynasty (1644-1911) were caused by cholera. 2) Cholera had a wide range of suitable habitats in China of the late Qing Dynasty (1816-1911), and the eastern coast was the best suitable habitat. The risk level of cholera epidemic in China was high, and the risk level gradually decreased from east to west, and the risk level in the south was higher than that in the north. There were many factors influencing cholera epidemic, in which the distance from sea level, elevation, sunshine hours, and the maximum temperature were the main factors, and their contribution rates were 29.3%, 22.4%, 16.1% and 7.7%, respectively. This indicates that cholera epidemic was sensitive to geographic factors such as temperature, water source, sunshine and topography. 3) The borderline characteristics of cholera epidemic were obvious in the late Qing Dynasty (1816-1911). The first border was a circular arc with Fengyang as the center and Fengyang-Jiajiang as the radius (the linear distance about 1300 km), which contains about 97.65% of cholera epidemic in this area. The second border was the borderline of cholera high-suitability area, which includes eastern and central provinces of China, such as Anhui, Jiangxi, Hubei , Hunan, and so on. The third border is the enclosed area with the main cholera network as the standard, covering the Bohai Sea, central China, Yangtze River Delta and Pearl River Delta. Almost the entire eastern coastline was covered.
Jan. 20, 2020Vol. 39 Issue 1 129 (2020)
Shuangshuang LI, Feng KONG, Lu HAN, Junping YAN, Chengbo WANG, and Yaqun WU
The questions concerning how much precipitation is extreme and how extreme precipitation responds to warming are important to improving climate resiliency and achieving sustainable development of typical loess hills and gullies in China. The spatial-temporal variation of extreme precipitation is investigated on the Loess Plateau in northern Shaanxi province from 1970 to 2017. To understand the influence of El Ni?o on extreme climate variation, this study analyzes whether extreme precipitation events are linked to the SST in nine different sea regions (NINO 1+2, NINO 3, NINO 3.4, NINO 4, NINO W, NINO A, NINO B, NINO C, NINO Z). The result showed that from 1970 to 2017, an obvious warming-wetting trend occurred on the Loess Plateau in northern Shaanxi. The warming process can be divided into three periods: a rapid increase period (1970-1998), followed by a short hiatus (1999-2012), and finally, a warming rebound period (2013-2017). In addition, precipitation was dominated by interannual oscillation. However, after 2004, precipitation increased in northern Shaanxi, which was associated with semi-arid boundaries moving to the northwest. The result also showed that 16 extreme climate indices were quantified as precipitation changes that were more intense on the Loess Plateau in northern Shaanxi. Spatially, regarding the number of precipitation days when daily precipitation was above 1, 5, 10, or 20 mm, there was a clear increasing trend from south to north. Even so, the region showed a consistent and significant change in the number of decreasing rainy days and increasing SDII. Finally, in the past 48 years, the influence of SST on the central and western equatorial Pacific, for the decadal variation of extreme precipitation, was more obvious than that in the eastern equatorial Pacific. Additionally, while the influence of SST on the northern side of the equatorial Pacific was more obvious than that on the southern side, the effect by the SST periodic variation on the 14~16a time scale was more significant than that on the 4~8a time scale. It is worth mentioning that changes in nearly all indices had a strong correlation to NINO W, especially the intensity indices (Rx1day, Rx5day, and SDII) and the indices defined on a percentile-based threshold (R95, R99, R95P, and P99P). The anomaly of SST in the Nino W region served as a typical signal that there was an increase in occurrence of extreme precipitation in northern Shaanxi.
Jan. 20, 2020Vol. 39 Issue 1 140 (2020)
Shudi XIE, Xingguo MO, Shi HU, and Xuejuan CHEN
Exploring the responses of vegetation greenness to temperature and precipitation can provide scientific basis for vegetation construction in the Three-North Shelter Forest Program. Based on MODIS NDVI and meteorological data from 2000 to 2015, the path analysis method was used to analyze the direct and indirect effects of climatic factors on vegetation greenness in different growth stages. It was found that the multi-year mean NDVI in the growing season showed a decreasing trend from east to west, and the value was listed as follows: forest > cropland > grassland. Vegetation greenness presented an upward trend during the past 16 years, and the most noticeable increases in NDVI occurred in cropland. In the growing season, temperature rise inhibited vegetation growth, while the contributions of precipitation to NDVI were positive. Precipitation is the key meteorological factor affecting vegetation greenness in the Three-North Shelter Forest Program. When the influence of precipitation change was not considered, the warming promoted the NDVI, but the decrease of precipitation caused by warming in the growing season led to the inhibition effect. Precipitation increase was favorable to greenness enhancement in different periods, the orders of influence degree of precipitation on NDVI were, in turn, the end of growing season, the middle of growing season and the early growing season. The effects of temperature on vegetation greenness varied at different stages of the growing season. Warming in early growing season was beneficial for the vegetation growth, but in the middle and the end of growing season, it showed negative effect on plant productivity enhancement. Among them, the negative effects of warming in the end of growing season were mainly realized by direct effects, while they were mainly realized indirectly through precipitation changes in the middle of growing season. This research showed that the impact of climate change on vegetation depended on the time scale. Therefore, it is necessary to distinguish the periods in assessing the response of vegetation to climate change so that we can obtain a comprehensive understanding.
Jan. 20, 2020Vol. 39 Issue 1 152 (2020)
Peng LI, Min ZHAO, Watson Alan, Peng YANG, and Dan YU
The Wild and Scenic Rivers System (NWSRS) of the United States designated the earliest protected river system in the world. After 50 years of existence, the system continues to grow and to fulfill the promise of the original legislation. National Wild and Scenic Rivers (NWSR) are linear, and cross boundaries, including federal, state and private lands, and represent a variety of ecosystems and serve a variety of human populations. This paper uses available NWSRS and other biophysical river data, US natural ecological and socio-economic data, GIS and other analysis softwares for development of graphical overlays and correlation analysis. There are currently 208 NWSRS units, unevenly distributed across the United States. Parameters of this system can be analyzed, based on a Kernel Density tool to calculate the density of selected features in a neighborhood around those line or point features. A linear density measure is the length of NWSRs in each state. Based on these analyses, this paper further discusses the relevance of this distribution to natural and socio-economic variables in the US. The results show that while the NWSRS units in 40 of 50 states, three states far exceed the others: Oregon, Alaska and California. There is only one unit of the NWSRS in each of 18 states in the United States, most of which are located in the eastern region. In addition, 10 states, concentrated in the Great Plains, do not have NWSRS units. High density of NWSRS units occurs in three physical geographical regions: the Pacific Coast, the high mountains, and the Rocky Mountains. Low densities of NWSRS units are found in the Plains and the Atlantic Plain. NWSRS units are distributed in Polar, Humid Temperate, Dry, Humid Tropical Domains; and only one ecological Division of the US has no NWSRS units. NWSRS units are mainly concentrated in four major continental watersheds: the Pacific Northwest, California, Alaska and Great Lake. The correlation between line density of NWSRS units and population density and level of economic development is not strong, but it is closely related to high dams. There are many reasons for the current spatial distribution of the NWSRS, especially the ideology behind political motivations for legislative protection. A guiding ideology for river conservation is needed, river designation recommendations must pay attention to key areas which have unique societal values and threats to those values, and establishing protected area selection criteria. A national system plan is needed.
Jan. 20, 2020Vol. 39 Issue 1 166 (2020)
Hui WANG, Weixin LUAN, and Minjie KANG
In the past 30 years, the Bohai Sea's environment has undergone tremendous changes. The input of land-based pollution is the main cause of the deterioration of the Bohai Sea's environment. In order to study the spatial relationship between the pressure intensity of land-based pollution and the pollution of the sea area, the three transport spaces from the catchment area to the estuary of the sea and the affected sea area are overall considered. The hierarchical nested water pollution output zoning method is adopted to divide the Bohai Sea area into 23 land-sea integrated management zones, which have spatially linked land-based pollution pressures with pollution in the Bohai Sea. Based on the data of the land use, socio-economic statistics and pollution census, the total nitrogen emissions of five types of social and economic activities in the Bohai Rim region were estimated, and then the land-based pollution pressure of each sub-unit was analyzed. The results show that: 1) The total nitrogen emissions of social and economic activities around the Bohai Sea area are about 850, 000 tons, among which, agricultural and rural non-point source pollution is the main source of nitrogen pollution, accounting for 57.4% of the total emissions, while the contribution of industrial emissions to nitrogen pollution is limited, accounting for 7.4% of the total emissions, and the living emission of urban residents is outstanding, accounting for 35.2% of the total emissions. 2) The nitrogen emission intensity of each catchment areas of land source is spatially highly coupled with its corresponding sea area pollution, which indicates that, the 23 land-sea integrated management zones classified in this paper are reasonable and operable. 3) The pollution pressures between the 23 land-sea integrated management zones are huge. The sub-area land source pollution pressures in the surrounding areas of Liaodong Bay, Bohai Bay and Laizhou Bay are relatively high. The pressures in other subareas are relatively low. 4) The pollution sources in the main catchment areas have obvious differences. The source of pollution between various sub-areas is significantly different. The main source of nitrogen pollution in Bohai Bay is residents' living emissions, Liaodong Bay industrial pollution is relatively prominent, and Laizhou Bay agricultural non-point source pollution accounted for a large proportion. Considering the spatial difference of pollution source structure, the management of land-based pollution should take catchment area as a unit to manage and control major pollution sources. 5) The pressure of land-based pollution in the Bohai Sea is difficult to alleviate in a short term.
Jan. 20, 2020Vol. 39 Issue 1 186 (2020)
Jun SUN
“Putting Science in Its Place: Geographies of Scientific Knowledge” by David N. Livingstone is a striking, fascinating, and unusual book that suggests that geography does not play a prominent part in the critical exploration of science. This book advocates a broader context in which the geography of scientific knowledge (GSK) should be dealt with as another field of science studies, like the history of science, the sociology of science, and the sociology of scientific knowledge, and that “geography” in science studies should be examined from multifarious contexts. Currently, GSK has indeed been recognized as an important academic field, especially in science studies. Focusing on “Putting Science in Its Place” and considering the reviews on this masterwork, and relevant research, this paper provides a critical review on why GSK is relevant now, how it offers critical responses beyond the current academic trends, and whether it is capable of investigating the geographical features of contemporary scientific knowledge (and broadly, of knowledge beyond science, such as indigenous knowledge). It discusses that, although “space” and “geography” were inescapable perspectives on explaining the globality of science in traditional science studies, they were understood as either logically metaphysical or logically metaphysical concepts. As a result, space and geography were not intrinsic variables for the globality of science. The success of GSK in highlighting “thinking geographically” resides within its ability to transcend the spatial problem of science, especially the dualism of “placelessness” and “placeness, ” which is contrasted with the tendency to regard space as the external condition of science in traditional geographical research on science. Based on a critical investigation produced by scientific knowledge, which circulated in various locales and claimed that scientific knowledge could be global through various geographical agents, GSK affirmed the consciousness that science is essentially a geographical enterprise. Beyond that, an emphasis on the spatial sensitivity of the production and circulation of contemporary scientific knowledge and the involvement of post-colonial research has brought GSK into a broader perspective. Thus, GSK must create a separate framework in response to what it ignores. The conclusion suggests that Chinese scholars can make a more critical contribution to GSK if the current theoretical presuppositions—which mainly focus on the West—are reexamined, if special geographical questions on Chinese scientific knowledge are explored, and if new insights are imported promptly and critically.
Jan. 20, 2020Vol. 39 Issue 1 200 (2020)
© Copyright 2018-2021 | Chinese Laser Press.
All Rights Reserved 沪ICP备15018463号-20