


Please enter the answer below before you can view the full text.

2020
Volume: 75 Issue 3
15 Article(s)

Jun XIA, Yongyong ZHANG, Xingmin MU, Qiting ZUO, Yujian ZHOU, and Guangju ZHAO
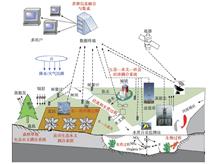
Ecohydrology is a key discipline developed in recent decades, which can give aid in the protection and restoration of complex ecological systems (e.g., mountain, river, forest, farmland, lake), ultimately promoting the ecological civilization construction and the green development of China. In this paper, the progress and existing challenges of ecohydrological discipline are elaborated, and the future development directions are proposed according to the international scientific frontiers and national demands on ecological civilization construction. The main directions are to develop new ecohydrological monitoring methods and improve comprehensive observation network of ecohydrological systems; to perfect the ecohydrological mechanisms and their basic theories; to promote the integrations of multi-scales and multi-elements by considering both terrestrial and aquatic ecosystems; to promote the multidisciplinary integrations between ecohydrology and social sciences. Furthermore, specific future research interests in China are proposed as follows: multi-source information fusion and comprehensive monitoring system construction, spatio-temporal patterns of key ecohydrological elements and their variation characteristics; integrated models of ecological, hydrological and economic processes and their uncertainty estimation; interdisciplinary studies including physical and social sciences. The application prospective in China is further explicated in a variety of ecosystems (e.g., forest, grassland, river and lake, wetland, farmland and urban area). This paper is expected to provide a reference to support the development strategy of the ecohydrological discipline in China, and to give a theoretical foundation and technical support for the implementation of national ecological civilization construction.
Mar. 25, 2020Vol. 75 Issue 3 445 (2020)
Bin MA, and Bo ZHANG
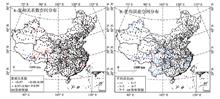
In this study, the spatio-temporal distribution characteristics of the climatic seasons in China from 1961 to 2016 are analyzed by using the climatic seasonal division standard (QX/T152-2012) issued by the China Meteorological Administration, the Chinese daily surface temperature dataset (V2.0, 0.5°×0.5°) issued by the National Meteorological Information Center, and the revised multiple regression model. The linear trend and extreme-point symmetric mode decomposition method (ESMD) are used to analyze the variations in the distribution area, durations, and start date of the climatic seasons. The main results are as follows. There are four climatic seasonal regions in China, namely, the perennial-winter, no-winter, no-summer and discernible regions, while there are no perennial-summer or perennial-spring regions. Considering the area variation of each region, the range of the perennial-winter region is significantly narrower, and the area of no-winter region increases, while the areas of no-summer and discernible regions have no significant changes. The regions with significant changes in the normal climatic seasons are mainly distributed in the Qinghai-Tibet Plateau and the Inner Mongolia Plateau. The regions with significant changes in the durations of the climatic seasons are mainly found in the northern China. The advance of the summer start date has led to a significant increase in the durations of climatic seasons in the central and western Inner Mongolia, Hexi Corridor and Xinjiang, and the postponement of the winter start date has resulted in a decrease in the number of winter days in these areas. In general, the climatic seasons at high altitudes in western China have more significant changes than those in the eastern coastal plains. Overall, the distribution and changes of the climatic seasons in China are revealed by this investigation, which could provide a reference for operational weather forecasting and climatic region division.
Mar. 25, 2020Vol. 75 Issue 3 458 (2020)
Xiaoru WANG, Zhiguang TANG, Jian WANG, Xin WANG, and Junfeng WEI
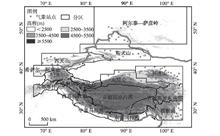
The remote sensing extraction method of large-scale snowline altitude at the end of melting season is developed based on MODIS snow cover products. The spatial and temporal variation characteristics of snowline altitude at the end of melting season of the High Mountain Asia during 2001-2016 are detailedly estimated on a grid-by-grid (30 km) basis. In this method, the cloud removal of the daily MODIS snow cover products was firstly carried out based on the developed cubic spline interpolation cloud-removel method, and snow covered days (SCD) of the 16 years are extracted using the cloud-removed MODIS snow cover products. In addition, the MODIS SCD threshold for estimating perennial snow cover is calibrated using the observed data of glacier annual mass balance and Landsat data at the end of melting season. Finally, the altitude value of the snowline at the end of melting season is determined by combining the perennial snow cover area and the terrain area-elevation curve. The results are as follows: (1) There is strong spatial heterogeneity of the snowline altitude at the end of melting season in the High Mountain Asia, and the snowline altitude at the end of melting season generally decreases with the increase of latitude. Under the influence of mass elevation effect, snowline altitude at the end of melting season gradually decreases from the high altitude area to the surrounding low mountainous area. (2) Generally, the snowline altitude at the end of the melting season from 2001 to 2016 in High Mountain Asia shows an obvious increasing trend. In the 744 monitoring grids (30 km), the snowline altitude at the end of melting season in 24.2% of the grids shows a significant increasing trend, while only 0.9% with a significant decrease. The snowline altitude at the end of melting season shows an increasing trend almost in the whole the High Mountain Asia, except for the regions of Hindukush and West Himalayas. The Tianshan Mountains, central and eastern Himalayas and Nyainqentanglha mountains show a significant increasing trend, and the eastern Himalayas experiences the most significant increase of 8.52 m yr -1. (3) The summer temperature is the main factor affecting the change of snowline altitude at the end of melting season in the High Mountain Asia, with a significant positive correlation (R=0.64, p0.01).
Mar. 25, 2020Vol. 75 Issue 3 470 (2020)
Ning MA, Liye HE, Sujie LIANG, and Jun GUO
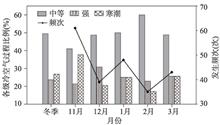
The characteristics of low-frequency oscillation of the cold air activity in the Beijing-Tianjin-Hebei (BTH) region in boreal winter and the impacts of the low-frequency characteristics of the Siberian High (SH) on them are investigated, using daily temperature observational data and NCEP/NCAR reanalysis data with a time span covering 1981-2015, based on power spectrum and composite analysis methods. The results show that both the daily temperature in the BTH region and the SH have a dominant period of 10-30 days in both daily temperature in the BTH region and the SH, and there exist significant lead-lag correlations between the low frequency oscillations of them. The cold surges in the BTH region mainly occur during the descending phase from the zero position to the trough of the low-frequency oscillation of temperature and the descending phase from the peak to the zero position of the low-frequency oscillation of the SH. A low-frequency cycle of abnormal atmospheric circulation propagating from Northwest Asia to Southeast Asia appears near the surface and in the middle layer, along with the low-frequency oscillations of the temperature in the BTH region and the SH. The abnormally low temperature, which affects the BTH region, originates near the Kara Sea and accumulates at the high latitudes of Asia, where a cooling effect is produced continuously. Meanwhile, marked convergent subsidence occurs in the middle layer, owing to the atmospheric convergence caused by the abnormal cyclone at the high latitudes of Asia. The combined effect of the convergent subsidence in the middle layer and the persistent cooling near surface results in an abnormal high, which later enhances and moves southward with the abnormally low temperature near surface. The East Asian Trough in the middle layer intensifies as this abnormal high moves southward, which brings deep-layer northerly wind to the BTH region. As a result, the cold air activity in the BTH region is intensified.
Mar. 25, 2020Vol. 75 Issue 3 485 (2020)
Jiawei YI, Nan WANG, Jiale QIAN, Ting MA, Yunyan DU, Tao PEI, Chenghu ZHOU, Wenna TU, Zhang LIU, and Huimeng WANG
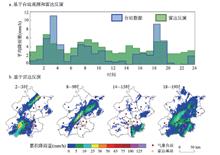
As global climate change intensifies, extreme rainfalls and floods become more frequent and pose a serious threat to urban sustainable development. Fast assessment of the rainfall disaster impact upon urban traffic and population plays an important role in improving disaster emergency management and incident response capabilities. This study adopts a time series anomaly detection method to discover and quantify the impact of rainfall-triggered flood on road traffic and human activities using real-time traffic condition information and mobile phone location request data. The anomaly detection method combines the STL time series decomposition technique and the extreme student deviation statistics to identify the response characteristics of traffic data and location requests during the event. The extreme rainfall event that occurred in Beijing on July 16, 2018 is used as a case study to examine the method effectiveness. The results show that the precipitation peaked in the morning and evening rush hours, during which the number of congested roads exceeded the average level by up to 150%. The anomaly detection analysis indicates that the number of congested roads and the traffic congestion index reached the outlier level. The anomaly analysis of human activity responses shows that the heavy rainfall event also caused an abnormal increase in the number of location requests, and the spatial distribution of the anomalous grids was highly correlated with the rainfall distribution one hour before. The above results not only prove the effectiveness of the big data and the anomaly detection method in understanding the impact of heavy rainfall events on urban traffic and population, but also provide new means for urban emergency response and management against rainfall disasters.
Mar. 25, 2020Vol. 75 Issue 3 497 (2020)
Zhibao DONG, and Ping LYU
Wind is the second largest fluid shaping the earth's landscape besides water. The aeolian landform formed by wind is widely distributed in the global arid regions, and more than 40% of the land area is affected by the aeolian process in the world. Owing to a close relationship with the human's living environment, aeolian geomorphology has received continuous attention from the international academia since the end of the 19th century. Although aeolian landforms are widely distributed in arid and semi-arid regions of China, the relevant study started in the late 1950s. This paper summarizes the development of aeolian geomorphology during the past 70 years in China, which has experienced three stages: the initial stage before reform and opening-up; the development stage between the reform and opening-up to the end of the 20th century; and international stage since the beginning of the 21st century, even partially beyond the international standard nowadays. There are many influential achievements in China, including dunes movement, regional comprehensive study on aeolian landforms, formation and evolution process of unique aeolian landforms, Gobi, the secondary flow around dunes and the exploration of extraterrestrial planets. Aeolian research in China has the potential to lead the international aeolian research in the future, but the aeolian geomorphologists must have following strategic thinking on meta-synthesis, the guidance of the earth system science, the global view and development of the outer space era.
Mar. 25, 2020Vol. 75 Issue 3 509 (2020)
Chengshuangping ZHAO, and Duowen MO
Based on the comprehensive analyses of 18 core profiles' sedimentary sequences and lithological characteristics in Jianghan-Dongting Basin of the middle reaches of Yangtze River and the spatial-temporal distribution of archeological sites in this area, we reconstructed the Holocene hydro-environmental evolution of the research area, and its relationship with human activities. The comparison reveals that in 11.5-5.5 ka BP, the water level of rivers and lakes in the middle Yangtze River presented a rising trend, concurrently, under the development of Neolithic culture and rice agricultural activities, human occupation extended from piedmont plain to inner basin plain in the research area. The water level fell in 5.5-4.0 ka BP, meanwhile, the number of human settlements of Qujialing-Shijiahe culture rapidly increased, especially in the inner basin plain. The water level rose again around 4.0 ka BP, and floods spread massively in this period, which led to the decline of Shijiahe culture. The main causes of hydro-environmental evolution in the research area are the fluctuation of sea level and the aggradation of fluvio-lacustrine sediments.
Mar. 25, 2020Vol. 75 Issue 3 529 (2020)
Fangdi SUN, and Ronghua MA
Poyang Lake is the largest freshwater in China. Continual monitoring on its hydrologic changes can supply basic data for ecological environment researches and is favorable for studying the exchange between the Poyang Lake and the Yangtze River or other rivers in the watershed. Hydrologic changes of Poyang Lake are essential to land-surface process studies and water resources management. Altimeter data and high-frequency MODIS images were used in this paper to obtain water levels, inundation extents and lake storage changes of Poyang Lake during 2000-2015. Then water exchange between Poyang Lake and Yangtze River was estimated based on water balance equation. The results showed that lake inundation presented a large fluctuation and an obvious seasonality. The maximum area was 3600 km 2, approximately 7.5 times of the minimum (482 km 2). Areas in the years 2004, 2007, 2009 and 2011 were smaller and the situation improved after 2012. The extent shrunk to less than 500 km 2 in dry season (January, February and December) when water level at Hukou Station was only 4.71 m. At that time, the water surface inclined from south to north, and the water level difference between south and north could reach 2.59 m. The increase of lake storage in dry season was 3 km 3 relative to the minimum during the study period. Surface extent was usually greater than 2670 km 2 in wet season (June-September) when water level was higher than 15 m and the surface was almost flat. The increase of lake storage in wet season was 12 km 3 relative to the minimum during 2000-2015. Water exchange between Poyang Lake and Yangtze River was from 7 km 3 to 40.66 km 3 during the research period and water from the lake to the river occurred in 93.33% time of the year. The flow water volume had obvious seasonality. Usually, the exchanged volume in May and June was more than that of July and August when precipitation increased in the upper-middle reaches of Yangtze River, thus more volume of the main stream and water was hindered to flow from Poyang Lake to Yangtze River.
Mar. 25, 2020Vol. 75 Issue 3 544 (2020)
Junhua ZHANG, Guodong LI, Yansong WANG, Lianqi ZHU, Wenliang ZHAO, and Yapeng DING
Sediment from the Yellow River is the main material source in the formation of several landform types in the lower reaches of the Yellow River. This sediment deposition changes the surface soil structure and its organic carbon content. Here, the distribution characteristics of soil organic carbon components and their influencing factors were analyzed in the Kaifeng and Zhoukou areas based on field investigations, laboratory experiments and spatial analyses. The statistical results showed that the TOC, AOC and NOC contents were 0.05-30.03 g/kg, 0.01-8.86 g/kg and 0.02-23.36 g/kg, respectively. Contents were higher in the surface (0-20 cm) layer than those in the lower (20-100 cm) layer, and the sequence of change from high to low content in a single layer was TOC, AOC and NOC. The NOC content contributed to TOC more than AOC did. The geostatistical characteristics obtained by using the GS+ software showed that the nugget coefficients of TOC, AOC and NOC were between 0.50 and 0.67, with a moderate degree of spatial correlation. This indicates that structural and random factors commonly influence variations in TOC, AOC and NOC, and that the action intensity between them is similar. The overall trend in all areas was that the contents of TOC, AOC and NOC were relatively consistent with those from the 0-20 cm to the 20-100 cm layer, although a transition from high-value region to low-value region was obvious. The spatial distribution and the statistical characteristics of TOC, AOC and NOC contents indicates that the high-value region is located in the area less affected by sediment, and the low-value region is located in the area which the Yellow River floods. The old riverway of the Yellow River has a value somewhere in between. In flooded areas, the TOC, AOC and NOC contents were the lowest in the burst place, and then contents gradually increased in the direction of water flow and passed area. Spatial variation in the NOC and AOC contents reflected the regions of TOC spatial variation and accumulation well. Throughout history, the banks of the Yellow River have been overflowed, causing river realignment and serious flooding. The resulting sediment deposition changed the surface particulate matter composition and soil organic matter content. It was found that the distribution of deposited sediment in the flooded area and old riverway of the Yellow River, the farming process and the cultivation history were all important factors affecting SOC composition content and spatial distribution. In addition, the organic matter input, soil particle composition and their dynamic relationship were the key factors affecting soil structure and organic carbon components. In short, increasing organic matter content and improving soil structure are effective ways to improve soil quality and to achieve sustainable regional agricultural development.
Mar. 25, 2020Vol. 75 Issue 3 558 (2020)
Xiao OUYANG, and Xiang ZHU
Comprehensive analysis of the characteristics, quality, and ecological effects of urban land expansion would be extremely valuable in high-quality development planning and decision-making. Using data of ten urban agglomerations of China from 1990 to 2015 at varying levels of urban development, this study analyzed the degree of urban land expansion based on the "human-land" synergistic relationship and examined the spatio-temporal characteristics and landscape ecological effects of urban development. Various development indexes for population, economy, and urban land were evaluated, including the urban land expansion intensity index, the intensity differentiation index, the landscape expansion index, and the pattern index. The results of the study are as follows: (1) From 1990 to 2015, the built-up areas in the urban agglomerations expanded continuously, while the expansion intensity showed a fluctuating trend. The highest values of expansion intensity for developed urban agglomerations appeared before 2010, while for the developing areas, the highest values came after 2010. (2) Overall, there was an asymmetrical urban growth among the agglomerations, and the areas with high urban expansion were mainly distributed along the coastal zones. At the national level, the epicenter of rapid urban growth moved from east to west, with the urban expansion in eastern China being much faster compared with the central, western, and northeastern regions. (3) The evolution in urban land use displayed two main spatial patterns, namely edge expansion and outlying, which varied based on the level of urban development. The spatial pattern in the developed urban clusters was more stable, while in the developing areas, the spatial structure started to take shape but have yet to be formed. (4) Urban expansion sprawling over suburban and rural areas resulted in relatively high degrees of fragmentation and structural complexity and instability of the landscape pattern. (5) The man-land synergy in these urban agglomerations increased gradually over time while the economy-land interaction was generally high, indicating an improvement in the overall quality of urban growth. The results of this study highlight the need to have stricter supervision of urban expansion particularly in the early stages of city development, to foster the development of small and middle-sized cities, and to propose a more balanced approach in urban land expansion. The findings here provide valuable lessons for high-quality development of land use in urban agglomerations of China.
Mar. 25, 2020Vol. 75 Issue 3 571 (2020)
Yufei REN, Chuanglin FANG, Guangdong LI, Si'ao SUN, Chao BAO, and Ruowen LIU
The local and tele-coupling relationship between urbanization and eco-environment has received extensive attention from researchers in recent years. Understanding the synergies and trade-off between urbanization and eco-environment systems is essential in addressing eco-environment problems in rapidly urbanized China. Based on a comprehensive literature review on the subject, this article presents the theories, methods and key applications that are associated with the coupling relationship between urbanization and eco-environment. We found that the concept of local and tele-coupling relationship between urbanization and eco-environment has only been developed since two decades ago. Related theories are still in development and applications based on this concept are limited until now. However, from other perspectives, many studies have adopted various methods to investigate the relations between the human and nature systems, providing abundant empirical evidence on the coupling relationship between the two systems. Lastly, future research directions are recommended. It is essential to examine the local and tele-coupling relationship between urban and eco-environmental systems in urban agglomeration areas, which helps enhance our understanding on the dynamic characteristics of involved systems and dominating pathways of evolving relationships in rapidly developed regions in China.
Mar. 25, 2020Vol. 75 Issue 3 589 (2020)
Erfu DAI, and Yahui WANG
Ecosystem services, which include water yield services, have been incorporated into decision processes of regional land use planning and sustainable development. Spatial pattern characteristics and identification of factors that influence water yield are the basis for decision making. However, there are limited studies on the driving mechanisms that affect the spatial heterogeneity of ecosystem services. In this study, we used the Hengduan Mountain region in Southwest China, with obvious spatial heterogeneity, as the research site. The water yield module in the InVEST software was used to simulate the spatial distribution of water yield. Also, quantitative attribution analysis was conducted for various geomorphologic and climatic zones in the Hengduan Mountain region by using the geographical detector method. Influencing factors, such as climate, topography, soil, vegetation type, and land use type and pattern, were taken into consideration for this analysis. Four key findings were obtained. First, water yield spatial heterogeneity are influenced most by climate-related factors, among which precipitation and evapotranspiration are the dominant factors. Second, the relative importance of each impact factor to the water yield heterogeneity differs significantly by geomorphologic and climatic zones. In flat areas, the influence of evapotranspiration is higher than that of precipitation. As relief increases, the importance of precipitation increases and eventually, it becomes the most important factor. Evapotranspiration is the most important factor in a plateau climatic zone, while in the mid-subtropical zone, precipitation is the main controlling factor. Third, land use type is also an important driving force in flat areas. Thus, more attention should be paid to urbanization and land use planning, which involves land use changes, to mitigate the impact on water yield spatial pattern. The fourth finding was that a risk detector showed that Primarosol and Anthropogenic soil areas, shrub areas, and areas with slopes <5° and 25°-35° should be recognized as water yield important zones, while the corresponding elevation values are different in different geomorphologic and climatic zones. Therefore, the spatial heterogeneity and influencing factors in different zones should be fully considered in planning the maintenance and protection of water supply services in the Hengduan Mountain region.
Mar. 25, 2020Vol. 75 Issue 3 607 (2020)
Yonghui YAO, Junyao ZHANG, and Dongzhu SUONAN
The compilation of 1:250000 vegetation type map in the north-south transitional zone and 1:50000 vegetation type maps in typical mountainous areas is one of the main tasks of integrated scientific investigation of the north-south transitional zone of China. In the past, vegetation type maps were compiled by a large number of ground field surveys. Although the field survey method is accurate, it is not only time-consuming, but also only covers a small area due to the limitations of physical environment conditions. Remote sensing data can make up for the limitation of field survey because of its full coverage. However, there are still some difficulties and bottlenecks in the extraction of remote sensing information of vegetation types, especially in the automatic extraction. As an example of the compilation of 1:50000 vegetation type map, this paper explores and studies the remote sensing extraction and mapping methods of vegetation type with medium and large scales based on mountain altitudinal belts of Taibai Mountain, using multi-temporal high resolution remote sensing data, ground survey data, previous vegetation type map and forest survey data. The results show that: (1) mountain altitudinal belts can effectively support remote sensing classification and mapping of 1:50000 vegetation type map in mountain areas. Terrain constraint factors with mountain altitudinal belt information can be generated by mountain altitudinal belts, 1:10000 Digital Surface Model (DSM) data of Taibai Mountain. In combination of the terrain constraint factors with multi-temporal and high-resolution remote sensing data, ground survey data and previous small-scale vegetation type map data, the vegetation types at all levels can be extracted effectively. (2) The basic remote sensing interpretation and mapping process for typical mountains is interpretation of vegetation type-group→interpretation of vegetation group & subgroup→interpretation and classification of vegetation type & subtype, which is a combination method of top-down method and bottom-up method, not the top-down or the bottom-up classification according to the level of mapping units. The results of this study provide a demonstration and scientific basis for the compilation of large and medium scale vegetation type maps.
Mar. 25, 2020Vol. 75 Issue 3 620 (2020)
Haoxi LIN, Jinchuan HUANG, Cunde XIAO, Xiaoxiao QI, and Yunqian CHEN
Cryosphere is one of the five most important spheres, which impacts the global climate system and has a close correlation with the sustainable development of the socio-economic system and the natural ecosystem. It serves as an important water source and solid water reservoir in cold and arid regions of China, the most developed country in terms of cryospheric in the middle and low latitude area. Widely distributed glacier, permafrost and snow cover not only have irreplaceable climatic effects, but also play a key role in guaranteeing economic development and ecosystem stability of the oasis in China's cold and arid regions. During the past decades, the studies in this field mainly focus on the adverse impacts of cryospheric; only a few are on cryospheric services and their profitability from socio-economic perspectives. There are even fewer studies on the comprehensive regionalization of cryospheric services. It becomes increasingly prominent to find the way to identify and quantify the structure of cryospheric services and their constituent elements, while we strengthen the scientific understanding of the spatial heterogeneity, complexity, and characteristics of cryospheric services. According to the development needs of the cryospheric science, this paper provides the research on comprehensive regionalization of cryospheric services and hopes to make necessary adjustments to the mutual promotion and coercion relationship of the cryospheric services. On one hand, it meets the major strategic needs of the Belt and Road Initiative, and considers the preparation for the Winter Olympics and the ecological progress; on the other hand, it contributes to mitigating risks and making reasonable use of cryospheric services. Firstly, a classification system is established for cryospheric services. Then, guided by the supply and demand equilibrium model, an importance evaluation of each cryosphere service is carried out, including supply-side importance evaluation, demand-side importance evaluation and the "developmental negative list" for amendment. Afterward, the location entropy algorithm is employed to determine the spatial distribution of the major cryosphere service under the guidance of service maximization model. Finally, the three-dimensional cube expansion method is applied into the comprehensive regionalization of cryospheric services, which divides the study area into multiple spatial levels, such as relatively independent, complete and organically linked units. To sum up, a comprehensive regionalization research system that integrates the natural supply and human demand and suits cryosphere characteristics is constructed. This paper aims at setting up a bridge between the supply of cryospheric services and the needs of social and economic development. It provides a reference for solving one of the key and urgent scientific issues regarding cryospheric science and the sustainable development of the man-earth areal system.
Mar. 25, 2020Vol. 75 Issue 3 631 (2020)
Xiuling ZUO, Fenzhen SU, Yu ZHANG, Wenzhou WU, and Di WU
Under the global change, coral reef reserves pave an effective way to protect biodiversity and enhance coral reef resistance to climate warming. Moreover, maintaining coral reef resilience is the core of coral reef reserves. Based on thermal stress, which is the most serious factor of coral reefs, this paper builds a thermal stress intensity model adopting the satellite sea surface temperature data (SST) of the South China Sea from 1982 to 2009 and the predicted SST data of the Second Generation Canadian Earth System Model (CanESM2)in CMIP5 from 2006 to 2100. Coral reefs that have priority to be protected in RCP4.5 and RCP8.5 scenarios are distinguished from the view of maintaining their resilience. The results show that about 13% of the coral reefs in the South China Sea Islands are identified as priority areas for protection. Based on the relationship between thermal stress intensity and coral resistance as well as refugia, thermal stress intensities of Qilianyu and Jinqing Island in the Xisha Islands both in recent years and in the future are relatively low. Thus, they are recommended to implement complete protection policies after acting their service function. Dongsha Atoll of Dongsha Islands and Paihong Reef of Zhongsha Atoll have experienced serious acute thermal stress in recent years, for which 50% prohibition of protection are recommended. The acute thermal stress intensities both in recent observations and in future projections of Huangyan Island of Zhongsha Islands are relatively low. Fifty percent multi-purpose protection is recommended for Huangyan Island. About 14% of the coral reefs in the Nansha Islands are priority areas for protection, and 30%-100% for prohibition of protection or 30%-50% for multi-purpose protection can be implemented.The extracted reefs and the protection measures for the South China Sea Islands under the RCP4.5 and RCP8.5 scenarios can provide important reference value for maintaining the ecological resilience of coral reefs to cope with global climate change.
Mar. 25, 2020Vol. 75 Issue 3 647 (2020)
© Copyright 2018-2021 | Chinese Laser Press.
All Rights Reserved 沪ICP备15018463号-20