


Please enter the answer below before you can view the full text.
2020
Volume: 75 Issue 1
14 Article(s)

Changqing SONG, Changxiu CHENG, Xiaofan YANG, Sijing YE, and Peichao GAO
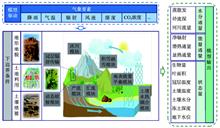
Coupling, as a classic physical concept, provides a suite of ideas and methods for describing interactions of multi-agents across disciplines. In contrast, the concept of integration is not from a certain discipline, but it is widely used in many natural and socioeconomic sciences fields due to its great generalization capacity. Both concepts are frequently mentioned in Earth science. Geography, as a multi-disciplinary research area between natural and socioeconomic sciences, owns regional, comprehensive, and complex characteristics. The understanding of coupling varies across geographic sciences. This paper presents an advanced understanding from six geographic perspectives based on different disciplines and scenarios, which is helpful to accurately explore patterns, processes, and mechanisms of land surface system. Firstly, this paper clarifies six perspectives on geographic coupling, and presents corresponding research cases, which include geographic spatial coupling, geographic features coupling, geographic interfaces coupling, geospatial scale coupling, geographic relationship coupling and geographic coupling interpretation. Secondly, the paper interprets the concept of integration from a geographic perspective, and introduces a pathway to achieving an integration in Heihe River Basin's research practice. Finally, the paper proposes intrinsic connections between geographic coupling and geographic integration.
Jan. 25, 2020Vol. 75 Issue 1 3 (2020)
Yujie LIU, Quansheng GE, and Junhu DAI
As one of the most important plant traits of crops, crop phenology reflects the characteristics of crop growth and development; its variation also affects crop production. Therefore, crop phenology is a reliable and comprehensive biological indicator reflecting global climate change. Global climate change, marked by rising temperatures, has exerted significant impacts on crop phenology. Under the background of global climate change, revealing the mechanism of global climate change impacts on crop phenology and growth as well as the formation of crop yield is of theoretical and practical significance. At present, crop phenology shifts and their influencing factors have become a hot research topic and an important international issue, thus a large number of studies have been carried out, and achieved rich and effective results. In this paper, we mainly focus on the research progress of crop phenological changes under the background of climate change, including the driving factors and their influencing mechanisms of crop phenological changes as well as methods of research on crop phenology, and the key scientific issues which need to be solved in future study are also discussed. The conclusions of this research could provide a theoretical basis for understanding the impacts and mechanisms of global climate change on crop phenology and for guiding regional agricultural production practices.
Jan. 25, 2020Vol. 75 Issue 1 14 (2020)
Fang WANG, and Jintao ZHANG
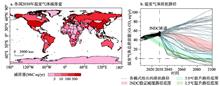
To limit global mean warming to below 2.0 ℃ in accordance with the Paris Agreement, countries submitted their Intended Nationally Determined Contributions (INDC) for emission reductions. Those emissions will be the key determinant to the future climate change impacts. However, it remains unclear what the resulting changes in the regional precipitation and its extremes would be under the INDC pledges. Here, we analyze the response of precipitation in Central Asia to emission scenarios under warming resulting from the INDC pledges (as of May 2019), based on an ensemble of comprehensive Earth System Models from the Coupled Climate Model Intercomparison Project Phase 5 (CMIP5). Our results show an increase in the mean precipitation in Central Asia by the end of the 21st century by 10.6% (4.6%-13.3%) for INDC-pledge scenario. However, spatial heterogeneity of precipitation changes reflects the complexity of precipitation responses in future climate projections. Furthermore, heavy precipitation events will strengthen with the enhanced warming, but the trend of dry spell events increases or decreases in different regions. Considering the impacts of precipitation-related extremes, we find that the projected population exposure to heavy rainfall and dry spell events will significantly increase in most Central Asian regions. Limiting warming to lower levels (such as 2.0 ℃ or 1.5 ℃) would reduce the population exposure to heavy rainfall, thereby avoiding impacts associated with more intense precipitation extremes. These results contribute to an improved understanding of future risk from climate extremes, which is paramount for mitigation and adaptation activities for Central Asia, an ecologically fragile area.
Jan. 25, 2020Vol. 75 Issue 1 25 (2020)
Liye HE, Shanjun CHENG, Ning MA, and Jun GUO
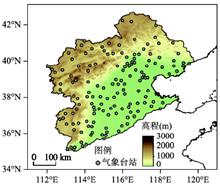
The precipitation distribution has obvious intraseasonal variation characteristics in the Haihe River Basin (HRB) during summer. In this paper, intraseasonal evolution of the key areas of precipitation in the HRB and its associated atmospheric circulation pattern have been investigated, and the relative contributions of different atmospheric circulation factors to precipitation in the key areas are quantitatively calculated, by using daily precipitation data of 148 meteorological stations over the HRB and NCEP/NCAR reanalysis data. The results present a prominent intraseasonal variation of the key areas of summer precipitation in the HRB. The key areas move clockwise around the lower reaches of the Luanhe River and Beisan River located in the northeastern HRB, which are the maximum contribution areas of station precipitation to the HRB total amount, from early summer (June) to midsummer (July and August). The key areas are distributed in northeast HRB, east and south HRB, east and central HRB along with the movement. During early summer, the activities of the Northeast Cold Vortex (NECV) play a dominant role (relative contribution is 69.6%) in precipitation in the key areas; in July, the anomalous precipitation in the key areas is mainly affected by the ridge line of the Western Pacific Subtropical High (WPSH), with a relative contribution of more than 60%; in August, the ridge line of the WPSH and the East Asian summer monsoon index (EASMI) has an equivalent contribution to precipitation in the key areas. In addition, the monthly significant correlation areas relating to these atmospheric circulation factors for precipitation, are found at the same location as the key areas of precipitation in the HRB, and their intraseasonal changing paths are both accordant with the position changes of the associated atmospheric circulation systems in summer.
Jan. 25, 2020Vol. 75 Issue 1 41 (2020)
Yuke ZHOU
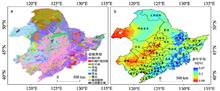
The length and magnitude of vegetation growing season are important factors affecting the change of vegetation productivity during the growth process. Under the context of global warming, vegetation growing season at the middle and high latitudes of the Northern Hemisphere has prolonged significantly and caused positive feedback on vegetation productivity. However, the change of vegetation growth magnitude and its impact on vegetation productivity are still unclear. Northeast China is located in the mid-latitude temperate zone with high vegetation coverage and various vegetation types. Exploring the change of vegetation growth season length and magnitude and their influence on productivity is meaningful for understanding and coping with ecosystem changes in the study area. Based on the long-term GIMMS NDVI3g remote sensing data (1982-2015), the curvature derivation method was used to extract the key vegetation phenological parameters such as start of season (SOS), end of season (EOS), growth season length (LOS) and growth magnitude (GM). Then the relative importance (RI) method was employed to detect the relative contribution of LOS and GM to vegetation productivity (expressed as mean NDVI value in growing season, MGS) in growing season. The results showed that: (1) The overall vegetation productivity and growth magnitude in the study area showed an increasing trend, while the LOS showed a decreasing trend, which led to the GM becoming the main factor controlling the change trend of productivity (RI = 70%); (2) In different vegetation coverage areas, the impact of growth season length and magnitude on productivity showed significant spatial discrepancy. Vegetation productivity in the western grassland region was most significantly controlled by GM (RI = 93%), followed by coniferous forest and broad-leaved forest (RI = 66%, 62%) and crop area was least affected by GM (RI = 56%). The impact of LOS on vegetation productivity is most significant in croplands (RI = 40%) and affects about 27%-35% in other areas. GM was positively correlated with productivity in all vegetation cover areas, while LOS was negatively correlated with productivity; (3) Both climate factors (precipitation, temperature) and phenological changes affect the main contributing factor GM. In detail, the change of SOS has the most significant effect on the GM in a large spatial range. The main manifestation is that delayed SOS can promote GM. Based on remote sensing technique, this study found that vegetation in Northeast China is generally growing more vigorously, but vegetation growth activities are mainly affected by growth magnitude. This study can provide direct evidence for the study of vegetation phenological changes and productivity response under the background of global change.
Jan. 25, 2020Vol. 75 Issue 1 53 (2020)
Xing GAO, Shichang KANG, Qingsong LIU, Pengfei CHEN, and Zongqi DUAN
Far from major zones of human pollution, the widely developed lakes on the Tibetan Plateau are ideal regions to evaluate global and regional impacts caused by human activities. Based on the reliable dating, they can provide historical records of human pollution. Heavy metal is one of the most harmful pollutants, and is harmful to biological environment and people's health due to its degradation-resistancy. Environmental magnetism characterized by its sensitivity, facility and non-destructiveness, has been applied widely in estimating increased heavy metal pollution in different environmental systems. However, there lacks the relevant research in lake sediments on the Tibetan Plateau. Thus, we conducted a systematic environmental magnetic investigation of lake sediments in the Qiangyong Co Lake, southern Tibetan Plateau to explore the relevance between magnetic minerals and heavy metal (Hg). Results indicate that magnetic mineral species constituted by four different components (C1, C2, C3, C4) remain stable during 1899-2011 AD, but the component C1 (hematite) increased continuously with the corresponding decrease of component C2 (goethite). In contrast, components C3 and C4 (magnetite) have no significant changes. The correlation between SIRM and Hg differs from that between χlf and Hg, probably because SIRM and χlf are affected by different factors of complex magnetic mineral species (four different components). But the component C1 is correlated well with both Hg content and climate warming of the Tibetan Plateau. This indicates that Qiangyong glacier (the main recharge source of Qiangyong Co Lake) melt faster upon the Tibetan Plateau warming, and the accumulated Hg in glacier and cryoconite were released again. During the processes, C1 (hematite) with large specific surface area absorbs Hg, and is transported to the Qiangyong Co Lake. This research indicates that the magnetic properties of the Qiangyong Co Lake are excellent environmental proxies, which can provide a new method to study the process of Hg deposition in lakes on the southern Tibetan Plateau.
Jan. 25, 2020Vol. 75 Issue 1 68 (2020)
Keke FAN, Qiang ZHANG, Peng SUN, Changqing SONG, Huiqian YU, Xiudi ZHU, and Zexi SHEN
The Tibetan Plateau is one of the most sensitive regions to global climate change. It is of important theoretical significance to explore the effect of soil moisture changes on near-surfaceair temperature for the study of the water cycle of the Tibetan Plateau and its impact on the surrounding climate and environment. Based on the NCEP-CFSR dataset, this paper reveals the spatial-temporal pattern of soil moisture content in different seasons and different vegetation zones on the Tibetan Plateau, the response and coupling of soil moisture and evaporation rate, and the impact of soil moisture on near-surface air temperature through evapotranspiration. The results show that: (1) The spatial pattern of soil water on the Tibetan Plateau is basically similar in different seasons, showing a decreasing trend from southeast to northwest and the spatial characteristics of drying in humid regions and wetting in arid regions; (2) The soil moisture in most parts of the Tibetan Plateau is in a transitional state, in which the southern and southeastern parts of the plateau are in a state of transition throughout the year, while the soil moisture in the Qaidam Basin is almost in a dry state all the year round; (3) The sensitivity of the near-surface air temperature to soil moisture is the weakest in winter, but the strongest in summer with weak spatial difference, which is negative feedback in winter, spring and summer. Moreover, the sensitivity of air temperature to soil moisture varies greatly in different vegetation coverage areas. This study has important theoretical significance for further exploring the regional water cycle and its effects under the coupled land-atmosphere state and the changing environment of the Tibetan Plateau.
Jan. 25, 2020Vol. 75 Issue 1 82 (2020)
Guining ZHAO, Zhengyong ZHANG, Lin LIU, Liping XU, Puyu WANG, Li LI, and Shan NING
The glacier mass balance (GMB) is an important link between climate and water resources, which has remarkable regulation functions for river runoff. The research, using MOD11C3, TRMM 3B43 and other multi-source remote sensing data to drive the degree-day model, simulates the GMB processes and analyzes the recharge of glacial meltwater to runoff in the Manas River Basin (MRB) during 2000-2016. The results show that: (1) By constructing the temperature and precipitation inversion model, the accuracy of the meteorological remote sensing data can be effectively corrected, and the characteristics of climate change in the glacial region can be well described after downscaling. The annual average temperature and precipitation in the glacier area were -7.57 ℃ and 410.71 mm, respectively. The place at an altitude of 4200 m is a severe climate change zone. Above 4200 m, the temperature drop rates and precipitation gradients were -0.03 ℃/100 m and -2.66 mm/100 m, respectively; while below 4200 m, they were -0.57 ℃/100 m and 4.8 mm/100 m, respectively. Besides, at a higher altitude of 4700 m, the precipitation increased by 5.17 mm/100 m. (2) During the study period, the glaciers in the basin continued to be in a negative state, with a cumulative GMB of -9811.19 mm w.e. and an average annual GMB between -464.85 mm w.e. and -632.19 mm w.e. The vertical GMB increased by 244.83 w.e./100 m and 18.77 w.e./100 m in the ablation zone and the accumulation zone, respectively. From 2000 to 2002 and 2008 to 2010, the melting of glaciers slowed down, and the ablation was intensified from 2002 to 2008 and from 2010 to 2016. Strikingly, the loss of glaciers was most serious during the period 2005-2009. (3) The river runoff responded strongly to the change of GMB within the year, especially in July and August, namely, the GMB loss accounted for 75.4% of the total amount of the whole year, and the river runoff accounted for 55.1% of the annual total. The inter-annual glacial meltwater recharge rate fluctuated between 19% and 31%, which may be due to the differences of precipitation and snow melt water recharge rates in different years. The contribution rate of glacial meltwater of the MRB is close to that of other river basins on the northern slope of the Tianshan Mountains, which can further confirm the reliability of the GMB estimation results. Above all, the research can provide reference for the study of GMB in other river basins.
Jan. 25, 2020Vol. 75 Issue 1 98 (2020)
Jie ZHANG, Peijun SHI, Jing YANG, and Daoyi GONG
This article used the Weather Research and Forecasting Model (WRF) version 3.8 and simulated rainfall event in the period of July 21 to 22, 2012 in Beijing as a case study, with consideration of different land use and cover data. The rainfall event was simulated using a physical parametrization scheme that included a multi-layered city dome model. The results of the hourly and accumulative rainfall simulation indicated that the expansion of the urban area made the rainfall last longer and it also led to bigger affected area by the rainfall. Based on the simulated rainfall event, the duration of hourly rainfall of more than 16 mm increased by 1 h between 1990 test and 2010 test, and the area of accumulative precipitation exceeding 150 mm over 24 h increased by 1534 km 2 over the same period. Further research is needed to determine the possible impact of changes in atmospheric aerosol particles produced by human activities in the urban area and the changes in landscape urbanization density on rainfall. Identifying the effect of landscape urbanization in metropolitan areas on rainfall will improve countermeasures for prevention of urban flooding and waterlogging risk. Future research will focus on improving the simulation effect of the model on the precipitation process. There was some discrepancy between the simulated and actual hourly precipitation in this study. Future work will investigate the parametric scheme of the model and the precipitation mechanisms it uses.
Jan. 25, 2020Vol. 75 Issue 1 113 (2020)
Jialin LI, and Lijia WANG
The spatial pattern changes of bays under the influence of reclamation can profoundly reflect how human activities affect the natural environments, which is important to effectively protect and utilize bay resources. Based on 6 Landsat TM/OLI remote sensing images during 1990-2015, this study analyzed the variations of major bays from the coastline and bay surface morphology and explored the correlation between the reclamation intensity and spatial pattern changes for the 12 major bays in the East China Sea (ECS). The main conclusions include that: (1) the length of the main bay coastline in the East China Sea, from 1990 to 2015, increased by 66.65 km. The extensive coastline growth was found during 2005-2010 and the growth reached 38 km. Sansha Bay has the longest coastline (439 km) and the shortest (105 km) was found in Luoyuan Bay; Xinghua Bay experienced the largest coastline growth (54.53 km) in the past decades, and the least was in Luoyuan Bay (25.75 km). In general, the artificial coastline continued to increase and the degree of artificialization had been continuously strengthened. (2) The coastline of the bay continuously moved to the sea, with a distance of 26.93 km (1.08 km/a). The most significant seaward expansions were found in 1995-2000 and 2005-2010, reaching 7.10 km and 6.00 km, respectively. Hangzhou (4.93 km) and Xinghua bays (4.15 km) experienced the largest seaward expansion of coastline, while Xiamen Bay had the shortest (0.55 km). (3) The total area of the major bay waters decreased from 13.85 km2 in 1990 to 12.29 km2 in 2015 in the East China Sea, down by 11.23%. Additionally, the morphological indices of the bays showed a continuous rise trend, which indicates that spatial patterns were transformed to be more complicated. The largest reduction with water area was observed in the Hangzhou Bay (0.726 km2), accounting for 46.69% of the research area. (4) The indexes of artificiality and development intensity showed a continuous rise trend. The utilization degree in the southern part of the study area is higher than that of the northern part, and the interannual fluctuation of the development intensity in the north is much varied. In addition, the bay development is positively correlated with the length of the coastline, the length of the artificial coastline and the shape index of the bay, and negatively correlated with the length of the natural coastline and the area of the waters. As the development intensity increased, the intensity of reclamation activities increased significantly.
Jan. 25, 2020Vol. 75 Issue 1 126 (2020)
Hongrun JU, Lijun ZUO, Zengxiang ZHANG, Xiaoli ZHAO, Xiao WANG, Qingke WEN, Fang LIU, Jinyong XU, Bin LIU, Ling YI, Shunguang HU, Feifei SUN, and Zhanzhong TANG
Understanding the evolving spatial pattern of land use is the basis of the theory and practice of land use/cover change (LUCC). It is helpful to optimize the use of land resources spatially and to improve the level of land use planning and management when the spatial patterns of land use are described effectively. At present, the commonalities in the scope of the spatial pattern of land use are still unclear, and research on the spatial pattern of land use has only recently begun to pay attention to the shape, patch distribution, structure, and relationships among different types of land use. In addition, the correlations among different pattern indicators have resulted in the redundancy in the pattern metrics. Further study is needed to establish the corresponding relationships between indicators and land use spatial patterns. This study summarized the area, shape, and patch distribution for land use maps as geometric characteristics, and summarized the structure and diversity as land use class characteristics. Based on the above conceptual model, an index system of land use spatial patterns was established. Then, the corresponding relationships between the indicators and the spatial patterns were established using fuzzy C-means clustering. The results indicated that the geometric characteristics of land use in China could be divided into five types: a simple large patch type, a complex large patch type, a complex small patch type, a simple small patch type, and a scattered type. Different geometric features reflected the characteristics of the area, the shape and the patch distribution and the combination of regional land use types. In 2010, there were 61 structures of land use in China, but a subset of 14 structures was the majority. The structural characteristics clustered in space and showed apparent spatial heterogeneity of different land use types. The diversity of land use in China was dominated by 3-5 categories, accounting for 66.69% of all the grids. The diversity over space was generally high in the northeast and the southeast, but low in the northwest. In summary, this study enriches the theoretical system of land use spatial pattern and fills a gap in the systematic description of the overall spatial patterns of China's land use.
Jan. 25, 2020Vol. 75 Issue 1 143 (2020)
Xueru ZHANG, Jie ZHOU, and Mengmei LI
Habitat quality determines the status of regional biodiversity which is an important reflection of ecosystem service function and health. Research on the habitat quality change is of great significance for regional ecological security. The reconstruction of regional spatial pattern of habitat quality can restore the background of ecological environment in historical periods and provide scientific support for revealing the evolution law of regional ecological environment quality. This study selected ten driving factors (elevation, slope, aspect, GDP, population, temperature, rainfall, river distance, urban distance and coastline distance) to build CA-Markov model parameters and simulate the historical land use data. The spatial pattern of habitat quality was rebuilt by InVEST model, and the classification and statistics of habitat degradation and habitat quality were examined. The results showed that: (1) The Kappa coefficient is 0.88, which proves that the land use spatial pattern reconstruction method is feasible. On this basis, the simulation of habitat quality is valid. (2) During 1975-2010, the degree of habitat degradation increased gradually and the spatial distribution of it showed a regular pattern of circle layer change. The habitat quality decreased steadily. The high-value areas were mainly distributed in mountainous areas, while the low-value areas were mostly distributed across built-up areas. In this period, the low-value areas gradually engulfed the high-value areas around, and the habitats of the high-value areas tended to be fragmented. (3) In 1975-2010, the spatio-temporal variations of habitat quality indicated that the region with the worst habitat quality were difficult to recover; the regions with the poor habitat quality accounted for 6.40% of the total area, which were prone to deteriorate and occur around the built-up areas; the areas with the best or better habitat quality grades accounted for 5.68% of the total area, which could be easily transformed into the poor and worst habitat grades, making the habitat more scattered. (4) There was a marked change with land use of study areas during 1975-2010, which had a huge impact on the quality of the habitat. The above results show that the habitat quality of the study area decreases gradually. More than 60% of the regions have poor or even worst habitat quality. Construction land is the biggest factor threatening the habitat quality.
Jan. 25, 2020Vol. 75 Issue 1 160 (2020)
Kaihuang ZHANG, Qinglan QIAN, and Qingsheng YANG
In recent years, land urbanization, as a spatial manifestation of China's expanding urbanization, has emerged as a core research field within urban geography and land science. Provincial administrative departments within China's distinctive administrative system significantly influence municipal administrative departments and urbanization levels. Individual-level influencing factors cannot fully explain the Chinese mode of urbanization. Therefore, a multilevel linear model was developed to identify factors influencing China's land urbanization process. The results indicated that in 2005, factor inputs, in particular, and public service critically influenced land urbanization in municipal urban areas. By 2016, economic development levels had superseded factor inputs, public service, and population agglomeration as the key influencing factor. At the provincial level, differences in economic development levels critically influenced land urbanization. The provincial government's prioritization of ecological and agricultural resource conservation had a significant negative impact on city-level factors and urban built-up areas. The relationship between the government's developmental attitude, geographical locations, and city-level factors was complex and varied according to regional development levels. A further finding was that since China's reform and opening-up policy was initiated in 1978, land urbanization has been driven by industrialization and urbanization, gradually shifting from government-led to economy-driven stage. Thus, a multilevel study of land urbanization reveals mechanisms and cross-level relationships among different factors that influence levels of land urbanization. Moreover, it provides a theoretical basis for rational policy formulation.
Jan. 25, 2020Vol. 75 Issue 1 179 (2020)
Yong XU, Shen ZHAO, and Jie FAN
Urban planning construction land standard is the technical specification for allocating various types of urban construction land scientifically, and is the basis for drawing up and revising the overall urban planning as well. In view of China's current urban planning construction land standard, there are many problems such as the big gap of land use control threshold, the lack of regional differences in climate revision, and ignorance of the topographical and geomorphological factors. To solve these problems, this paper proposed a step-by-step process framework and quantitative calculation method for the establishment and revision of standards in accordance with the principle of "total-structure" control. Through the setting of conditions, a universal basic standard for construction land was established. Then quantitative analysis was made for the relations between each index and the basic standard with the selected key indicators such as urban population size, sunshine spacing coefficient, valley area (intermountain basin) width and terrain slope. Finally we formed a revision standard for climate, topography and geomorphology which is matched with the basic standard. The main results are as follows: (1) The per capita construction land area of 95 m 2/person can be used as the total indicator for the basic standard of urban planning in China. The percentage of corresponding per capita for each type of construction land is 32.5% for residential land, 7.42% for public administration and public service land, 22.5% for industrial land, 17.5% for transport facilities, 12.5% of green land, and 7.58% of other types of land. The results of revision value of urban population scale shows that the impact of population size difference on the per capita construction land is relatively weak. (2) The climate revision results of per capita residential land and per capita construction land in major cities show that the climate revision value varies greatly between northern and southern China. The climate revision value of the per capita area of construction land varies by latitude as follows: the figure for 20° north latitude is 93 m 2/person; the figure for 30° north latitude is 97 m 2/person; the figure for 40° north latitude is 103 m 2/person; and the figure for 50° north latitude is 115 m 2/person. The basic standard value of 95 m 2/person is roughly distributed along the Xiamen - Guilin - Kunming line. (3) The cities located in mountainous areas, hilly valleys or intermontane basins can reduce the allocation of community parks and comprehensive parks when the average width of river valley or intermontane basin is less than 2 km. When the average width of the valley or intermontane basins is between 2 km and 4 km, the allocation of the comprehensive parks can be reduced. The revised results of per capita land for construction use on slopes indicate that the terrain slope has a great impact on the revised value of per capita construction land. The revised value at 3° is 3.68% higher than the baseline value, and the increases of 8°, 15° and 25° are 11.25%, 26.49% and 68.47%, respectively.
Jan. 25, 2020Vol. 75 Issue 1 194 (2020)
© Copyright 2018-2021 | Chinese Laser Press.
All Rights Reserved 沪ICP备15018463号-20