


Microplastics (MP) in open water is currently a global problem affecting health, environment, and economy [
Journal of the European Optical Society-Rapid Publications, Volume. 19, Issue 1, 2023010(2023)
Sorting microplastics from other materials in water samples by ultra-high-definition imaging
In this study a commercial particle analyzer was used to image and help sorting microplastic particles (MPs) dispersed in filtrated and de-aerated tap water. The device provides a relatively easy and fast procedure for obtaining ultra-high-definition imaging, allowing the determination of shape, size, and number of 2D-projections of solid particles. The image analysis revealed clear differences among the studied different MPs originating from the grinding of five common grades of plastic sheets as they affect the image rendering differently, principally due to the light scattering either at the surface or in the volume of the microplastics. The high-quality imaging of the device also allows the discrimination of the microplastics from air bubbles with well-defined spherical shapes as well as to obtain an estimate of the size of MPs in a snapshot. We associate the differences among the shapes of the identified MPs in this study depending on the plastic type with known physical properties, such as brittleness, crystallinity, or softness. Furthermore, as a novel method we exploit a parameter based on the light intensity map from moving particles in cuvette flow to sort MPs from other particles, such as, wood fiber, human hair, and air bubbles. Using the light intensity map, which is related to the plastic-water refractive index ratio, the presence of microplastics in water can be revealed among other particles, but not their specific plastic type.
Keywords
1 Introduction
Besides the shape and size, another factor contributing to the challenges in MP detection in water is their appearance. Plastics can be transparent or hazy in water [
However, the above figures of merit are based on optical measurements of plastics in air. In principle, similar definitions and standards of plastic quality as above can be extended to describe macroscopic plastics or MPs in aquatic environments, but the probed area of the sample has to be flat and there is the issue of water absorption especially in the spectral region of near-infrared radiation. Measurement conditions can be much more complex in real water systems, e.g., open, industrial, or waste waters, than in laboratory-prepared samples due to the presence of other organic and inorganic materials than plastics, and MPs having irregular and non-flat structures. Finally, temporal changes in the measurement conditions and the lack of suitable measurement devices can often make difficult the interpretation of the results.
Subjective visual inspection [
2 Materials and methods
The plastic samples used for the preparation of the artificial MPs are commercial sheets from Goodfellow Ltd (UK). Studied MP samples include low-density polyethylene (LDPE), polystyrene (PS), polypropylene (PP), polyamide (PA) and unplasticized polyvinyl chloride (UPVC). The MPs were obtained by grinding plastic pieces with Retsch Ultra Centrifugal Mill ZM 200. Before grinding, the plastic sheets were cut into small pieces under 1 cm2 and hardened in liquid nitrogen for an easier grinding. These pieces were then inserted into the mill in small amounts together with a spoonful of liquid nitrogen to prevent the plastic from melting during grinding. Sieves with 1 mm- and 0.25 mm-mesh sizes were used in sieving the resulting MPs during the grinding. The grinding speed was 10,000 rpm in the case of the 1 mm sieve and 6000 rpm in the case of the 0.25 mm sieve, to avoid overheating of the plastics. The grinding yields nano- and microplastics in the size range 100 nm – 250 μm and these have different morphologies, which was confirmed by SEM analysis.
Valmet Fiber Image Analyzer (Valmet FS5) is an offline fiber and particle image analyzer for daily laboratory or research use. Equipped, in this version, with an ultra-high-definition imaging unit (UHD), it can be used for very tiny particle detection such as MPs. It was developed primarily for fiber and particle analyses in pulp and paper industry. The device consists mainly of a sample handling unit, an imaging unit and a touch screen user interface unit, all connected via computer. The sample is diluted in tap water and is being pumped through the sample circulation loop. Consistency of the sample can be set by hand or let the device adjust the consistency to the value set by user. The sample flows through a flow cell in which particles are being illuminated and imaged with industrial area scan monochrome camera. Imaging area is broad enough to measure large (10 mm) particles and accurate for the observation of the smaller ones (minimum detectable particle dimension is in the range of 1 μm). We exploit in this study snapshot images but it is also possible to record video from the moving objects, e.g., MPs, and observe their changing appearance as a function of time as the water flow propagates. Such a method is not the focus of this article; however, similar to stereomicroscopic view, it would lead to three-dimensional representation of the objects within the water sample and yield a better description of the immersed objects. The measurement of one 0.5 L sample, volume chosen for this study, is based on the circulation measurement mode of the device and it takes about 4 min depending on the sample type and settings chosen by the user. There is also the option of non-circulation measurement. In such a case the sample volume (in principle infinite) is not limited but it goes to waste. We preferred the circulation mode to preserve the MPs for future use. One measurement typically can include hundreds of thousands of particles. In the case there were only a single MP, of a size from 1 μm or larger in the water sample, it would be detected by the imaging device once it passes the detection window. As a proof of concept each plastic type was analyzed separately. The software calculates the morphological properties of the objects. Particle length, width, area, and count are the most common properties reported by the device. In our case, the analysis is done partly independently on the device’s software since it must be taught beforehand to recognize the different particle/object types. This could be realized with machine learning that has been suggested, e.g., to automize data handling in holographic imaging of MPs [
The light intensity distribution of the imaged objects is obtained as a bitmap that is used in further analysis of the MPs, as a novel method to screen MPs from other objects in flowing water. We developed an additional analysis method enabling a better rendering of the captured images and an improved contrast. This methodology described together with the results, for better clarity, is based on the calculation of a spatial intensity quantity, M, defined as
3 Results
The pristine plastic samples of this study are transparent or translucent in air. Scattering of light from such plastics immersed in water is much weaker than in the air. The scattering of light is strongest when the size of the scatterer or its features, such as the surface roughness, is of the same order as magnitude as the wavelength of the incident light. However, it is important to distinguish between surface and volume scattering of an MP. While MP is embedded in water, the scattering from surface roughness can be weak when the average surface roughness of MP is smaller than the effective wavelength (in water) of the probing light. The strength of light scattering also depends on the magnitude of the refractive index difference between the plastic sample and the ambient water. The smaller the refractive index difference, the weaker the surface scattering resulting from microroughness. In the case of volume scattering, due to volume inhomogeneities inside the MP, the situation is different because water is not in contact with the internal parts of the MP. Therefore, volume scattering is an intrinsic property of a particular MP. However, if the plastic is porous, then water can penetrate the pores and hence influence the strength of volume scattering of light. Ageing of plastic and the mechanical stress such as induced by our fabrication method, can affect both the extrinsic and intrinsic properties of plastics, e.g., light scattering, which can similarly influence the optical properties of the MPs.
We first deal with irregular sizes and shapes of MPs detected by the imaging tool and related peculiar optical properties, such as, a lens formation or hole inside a MP.

Table 1. Selected MP extracted from
Figure 1 to estimate the surface area: Plastic types and corresponding figures from which the MP images have been extracted; isolated MPs without background; projected images for pixels counting; surface area of the MP.Table 1. Selected MP extracted from
Figure 1 to estimate the surface area: Plastic types and corresponding figures from which the MP images have been extracted; isolated MPs without background; projected images for pixels counting; surface area of the MP.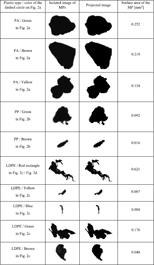
![]()
Figure 1.Images acquired with Valmet FS5 UHD device for different samples in water including (a) PA particles, (b) PP particles, and (c) LDPE particles. (d) Zoomed-in and enhanced image of a microplastic particle from (c) (red contour). Red arrows in (d) highlight bright “lensing” areas in the microplastic particle. Black arrows in (d) highlights a hole in the MP. (e) Air bubbles on a PET MP. (f) Procedure to image and recognize MPs in a water sample.
It is to be noted, in
The device’s software has already an algorithm to neglect the air bubbles in the counting of the identified particles in the analysis of an image. Note that this function was disabled for this current study. In the practical case of MP imaging, omitting air bubbles simplifies the monitoring of particles and their abundance in a water sample. It is also possible that a MP acts as a nucleation unit of air bubbles. An example of it is shown in
In
There are other less bright yellowish spots showing transparency or translucency, but darker areas dominate over the whole MP surface in
![]()
Figure 2.Processed images in order to highlight the different plastic microparticles (a) PS and (b) UPVC plastic particles. Highlight on UPVC particle: (c) original cropped image and (d) contoured image showing an irregular-cut pyramid due to the grinding.
From images acquired by the ultra-high definition analyzer, one can easily isolate MP particle and perform different analyses on the extracted image. The process is shown in
![]()
Figure 3.Isolating MP from the acquired images and extracting an estimation of the projected surface area of the particle. (a) Original image, (b) cropped image, (c) isolated MP, and (d) projected image of the MP in black and white allowing an estimation of the size.
Similar processing and image projection was applied to PA, PP, and LDPE MPs and are summarized in
The shape of the MPs depends primarily on the plastic type. It is clear from
![]()
Figure 4.Image of MP extracted from
Next, we consider the concept of light intensity bitmap analysis in more details. Although many MPs illustrated in this study have a dark appearance, they actually transmit light. This is a property that can be used in screening of MPs from wood fibers, human hair (quite often present in waste waters) and air bubbles. We start with the concept of light intensity ratio (M). It is defined as the ratio of the intensity of the transmitted light through an object in water to the intensity of light through water only (background). This ratio depends usually on the location of image pixel over the object. We have observed that a quantity 1 – M map is sensitive to screen between different objects in laminar water flow system.
Before demonstrating the full power of 1 – M map, we wish to remark that human hair and wood fibers (soft or hard) differ very much from the optical properties of a MP. Indeed, wood fibers have complex optical properties because it consists mostly of cellulose (refractive index ca. 1.53, crystalline cellulose is birefringent), hemicellulose (ca. 1.53) and lignin (ca. 1.61) [
In
![]()
Figure 5.Example of a 1 – M map obtained from one snapshot captured by UHD FS5 device. It shows a human hair, a kinked soft wood fiber, a PP microplastic and an air bubble. Each particle is further analyzed in
![]()
Figure 6.Intensity distribution analysis through 1 – M values for (a) a human hair, (b) a soft wood fiber, (c) a microplastic, and (d) an air bubble. Left: 1 – M maps. Middle and right: cross-section along the colored arrows or dashed lines shown on the 1 – M maps. Insets in (c) and (d) are zoom-in curves on the central part of the 1 – M cross-sections.
On the left hand-side are shown the 1 – M maps, in the middle and on the right hand-side panels are 1 – M values taken from the locations shown by the colored arrows and lines on the 1 – M maps. It is also to be noted that representing 1 – M in figures allows a better contrast, but the discussion is done directly on the M-values. In the case of human hair,
In the case of a mixture of different plastic type MPs in water their presence can be revealed by the light intensity map, but their specific plastic type cannot be identified. We think this sorting of different MPs directly from water is at least a partial solution to avoid laborious laboratory studies and would be a practical concept to investigate industrial and urban wastewaters taken, e.g., from onsite pipelines. The device is portable and either single or double devices could be used before a filter to pre-screen any presence of MPs and their images and characterization like done above, and after the filter to monitor again presence of possible remaining MPs in water.
4 Discussion
This study reports on imaging of homemade MPs that have irregular shapes and structures. Irregular MPs, such as fragments, are found in aquatic environments. Typical properties of interest of MPs are their size, shape, abundance, and the type of plastic [
The light intensity ratio is suggested as a measure to screen presence of a MP by using the regularity of 1 – M obtained over a MP. Hence, it serves as a parameter that a MP has been found but it cannot identify the plastic type. This finding of a MP is already important step regarding the laborious current procedures in laboratories. Extensive identification of MPs would require measurement of spectral properties from MPs, but there is currently no such measurement mode in the device. However, this can be integrated in future. Alternatively, one can attach other modes to filter the measured water volume to detect dry MPs using, e.g., portable reflectometer [
The results presented here based on UHD imaging brings the goal of field measurements of MPs directly from water samples nearer. After further development, imaging methods for MP analysis may be rather easily integrated to industrial process water or wastewater monitoring, because similar techniques are already used, e.g., for fiber analysis. This requires further development of spectral measurements to identify the MPs as well as image processing, e.g., to estimate real projection area of a MP as we have demonstrated by bitmap study of present samples. Image data from MPs show that it is possible to screen between transparent and translucent MPs.
The intensity ratio M, and therefore 1 – M, varies significantly with the refractive index of the particle and its overall optical properties. We also showed that these values can vary along preferential directions with a relatively high contrast (proportional to the standard deviation of M) but with a quite high mean value, this is the case of a hair. M values can be randomly fluctuating showing low mean value and similar standard deviation than the hair, this is the case of a wood fiber. M values can be very high and nearly constant for an air bubble. Finally, for a microplastic, M presents high values, still lower that for an air bubble and wood fiber, with low but not negligible fluctuations. Combining conclusions on the statistics of M values and their distribution on several key-directions of the particles, is a clear indicator of the particle type.
In case of a biofilm attached over MP it is usually an issue and typically requires removal in sample preparation prior to MP characterization. In case of transparent biofilm, that consists mostly of water, identification of MP by 1 – M should not be problematic, but this requires further experiments. In case of a heterogenous opaque biofilm there are more challenges but the intensity ratio, if non-zero, is a convolution of transmittance of MP and the biofilm. This too requires future experiments in trying to identification of a MP beneath the opaque biofilm.
5 Conclusion
We demonstrate in this research that a commercially available image analyzer primarily designed for the detection of wood fibers in aquatic samples can be efficiently used for MP detection. Using this device, we have been able to determine the shape, size (projected surface), analyzed microplastics prepared by grinding of five common plastic sheets namely, PA, PP, LDPE, PS, and UPVC. The results show that the microplastics exhibit clear difference in terms of shapes and transparency, after grinding, which arise from the mechanical properties of the plastic type and can, therefore, be used as an indirect way to classify plastic types. The size of the particles differs also from one plastic to another, despite using the same settings for the grinding tool. Combining the ultra-high-definition imaging along with the light bitmap obtained from the device with automated machine learning would lead to a complete device for MP recognition in wastewater treatment environment as the device can already distinguish MPs, wood fibers, human hair, and air bubbles.
[1] C. Campanale, C. Massarelli, I. Savino, V. Locaputo, V.F. Uricchio. A detailed review study on potential effects of microplastics and additives of concern on human health.
[2] D. Peixoto, C. Pinheiro, J. Amorim, L. Oliva-Teles, L. Guilhermino, M.N. Vieira. Microplastic pollution in commercial salt for human consumption: A review.
[3] P. Wanner. Plastic in agricultural soils – A global risk for groundwater systems and drinking water supplies? – A review.
[4] B.O. Asamoah, E. Uurasjärvi, J. Räty, A. Koistinen, M. Roussey, K. Peiponen. Towards the development of portable and in situ optical devices for detection of micro-and nanoplastics in water: A review on the current status.
[5] M. Becucci, M. Mancini, R. Campo, E. Paris. Microplastics in the Florence wastewater treatment plant studied by a continuous sampling method and Raman spectroscopy: A preliminary investigation.
[6] A.A. Elsayed, M. Erfan, Y.M. Sabry, R. Dris, J. Gaspéri, J.S. Barbier, F. Marty, F. Bouanis, S. Luo. A microfluidic chip enables fast analysis of water microplastics by optical spectroscopy.
[7] A. Faltynkova, G. Johnsen, M. Wagner. Hyperspectral imaging as an emerging tool to analyse microplastics: A systematic review and recommendation for future development.
[8] S. Mariano, S. Tacconi, M. Fidaleo, M. Rossi, L. Dini. Micro and nanoplastics identification: Classic methods and innovative detection techniques.
[9] J. Behal, M. Valentino, L. Miccio, V. Bianco, S. Itri, R. Mossotti, G. Dalla Fontana, E. Stella, P. Ferraro. Toward an all-optical fingerprint of syntetic and natural microplastic fibers by polarization-sensitive holographic microscopy.
[10] B.O. Asamoah, B. Kanyathare, M. Roussey, K.-E. Peiponen. A prototype of a portable optical sensor for the detection of transparent and translucent microplastics in freshwater.
[11] J. Leonard, H. Koydemir, H.C. Koutnik, V.S. Tseng, A. Oscan, S.K. Mohanty. Smart-phone enabled rapid quantification of microplastics.
[12] A. Haapala, O. Laitinen, P. Karinkanta, H. Liimatainen. Optical characterisation of size, shape and fibrillarity from microfibrillar and microcrystalline cellulose, and fine ground wood powder fractions.
[13] M. Valentino, B. Jaromír, V. Bianco, S. Itri, R. Mossotti, G. Dalla, T. Battistini, E. Stella, L. Miccio, P. Ferraro. Intelligent polarization-sensitive holographic fl ow-cytometer: Towards specificity in classifying natural and microplastic fibers.
[14] K.-E. Peiponen, R. Jukka, U. Ishaq, S. Pélisset, R. Ali. Outlook on optical identification of micro- and nanoplastics in aquatic environments.
[15] B. Abaroa-Perez, S. Ortiz-Montoa, J.J. Hernandez-Brito, D. Vega-Moreno. Yellowing, weathering and degradation of marine pellets and their influence on the adsorption of chemical pollutants.
[16] L. Lv, X. Yan, L. Feng, S. Jiang, Z. Lu, H. Xie, S. Sun, J. Chen, C. Li. Challenge for the detection of microplastics in the environment.
[17] S. Morét-ferguson, K. Lavender, G. Proskurowski, E.K. Murphy, E.E. Peacock, C.M. Reddy. The size, mass, and composition of plastic debris in the western North Atlantic Ocean.
[18] S. Zhao, M. Danley, J.E. Ward, T.J. Mincer. An approach for extraction, characterization and quantification of microplastics in marine snow using Raman microscopy.
[19] M.G.J. Löder, G. Gerdts. Methodology used for the detection and identification of microplastics – A critical appraisal. Bergmann M., Gutow L., Klages M. (eds),
[20] A. Haapala, J. Levanic, P. Nadrah. Analyzing TEMPO-oxidized cellulose fiber morphology: New insights into optimization of the oxidation process and nanocellulose dispersion quality.
[21] B. Kanyathare, B.O. Asamoah, U. Ishaq, J. Amoani, J. Räty, K.-E. Peiponen. Optical transmission spectra study in visible and near-infrared spectral range for identification of rough transparent plastics in aquatic environment.
[22] M.J. Doyle, W. Watson, N.M. Bowlin, S.B. Sheavly. Plastic particles in coastal pelagic ecosystems of the Northeast Paci fi c ocean.
[23] S. Piarulli, G. Sciutto, P. Oliveri, C. Malegori, S. Prati, R. Mazzeo, L. Airoldi. Rapid and direct detection of small microplastics in aquatic samples by a new near infrared hyperspectral imaging (NIR-HSI) method.
[24] H. Huang, J. Ullah, Q. Shuchang, L. Zehao, S. Chunfang, H. Wang. Hyperspectral imaging as a potential online detection method of microplastics.
[25] V. Bianco, P. Memmolo, P. Cargani, F. Merola, M. Paturzo, C. Distarte, P. Ferraro. Microplastic identification via holographic imaging and machine learning.
[26] R. Horisaki, K. Fujii, J. Tanida. Single-shot and lensless complex-amplitude imaging with incoherent light based on machine learning.
[27] M. Selmke. Bubble optics.
[28] M. Senouci-Bereksi, F.K. Kies, F. Bentahar. Hydrodynamics and bubble size distribution in a stirred reactor.
[29] P.L.L. Walls, J.C. Bird, L. Bourouiba. Moving with bubbles: A review of the interactions between bubbles and the microorganisms that surround them.
[30] G. Renner, A. Nellessen, A. Schwiess, M. Wenzel, T.C. Schmidt, J. Schram. Hydrophobicity – water/air based enrichment cell for microplastics analysis within environmental samples: A proof of concept.
[31] Y. Li, Q. Fu, S. Yu, M. Yan, L. Berglund. Optically transparent wood from a nanoporous cellulosic template.
[32] K. Enders, R. Lenz, C.A. Stedmon, T.G. Nielsen. Abundance, size and polymer composition of marine microplastics ≥10 μm in the Atlantic Ocean and their modelled vertical distribution.
[33] H. Woo, K. Seo, Y. Choi, J. Kim, M. Tanaka, K. Lee, J. Choi. Methods of analyzing microsized plastics in the environment.
[34] J. Zhao, L. Liu, Y. Zhang, X. Wang, F. Wu. A novel way to rapidly monitor microplastics in soil by hyperspectral imaging technology and chemometrics.
[35] J.W. Feather, D.J. Ellis, G. Leslie. A portable reflectometer for the rapid quantification of cutaneous haemoglobin and melanin.
[36] R.A. Crocombe. Portable spectroscopy.
Tools
Get Citation
Copy Citation Text
Kai-Erik Peiponen, Boniphace Kanyathare, Blaž Hrovat, Nikolaos Papamatthaiakis, Joni Hattuniemi, Benjamin Asamoah, Antti Haapala, Arto Koistinen, Matthieu Roussey. Sorting microplastics from other materials in water samples by ultra-high-definition imaging[J]. Journal of the European Optical Society-Rapid Publications, 2023, 19(1): 2023010

Paper Information
Category: Research Articles
Received: Nov. 22, 2022
Accepted: Mar. 10, 2023
Published Online: Aug. 29, 2023
The Author Email: Roussey Matthieu (matthieu.roussey@uef.fi)

© Copyright 2018-2021 | Chinese Laser Press.
All Rights Reserved 沪ICP备15018463号-20