


Please enter the answer below before you can view the full text.
2-1=
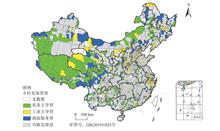
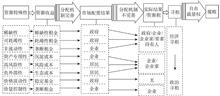
In the new era of socioeconomic development in China, examining the types of rural development is an important task in implementing the strategy of rural revitalization. The purpose of this study was to trace the temporal and spatial changes of rural development types at the county level in China in order to identify the scale and spatial layout of various rural development types over the past decades. The main method is as follows: According to the proportions of the three main industrial sectors in 2000 and 2015, all county-level units (except municipal districts) are classified into agricultural-oriented, industrial-oriented, business-service, as well as the balanced development models. By means of spatial analysis in GIS, this study analyzed and summarized the differentiation and characteristics of change of the countrywide rural development pathways, and further connected the resulting pattern with the adjustment of regional development strategies. The results show that: (1) The types of rural development at the county level in 2000 and 2015 show different regional distribution patterns, which are related to the current situation of land use, the change of natural resources endowments, and the adjustment of national regional development strategies in different regions in a given period of time. (2) During the 15 years from 2000 to 2015, the first six major change types (each accounting for more than 5%) are industrial to balanced type, balanced to industrial type, balanced to agricultural type, agricultural to balanced type, business and tourism to balanced type, and balanced to business and tourism development type. (3) As a whole, the concentrated belts of all types of development are more “crowded” in the central and western regions by 2015, while the county-level units in most parts of the eastern region, especially the southeast, are dominated by balanced development type. The conclusions are that there are many types of rural development throughout the country, and the spatiotemporal changes are complex. The pattern of change is closely related to the continuously adjusted regional development strategy in the country.
Promoting farmers’ adoption of agricultural technologies that can improve the quality of cultivated land is important for the construction of high standard farmland. At present, credit demand rationing may cause the lack of capital investment of farming households in China. This study used the survey data of 957 grain growers in four provinces of China to examine whether credit demand rationing affects farmers’ adoption of technologies that improve cultivated land quality. A conditional mixed-process model was used for the analysis and the moderating effect of farmer differentiation on the impact of credit demand rationing on agricultural technology adoption was explored. The results show that: (1) At present, the adoption rate of agricultural technologies that improve cultivated land quality is low, and credit demand rationing is widespread. It is particularly high in the central and western parts of China, but low in the east; (2) Credit demand rationing has a negative impact on the adoption of agricultural technologies that improve cultivated land quality with the demand of capital investment, but has no significant impact on the technologies without the demand of capital investment; (3) Farmer differentiation has moderating effects on the impact of credit demand rationing. That is, under the background of credit demand suppression, there are significant differences between different types of farmers in the use of agricultural technologies with short-term benefits, and no significant difference in the use of agricultural technologies with long-term benefits.
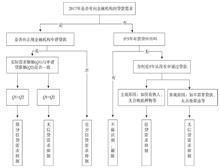
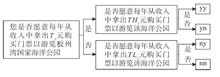
The construction of national parks is an important part of building an ecological civilization. Ticket pricing is a hot topic in the pilot and construction of the national park system. We chose the Jiaozhou Bay National Marine Park, located in Shandong Province, China, as the research area, and used double-bounded dichotomous contingent valuation method (CVM) to obtain tourists’ willingness to pay for visiting the park. By drawing on the existing research, we also constructed a willingness to pay function model and a ticket revenue function model to examine the influencing factors of tourists’ willingness to pay and the optimal ticket price. Results from estimations of the models show that the maximum willingness to pay for tourists to visit the Jiaozhou Bay National Marine Park is CNY 129.30 yuan/a. Considering the public welfare and ecological restoration purposes of the National Park, the optimal ticket price for the Jiaozhou Bay National Marine Park at this stage is CNY 108.00 yuan/a. At this price, the total revenue of park annual tickets will reach the maximum. The age of tourists has a significant negative impact on their willingness to pay. Visitors’ local household registration, education level, annual income, and awareness of environmental responsibility have a significant positive impact on their willingness to pay. In deciding differential pricing of tickets, the socioeconomic characteristics identified above and their impact on willingness to pay should be fully considered. The conclusion can provide a reference for the ticket pricing of the Jiaozhou Bay National Marine Park as well as for other natural or national parks to make differentiated ticket pricing.
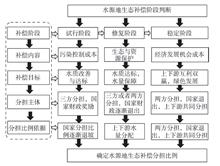
Determining the proportion of shared responsibility is the most significant issue in the practice of watershed ecological compensation. According to the stages of river pollution control and ecological restoration, a model of three stages watershed ecological compensation responsibility sharing is proposed, which involves the trial stage, the restoration stage, and the stabilization stage. In the trial stage, the goal is pollution control and water quality improvement. Cost is shared by the upstream area, the downstream area, and the central government, and the proportion afforded by the central government will decline in three years. In the restoration stage, the goal is ecological conservation and restoration, and water quality and quantity should meet the requirements at the same time. Cost is shared by the upstream area and the downstream area according to the amount of water allocation. In the stabilization stage, the goal is to achieve a win-win situation and green development of the upstream and downstream areas. The proportion of compensation responsibility is determined by the opportunity costs of the upstream area. A case study of watershed ecological compensation in Jiuzhoujiang River basin shows that, in the trial stage, the proportion of shared responsibility of the upstream Guangxi Province, the downstream Guangdong Province, and the central government in the first year is 25.00%, 25.00%, and 50.00%, in the second year is 28.50%, 28.50%, and 43.00%, and in the third year is 33.30%, 33.30%, and 33.30%. In the restoration stage, the proportion of shared responsibility of the upstream area, the downstream area, and the central government is 39.30%, 53.60%, and 7.10%. In the stabilization stage, the proportion of shared responsibility of the upstream and the downstream governments is 48.60% and 51.40%. The results can contribute to the discussion of long-term watershed ecological compensation system, and it can also be a reference for the ecological compensation responsibility sharing of the Jiuzhoujiang River basin.
In this study, the relationship between natural resources and corruption is theoretically deduced and tested empirically with provincial data in China. Theoretical analysis shows that the particularities of natural resources and the inevitable resource benefits are the starting point of corruption in resource-rich regions, but corruption can only be caused by imperfect resource benefits management institutions and existence of discretion in natural resource management system. The specific mechanism is particularities-resource income-lack of benefits distribution mechanism-excess profits-economic rent-seeking-political rent-seeking-discretion-corruption. The empirical test quantifies the relationship between resource mining, institution quality, and corruption with 1998-2017 provincial average annual cross-sectional data and short panel data divided according to the political cycle. The results show three implications. Firstly natural resources development does not lead to corruption directly because the impact of resource development on corruption is small and insignificant. With the interaction terms of resources development and institution quality, the impact of resource development has become significant, but the direction is uncertain. That is there is a threshold for institution quality. If taking the average value of insitution quality of Chinese provinces from 1998 to 2017, the coefficients were significantly. As long as institution quality of regions are above the threshold, “resource corruption” in resource-rich regions can be avoided. In addition, institution quality is not a transmission channel of the resource curse. that is, the development of resources has not reduced institution quality and “cursed” regional development. Therefore, the key of corruption elimination in resource-rich regions is innovation and improvement of resource-related institutions.
Delimiting the boundary of urban development can help to protect important ecological areas and natural resources, guide the efficient and orderly construction, prevent inefficient spread, optimize the spatial pattern of urban construction, and improve the level of land resource conservation and intensive use. This study defined a construction suitability index based on the economic and ecological perspectives. Through the calculation of the construction suitability index of landuse units and the setting of thresholds, the development boundary of Panyu District, a typical metropolis fringe town in Guangzhou City, was delimited. Under three different developing scenarios, three corresponding delimitation schemes were obtained. The results show that areas with high construction suitability in Panyu District coincidence with the current construction land. Some of the unconstructed landuse units with favorable conditions for development in the northeastern and western parts of Panyu, which are used as strategic land reserves by the local government, also have high construction suitability. The areas with low construction suitability mainly include mountain forests, water source protection areas, ecological corridors, permanent basic farmlands, and so on. In the resulting delimitation of development boundaries, ecological corridors are clearly identified. The construction land in Panyu is divided into several groups, and there is enough “ecological space” within the contiguous construction land. There are some differences in spatial distribution between the delimitation results and the current construction land, which can be used to guide and optimize the spatial pattern of urban construction and improve the level of urban land resource conservation and intensive use. The differences of the three delimitation schemes under different developing scenarios mainly lie in the allocation of landuse units with high or low economic value and ecological benefit at the same time. These landuse units locating in the “middle zone” and are not the first choice for construction, but can be included within the development boundary as an alternative if there is a need. The main conclusions of this paper are as follows: because of its own characteristics, the function of guidance, protection and optimization should be taken into account when delimiting the development boundary of metropolis fringe towns. The method of urban development boundary delimitation in this paper considers both economic and ecological aspects, and has certain flexibility, which is suitable for application in metropolis fringe towns.
Based on the 2016 China Family Panel Studies (CFPS) data, this study measured the poverty vulnerability of Chinese rural residents by constructing a feasible least squares (FGLS) model, using farmers’ risk of poverty in the future as a measure of poverty, and using propensity score matching (PSM) method to study the poverty reduction effects of agricultural land transfer. The study found that, from the perspective of poverty vulnerability, using China’s current poverty standard and 0.3 as the threshold standard of poverty vulnerability, 22.3% of rural residents are still in poverty, and the vulnerability levels in the western and northeastern regions are 0.295 and 0.258, much higher than the eastern and central regions. Agricultural land transfer has a significant poverty reduction effect, which can effectively reduce the risk of rural residents falling into poverty in the future. The test results remain robust after eliminating the “self-selection” bias through the PSM method. The agricultural output value added of agricultural land transfer is 0.573, and agricultural land transfer can reduce the poverty vulnerability of rural residents by increasing the family agricultural output value. To this end, suggestions are put forward to strengthen poverty alleviation in deep poverty-stricken areas, improve the self-development ability of residents in these areas, promote the orderly transfer of agricultural land, and cultivate moderate-scale management entities.
Under the background of rural land institution reform and labor force transfer into cities, farmers are undergoing the transformation from the traditional role of agricultural production labor force to the new role of agricultural management decision makers. Given the characteristics of high cost, high labor input, and low benefit of land investment, small-scale farmers are typical risk avoiders whose land investment behavior is more sensitive to risk factors, but their cognitive mechanism and decision-making logic are not clear yet. Based on the distributed cognition theory and perceived value theory, we conducted a survey of 483 small-holder farmers in the suburbs of the Wuhan metropolitan area. Then we used the methods of structural equation model and system dynamics model to perform the static analysis and dynamic simulation of the influence of farmers’ land investment risk perception and the development trend of investment behaviors. The research shows that: (1) Farmers’ perceived risk of land investment follows the basic framework of distributed cognition theory and is affected by the three cognitive function systems of “human power” “regional power” and “cultural power”, indicating that farmers’ risk perception of land investment mainly comes from the behavior itself, which is also the result of the combined effect of individual internal factors and external environmental factors. (2) High risk and low benefits lead to weakened perceived value, which in turn lead to reduced investment willingness, then to reduced investment behavior response, and finally higher risk and lower benefits, which form a vicious circle that restrict farmers’ land investment. Under certain policy guidance and endowment constraints, farmers can maintain their land investment behavior in a short term, but the traditional inefficient land use mode will eventually be unsustainable and for small-holder farmers the decline of productive function of land resources will be irreversible, thus the goal of rural land system reform should focus on cultivating new agricultural operators and accelerating the transformation of agricultural modernization.
In the vast rural areas of China, there exists famers’ recessive land occupation behavior against relevant laws and regulations, such as one household having several residences, one person having one house, building new houses without relocating from existing ones, and occupation exceeding approved amount of land, which have negative effects on the new-type urbanization and urban-rural integrated development. With farmers’ recessive land occupation behavior as the starting point, this article discussed the causes of farmers’ recessive land occupation behavior and the policy orientation of relevant pilot reforms from the perspective of homestead functional property change. First, through reviewing the change of homestead planned distribution system and homestead functional property, this study found that the existing homestead planned distribution system established on the basis of residential guarantee property cannot adapt to the reality of the weakening residential guarantee property and the highlighting of asset property. Then the article depicted how farmers break the limit of planned distribution system through recessive homestead occupation using a theoretical model and based on actual situations. Last, through examining the policy documents of some homestead reform pilot towns, this study found that the on-going pilot reforms are carried out in the two dimensions simultaneously, that is, “maintaining the residential guarantee property of homestead” and “adapting to highlighting asset property of homestead.” In addition, the former has clearly been favored and valued by pilot towns but the reform of the latter seems in a difficult situation. Only by considering both the residential guarantee property and the asset property of homesteads of farmers, we can achieve the effective management of farmers’ recessive land occupation behavior.
Methane (CH4) is a major greenhouse gas (GHG) after carbon dioxide (CO2), and coal mining and post-mining activities are the largest sources of CH4 fugitive emissions in China. It is of great significance for China to prepare high-quality national GHG inventory and formulate targeted GHG emission control measures through the systematic study of coal’s fugitive emissions. Following 2006 IPCC Guidelines for National Greenhouse Gas Inventories, China’s 2010-2016 CH4 emissions from coal mining and post-mining activities were calculated by tier 2 method, that is, the country-specific emission factors, and other sources by tier 1 method, that is, the default emission factors. The trend and composition of CH4 emissions, and implied emission factors were analyzed. The results show that CH4 emissions from China’s coal mining and post-mining activities rose first and then fell, reaching a peak in 2013, and the largest emission category was coal mining of underground mine, up to 83% of the total emissions when CH4 recovery was not considered. The average annual increase of CH4 recovery was 17%, the recovery rate was 27% in 2016, and the highest net emissions after deducting the recycling amount occurred in 2011. There was a large difference between the country-specific implied emission factors, and the country-specific implied emission factor of China was at the lower limit of the default values of the guidelines. The calculation of CH4 fugitive emissions from coal mining and post-mining activities in China have reached advanced level in non-Annex I countries, but there were still some gaps in emission sources, calculation method, and country-specific emission factors compared with Annex I countries. It is recommended that in the future the integrity of the inventory should be improved, the collection of activity data should be strengthened, an in-depth research on characteristic emission factors should be conducted, and the management and technology level of CH4 recycle from coal should be improved.
Studying the carbon emissions of high-carbon manufacturing industry is helpful for promoting the sustainable development of China’s industries. Using the energy consumption data of China’s provincial manufacturing industry, Intergovernmental Panel on Climate Change (IPCC) carbon emission coefficient method, spatial autocorrelation analysis, and dynamic spatial panel model, the study examined the spatial and temporal changes of carbon emissions in high-carbon manufacturing industry of 30 provinces (except Hong Kong, Macao, Taiwan, and Tibet) from 2006 to 2015. The results show that: Except Beijing and Shanghai Municipalities, carbon emissions in the rest of the provinces showed a growth trend. The “hot spots” of carbon emissions are concentrated in the Bohai Bay and Henan Province; Carbon emissions have clear path dependence and spillover effects in high-carbon manufacturing industry; The effect of economic growth is a main factor for the increase of provincial carbon emissions, and industrial structure change is an important factor for carbon emission reduction; The improvement of resource endowment level and the increase of fixed asset investment will lead to the increase of carbon emissions in neighboring provinces, but the improvement of technological level, industrial restructuring, greater openness to the outside world, and the increase of foreign investment are beneficial to reducing carbon emissions in neighboring provinces. In view of the above, the provinces should break provincial boundaries, form linkages and coordination mechanisms, break the bottleneck of technological innovation through complementary advantages, break the existing cognitive lock-in, and unlock unreasonable industrial policies. While achieving the goal of carbon emissions reduction, the green transformation and upgrading of the whole industry will be realized.
Under the framework of total factor production, this study defined the concept of water resources input congestion. Based on the FGL (F?re, Grosskopf, and Lovell) model, this study identified the “congestion” of water resources input in 31 provinces of China’s mainland from 2000 to 2016, separated the inefficiency caused by water resources input congestion from the overall inefficiency and clarified the root causes of inefficiency. The results show that:(1) The congestion of water resources input is widespread in China. During the study period, the congestion degree of the provinces changed from low to high and agglomeration to dispersed, and the spatial differences of the congestion degree of water resources input among the provinces were significant. Among them, Beijing, Zhejiang, Guangdong and other provinces and cities had low congestion degree. On the whole, the central and western regions with unbalanced input structure was more prone to congestion than the eastern regions with high level of economic development. (2) The overall inefficiency of water resources utilization in Chinese provinces presented different trends. Most provinces were jointly driven by congestion inefficiency and pure technology inefficiency. From the inter-provincial and regional perspective, the ineffectiveness rate of pure technology was the dominant factor. Inefficiency of congestion was also an important factor affecting the overall inefficiency. The government should clarify the root causes of inefficiency, adjust the input factor structure in a timely manner based on local conditions, propose improvement directions for water resources utilization, and improve water use efficiency in order to promote sustainable economic development.
Using the surface runoff data from the Global Runoff Data Base (GRDB) and the Arctic Great Rivers Observatory (ArcticGRO), this study analyzed the surface runoff variation characteristics of the six major river basins in the pan-Arctic region of Russia since 1930, and summarized the impacts of climate change and human activities on the surface runoff. The results provide a theoretical basis to further the scientific understanding of the runoff changes in the Arctic region of Russia under the background of climate change and increasing human activities, and for the rational development and utilization of water resources in the region. The results show that the annual runoff of the Severnaja Dvina, Pechora, Ob, Yenisei, Lena, and Kolyma Rivers increased at a rate of 1.53 m 3/s, 7.27 m 3/s, 15.37 m 3/s, 19.59 m 3/s, 38.41 m 3/s, and 21.15 m 3/s, respectively. The seasonal distribution characteristics of runoff are characterized by a decrease in flood peak flow during spring and summer, and an increase in runoff during winter. Seasonal distribution of surface runoff tended to be more even during the year. The change in annual runoff is mainly affected by climate change. In contrast, human activities have little effect on annual runoff in most areas. The two dominant factors, climate change and human activities, jointly drive the change in the annual distribution of runoff. Annual runoff of these rivers has increased as a result of global warming, while the annual distribution of runoff tends to be uniform under the combined effects of climate change and human activities.
The Beijing-Tianjin-Hebei Region has low per capita water resources, high water use pressure, and prominent water resources problems. Therefore, it is urgent to carry out a comprehensive evaluation of water resources carrying capacity in this area in order to provide some theoretical basis and practical experience for the comprehensive planning and efficient utilization of water resources, regional sustainable development, and so on. This study first analyzed the background of water resources utilization in the Beijing-Tianjin-Hebei Region and the water resources problems faced by the region; second, based on the analysis of water resources system, a comprehensive evaluation index system of water resources carrying capacity in the region based on quantity-quality-water bodies-flow was established; finally, the analytic hierarchy process (AHP) and entropy weight methods were used to combine subjective and objective weights of evaluation indices, and the TOPSIS evaluation model was used to calculate the comprehensive score of water resources carrying capacity. The results show that: (1) The overall lack of water resources, the over-exploitation and utilization of water resources, and the continuous overexploitation of groundwater in the Beijing-Tianjin-Hebei Region have resulted in the loss of water ecological functions and the formation of concentrated and connected groundwater funnel areas; (2) The comprehensive evaluation scores of water resources carrying capacity in 2006-2016 show a fluctuating growth trend, indicating that the carrying capacity of water resources has been strengthened, but the total score is generally low and the pressure on water resources is grim. Based on this situation, the Beijing-Tianjin-Hebei Region urgently needs to build regional and watershed water resources linkage mechanisms, and take the Beijing-Tianjin-Hebei collaborative development policy as an opportunity. According to the conditions and position in the regional development plan of different cities, urban development and industrial production should consider water resources endowments, implement the most stringent regulations on water resources management, and finally achieve the improvement of regional water resources carrying capacity.
With the rapid growth of the production and consumption of plastics, the waste and pollution of plastics become increasingly more serious. It is important to study the metabolic process of plastic resources to save the resources and protect the environment. Based on the material flow analysis method, a material flow analysis dynamic model of plastics was constructed in this study to analyze the life-cycle metabolic process of plastics from production, use, to waste from 1949 to 2018 in China. The flows and stocks of PE, PP, PS, PVC, ABS, PET and other plastic in 11 application areas were calculated, and the key points of resources waste of different kinds of plastics were analyzed. The results show that: (1) From 1949 to 2018, the consumption of plastics was 2205.6 million tons, and the output of waste plastics was 1404.8 million tons, of which 30.0% was recycled, 14.0% was incinerated, 36.0% was into landfill, and 20.0% was directly lost into the environment without treatment; (2) The in-use stocks of plastics were 630.0 million tons, and the loss stocks of plastics were 870.2 million tons, of which 66.7% were in landfill and 33.3% were carelessly discarded in the environment; (3) In 2018, the consumption of plastics was 193.1 million tons, and the output of waste plastics was 140.5 million tons, of which 32.0% was recycled, 26.0% was incinerated, 35.4% was into landfill, and 6.6% was directly lost into the environment. The study found that: The scale of plastic metabolism was large in China, and disposable plastic products had a great influence on plastic metabolism. Waste plastic was the key point of the resource loss, so the recycling of waste plastics was necessary. It was important to control the pollution of waste plastics that had entered the environment. Therefore in the future, research should focus on the risk and pollution mechanism of plastic waste scattered in the environment and improving the utilization efficiency of recycling and reusing of plastic waste, so as to reduce the loss of plastic resources and decrease the environmental pollution.
The evaluation of green economic efficiency is of great significance for evaluating the green development quality and economic transformation effect of resource-based cities in arid regions. This study built an input-output index system based on green development level and used the SBM-Undesirable and Malmquist-Luenberger index models to decompose the static efficiency and dynamic efficiency of 20 resource-based cities in the arid region of China from 2006 to 2016. It also examined the differences in green economic efficiency based on life cycle and functional classifications and dynamic change types and summarized the green development level and characteristics over 11 years for these resource-based cities. The results show that: (1) The static efficiency of green economy of these resource-based cities is generally at a low level (0.932), and the efficiency value between cities is quite different, Luliang, Yan’an and Qingyang have experienced high level of green development. (2) Classified by functional types, green economic efficiency pattern of these cities shows the following characteristics: petroleum (0.995) > comprehensive (0.958) > metal (0.908) > coal (0.904). The trends of change of metal- and coal-mining cities are similar and green economic efficiency in both types of cities is at a low level. Classified by life cycle types, the result shows that: growth type (0.978) > regeneration type (0.945) > maturity type (0.920) > decline type (0.882), while the green development of decline type cities is clearly lagging behind obviously. (3) The dynamic efficiency of green economy of resource-based cities in arid areas of China was generally in a state of growth, which gradually rose, then rapidly rose, and then slowly rose. (4) According to the ML index, the green economic efficiency state of cities is divided into four types, among which growth and fluctuating growth types account for 65%. Datong, Baotou, and Baiyin cities have higher dynamic efficiency values,and have faster growth rate of green economy. On the whole, under the guidance and overall management of national policies, the green development level of resource-based cities in arid areas is gradually improved.
The natural environment of human settlements is the basis of human development, while the scientific evaluation of human settlement natural environment is not only the premise to improve the carrying capacity of resources and environment but also the basic work to achieve sustainable development. Based on previous research, this article further discussed the evaluation methods of human settlement environmental suitability by taking Tibet as an example. The results show that: (1) The evaluation method based on conditional rules was more suitable for the evaluation of human settlement environmental suitability in Tibet; (2) More than three-quarters of the land in Tibet are unsuitable for human habitation, with most of them distributed in the northwestern part of Tibet; the area of the regions of critical suitability accounts for 16.78% of the total area of Tibet, mainly located in the YarlungZangbo River, Nyangqu River, and Lhasa River basins, the upper reaches of the Lancang River, and the northern parts of Shannan and Linzhi; the areal proportion of suitable regions was only 5.83%, concentrating in the southeast of Tibet, river valleys of the YarlungZangbo River, Nyangqu River, and Lhasa River, and valley oasis in the upper reaches of the Lancang River; (3) The distributions of different types of settlements are highly coupled with human settlement environmental suitability zones in Tibet, the proportion of town and village settlements reflecting human activities had a positive relationship with the degree of human settlement environmental suitability, while negative connection was found between the proportion of sites of pastoral people/ancient temples and relics and degree of human settlement environmental suitability. The results also validate the reliability of our evaluation method and classification of human settlement environmental suitability.