


Please enter the answer below before you can view the full text.

Chen Gao, Jun Bao, Yingui Zhou, Yuanjun Yang, Song Sun, Xiaodi Zhu, Heting Li, Shancai Zhang, and Lin Wang
ObjectiveInfrared (IR) spectroscopy has several applications. Hefei Infrared Free-Electron Laser Facility (FELiChEM) can supply bright mid/far-infrared radiation to users and provide energy chemistry research with a powerful infrastructure. A beamline must connect the free-electron laser to the experimental stations. The beamline not only efficiently transmits infrared radiation from the laser to the experimental stations but also performs focus and diagnosis during the transmittance. This paper describes the design and performance of a beamline for a Hefei Infrared Free-Electron Laser Facility, including the general requirements, design scheme and layout, optical design, beam evolution, beam transmission, laser beam splitter, online synchronized measurement of macro pulse structure, and laser wavelength.MethodsThe beamline consisted of vacuum/prop, optical/focus, and diagnosis subsystems.As shown in Fig. 1, the vacuum/prop subsystem contained 25 pieces of Φ200 mm stainless steel pipes, 12 sylphon bellows, 15 mirror boxes, and the corresponding support frames, pumps, and gauge valves.The optical/focus subsystem contained two diamond windows, 13 pieces of Φ150 mm 90° parabolic/planar off-axis mirrors, two beam splitters, and five exit windows (CsI/PTX). The far- and mid-infrared lasers passed through the diamond windows. The 0.5 mm thick diamond plate was placed at the Brewster angle to avoid refractive loss because the refractive index of the diamond was extremely high and the laser was fully polarized. They were then reflected by mirrors M1 and M3 to exit the electron beam. Subsequently, the far-infrared laser was reflected to the right and merged into one beam with the mid-infrared laser reflected by M2 at M4. The beam was further reflected upward by mirror M5, to the right by mirror M6, and penetrated the shielding wall into the experimental hall. In the experimental hall, the beam was reflected upward by mirror M7 and directed forward by mirror M8. The beam splitter reflected approximately 5% for diagnosis. Mirrors M9?M13 distributed the laser to the corresponding experimental stations. All mirrors were first mounted on multidimensional fine adjustable racks, and the racks were then fixed on the flange of the mirror boxes. The focal lengths of the mirrors were optimized using a limited screen function model so that every experimental station could obtain the smallest beam spot, except for experimental station M12, which preferred a parallel beam. The beam transmittance was also optimized. A compromise between focal spot size and transmit efficiency was considered. There were approximately 60% and 50% losses for far- and mid-infrared lasers, respectively. These losses were mainly caused by the absorption of the windows and the beam splitter.The diagnosis subsystem consisted of two beam splitters (one for far-infrared and one for mid-infrared), four mirrors, one pyroelectric detector, and one spectroscope equipped with three gratings and an arrayed pyroelectric detector (Fig. 10). We developed two synchronized data collecting/transfer circuits for the detector and an arrayed detector to meet the specific macropulse structure. The detector monitored the laser intensity to resolve the macropulses (Fig. 11). Because the bandwidth of the detector was 250 MHz, the detector could 'see' the micropulses, but could not fully resolve them as the measured width was larger than the actual width, which was several picosecond. The arrayed detector recorded the spectrum of the laser pulse using a pulse (macropulse). The diagnostic data were transferred to the EPICS, between the intervals of the macro pulses, and provided to the controlling system and the user to calibrate their data.Results and discussionsThe study was conducted in 2015. The vacuum/prop, optical/focus, and diagnosis subsystems were installed in 2017, 2018, and 2019, respectively. The first project commissioning was conducted in 2019. After several adjustments, the designed performances were achieved, and the beamline has been stable and in operation.ConclusionsAfter eight years, we constructed a beamline compatible for far- and mid-infrared free-electron lasers. All the designed objectives were achieved. Part of the fine adjustment and calibration may be performed further in future machine studies.
Apr. 25, 2024Vol. 51 Issue 8 0818001 (2024)
Haitao Chen, and Zenghui Gao
ObjectiveIt is well known that there are two typical phase singularities in the fully coherent beams, i.e., the optical vortex and the edge dislocation. Although much of research has explored properties of the fully coherent beams, there are practical uses of the partially coherent beams because they are more resistant to degradation with propagation through turbulent medium than the former. The propagation of the partially coherent beams carrying coherence singularities in oceanic turbulence has attracted much attention due to its application in underwater wireless communication. It is interesting to ask how oceanic turbulence can affect the interaction of coherence vortex and edge dislocation carried by partially coherent beams. Because the Gaussian Schell-model beam is a typical example of partially coherent beams, the interaction of the coherence vortex and edge dislocation carried by the Gaussian Schell-model beams in oceanic turbulence is studied in detail.MathodsBy making an analogy with definition of the edge dislocation in coherent beams, the coherence edge dislocation is shown to be in existence in partially coherent beams. Based on the extended Huygens-Fresnel principle, the analytical expression of the cross-spectral density for the Gaussian Schell-model beams carrying the coherence vortex and edge dislocation propagating through oceanic turbulence is derived, which is used to study the interaction of them in oceanic turbulence. The position of correlation singularities of the partially coherent beams at the z plane can be determined by the curves of the real component and imaginary component, as well as phase distribution of the spectral degree of coherence of the Gaussian Schell-model beams.Results and DiscussionsThere should exist another type of coherence singularities, namely the coherence edge dislocation with π-phase jump located along a line in the transverse plane of the correlation function, which is different from the edge dislocation in fully coherent beams (Fig.1), because the transverse edge dislocation with π-phase shift is located along a line in the transverse plane. The coherence edge dislocation is split into two optical vortices by the coherence vortex if the edge dislocation is off-axis, while it is broken into one optical vortex as it is on-axis. The result is similar to the interaction of the phase vortex and edge dislocation in free space. The coherence edge dislocation is translated into one coherence vortex or two vortices with propagation of the beams in oceanic turbulence (Fig.3). The total topological charge is not conserved with propagation of the initial beams with the coherence vortex and off-axis edge dislocation in oceanic turbulence, because appearance or disappearance of a coherent vortex may take place with propagation. The result is different from the interaction of a phase vortex and an off-axis edge dislocation in free space, because the total topological charge is conserved in the latter case. The evolution of the coherence singularities speeds up with increasing the value of the rate of dissipation of mean-square temperature χT and the relative strength of salinity and temperature fluctuationω, as well as decreasing the rate of dissipation of turbulent kinetic energy per unit mass ε (Fig.4). The physical reason can be explained by the theoretical expression of the strength of oceanic turbulence. It is seen that the strength of the oceanic turbulence becomes stronger with increasing the rate of dissipation of mean-square temperature and the relative strength of salinity and temperature fluctuation, as well as decreasing the rate of dissipation of turbulent kinetic energy per unit mass. When the initial beam parameters, such as the spatial correlation length δ0, the off-axis distance and the slope of the edge dislocation of the coherence edge dislocation change, the changes of positions and number of coherence singularities in the fields take place with propagation of the beams. It is found that not only creation and annihilation of a pair of coherent vortices, but also appearance and disappearance of a vortex take place with varying the initial beams parameters (Figs.5‒7).ConclusionsIn the present study, we have firstly introduced the definition of the coherence edge dislocation in accordance with previous researches. Then, the analytical expression of the cross-spectral density for the Gaussian Schell-model beams carrying the coherence vortex and edge dislocation propagating through oceanic turbulence is derived, which is then used to study the interaction of them in oceanic turbulence. It has been shown that the interaction depends on propagation distance, oceanic turbulence parameters, and the beam parameters such as the spatial correlation length and the slope and off-axis distance of the coherent edge dislocation. The creation and annihilation of pairs of coherence vortices occur and the appearance and disappearance of a coherent vortex may also take place by changing these influencing factors. The total topological charge is not generally conserved with propagation of the initial beams. Furthermore, the stronger the oceanic turbulence is, the faster the decrease of the distance for the conservation of the topological charges is.
Apr. 25, 2024Vol. 51 Issue 8 0805002 (2024)
Qi Zhang, Qili Hu, Hongyan Wang, Ming Hu, Xingyu Xu, Jingjing Wu, and Lifa Hu
ObjectiveThermal blooming severely reduces beam quality and limits the efficiency of high-energy laser transmission in the atmosphere. Therefore, it is important to study the thermal blooming of high-energy laser propagation in the atmosphere systematically. Numerical simulation of thermal blooming is beneficial for the application of high-energy lasers. Numerical simulation methods for thermal blooming include perturbation, integral, and phase screen methods. However, most existing studies used only one of them for simulation, which led to obvious errors under some conditions. In this study, we compared the results of three methods and selected an appropriate numerical simulation range for each method based on the reported experimental results. In addition, field experiments for measuring the transmission of high-energy lasers in the atmosphere are complicated, and the experimental conditions are uncontrollable. Therefore, using a liquid crystal spatial light modulator (LC-SLM) based on the transmission characteristics of high-power lasers in the atmosphere is a valuable and cost-saving method for laboratory simulations of thermal blooming. We extracted the thermal blooming distortion phase based on the principle of the numerical simulation method and then used an LC-SLM to simulate thermal blooming in the laboratory. The experimental simulation results are consistent with the numerical simulation results.MethodsIn this study, numerical simulations of thermal blooming were performed using the perturbation, integral, and phase screen methods. First, the results of different numerical simulation methods for different transmission distances were compared. The results obtained using the different numerical simulation methods were significantly different, even under identical conditions. The relative peak intensity IREL (ratio of maximum received light intensity to maximum initial light intensity) was measured as a function of the generalized distortion parameter N in the reported reference. A reasonably fitted curve was then selected as the reference data. The reasonable ranges for each method were determined by comparing the three numerical simulation results with the reference results. Subsequently, the thermal blooming distortion phase was extracted according to the applicable numerical simulation method under the conditions set for the laboratory experiments. Finally, laboratory experiments on thermal blooming were conducted using LC-SLM.Results and DiscussionsThe relationship between the normalized peak intensity IREL generated by the three numerical simulation methods and the generalized distortion parameter N is compared with the reference data at different transmission distances (Fig. 3). The errors of the perturbation and integral methods are small when N<4.8 (the errors of the two methods are approximate), and the error of the phase screen method is small when N>4.8. The relationship between the normalized peak intensity IREL generated by the three numerical simulation methods and the generalized distortion parameter N is compared with the reference line at different initial laser powers (Fig. 4). The error of the perturbation method is small when N<3, that of the integral method is small when 3<N<4.8, and that of the phase screen method is small when N>4.8. The relationship between the normalized peak intensity IREL generated by the three numerical simulation methods and the generalized distortion parameter N is compared with the reference line at different wind speeds (Fig. 5). The error of the perturbation method is small when N<2.8, that of the integral method is small when 2.8<N<4.8, and that of the phase screen method is small when N>4.8.ConclusionsIn this study, various ranges of generalized distortion parameter N applicable to each numerical simulation method are selected by comparing the error between the normalized peak intensity IREL generated by the three numerical simulation methods and the reference line under different setting conditions. When the generalized distortion parameter N is less than 3, the error of the integral method is the smallest. When the generalized distortion parameter N ranges from 3 to 4.8, the error of the perturbation method is the smallest. When the generalized distortion parameter N is greater than 4.8, the error of the phase screen method is the smallest. Additionally, laboratory experiments are performed using LC-SLM. The phase of the thermal blooming distortion is accurately extracted and added to the phase modulator, and its effect of thermal blooming distortion is recorded using a CCD. The experimental results are in good agreement with the simulation results, confirming the feasibility of this experimental method. This work proposes a quantitative, accurate, programmable, and easily repeatable laboratory simulation device that provides an effective means for laboratory evaluations of the atmospheric transmission of high-energy lasers.
Apr. 25, 2024Vol. 51 Issue 8 0805003 (2024)
Mingjun Wang, and Yan Zhang
ObjectiveThe ocean is an important part of the Earth, covering 70% of the Earth's surface. Therefore, marine optical communication is an important field for researchers in optical communication technology. Vortex beams, which carry orbital angular momentum (OAM), can be considered as a new degree of freedom. By leveraging the orthogonal and infinite properties of the OAM mode, these beams can enhance the capacity and spectral efficiency of communication systems. Additionally, the array beam is composed of several single beams with different arrangement modes. Previous studies have shown that the array beam not only improves the transmission power but also suppresses the influence of turbulence on beam transmission. Therefore, researchers developed linear, rectangular, and radially distributed laser arrays. Current research mainly focuses on array beam transmission in the atmosphere, and there is a paucity of studies on transmission characteristics in the ocean. However, these methods are based on Nikishov stable stratified sea spectra with an infinite outer scale, and there have been few studies on the drift characteristics and beam propagation of array vortex beams. Therefore, this study aims to investigate the transmission characteristics of single vortex beams, radial array vortex beams, and rectangular array vortex beams in an unstable stratified ocean considering external scales and analyze the influence of distance on their light intensity and phase. The results of this study provide a theoretical foundation for the development of underwater optical communication technologies.MethodsIn marine media, refractive index fluctuations are controlled by temperature and salinity fluctuations. In this study, the low-frequency components were superimposed on a phase screen simulated using the power spectrum inversion method to compensate for the absence of low-frequency components. The field phase in the beam propagation path changes after the beam passes through multiple random phase screens. The process of a beam passing through multiple random-phase screens was similar to beam propagation in ocean turbulence. When the three vortex beams pass through the ocean turbulence, their light intensities dispersed. Therefore, 500 sets of data were averaged after the three vortex beams passed through the phase screen. It is then calculated according to the definitions of the beam drift, beam spread, and light intensity flicker.Results and DiscussionsWhen the transmission distance is constant, the drift of the single vortex beam is the largest, and the drifts of the two vortex beams are relatively small. Additionally, the larger the r0 and xd of the array vortex beam, the smaller the drift. When xd=yd=6w0, r0=6w0, the drift of the radial array vortex beam is greater than that of the rectangular array vortex beam. This is because the sub-beams at the four corners of the rectangular array vortex beam are relatively far from the center [Fig. 5(b)]. Additionally, the beam width of the two arrays of vortex beams slowly with an increase in w0. The radius of the single vortex beam decreases when it reaches a certain level and then begins to increase monotonically. When fixed, the outer scale of the turbulence minimally impacts the beam widths of the three vortices [Fig. 6(e)].ConclusionsAfter the two arrays of vortex beams transmit for a certain distance, they no longer maintain the initial array distribution, and the sub-beams affect each other and produce interference fringes. Under the same conditions, the drift of the single vortex beam is larger and the beam width is smaller than those of the two array vortex beams. However, the drift of the radial array vortex beam is larger and the beam width is smaller than those of the rectangular array vortex beams. The scintillation of the single vortex beam is larger than those of the two array vortex beams, and that of the rectangular array vortex beam is larger than that of the radial array vortex beam. At strong turbulence and long distances, the widths of the three vortex beams gradually decrease.
Apr. 25, 2024Vol. 51 Issue 8 0806001 (2024)
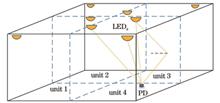
Chuangshi Wang, Yong Chen, Huanlin Liu, Jinlan Wu, Hao Chen, and Weiwei Zhang
ObjectiveWith the rapid development and application of the Internet of Things (IoT) and indoor activities, high-precision indoor positioning technology based on location services has a wide range of applications. Given that GPS and Beidou signals lead to signal attenuation when penetrating buildings, it is impossible to realize accurate indoor positioning, and an effective indoor positioning method is urgently required to compensate for the vacancy of high-precision indoor positioning. Compared with other indoor positioning methods, visible light indoor positioning, based on the received signal strength, can be used as an effective indoor positioning method owing to its advantages of low cost, high precision, and ease of deployment. However, the existence of multipath effect, shadow change, receiver thermal effect, and other problems can lead to fluctuations in the strength of the received indoor visible light positioning signal, and thereby, resulting in large positioning errors. Furthermore, in extant studies, researchers tend to solely examine one positioning unit and assume that it can be completely copied to other positioning units. However, the migration from one positioning unit to other positioning units may lead to high positioning errors due to different LED positions, varying noise levels, and other differences. Therefore, it is important to solve the jitter problem of the received signal and improve the accuracy of indoor positioning.MethodsTo address the problem of jitter in received signals, in this study, a convolutional neural network was proposed based on an attention mechanism (Fig. 4) to reduce the impact of fluctuations in received signals. First, a fast Fourier transform was used to preprocess the received time-domain signal strength values, and the power spectra of the signals were obtained. A CNN with an attention mechanism was used to extract the features of the signal power spectrum, and a channel attention module (Fig. 5) was used to increase the weights for each channel to reduce the influence of redundant information on the network. This in turn reduces the influence of signal fluctuations on positioning accuracy. To solve the problem, in which migrating to different localization units may decrease the localization accuracy, transfer learning was used to migrate the network trained in the first localization unit to other localization units. Based on the premise that the general features of each location unit are similar, the parameters of the attention convolutional neural network trained in the first unit were maintained as unchanged, and only the final fully connected layer was updated. This can reduce the cost of the training network without changing the location accuracy.Results and discussionsA simulation environment of 10 m×10 m×3 m (Table 1) is divided into four positioning units. The proposed algorithm is simulated and compared with the convolutional neural network algorithm. The simulation results (Fig. 7?Fig. 10) indicate that the proposed algorithm can realize 3D positioning with an average error of 3.54 cm in a positioning unit of 5 m× 5 m×3 m. The average error of the CNN algorithm is 4.25. Furthermore, through the introduction of transfer learning, the proposed neural network model can be deployed more easily in other positioning units with an average error of 3.67 cm. Additionally, the training time of the neural network in the other positioning units is significantly shortened, which can effectively reduce the time and computing costs during network deployment. A 1.5 m×1.2 m×1.2 m positioning platform (Table 2) is built and divided into two positioning units for testing (Fig. 12). A comparison with the comparative algorithms shows that the algorithm proposed in this study can effectively reduce the impact due to the fluctuation of the received signal strength, with an average error of 3.32 cm and 90% of the errors are within 4.12 cm. When transfer learning is deployed to the second location unit, the average error is 3.35 cm, and the location performance does not deteriorate. Based on simulations and experiments, it is proven that the proposed algorithm exhibits excellent performance in terms of convergence speed and anti-jitter of the received signal.ConclusionsIn this study, a convolutional neural network (CNN) algorithm based on an attention mechanism is proposed to realize three-dimensional indoor positioning. By preprocessing the received signal strength in the time domain and iterating the channel information using the attention mechanism, the algorithm effectively improves the positioning accuracy and fitting rate of the neural network and reduces the training cost of the neural network. To reduce the positioning accuracy after application to different positioning units, transfer learning is deployed to other positioning units. Compared with the convolutional neural network model, the proposed algorithm can effectively improve the positioning accuracy and fitting rate. Compared with the comparative algorithms, the proposed algorithm is not only more accurate, but can also maintain positioning accuracy when deployed to other positioning units. Simulation and experimental results show that the proposed algorithm can effectively reduce the influence of the received signal strength fluctuation on the positioning accuracy and improve the positioning accuracy.
Apr. 25, 2024Vol. 51 Issue 8 0806002 (2024)
Tangyue Li, Da Mu, Pengyu Xia, Yue Zhang, and Huiyang Xie
ObjectiveThe term “terahertz radiation” typically refers to the frequency range of 0.1 THz to 10 THz in electromagnetic waves, positioning terahertz waves between microwaves and infrared. Due to the unique frequency band of THz waves, they exhibit several distinctive characteristics. (1) Transience: The signal amplitude of THz pulses is very low, yet they possess a noticeable peak value, making them valuable in time resolution research applications. (2) Spectral resolution function: Experimental THz radiation sources typically consist of only a few pulses, each covering a spectral range containing the vibrational and rotational energy levels of numerous macromolecules, facilitating substance identification. (3) Safety: The photon energy at 1 THz frequency is approximately 4 meV, and terahertz radiation does not easily disrupt the molecular structure of the detected substance when applied in medical imaging. (4) Penetration: With a wavelength falling between microwaves and millimeter waves, terahertz waves can pass through small particles in the air. Given these unique properties of THz rays, THz technology holds significant application prospects in safety inspection, communication technology, terahertz radar, astronomy, biomedical imaging, chemical identification, materials science, and other fields. Consequently, the generation, detection, and application studies of terahertz waves constitute a prominent research area.MethodsUtilizing a double-lens transmission matrix, an initial double-lens structure was designed, encompassing both aperture and thickness considerations. Subsequently, leveraging Gaussian beam transmission characteristics, the size and position of the beam waist were meticulously determined, optimizing the entire optical system. This process enables the creation of a fiber coupling system with a small aperture and high efficiency. The optical simulation software ZEMAX was employed to scrutinize the initial fiber coupling system’s design, aligning with terahertz time-domain spectroscopy (THz-TDS) and fiber coupling technology features. The optical simulation software was further utilized to trace the system’s light, facilitating the preliminary establishment of the placement angle and position between optical components, such as the delay line and light source, ensuring successful light recovery. Concurrently, the delay line and the coupled optical system were configured to avoid mutual interference, allowing for the optimization of the fiber coupling system’s structure. This optimization aimed to achieve higher coupling efficiency and improved beam quality. Considering the practicalities of the experimental installation process, the mechanical structure of the entire module was designed based on the optical specifications. This approach ensures that all system components can be installed and adjusted cohesively. The coupling lens’s mechanical structure was devised as a five-dimensional adjustment structure, characterized by its simplicity, convenient machining and assembly, compactness, high stability without a transmission gap, and five degrees of freedom for three-dimensional translation and two-dimensional angle rotation.Results and DiscussionsThe collimated coupled optical system’s single-mode fiber coupling efficiency is illustrated in Fig. 2. When the system was positioned in front of the rotating delay line, the light followed a path reflected back through the delay line, coupling to the original fiber and rendering the system lens entirely symmetrical, resulting in a high coupling efficiency with a single-mode fiber. Figures. 4 and 5 depict the optimized collimated coupling optical system with its single-mode fiber coupling efficiency and the actual optical path diagram. The observed coupling efficiency with a single-mode fiber was 76.27%, approaching the ideal coupling efficiency of 81.45%. Accounting for Fresnel reflection loss at the incident end face of the fiber, the maximum coupling efficiency was reduced to 78%, closely aligning with the system’s actual coupling efficiency. Simultaneously, the single-mode fiber coupling efficiency reached 97.25% for physical optical propagation. Consequently, following system optimization, the coupling efficiency was markedly high, meeting the specified coupling requirements.ConclusionsThe fiber THz-TDS transceiver-integrated coupling system differs from traditional fiber THz-TDS by incorporating a delay line with the fiber in the coupling aspect, simplifying the structure of the fiber coupling system. An optical system with high coupling efficiency was designed based on the principles of a Gaussian beam relay and the characteristics of a double lens. The single-mode fiber coupling lens model was developed using ZEMAX software, and the system underwent optimization to enhance the coupling efficiency of the single-mode fiber. The results demonstrate that the coupling efficiency reached 97.25%, meeting the high-efficiency coupling requirements for single-mode fibers in terahertz time-domain spectroscopy systems. This not only provides a guiding direction for the design of coupling lenses but also contributes to the advancement of miniaturized terahertz time-domain spectroscopy instruments.
Apr. 25, 2024Vol. 51 Issue 8 0806003 (2024)
Guanxin Yan, and Yongqin Hao
ObjectiveCompared with edge-emitting lasers, vertical-cavity surface-emitting lasers (VCSELs) have superior performance, such as a lower threshold current, single longitudinal-mode output, easy 2D array integration, low power consumption, and low fabrication cost. With the development of large apertures as well as 2D arrays of VCSELs, the output power of VCSELs has been significantly improved, and they are widely used in such fields as optical communication, optical interconnection, and optical information processing. In addition, the applications of VCSEL devices in the consumer field are becoming increasingly extensive, such as LiDAR, distance sensing, autofocusing, 3D sensing, rainbow-mode recognition, air and water quality detection, and virtual reality (VR)/augmented reality (AR)/mixed reality (MR). In recent years, the performances of VCSELs in terms of output power, conversion efficiency, modulation bandwidth, and reliability have improved continuously. However, high-power VCSEL single-tube or array devices are mostly multi-transverse-mode outputs, resulting in poor output beam quality. Therefore, improving device power while obtaining better beam quality in the optical field is a technical challenge that current researchers must solve. In this study, a novel multi-ring cavity structure is used to integrate VCSEL arrays to obtain a better far-field distribution while maintaining a high power output, further expanding the application range of VCSELs in the field of smart devices.MethodsIn this study, by analyzing the reasons for the non-uniform carrier distribution of large-aperture VCSELs, a multi-annular cavity structure [Fig. 2(b)] is designed to separate the injected current region into multiple regions to suppress the carrier aggregation effect. The finite-different time-domain (FDTD) method is used for the simulation to optimize the optical field distribution by adjusting the size of the annular cavities and the percentage of the light-out region. On this basis, traditional and new-structure VCSELs with identical external diameters of light exit holes are prepared on the same epitaxial wafer, and their light field uniformity and output characteristics are compared and analyzed.Results and DiscussionsNear-field photographs of conventional and novel-structure VCSELs tested under the same injection conditions are taken (Fig. 5). The test results show that the light field distribution uniformity of the conventional VCSEL structure [Fig. 5(d)] is extremely poor, and only the annular region near the electrode ring emits light. In contrast, the three ring-cavity structures (A, B, and C) are fully illuminated in all light-emitting regions and have a more uniform light field distribution, which significantly improves the extremely poor light field distribution of the conventional structure owing to the carrier aggregation and space-burning hole effects. By comparison, it can be seen that the structure C not only has better light field uniformity and high utilization of the light-emitting region but, more importantly, has the strongest light field, which is consistent with the theoretical simulation results. In addition, as can be seen from the far-field distribution and spectrogram of the VCSEL with structure C (Fig. 6), the optical field center of the far field has a strong intensity, showing a Gaussian distribution, and the excitation spectrum verifies its excellent single-mode characteristics, with a peak wavelength of 805.03 nm and a spectral full width at half-maximum of 0.82 nm. The device exhibits a very good excitation characteristic. In addition, the conventional VCSEL structure (Fig. 8) has a maximum continuous output power of 90 mW at 0.7 A and a threshold current of 80 mA. The output power and slope efficiency of the new structure are improved compared with those of the traditional-structure device, and the threshold current is reduced. The threshold current of new structure C is 49 mA, and the maximum continuous output power is 140 mW, which is nearly 56% higher than that of the conventional structure.ConclusionsIn this study, by analyzing the reasons for the uneven carrier distribution of large-aperture VCSELs, a multi-annular-cavity-structured VCSEL is designed, and the optical field of the new structure is simulated. The results show that the optical field distribution can be optimized by optimizing the dimensions of the annular cavities and the percentage of the light-output region. Based on this, traditional and new-structured VCSELs with identical external diameters of light exit holes are prepared on the same epitaxial wafer, and the light field uniformity and output characteristics of the new structure are compared and analyzed. The results show that the new structure improves the uneven distribution of the light field caused by the carrier aggregation effect of the traditional structure. The new multi-ring cavity structured VCSEL with a 67% duty cycle has the best near-field distribution, and the threshold current is reduced. On applying an injection current of 0.8 A, the continuous output power at room temperature reaches 140 mW, which is 56% higher than that obtained with the traditional structure, and the far-field shows a Gaussian distribution. In addition, the beam quality is better, which meets the demand for high-power and high-beam-quality semiconductor laser sources for VCSELs in the field of optical communication and further expands the application range of VCSELs in the field of intelligent devices.
Apr. 25, 2024Vol. 51 Issue 8 0801001 (2024)
Jifang Shang, Qinglian Li, Xing Sun, Ling Chen, Wenjing Du, and Liubang Li
ObjectiveElectro-optic (EO) Q-switching technology has been extensively used to fabricate pulsed lasers. Its advantages of a faster switching rate, better hold-off ability, and controllable repetition rates enable the generation of energetic short laser pulses. To date, practical EO crystals include LiNbO3 (LN), LiTaO3 (LT), KD2PO4 (DKDP), and RbTiOPO4 (RTP). To achieve a low driving voltage, the laser must propagate along the non-optical-axis direction of these crystals, which introduces additional phase retardation induced by natural birefringence. Using a second crystal that is rotated 90° with respect to the first crystal is necessary to compensate for the natural birefringence and its strong thermal fluctuations. However, achieving double-crystal EO Q-switches with a high extinction ratio is difficult because both crystals should have high transverse optical homogeneity and should be carefully matched. The matching quality may be affected by numerous factors, including the optical inhomogeneity of the crystals, optical processing accuracy, and temperature changes. To date, factors affecting the extinction ratio of double-crystal EO Q-switches have not been systematically studied, limiting the development and application of double-crystal EO Q-switches. In this study, we comprehensively analyze the factors affecting the extinction ratio and fabricated double-crystal LT EO Q-switches.MethodsFirst, using double-crystal LT EO Q-switches as examples, we analyze the factors that affect the extinction ratio of double-crystal EO Q-switches. To maximize the EO effect, an LT Q-switch is fabricated from two x-cut LT crystals with light propagating along the x axis and voltage applied along the z axis. A set of analytical phase-shift formulas that consider the optical inhomogeneity, crystallographic orientation deviation, length deviation, and temperature change of the two matching crystals are derived. Combined with the transmittance formula for the parallel-polarization system, the tolerances of these factors are calculated using an extinction ratio of 100∶1. Accordingly, we fabricate two LT EO Q-switches with aperture of 9 mm×9 mm and lengths of 10 mm and 5 mm, respectively. The matching crystals are polished using the same polishing lap to ensure that the deviations in length and orientation satisfy the requirements. Each face of the crystals is finely ground, and the x surface is precisely polished and coated with anti-reflection films at 1064 nm. The z surface is then plated with gold and chromium. The two matching crystals are packaged in an elastic holder. The matching quality and extinction ratios are measured and characterized.Results and DiscussionsAccording to univariate analysis, the extinction ratio of double-crystal EO Q-switches is strongly related to the optical inhomogeneity, crystallographic orientation deviation, and the length and temperature differences of the two matching crystals. The extinction ratio is inversely proportional to the square of the optical inhomogeneity [Fig. 2(b)] and those of the length and temperature differences when the other parameters are kept constant. In addition, the crystal length significantly affects the extinction ratio. When the optical inhomogeneity, crystallographic orientation deviation, and temperature difference are set, the extinction ratio is inversely proportional to the square of the crystal length [Fig. 2(a)]. In addition, even the same change in temperature in the two matching crystals may affect the extinction ratio when a difference in crystal length is observed. To achieve an extinction ratio of 100∶1 under a crystal length of 10 mm, laser spot radium of 2.5 mm, and wavelength of 1064 nm, the optical homogeneity must be better than 6.8×10⁻⁶/cm, the x and z orientation deviations should be less than 1.3° and 3.1°, respectively, the length difference should be less than 4.6 μm, and the temperature difference must be less than 0.16 ℃. For the two prepared LT EO Q-switches (Fig. 4), the shorter switch exhibits a better matching quality and higher extinction ratio (Fig. 6). The extinction ratio of the shorter LT Q-switch is approximately three times that of the longer switch (Table 1). However, the extinction ratios of both Q-switches are low due to poor optical homogeneity (Fig. 5).ConclusionsUsing double-crystal LT EO Q-switches as an example, we systematically analyze the factors affecting the extinction ratio and calculate their tolerances. Based on the theoretical results and practical difficulties of crystal growth and optical processing, the optical inhomogeneity and length and temperature differences are verified as critical factors that must be strictly controlled. In addition, the extinction ratio is found to be inversely proportional to the square of the crystal length when the optical inhomogeneity, crystallographic orientation deviation, and temperature difference are constant. Accordingly, we prepare two double-crystal LT EO Q-switches with different lengths. A shorter LT Q-switch is verified to have a better matching quality and higher extinction ratio. However, the extinction ratios of both Q-switches are low due to poor optical homogeneity. Double-crystal LT-EO Q-switches with high extinction ratios can be achieved using crystals with high optical quality. This work can be of significance in guiding the development of double-crystal EO Q-switches with high extinction ratios.
Apr. 25, 2024Vol. 51 Issue 8 0801002 (2024)
Zhongbiao Chen, Bifeng Cui, Xiangrui Zheng, Chunpeng Yang, Bozhao Yan, Qing Wang, and Xinyu Gao
ObjectiveVertical cavity surface-emitting lasers (VCSELs) have advantages such as a single longitudinal mode, a low threshold, and ease of two-dimensional integration. VCSELs have been widely used in data transmission, optical communication, and three-dimensional sensing. Oxidation is the most common process for oxide-confined VCSELs. AlGaAs materials with high Al contents are oxidized via wet oxidation to form oxide apertures of aluminum oxide, and the structures of oxide apertures with different shapes and sizes have different effects on the optoelectronic characteristics of VCSELs. However, during the actual oxidation of the AlGaAs oxide confinement layer, the shape and size of the oxide aperture do not satisfy expectations because of various factors, which adversely affect the performance of the device in terms of the excitation mode, threshold current, and divergence angle. In this study, the dry etching and wet oxidation processes of VCSELs are experimentally investigated, and an optimized process scheme for oxidation pretreatment that combines dry etching and (NH4)2S passivation is developed. An (NH4)2S solution is used to passivate the table structure after dry etching, which achieves a stable oxidation rate and improves the quality of the oxide aperture shapes, further improving the optoelectronic characteristics of VCSELs and extending the applications of VCSELs in optoelectronics.MethodsIn this study, an (NH4)2S solution is used. Prior to oxidation, a cleaned VCSEL is passivated in a (NH4)2S (sulfur mass fraction >8%) solution in a heated water bath. After oxidation, the surface and sidewall microstructures of the VCSEL are observed using scanning electron microscopy (SEM). The shapes and sizes of the oxidation apertures of the VCSELs are observed separately using a microscope, and the oxidation rates of the oxidation apertures are determined. Based on this, the photoelectric properties of the unpassivated and passivated VCSELs are comparatively analyzed.Results and DiscussionsAfter wet oxidation, the layered structure of the unpassivated VCSEL undergoes fracturing and separation, and the VCSEL structure undergoes distortion [Fig.3(a)]. However, the passivation-pretreated VCSEL exhibits less significant fracture and delamination and good sidewall integrity [Fig.3(b)]. The passivated VCSEL [Figs.4(a1) and (a2)] has smoother oxide hole edges and more regular oxide aperture shapes than the unpassivated VCSEL [Figs.4(b1) and (b2)]. With an increase in the oxidation depth, the oxidation aperture of the passivated VCSEL has a somewhat diamond shape [Fig.4(a3)], whereas that of the unpassivated VCSEL has an irregular pentagonal shape [Fig.4(b3)]. The oxidation rate of the unpassivated VCSEL always exceeds that of the passivated VCSEL (Fig.5). The test results (Fig.6) show that the saturated output power of the passivated VCSEL is stable at 6.16 mW, whereas that of the unpassivated VCSEL varies between 5.18 mW and 6.14 mW. Moreover, the slope efficiency of the unpassivated VCSEL fluctuates within 0.40?0.42 W/A, and the slope efficiency of the passivated VCSEL is improved by 5% and stabilizes at 0.44 W/A. In conclusion, the passivated VCSEL exhibits improved device performance consistency, whereas the unpassivated VCSEL exhibits unstable device performance. Variability in the performance of both devices exists. In addition, the threshold currents of both VCSELs are close to 0.80 mA, but the threshold currents of the passivated VCSEL decrease to 0.72 mA. As shown in Fig.7(a), the side-mode rejection ratio of the passivated VCSEL reaches up to 36 dB at a driving current of 1 mA, whereas that of the unpassivated VCSEL is 22 dB, with the appearance of two excitation modes. When the current reaches eight times the threshold, the passivated VCSEL excites two modes, and a third mode gradually starts to appear but still manages to maintain a few mode outputs [Fig.7(b)]; in comparison, the unpassivated VCSEL appears with four or more modes [Fig.7(c)].ConclusionsIn this study, the effect of a preoxidation pretreatment process scheme that combines dry etching and (NH4)2S passivation on the sidewall integrity and oxide aperture of a VCSEL is investigated. The (NH4)2S passivation technology can effectively remove nontarget products, such as oxides, on the sidewall of the stage and minimize device delamination and fracturing during oxidation, improving the sidewall integrity and sample quality. The oxidation rate of the high-alumina component AlGaAs layer on the sidewall is more uniform and stable, and the oxide aperture shape is regular. Based on this, the passivation process is applied to prepare oxide-confined VCSELs with a 5-μm-diameter oxide aperture. Comparison experiments show that the maximum slope efficiency and threshold current characteristics of the VCSEL prepared by this process improve, and the device performance consistency is enhanced. The side-mode rejection ratio of the passivated VCSEL can reach 36 dB at a driving current of 1 mA in a single-mode excitation state. This study shows that the proposed oxide-optimized process scheme based on dry etching and (NH4)2S passivation is beneficial for the preparation of oxide aperture structures with regular shapes and good follow-through, which improves the structural stability of the device and the device performance of oxide-confined VCSELs.
Apr. 25, 2024Vol. 51 Issue 8 0801003 (2024)
Zhiqiang Wan, Aibi Yang, Guanghua Yang, Shan Yu, Ziye Hu, Jilong Tang, and Zhipeng Wei
ObjectiveAdjustable-ring-mode fiber lasers hold significant application value in the field of lithium battery welding, with the fiber combiner serving as a pivotal component, playing a crucial role in improving the performance of these fiber lasers. Presently, there is a growing body of research dedicated to power improvement and beam quality optimization for signal combiners. This research predominantly revolves around modifying the number of input ports and varying the core diameter of the output fiber. Comparatively, there is a dearth of studies focusing on circular beam adjustable signal combiners. Compared with traditional high-power fiber lasers, the adjustable-ring-mode fiber laser can prevent spattering and improve welding stability. The performance of this combiner is such that the center and external ports can operate independently. Based on this working principle, a signal combiner featuring a large-core-diameter output fiber is fabricated. This combiner attains exceptional transmission efficiency, superior beam quality, and remarkable resistance to high and low temperatures, rendering it suitable for the new field of lithium battery welding.MethodsUtilizing beam incoherent synthesis technology, a simulation of the beam combiner is conducted using RSoft software. This simulation scrutinizes alterations in its mode field. The designed beam combiner satisfies the principles of adiabatic taper and brightness conservation. The relationship between the taper ratio and input fiber diameter is analyzed, delineating the range of taper ratio that ensures the autonomous operation of inner and outer ring fibers, even with different input fiber diameters. Considering the impact of cone size on cutting and welding processes, the cone size is determined, and the variations in the three mode fields under varying taper ratios are simulated and analyzed. Subsequently, the influence of the hydrofluoric acid solution concentration on the corrosion time and corrosion efficiency is studied, with pretreatment of the input fibers based on the research findings. Finally, the taper fiber bundle is fabricated using the sleeve method, and the fusion cone fiber bundle and output fiber are fused together using a welding machine, culminating in the successful construction of the combiner.Results and DiscussionsThe designed fiber combiner exhibits good transmission characteristics, with each port achieving a transmission efficiency of ≥98% (Table 1). As the power levels increase, the temperature at each port increases by 25?35 ℃ (Fig. 7). Each port of the fiber combiner can independently handle power levels exceeding 3 kW, and when operating in tandem, the inner and outer rings collectively handle power levels surpassing 6 kW. This underscores its capacity to perform reliably at higher power levels, ensuring exceptional stability. Furthermore, the beam quality factor (M2) of the central port is 1.76, with the central curve showcasing a good Gaussian distribution. Any defects observed may be attributed to quartz block head (QBH) compatibility. The external port M2 demonstrates remarkable consistency, as elucidated in Table 2, and the maximum M2 value recorded stands at a mere 88.2, underscoring the outstanding beam quality of both the central and outer rings. Compared with previous results, we consider that this combiner represents the best beam-quality performance. Further enhancements can be achieved through adjustments in the taper ratio or a change in the input fiber type. High- and low-temperature resistance tests show that the transmission efficiency of the combiner decreases slightly under both high- and low-temperature conditions; however, it remains above 97% (Fig. 10). This change is more pronounced at low temperatures than at high temperatures, likely attributable to thermal expansion and contraction-induced bending within the adhesive. Notably, an excessive cutting angle leads to greater welding loss.ConclusionsIn this study, we investigate the key components of a ring spot adjustable fiber laser beam combiner. Through theoretical research and simulation experiments, we find that the input fiber cladding diameter measures 100 μm and the TFB diameter is 330 μm. Subsequently, we fabricate a large-core-diameter toroidal beam spot tunable signal bundler with high beam quality, and we accomplish this with a taper ratio of 0.835. In the context of a large-core-diameter circular dual-core fiber, we manufacture a high-beam-quality large-core-diameter circular spot adjustable signal combiner. The overall transmission efficiency of the combiner exceeds 98%, and it exhibits good transmission characteristics. In the beam quality test, the center M2 is 1.76, while the outer ring M2 ranges between 82 and 89. By adjusting the input port, we can direct either circular Gaussian beams or circular flat top beams independently onto the surface of the working material, or simultaneously apply both to the material surface. Finally, we conduct an environmental reliability test on the combiner, subjecting it to three distinct temperature conditions. The results show that the efficiency of each port experiences a slight decline at both high and low temperatures in comparison to that at room temperature. Notably, the transmission efficiency is the lowest at lower temperatures, attributable to cone bending; however, the transmission efficiency still remains above 97%. The all-fiber ring-spot adjustable signal combiner exhibits the advantages of exceptional transmission characteristics, minimal thermal effects, and superior beam quality. Consequently, it holds substantial promise in the growing laser composite welding market. With the further development of laser composite welding, beam-mode adjustable signal combiners featuring varying output core diameters will undergo more extensive research. Additionally, potential modifications to the TFB structure may enable the center of the annular dual-core fiber to withstand higher power output, expanding its applications further.
Apr. 25, 2024Vol. 51 Issue 8 0801004 (2024)
Xuewen Luo, Lu Zhang, Shijie Fu, Quan Sheng, Junxiang Zhang, Wei Shi, and Jianquan Yao
ObjectiveFiber lasers operating at the wavelength of 2.05 μm (corresponding to the absorption peak of CO2 and the atmospheric transmission window) have attracted intense interest owing to their applications in coherent Doppler lidars, free space communication, etc. To date, the highest output power of a 2.05 μm fiber laser has been scaled to the kilowatt level; it is obtained through a master oscillator power amplifier (MOPA) configuration combined with large mode area fiber. However, studying high-power single-mode fiber lasers is also important because they are cost-effective and more resistant to environmental disturbance. To date, the output power of single-mode thulium-doped fiber lasers has been limited to the multiwatt level owing to the diminishing emission cross section of thulium at 2.05 μm and the rising background loss of silica fiber at wavelengths above 2 μm. This work develops a rate equation model to determine the optimal incident signal power and thulium-doped fiber length, based on which a high power, single-transverse-mode 2.05 μm fiber laser with a MOPA configuration is presented.MethodsThe schematic of the thulium-doped fiber laser MOPA, which contains an oscillator and two stages of amplifiers, is given in Fig.1. The seed laser is generated from a homemade ring-cavity thulium-doped fiber laser, after which a filter-type wavelength division multiplexer (FWDM) is inserted to improve the optical signal noise ratio (OSNR). In the amplifiers, the gain fiber is 10 μm/130 μm thulium-doped fiber and is forward-pumped by a 793 nm laser diode. In the power-amplifier, the gain fiber is coiled on a water-cooled plate for effective heat dissipation. A rate equation model is developed to determine the optimal incident signal power and thulium-doped fiber length for high-efficiency laser generation.Results and DiscussionsThe simulation results are given in Fig.2; they indicate an optimal fiber length of 3.7 m and incident signal power of 4.4 W. In the experiment, the output power of the 2.05 μm ring-cavity seed is 1.01 W and decreased to 0.88 W after the FWDM, whereas the OSNR increases from 58.6 dB to 62.8 dB. The 3 dB spectral linewidth is 0.07 nm (Fig.3). In the pre-amplifier, the 2.05 μm laser is boosted to 8 W under the 793 nm diode pump power of 17 W, with a slope efficiency of 41.8% [Fig.4(a)]. The OSNR at 4.4 W output power still reaches 59.9 dB [Fig.4(b)] despite the increased amplified spontaneous emission (ASE). In the power-amplifier, a maximum output power of 57 W at 2048.7 nm with an OSNR of 58.8 dB is obtained when the 793 nm diode pump power is 102.6 W, corresponding to a slope efficiency of 52.6% (Fig.5). The root-mean-square (RMS) fluctuation of output power is below 2% within 30 min. The beam quality factor (Mx2) in the horizontal direction and the beam quality factor (My2) in the vertical direction are 1.08 and 1.11 under 57 W output power at 2.05 μm, demonstrating a near diffraction-limited beam quality. Further power scaling is only limited by the available pump power. The experimental results show that a high-efficiency, high-OSNR 2.05 μm laser with an output power of at least tens of watts can be achieved based on a single-mode thulium-doped gain fiber through system parameter optimization combined with efficient water-cooled heat dissipation.ConclusionsThis work demonstrates a high-power all-fiber MOPA at 2.05 μm based on a commercial single-mode thulium-doped silica fiber. A rate equation model is developed to optimize the incident signal power and thulium-doped fiber length of the power-amplifier. In an experiment, a maximum output power of 57 W at 2048.7 nm is obtained under a 793 nm diode pump power of 102.6 W, corresponding to a slope efficiency of 52.6%. The linewidth and OSNR are measured as 0.08 nm and 58.8 dB, respectively.
Apr. 25, 2024Vol. 51 Issue 8 0801005 (2024)
Hongjin Liang, Yonggang Zou, Jie Fan, Xiyao Fu, Ke Shi, and Kun Tian
ObjectiveSemiconductor lasers have been widely used in industrial manufacturing, medical diagnosis, lidar, and other fields because of their small size, high electro-optical conversion efficiency, long life, and direct-current drive. With the development of technology, higher requirements have been placed on laser light sources for different applications, such as high output power, narrow spectral linewidth, stable wavelength, and near-fundamental mode output. Researchers have performed a great deal of work in this area, making a series of breakthroughs ranging from broad-area semiconductor lasers to narrow-ridge semiconductor lasers and then to grating coupling. Distributed feedback semiconductor lasers using buried gratings can obtain high spectral purity; however, there are preparation difficulties in their re-growth. Researchers have found that surface gratings for coupling optical fields exhibit good working characteristics. To improve the power, a distributed Bragg reflector laser diode with tapered gratings combined with a master oscillator power amplifier is produced. Increasing the ridge width is a more direct method, which is commonly used; however, additional transverse mode suppression mechanisms need to be introduced, such as transverse coupled gratings and lateral microstructures. The exploration of single-mode stable-output semiconductor lasers has been a popular topic in related fields worldwide. In this study, a wide-ridge waveguide-distributed feedback semiconductor laser based on high-order curved surface gratings is prepared. Curved gratings and current-limited injection structures can suppress the high-order transverse mode in a wide-ridge waveguide and improve the power and spectral purity of the device. In addition, the use of ultraviolet lithography significantly reduces the difficulty of fabrication.MethodsThe transverse mode of the device is investigated using curved gratings and a current-limited injection structure, and the experimental results are analyzed. The effect of the ridge waveguide on the transverse mode is analyzed. It has been pointed out that a wide-ridge waveguide requires an additional transverse-mode suppression mechanism. Subsequently, two methods, curved grating and current-limited injection structure, are proposed. First, the gratings in the center of the curved gratings are regarded as linear gratings, which are used to narrow the linewidth. The gratings in the edge area combined with the cavity facet of the resonator form an unstable resonator, which leads to the beam propagation of the high-order transverse mode in the cavity and increases the feedback loss. The formula for calculating the curvature of the curved grating is given. Second, the current-limited injection structure is set such that the high-order transverse mode lasing threshold is greater than the basic mode threshold, whereas the gain is lower than that of the fundamental mode. Subsequently, the grating order is given, the period is determined by the Bragg condition, and the structural parameters of the gratings are optimized by software simulation to determine the duty cycle and etching depth suitable for device fabrication. Subsequently, the designed device structure is prepared experimentally. An electron microscope scan of the experiment is performed, and a device that meets the expected requirements is packaged and tested. Finally, the transverse mode of the curved grating device is analyzed using the spectrum, spot, and far-field divergence angle, which proves the validity of the structure and provides the optimization direction.Results and DiscussionsThe prepared curved grating device exhibits the expected single-mode output characteristics. Experiments show that the far-field slow axis divergence angle of the device is 5.3° at 0.5 A [Fig.10(a)], the optical spot presents a single lobe [Fig.9(a)], the 3 dB spectral linewidth is 0.173 nm, and the side-mode suppression ratio is 22.6 dB (Fig.8). The results show that the curved grating structure plays a key role in the suppression of the high-order transverse mode in the cavity, and the center is regarded as a high-order linear grating that narrows the linewidth. This provides a new concept for a single-mode stable output device.ConclusionsA distributed feedback semiconductor laser with high-order curved gratings is fabricated. The high-order transverse mode is suppressed using curved gratings and a current-limited injection structure. At room temperature, the measured threshold current of the device is 0.49 A, the optical spot presents a single lobe, the far-field slow axis divergence angle is 5.3°, the fast axis divergence angle is 29.2°, the measured emission wavelength is 1051.93 nm, the 3 dB spectral linewidth is 0.173 nm, and the side mode suppression ratio is about 22.6 dB at 1 A. The output power can reach 939.8 mW at 2.2 A, and the device can achieve the expected single-mode output effect. In addition, the device adopts the ultraviolet-lithography preparation process, which greatly reduces manufacturing difficulty and provides a simpler and more effective solution for semiconductor laser devices with a stable output of a single mode. However, the performance of the device must be improved further because of the high threshold current. In later stages, the sidewall morphology, structure, and curvature parameters of the curved gratings are fully optimized to obtain better performance.
Apr. 25, 2024Vol. 51 Issue 8 0801006 (2024)
Juan Zhang, Xiaoping Su, Jiahui Li, Zhanren Wang, and Shaoying Ke
ObjectiveGe/Si avalanche photodiodes (APDs) are widely used in near-infrared detection; however, obtaining high-performance Ge/Si APD is challenging due to the 4.2% lattice mismatch between Ge and Si. Therefore, this study proposes introducing a polycrystalline silicon (poly-Si) bonding intermediate layer at the Ge/Si bonding interface to mitigate the effects of the Ge/Si lattice mismatch on APD device performance. With the introduction of poly-Si, the electric field at the bonding interface changes, causing a redistribution of the electric field inside the APD, which significantly impacts device performance. Consequently, this study focuses on regulating the doping concentrations of the Ge absorption layer and Si multiplication layer. It explores the effects of doping concentration on the electric field, recombination rate, carrier concentration, impact ionization, and other properties of Ge/Si APD. Ultimately, the aim is to design high-performance bonded Ge/Si APD. This study offers theoretical guidance for future research on Ge/Si APD with low noise and high gain.MethodsIn this study, a 2-nm thick layer of poly-Si material is introduced at the Ge/Si bonding interface, and the influence of the doping concentrations of the Ge and Si layers on the APD properties is investigated. Initially, changes in the APD optical and dark currents with doping concentration are simulated. The changes in the recombination rate and carrier concentration are then simulated to explore the reasons for the changes in the optical current. Next, to further understand the reasons for the change in electron concentration, changes in the energy band of the APD are simulated. Following this, changes in the charge concentration, impact ionization rate, electric field, and other parameters with the doping concentration are simulated. Finally, the gain, bandwidth, and gain-bandwidth product of the APD are simulated and compared with previous studies. The optimal doping concentration for APD devices is identified to improve device performance.Results and DiscussionsAfter introducing the polycrystalline silicon bonding layer, the dark current reaches 1×10⁻¹⁰ A, which is five orders of magnitude lower than that of the currently reported Ge/Si APD (Fig. 3). As the doping concentrations of the Ge and Si layers increase, the conduction band in the Ge layer gradually flattens. When the doping concentration is high, the conduction band bends upward at the bonding interface, gradually forming a barrier at the bonding interface that obstructs the transport of charge carriers, resulting in challenges in transporting electrons in the Ge layer to the multiplication layer. As the doping concentration increases, the valence band becomes steeper, which facilitates the migration of holes. The holes in the multiplication layer can reach the absorption layer smoothly under the influence of a higher potential energy difference (Fig. 6). The electron and hole ionization coefficients at the p-Ge/i-Ge interface rise sharply with increasing doping concentration of the Ge layer, primarily due to the significant increase in the electric field with rising doping concentration (Fig. 8).ConclusionsIn this study, a poly-Si material is introduced at the bonding interface of Ge/Si, and the influence of the doping concentrations of Ge and Si layers on the performance of Ge/Si APD is theoretically examined. After the poly-Si layer is introduced, the dark current is found to reach an order of 1×10⁻¹⁰ A. Furthermore, the gain of 12.21 is realized when the Ge layer doping concentration is set at 1×1012 cm-3 and the reverse bias is 28.0 V. The maximum gain of 12.14 is noted when the doping concentration of the Si layer is 1×1015 cm-3 and the reverse bias is 28.2 V. As the doping concentrations of the Ge and Si layers are increased from 1×1012 cm-3 to 1×1016 cm-3, under the same bias voltage, an overall upward trend in the 3-dB bandwidth is observed. However, a sharp drop in the bandwidth is observed when the Ge layer doping concentration exceeds 1×1016 cm-3. The gain bandwidth product is found to reach its maximum value of 225.76 GHz when the Ge layer doping concentration is 1×1012 cm-3. A peak value of 215.15 GHz for the gain bandwidth product is achieved when the doping concentration of the Si layer is 1×1012 cm-3, and the bias is 29.5 V. Thus, an optimal gain and gain-bandwidth product in a Ge/Si APD can be obtained when lower doping concentrations of the Ge absorption layer and Si multiplication layer are chosen, ensuring that no electric field or tunneling phenomenon is encountered.
Apr. 25, 2024Vol. 51 Issue 8 0803001 (2024)
Xi Luo, Xinyang Li, Caixia Wang, Xiaoyun Wang, and Shijie Hu
ObjectiveAdaptive optics (AO) applied in compensation for atmospheric turbulence usually requires a sufficient guide star (GS) in the isoplanatic patch around the interesting object to provide accurate information of the wave-front distortion induced by atmospheric turbulence. However, as there are not enough bright and available natural guide stars (NGSs) in the sky, the concept of a sodium laser guide star (LGS) has been publicly proposed for overcoming the limitations due to the finite sky coverage of the observation telescope with AO, which is generated by resonance scattering from the sodium atoms in the mesospheric layer with a ground-based projected laser with a wavelength of 589 nm. Due to sufficient sampling of the atmospheric turbulence at high altitude, the concept of a sodium LGS has been receiving huge attention from the moment it was proposed and was first to be applied in the field of high-resolution astronomical observation through atmospheric turbulence with AO. However, due to the limitations of the excitation efficiency of LGS lasers and the sodium column density of the mesospheric layer, the actual brightness of the generated sodium laser guide star is limited. Therefore, so far, in the field of astronomical observation, almost all sodium LGS AO systems have to operate at night, so their operation hours have been greatly limited. Under daytime conditions, the effectiveness of sub-aperture segmentation wavefront centroid detection using a Hartmann-Shack (HS) sensor with weak photon returns from sodium LGS is challenging, due to the fact that the intensity of the skylight background can reach several thousand times that of the sodium LGS. The objective of this paper is to develop a reliable and practical atmospheric turbulence wave-front sensing technique for sodium LGS, which can provide a certain theoretical reference and engineering experience for daytime applications of sodium LGS AO systems in the future.MethodsBased on the aforementioned purpose, by combining theoretical analysis, parameter design, component development, system integration and detection experiment, an atmospheric wave-front active sensing technique for sodium LGS during daytime has been investigated in this paper. Our guiding ideology is to use spectral filtering, spatial filtering, and temporal filtering to match and suppress strong stray light interference while making an effort to maintain the photon returns from the sodium LGS at the wavelength of 589 nm. The above mentioned strong stray light interference includes the skylight background and Rayleigh back scattering at 589 nm of the atmospheric molecules. Firstly, based on the optical spectrum distribution characteristics of the skylight background, the feasibility of spectral filtering for a high optical transmittance with a nanometer scale line-width and a 589.16 nm center wavelength is analyzed. Secondly, based on the field of view (FOV) distribution characteristics of the skylight background, the feasibility of spatial filtering for accurately matching the FOV of the sub-aperture for the HS sensor is analyzed. Finally, in combination with the universal dual telescope mode for pulsed sodium LGS laser projection/sodium LGS photon return detection, the mathematical expressions of important parameters such as the duration of the pulsed resonance sodium LGS scattered return-light ΔtNa(E), the suppression duration of the Rayleigh scattered light from low altitudes ΔtRayleigh-Stop(E) and so on are derived, which constitute the theoretical foundation of our temporal filtering. Based on the above analysis and combined with the construction of an experimental system, parameter design, detection ability estimation, and component development are carried out for our synthetic filtering and applied in traditional HS sensors. A daytime atmospheric wave-front detection experiment for sodium LGS is carried out.The experimental results are in good agreement with those of the theoretical analysis.Results and DiscussionsDue to the demand for atmospheric wave-front detection for sodium LGS AO during daytime, an active wavefront sensing technique with synthetic filtering (namely, spectral filtering, spatial filtering and temporal filtering) is proposed in this paper. The detection ability after synthetic filtering is estimated, it can achieve effective atmospheric wavefront detection of an equivalent of 7-magnitude brightness sodium LGS under typical 12 W/(m2·sr) skylight background conditions (Table 1). Compared with traditional sodium atom filtering (Table 2), it has advantages regarding the equivalent photon returns maintained and the signal to noise (SNR) ratio for sodium LGS in an HS sensor. Based on this technique, a real-time detection of atmospheric wave-front distortion with sodium LGS under 10 W/(m2·sr) skylight background conditions is achieved (Fig.11), which is a beneficial attempt for daytime atmospheric wave-front detection with sodium LGS.ConclusionsIn response to the demand for atmospheric wavefront distortion detection with sodium LGS under strong skylight background, an active wavefront detection technique with synthetic filtering is proposed and investigated in this paper. Synthetic filtering is used to match and suppress strong stray light interference while making an effort to maintain the photon returns from sodium LGS. The theoretical analysis, parameter design and detection capability estimation for this technique are discussed. Then, using this technique, atmospheric wave-front distortion detection for AO using sodium LGS is carried out experimentally. When the brightness of the sky background is 10 W/(m2·sr), the atmospheric wave-front distortion is effectively detected based on the pulsed sodium LGS in real-time. This work is helpful in expanding the working period of the sodium LGS AO systems.
Apr. 25, 2024Vol. 51 Issue 8 0804002 (2024)
Zhen Xiao, Shizheng Sun, Tiancheng Zheng, Ke Pang, and Zijie Wei
ObjectiveThe status detection of track fasteners is an important task in railway facility inspection and maintenance. Fastener failures mainly manifest in defects such as missing, damage, incorrect installation of fastener components, and looseness of fasteners. Faulty fasteners can cause changes in track parameters, posing significant safety hazards. Therefore, strengthening the status detection of track fasteners has important practical significance for ensuring the safe operation of trains. At present, many researchers have conducted fault diagnosis research on fastener status based on 2D and 3D images. The fault detection of fasteners based on 2D images is greatly affected by factors such as lighting conditions, environmental background, and the ability to identify small defects in fasteners; moreover, depth information is not available, making it difficult to detect the tightness of fasteners. The detection accuracy based on 3D image data is low and there is a single detection parameter. Research in this area is relatively limited and immature. Based on line-structured light for detection, the distribution of the light strip modulated by the surface of the track fastener is scattered and affected by different environmental light intensities and surface stains of the fastener. Existing methods for extracting the centerline of line-structured light cannot simultaneously consider universality, accuracy, and robustness, making it difficult to accurately extract the centerline of the light strip. The reconstructed point cloud model of the fastener has many noisy points and poor accuracy, which makes it difficult to diagnose fastener faults. Therefore, this article reports on a light strip centerline extraction method and fastener fault diagnosis method suitable for precise reconstruction of track fasteners. The objective is to realize high-precision and high-robustness fault diagnosis of track fasteners, timely eliminating safety hazards and ensuring reliable service of fasteners and safe operation of trains.MethodsIn response to the difficulty in accurately extracting the centerline of the line-structured light strip modulated by track fasteners, this study proposes a centerline extraction method based on the improved grayscale center of the gravity method. This method mainly consists of four steps. First, a filter is used to maintain the overall grayscale stability of the image, making the light stripe image brighter. Gaussian filtering is used to filter out noise in the image, while making the distribution of light stripes uniform and closer to a Gaussian distribution. Second, an adaptive segmentation threshold for light stripe segmentation is calculated to reduce the impacts of different lighting intensities and surface stains on the centerline extraction, effectively completing the coarse extraction of light stripes. Third, linear interpolation is performed between the adjacent pixel points of the light strip in coarse extraction to refine the grayscale distribution of the light strip. The center point of the light strip is calculated using the grayscale center of the gravity method to accurately extract the centerline. Finally, the extracted center point is checked; if the point is not located on the light strip, the median pixel that meets the conditions is used as the center point of the light strip for correction. The feasibility and robustness of the proposed method are verified by comparing the experimental results of centerline extraction under different influencing conditions. This study is based on the reconstructed fastener point cloud model. By constructing a detection combination classifier of fastener defects, different defective fasteners can be diagnosed and classified. By measuring the looseness value of the nut, the distance between the fastener and the seam is indirectly measured to achieve fastener looseness detection.Results and DiscussionsAn accuracy detection experiment is conducted on the fault diagnosis system of the elastic strip I-type split fastener by building an indoor structured light sensor. The experimental results show that the overall measurement error of the system is less than 0.2 mm (Table 1). Subsequently, 100 normal fasteners and 100 faulty fasteners are diagnosed under normal lighting conditions using a structured light sensor device on the inspection vehicle line. The experimental results show that the system has a fastener fault detection rate of 96%, a misdiagnosis rate of 3% [Fig.12(a)], and a maximum error of 0.18 mm in fastener tightness detection [Fig.12(b)]. Finally, by conducting fault diagnosis on track fasteners with surface stains under different environmental light intensity conditions, the experimental results show that the overall system is less affected by different environmental light intensities and surface stains on the fasteners (Table 2), and the system has strong robustness and fault diagnosis ability, meeting the detection requirements of track fasteners.ConclusionsCurrently, the fault diagnosis parameters for fasteners based on 3D images are not comprehensive and the detection accuracy is low. There is scarce and immature research in this area. Therefore, this study independently designs and builds a track fastener fault diagnosis system based on line-structured light to scan, reconstruct, and diagnose the elastic strip I-type split fastener. First, in response to the difficulty in extracting the centerline of the light strip modulated by fasteners, a centerline extraction method based on the improved grayscale center of the gravity method is studied, and the fastener point cloud model is accurately reconstructed. Second, a combined classifier model for fastener defect detection is established to achieve fastener defect detection. Finally, by measuring the looseness of the fastening nut, the problem of difficult direct measurement of the fastening gap is solved. The experimental results show that under normal lighting conditions, the fault detection rate of the diagnostic system is 96%, and the detection error of fastener looseness is less than 0.2 mm. The fastener fault diagnosis model has good detection performance and robustness, which is of great practical significance for timely detection and maintenance of faulty fasteners, thereby ensuring safe operation of trains.
Apr. 25, 2024Vol. 51 Issue 8 0804003 (2024)
Qianghua Chen, Duo Shao, Fuming Liu, Yu Guan, Lü Hongbo, Lina Si, Hongjuan Yan, and Zhaoliang Dou
ObjectiveWave plates are a key component of optical polarization systems. The study of methods to measure wave plates precisely is becoming increasingly important with continuous improvements in the performance of polarization systems. Currently, most techniques are based on detecting the intensity of light passing through a wave plate. These methods are generally susceptible to fluctuations in the intensity of the light. In contrast, other methods that measure the phase of the light instead typically exhibit greater accuracy and stability. However, relatively few such methods have been described in the relevant literatures for phase measurement. In this study, a high-precision method based on equivalent components and phase compensation is proposed to simultaneously measure the phase retardation and azimuth of arbitrary wave plates.MethodsWe insert a rotatable half wave plate in front of a measured wave plate and use a reflector to allow the measurement light to pass through both twice. This effect is equivalent to measuring an equivalent wave plate with a phase retardation twice that of the measured wave plate, and double-resolution detection is thus obtained. The proposed system includes a dual-frequency laser source and a phase detector. Simultaneously, the fast-axis azimuth is also determined according to the azimuth of the half wave plate when the maximum or minimum phase difference occurs.Results and DiscussionsAn analysis of error values under the experimental conditions indicated that the measurement uncertainty of the phase retardation was about 3.3', and that of the fast-axis azimuth was better than 5.4''. The results of an experimental comparison show good agreement with the measurement results obtained using other methods. The proposed approach theoretically avoids the influence of fluctuations in the intensity of measurement light that affect conventional methods as well as the typical issue of the influence of the positioning accuracy of birefringent devices azimuth. The proposed optical system adopts a dual-frequency heterodyne interference optical path with common optical path properties to obtain good measurement stability. This system also has a simple structure, requires relatively few components, and can take measurements quickly. In addition, because the measurement beam passes through the position of the measured wave plate twice, birefringent devices with wedge-shaped structures can also be measured.ConclusionsThe study of high-performance methods to measure wave plates has significant practical significance owing to their applications in optical polarization systems. In this study, a high-precision method for simultaneously measuring the phase retardation and azimuth of arbitrary wave plates based on equivalent components and phase compensation is proposed. By inserting a rotatable half wave plate in front of a measured wave plate and using a reflector to allow the measurement light to pass through the half wave plate and the measured wave plate twice, the proposed method is equivalent to measuring an equivalent wave plate with a phase retardation twice that of the measured wave plate, which allows the system to achieve double-resolution detection. The system uses a dual-frequency laser source and a phase detection sensor. By rotating the half wave plate to compensate for the phase of the measurement light and adjusting the change in the phase difference of the measurement light relative to the reference light to the maximum or minimum value, the phase retardation of an arbitrary wave plate can be obtained. Simultaneously, the fast-axis azimuth is also determined according to the azimuth of the half wave plate when the maximum or minimum phase difference occurs. This method theoretically avoids the influence of fluctuations of the intensity of the measurement light that affect methods based on light intensity in general, as well as the influence of the positioning accuracy of the azimuth of birefringent devices, which affects many different methods. The optical system owns a dual-frequency heterodyne interference optical path, so it has common optical path property and good measurement stability. The proposed approach also has the advantages of a simple structure, relatively few components, and a quick measurement process. In addition, birefringent devices with wedge-shaped structures can also be measured by the proposed method. As noted above, the results of an error analysis under the experimental conditions showed that the measurement uncertainty of the phase retardation was about 3.3', and that of the fast-axis azimuth was better than 5.4''. The results of an experimental comparison also showed good agreement with the results of measurements obtained using other methods.
Apr. 25, 2024Vol. 51 Issue 8 0804004 (2024)
Rongjun Wang, Mingming Huang, and lidong Ma
ObjectiveLine-structured light measurement technology is widely used in the field of industrial inspection. In the measurement system, the center extraction accuracy of the laser stripe directly influences the final measurement accuracy. Unfortunately, some factors in the industrial environment significantly affect the center extraction of the laser stripe. For example, the rounded convexity on the surface of a detected object leads to a large change in the curvature of the collected laser stripe, and the reflections on the surface of the detected object lead to a laser stripe connected with reflective noise, resulting in severe interference. In these situations, existing algorithms, such as the geometric center, gray gravity, and Steger algorithms, cannot obtain proper extraction results. In case of a large curvature change, existing algorithms fail to accurately extract the center of the laser stripe along its normal direction, resulting in a large deviation from the actual center. In the case of severe interference, existing algorithms fail to efficiently avoid interference disturbances; thus, the interference is calculated as part of the laser stripe. Therefore, it is necessary to implement countermeasures to solve these problems and improve the applicability of the center extraction algorithm.MethodsIn this study, a center extraction algorithm for line-structured light based on unilateral tracking and midpoint prediction is proposed. The algorithm consists of three parts: laser stripe unilateral tracking, initial center-point determination based on the gray gravity and least-square algorithm, and center extraction based on the Hessian matrix. The upper boundary of the laser stripe is extracted using the proposed unilateral tracking algorithm according to the direction and grayscale of the laser stripe. The proposed unilateral tracking algorithm tracks only the upper boundary of the laser stripe and selectively searches the upper right, right, and lower right of the pixel eight-neighborhood when tracking each upper boundary point, thereby improving the processing speed of center extraction. In addition, the unilateral tracking algorithm can filter out small noises while performing unilateral tracking starting point searches. Simultaneously, the initial center point of the laser stripe is calculated using the gray gravity algorithm or least-square algorithm. In the laser stripe part without interference, the initial center point is calculated using the gray gravity algorithm. In the laser stripe part with serious interference (the signal-to-noise ratio is less than 15 dB, and the laser stripe is connected with noise), the initial center point is predicted by the least-square algorithm with a step length of 1 pixel. Finally, the Hessian matrix is used to modify the normal direction coordinates of the initial center point to improve the center extraction precision under large curvature change conditions. When constructing the Hessian matrix, the first-order and second-order partial derivatives are obtained from the pixel differential of the neighboring pixels at the initial center point, which reduces the complexity of the algorithm and ensures the accuracy of the center point.Results and DiscussionsLaser stripes with a large curvature change and serious interference are created to compare the accuracy and speed of the proposed algorithm with those of existing algorithms. Compared with the geometric center, gray gravity, and Steger algorithms, the laser stripe center extracted by the proposed algorithm is closer to the real direction (Figs.8 and 9), demonstrating that the proposed center-extraction algorithm for line-structured light based on unilateral tracking and midpoint prediction has the better center extraction accuracy. In the case of severe interference (the signal-to-noise ratio is 8.52 dB, and the laser stripe is connected with noise), the center extraction algorithm in this study shows the highest extraction accuracy, which is 65.19 times that of the geometric center algorithm, 8.89 times that of the gray gravity algorithm, and 5.76 times that of the Steger algorithm (Table 1). In the measurement accuracy experiment, the center extraction algorithm used in this study shows the best measurement accuracy, which is 2.44 times that of the geometric center algorithm, 2.32 times that of the gray gravity algorithm, and 2.06 times that of the Steger algorithm (Table 2 and Fig.14). In the processing speed experiment, the center extraction algorithm used in this study shows the fastest processing speed, which is 3.96 times that of the geometric center algorithm, 4.32 times that of the gray gravity algorithm, and 10.52 times that of the Steger algorithm (Table 3). Furthermore, the center extraction algorithm proposed in this study is applicable to different types of laser stripes, such as folded lines, arcs, diagonal arc tangents, and continuous variation curves (Fig.15).ConclusionsThis study proposes a center-extraction algorithm for line-structured light based on unilateral tracking and midpoint prediction, which proves that the proposed algorithm can deal with laser stripe under the conditions with large curvature change or serious interference and obtain proper results. In addition, the proposed algorithm is faster and more applicable than existing algorithms. These advantages enable the proposed algorithm to provide support for line-structured light measurements under non-ideal conditions.
Apr. 25, 2024Vol. 51 Issue 8 0804005 (2024)
Qiuyu Li, Zheng Li, Jian Lu, Weiwei Kan, and Zhonghua Shen
ObjectiveAccurate mechanical properties of materials, including Young’s modulus, Poisson’s ratio, and longitudinal and shear wave speeds, are essential for material evaluation and testing. A major challenge arises when dealing with multimodal ultrasound Lamb waves, especially those that closely approach or intersect in the spectrum or dispersion curves. This complexity is often due to hardware limitations, such as the bandwidth of generation and detection. Furthermore, accurately distinguishing these modes in dispersion curves, by identifying spectral peaks through the wavenumber resolution offered by the two-dimensional Fourier transform method, often presents difficulties. Traditionally, most studies have relied on contact wedge transducer. However, laser ultrasound introduces a nondestructive testing method that significantly simplifies spatiotemporal modulation and enables non-contact generation detection. This approach is particularly advantageous for applications that require rapid material scanning, as it overcomes the challenges associated with traditional methods, enhancing accuracy and efficiency in material property analysis.MethodsTo address challenges in material parameter inversion, a novel approach was employed, utilizing a moving continuous-wave laser source to generate multimodal Lamb waves in thin plates. This method was first validated through a material-parameter inversion study. Experimental findings, illustrated in Figs. 4 and 5, confirmed the effective generation of specific Lamb waves with distinct phase velocities. Importantly, this non-contact phase-velocity matching method overcame the limitations typically encountered with transducer use in contact scanning, enhancing the accuracy of dispersion curve measurements within the targeted range. Further investigations focused on parameter sensitivities in the fitting process, specifically for aluminum plates within a phase velocity range of 2500?4000 m/s and a frequency-thickness product range of 1?20 MHz·mm. Additionally, as shown in Figs. 2 and 3, simulations and analyses were conducted to assess multimodal fitting under various noise levels. Building on these comprehensive insights, material parameters for aluminum and polystyrene plates of varying thicknesses were successfully obtained through the application of the particle swarm optimization algorithm, coupled with inertial descent.Results and DiscussionsSingle-modal data (specifically, the s1 modal, represented by the blue data points in Fig.5(d)) are utilized for fitting when inverting the material properties of the polystyrene plate. When comparing the final fitting results with parameters found in the literature, the error for the longitudinal wave speed is only 0.26%, while that for the shear wave speed is 3.83%. A sensitivity analysis of this study reveals that the sensitivity of the longitudinal wave in the phase velocity range of 2500?4000 m/s for the aluminum plates is relatively low. Errors in the measurement of the dispersion curve can lead to significant deviations in the inversion results of the longitudinal wave speed. However, employing multimodal fitting can reduce the inversion errors originating from these low sensitivities, as illustrated in the results presented in Table 1. In this study, multimodal-based fitting inversion results yield a longitudinal and shear wave speed errors of 1.51% and 1.28%, respectively, compared to the existing literature. These results underscore the relative accuracy of the dispersion curves generated by Lamb waves and extracted using measurement techniques.ConclusionsIn this study, a method involving the generation of Lamb waves using a moving laser source is employed to measure the Lamb waves with phase velocities ranging from 1000 to 4000 m/s and frequencies ranging from 1 to 20 MHz. This technique is applied to both aluminum plates (thickness: 0.5?1.6 mm) and polystyrene plates (thickness: 2.3 mm). This method effectively circumvents the limitations associated with transducer coupling during contact scanning, by utilizing non-contact generation. This approach significantly enhances the accuracy of measuring the dispersion curves within a specified range, enabling precise extraction of the phase velocity and frequency. The simulation analysis in this study investigates the impact of sensitivity and fitting modes on the inversion results. The sensitivity of the longitudinal and shear wave speeds in aluminum within phase velocity and frequency ranges of 2500?4000 m/s and 1?20 MHz, respectively, are discussed. Notably, this region exhibits higher and lower sensitivities to shear and longitudinal wave speeds, respectively. The simulation analysis reveals that noise has a more pronounced effect on longitudinal wave speed, resulting in larger deviations. In this study, a multimodal fitting method is utilized to enhance the accuracy of the final inversion results. This approach effectively addresses the challenge of multipeak distribution in the search space, which is commonly encountered in unimodal fitting methods. By leveraging accurate dispersion data obtained through simulation analysis, the particle swarm algorithm with inertial descent is applied to invert the longitudinal and shear wave speeds in aluminum and polystyrene plates. The maximum error between the final inversion results and that in the existing literatures for the aluminum plates does not exceed 1.51%. Furthermore, our experiments with polystyrene plates demonstrate that a moving laser source can successfully generate Lamb wave signals with low phase velocities, particularly in organic materials with limited surface damage thresholds. This promising technique holds significant potential for future applications in non-destructive testing and evaluation of various non-metallic materials, particularly those prone to damage, such as composites.
Apr. 25, 2024Vol. 51 Issue 8 0804006 (2024)
Junying Yang, Peigao Han, and Yingying Wei
ObjectiveWith the wide application of ellipsometry spectroscopy technology as the core device for ellipsometry spectrometers in recent years, an increasing number of researchers have begun to study photoelastic modulators (PEM). The amplitude of the phase delay generated when the PEM performs phase modulation is influenced by the control voltage, temperature, and other factors; therefore, the PEM must perform calibration before carrying out the work. Current calibration methods for the PEM mainly include the Bessel function ratio, half-wave flat-top, and fundamental frequency component maximum methods. Many calibration methods require the use of the Bessel function ratio, and the frequency response of the calibration system must be considered based on the ratio between different frequency octaves, which is also a problem likely to be ignored. Moreover, this problem is difficult to solve. To solve this problem, we propose a new calibration method that can eliminate the influence of the frequency response of the calibration system. The proposed method exhibits excellent system robustness.MethodsThe proposed system consisted of a calibration optical route polarizer, PEM, waveplate, and analyzer. This method has no special requirements for the azimuths of the polarizer, analyzer, waveplate, or the phase delay of the waveplate in the system. In this method, the zero-point of the second-harmonic component, Am=5.136 rad, was used as the calibration auxiliary point, and the ratio of the first-order Bessel function between the undetermined and calibration auxiliary points was used as the calibration function. By determining the ratio of the first harmonic component between the fixed and calibration auxiliary points, the real-phase delay amplitude of the undetermined point was derived via calculations.Results and DiscussionsThe proposed method uses the ratio of the Bessel function of the same order between different values instead of the ratio between different frequencies, which solves the frequency-response problem of the calibration system. The calibration results show that the calibration curves obtained using the fourth- and second-order Bessel function ratio methods significantly differ from that without a frequency response (Fig.3). This is caused by the evident frequency-response difference between the second and fourth octaves of the detection system consisting of the detector and lock-in amplifier. The fitting curve of the proposed method is expressed by Am=1.203vm+0.098. The half-wave flat-top method is used to verify the amplitude of the π rad phase delay in the calibration curve. When the control voltage is 2.53 V, a flat-top waveform is generated (Fig.5), which is consistent with that of the simulation (Fig.4), indicating that the proposed method is feasible. In addition, we calculated the calibration deviation of the light intensity fluctuation for the method, and the deviation of most of the calibration points, Am, was less than 1%. The calibration near the extreme point of the Bessel function is significantly influenced by the light intensity fluctuation (Fig.6) owing to the insignificant change in the value of the Bessel function near the extreme point. A laser with a smaller light-intensity fluctuation or a more stable laser can be used to control the power supply to minimize the Am calibration deviation caused by light-intensity fluctuations.ConclusionsIn this study, a new calibration method for a PEM is proposed. In the proposed method, the zero-value point of the second-order Bessel function is used as the auxiliary calibration point. The ratio of the amplitude of the fundamental frequency component between the punctuation point to be determined and the auxiliary calibration point corresponds to the ratio of the first-order Bessel function used for calibrating the entire working range of the PEM. The experimental results show that the calibration relationship between Vm and Am is linear, except near the extreme points of the fundamental frequency components (1.841 and 5.331 rad), and the calibration results are verified using the half-wave flat-top method. The calibration deviation caused by the fluctuation in light intensity is lower than 1%, except near the extreme points of the Bessel function. The calibration method is not affected by the frequency response of the detection system and has no special numerical and accurate requirements for the azimuth angle and phase delay of the waveplate, polarizer, and polarizer. It is simple to operate and robust, and it achieves PEM calibration in the entire Vm working range.
Apr. 25, 2024Vol. 51 Issue 8 0804007 (2024)
Dandan Nie, Meng Qi, Yuanji Li, Jinxia Feng, and Kuanshou Zhang
Objective1.5?1.8 μm and 3?5 μm infrared lasers are widely used in free-space optical communication, trace gas monitoring, environmental pollution monitoring, and biomedicine. Infrared lasers can be obtained using quantum cascade, fiber, solid-state, and Raman lasers. Compared with these methods, an optical parametric oscillator (OPO) can be used to achieve an infrared laser with a wider tuning range, higher power, and more stable operation. Based on the resonance of the pump, signal, and idler laser in the OPO cavity, the OPO can be referred to as singly resonant OPO (SRO), doubly resonant OPO (DRO), or triply resonant OPO (TRO). Compared with DRO and TRO, SRO requires only that the signal (or idler) light resonates in the cavity, has a relatively simple design, and no external servo system locking is required to obtain a stable, high-power output. Therefore, the output characteristics of a high-power SRO are investigated in this study.MethodsFirst, a theoretical analysis is conducted on the influence of the SRO cavity length and nonlinear crystal thermal lens effect on the stability of the resonant cavity under standing-wave and ring-cavity structures. To ensure a stable operation of the SRO within significant changes in the resonant cavity parameters, the cavity length corresponding to |(A+D)/2|=0 is selected when the SRO is designed, that is, the standing wave cavity length is 54 mm, and the ring cavity length is 516 mm. According to the focusing factor selected for the SRO cavity, the waist spot of the signal light at the center of the MgO∶PPLN crystal is calculated to be 59.5 μm. Subsequently, based on the design of the SRO resonant cavity structure, the laser output characteristics of different SRO cavity types are theoretically analyzed. The theoretical analysis reveals that the pump light in the standing-wave cavity SRO passes through the nonlinear crystal twice; therefore the power gain of the signal light during forward and backward transmission must be considered simultaneously, whereas the pump light in the ring-cavity SRO passes through the nonlinear crystal in a single pass, and the parametric interaction during backward transmission is not considered. The threshold pump power and output power of the signal and idler light from the standing-wave cavity and ring-cavity SROs are calculated. Finally, the two mirror standing-wave cavity SROs and four mirror ring-cavity SROs based on the MgO∶PPLN crystal pumped by a high-power continuous-wave single frequency 1.06 μm laser are constructed, and the relationship between the output power of the signal and idler light with the pump power, as well as the power fluctuation and frequency drift of the signal and idler light are studied.Results and DiscussionsBy controlling the temperature of MgO∶PPLN from 30 ℃ to 65 ℃, the signal wavelength can be tuned from 1550.03 nm to 1561.38 nm, and the corresponding idler wavelength can be tuned from 3394.7 nm to 3340.13 nm. When the temperature of the MgO∶PPLN crystal is controlled as 40 ℃, the signal and idler wavelengths of the SRO are 1.553 μm and 3.378 μm, respectively. The threshold pump power of the standing-wave cavity SRO is 3.2 W, and at a pump power of 14.2 W, the signal and idler powers are 5.2 W and 2.2 W, respectively. The threshold pump power of the ring-cavity SRO is 7.2 W, and at the pump power of 25 W, the signal and idler powers are 8.1 W and 3.6 W, respectively. The measured value of the ring-cavity SRO output power is in good agreement with the theoretical prediction result (Fig. 6). When the pump power is less than 15 W, the measured standing-wave cavity SRO output power agrees well with the theoretical prediction result; however, when the pump power is greater than 15 W, the measured standing-wave cavity SRO output power deviates significantly from the theoretical prediction result ( Fig. 6). According to the theoretical analysis, when the pump power is 15 W, the resonant signal power in the standing-wave cavity SRO is 260 W. The thermal lens focal length of the nonlinear crystal is 14 mm, and the corresponding stability parameter of the standing-wave cavity SRO is 0.98. An increase in the pump power results in the stability parameter of the standing-wave cavity SRO to be greater than 1; the SRO cannot operate stably, and the output power of the SRO decreases. To obtain a higher output power from the signal and idler lasers, the ring-cavity SRO is a better choice. In addition, when the signal and idler output powers from the standing-wave cavity and ring-cavity SROs are 5.0 W and 2.0 W, respectively, the power fluctuations in the signal and idler light by the standing-wave cavity SRO within 2 h are better than ±2.76% and ±2.53%, and the power fluctuations in the signal and idler light by the ring-cavity SRO within 2 h are better than ±1.24% and ±1.19%, respectively. The long term frequency drift of the signal is better than ±40 MHz and ±28 MHz, respectively.ConclusionsThe influence of the SRO cavity type on the output characteristics at high pump power is investigated in this study. First, a theoretical analysis is conducted on the influence of the SRO cavity length and nonlinear crystal thermal lens effect on the stability of the resonant cavity under the standing-wave cavity and ring-cavity structures. Notably, the ring-cavity SRO can operate stably within significant changes in the resonant cavity parameters. The output characteristics of the SRO are also theoretically analyzed. Second, a two-mirror standing-wave cavity and a four-mirror ring-cavity SROs based on a MgO∶PPLN crystal are experimentally constructed. At a pump power of 14.2 W, the signal and idler output powers from the standing-wave cavity SRO are 5.2 W and 2.2 W, respectively. At a pump power of 25 W, the signal and idler output powers from the ring-cavity SRO are 8.1 W and 3.6 W, respectively. The measured value of the ring-cavity SRO output power agrees well with the theoretical prediction result. The power fluctuations in the signal and idler light from the standing-wave cavity SRO within 2 h are better than ±2.76% and ±2.53%, and the power fluctuations in the signal and idler by the ring-cavity SRO within 2 h are better than ±1.24% and ±1.19%, respectively. The long term frequency drift of signal light from the standing-wave cavity and ring-cavity SROs are better than ±40 MHz and ±28 MHz, respectively. The research results indicate that to obtain a higher output power from the signal and idler lasers, the ring-cavity SRO is a good choice.
Apr. 25, 2024Vol. 51 Issue 8 0808001 (2024)
Jie Xu, Hui Liu, Yue Shen, Guanxue Yang, Hao Zhou, and Siyuan Wang
ObjectiveNurseries span large areas, so that managing and protecting landscape trees manually requires significant resources. Substituting agricultural robots for human forces can effectively address issues of low productivity and labor shortages. The perception systems are essential elements of agricultural robots. Agricultural robots can obtain essential information for tree statistical analysis, autonomous navigation, and target spray operations by perceiving tree species, trunks, crowns, and others. Therefore, it is of great significance to design a neural network model which can accurately obtain the information of tree species, crowns and trunks. Point clouds are more suitable for outdoor scenes due to their greater robustness to different lighting conditions. While there are many studies related to tree species classification and crown or trunk segmentation, most of them focus on trees located in forestry areas or require prior point cloud registration operations. Compared with trees in forest areas, landscape trees planted in nurseries are generally smaller in size. Moreover, during the process of work, robots are only able to capture partial point clouds of trees. In order to ensure the real-time performances, robots need to obtain relevant information on tree species, trunks, and crowns from partially scanned point clouds. Hence, based on PointNet++, we present an improvement model in this paper. We collect partial point clouds of trees from nurseries to train the model for tree species classification, as well as segmentation tasks of tree crowns, trunks and other parts. Experimental results demonstrate its superior classification and segmentation performances, which can prepare for the subsequent implementation of the application on the hardware platform.MethodsThe proposed neural network model adopts the hierarchical structure. Multiple set abstraction (SA) layers are used to extract the local features of the point clouds. Each SA layer consists of a sampling layer, a grouping layer, and a PointNet layer. The sampling layer employs the iterative farthest point sampling to select sampling points. Then, taking the sampling points as the center points, spherical regions with a fixed radius d are constructed as the local areas in the grouping layer. Each local area contains K neighboring points. As the number of layers increases, the radius d of the spherical region expands continuously. For larger local areas, the feature distribution adjustment module is employed to convert the relative features of neighboring points from linear to arc tangent, increasing the relative features of those closer to the central point while reducing the influence of distant neighboring points in each local area. Multilayer perceptrons (MLPs) are employed for extracting local features in the PointNet layer. To enhance the model’s capacity to capture important information, we integrate the coordinate attention (CA) module with attention pooling for extracting local features. Furthermore, in the final SA layer, the model concatenates the low-dimensional and high-dimensional features of sampled points, and employs fully connected networks to predict the category of the input point clouds. The segmentation branch utilizes the U-Net structure, and employs an interpolation method based on inverse distance weighted average with K nearest neighbors, combining with skip links across levels for feature propagation. Finally, the category of each point is obtained to realize segmentation.Results and DiscussionsFor classification and segmentation experiments, we collect seven kinds of point clouds of common landscape trees in the nursery using the Livox Horizon laser. During the data collection process, the parameters of the laser are shown in Table 1, and more detailed information of the collected point clouds is shown in Table 2. To perform segmentation tasks, each group of collected point clouds is further processed by dividing into 2?4 parts represented with different labels (Fig.9). To demonstrate better classification and segmentation performances, the experimental results of the proposed model are compared with classic PointNet and PointNet++ using the self-made dataset. Besides, we conduct experiments by replacing the improved attention module in our proposed model with squeeze-and-excitation (SE) attention module, convolutional block attention module (CBAM), and CA attention module. For the classification experiments, the models are first pre-trained using the public dataset ModelNet40 before being trained with the self-made dataset. And the results are shown in Table 4. The overall accuracy (OA) and mean class accuracy (mAcc) of the proposed model are 92.50% and 94.22%, respectively, which are higher than the corresponding metrics of PointNet and PointNet++. Compared with other kinds of attention modules, the attention model utilized in the proposed model achieves the highest classification accuracy. The same models are also trained for the segmentation experiments, and the testing results are presented in Table 5. The evaluation indicator values including average intersection over union (mIoU), precision, recall and F1 score of the proposed model are 89.09%, 90.09%, 95.44% and 92.59%, respectively, which are higher than those of PointNet++. Furthermore, our proposed model outperforms PointNet++ in terms of accurately capturing fine details (Fig.11).ConclusionsIn this paper, we present an improved neural network model based on point clouds, which is designed to classify tree species in the nursery and segment tree crowns, trunks, and other parts. Different from the classic neural network model PointNet++, the proposed model combines the high-dimensional and low-dimensional features of the points to improve the performance. And the relative features of the neighboring points are adjusted to the form of arc tangent distribution, which can improve the corresponding values of the neighboring points closer to the central point in the local areas. Furthermore, the CA attention module and attention pooling module are combined to improve the ability of capturing the important features. To enable the practical application of agricultural robots, we collect and process point cloud data of landscape trees in the nursery to train the models. The experimental results demonstrate that our proposed network outperforms PointNet and PointNet++ in terms of both classification and segmentation tasks. The model proposed in this paper provides the theoretical foundation for future applications of agricultural robots in the nursery, such as tree statistical analysis, autonomous navigation, and target spray operations.
Apr. 25, 2024Vol. 51 Issue 8 0810001 (2024)
Huijuan Yu, Yubing Wang, Shuhua Zhao, Mingshi Zhang, Yue Song, Cheng Qiu, Yuxin Lei, Peng Jia, Lei Liang, Li Qin, and Lijun Wang
ObjectiveThe most critical technique of the phase-modulated continuous-wave (PhMCW) ranging method is to measure the pulse width of the intermediate frequency (IF) signal to obtain the optical time-of-flight. Time-to-digital converter (TDC) is used to measure the time interval (i.e., pulse width). The range and accuracy of the time interval measurement by a high-precision TDC module essentially determine the range and accuracy of the PhMCW lidar. The aim of this paper is to develop a large-range and high-precision TDC chip for time-of-flight measurement to support the development of high-performance PhMCW lidar for its application in the field of autonomous driving.MethodsIn this paper, we utilize Xilinx's Artix-7 series field programmable gate array (FPGA) chips to implement the TDC module design through the strict counting chain technique by utilizing the on-chip CARRY4 carry chain as the fundamental delay unit. This approach allows an expansion of the time measurement range by increasing only the number of bits in the first counter, achieving higher precision while utilizing fewer resources. The performance of the TDC module is tested by generating gate signals of varying lengths from the signal source, followed by experimental testing and data analysis. Finally, an actual lidar system is constructed for experimental demonstration.Results and DiscussionsUsing the signal source to generate the measured signals with different pulse widths for practical testing, a time measurement range of 1.24 μs is achieved. The optimal value of measurement accuracy is 26.42 ps, corresponding to a ranging accuracy of 3.96 mm (Figs. 7 and 8), which is better than the existing commercial lidar metrics (50 mm). In order to further analyze the correlation factors of the measurement accuracy, we take the 200 ns pulse width measurement data as an example in the frequency domain for analysis, and find that the TDC test results are affected by the switching power supply noise (Figs. 9 and 10). A PhMCW lidar system is built for application verification, and the time-of-flight detection for the distance of 0.3?7 m is realized (Fig. 12).ConclusionsIn this paper, for the urgent need of high-precision TDC for PhMCW ranging, we adopt the strict counting chain method and realize the TDC module design based on FPGA development board. Using this TDC module, the time measurement range of 1.24 μs is realized, corresponding to a ranging range of 186 m, which can meet the demand of automatic driving for large-range detection. Using the signal source to generate the measured signals with different pulse widths for practical testing, a measurement accuracy of better than 133.62 ps is obtained, corresponding to a distance measurement accuracy of 20.04 mm, which meets the needs of automatic driving for high-precision detection. However, when the TDC module is demonstrated in a real lidar system, the analysis reveals that the commercial amplifier module currently used has a large impact on the test results. This problem will be solved by optimizing the design of the amplifier module, so as to obtain a high-precision and long-range PhMCW lidar system.
Apr. 25, 2024Vol. 51 Issue 8 0810002 (2024)
Junqi Yang, Zhaoyong Wang, Yifan Liu, Shuai Luwei, Kan Gao, Qing Ye, and Haiwen Cai
ObjectiveDistributed acoustic sensing (DAS) has been widely applied in railway safety monitoring, perimeter security, seismology, and other fields. The high precision target source multi-dimensional localization is important for these applications. However, most implementations of DAS provide the position of detected sources as a function of distance within the one-dimensional axial space along the sensing fiber, and the transversal distance between the detected sources and the sensing fiber is unclear, which hinders the process of DAS practical applications.The current target source localization methods can be divided into two categoriesone is based on time difference of arrival (TDOA) algorithm, and the other is based on array signal processing (ASP) method. The ASP methods include beamforming and spatial spectrum estimation. The positioning accuracy of TDOA algorithm is poor, and the beamforming method often requires high signal-to-noise ratio, large array aperture, and a priori knowledge of the environmental noise and target source which is difficult to obtain accurately.The spatial spectrum estimation method is based on the orthogonal property of signal subspace and noise subspace, and has high estimation accuracy and angle resolution. Cao et al. used multiple signal classification (MUSIC) algorithm to locate the underwater near-field target source with an error of 0.7 m, and the ratio of signal wavelength to detection aperture was 25∶1. Liang et al. realized sound source location in the air medium by wrapping the optical fiber densely around the cylindrical cavity structure, and the ratio of signal wavelength to detection aperture was 100∶1. In these studies, the channel detection aperture is much smaller than the signal wavelength and sensor can be regarded as a point sensor. However, DAS is limited by the spatial resolution, and the single-channel detection aperture of the existing optical cable is 10 m, which is comparable with the target signal wavelength, so it is difficult to directly use the spatial spectrum estimation method to achieve multi-dimensional target source localization. In addition, the channel aperture compression requires a special design of the sensor unit, and the structure is complex, so it is not easy for large-scale application.In this paper, we propose a multi-dimensional target source localization method for DAS by correcting fiber array phase deviation. The proposed method can eliminate the influence of DAS large detection aperture, and the high precision target source multi-dimensional localization can be obtained by common optical cables.MethodsTo eliminate the influence of DAS large detection aperture, the phase correction method is proposed. First, the DAS sensing channel response is analyzed and the phase deviation between DAS equivalent array and distributed uniform linear array (ULA) is calculated. Then, the TDOA algorithm is used to obtain pre-estimation location of target source for array phase correction. The effects of sensing channel number and position on TDOA estimation are studied. Multiple sensing channel groups are used for TDOA estimation, and the final pre-estimation location is the average value of estimation results of all those groups. After that, the corrected signal is used for spatial spectrum estimation by MUSIC method, and a higher precision target source localization can be obtained. Then, the array phase is corrected according to the MUSIC estimation and the MUSIC algorithm is iterated. The effect of MUSIC algorithm iterations on the root-mean-square error (RMSE) is studied.Results and DiscussionsThe proposed method can realize multi-dimensional localization of target source, and the preliminary experiment verifies that the minimum RMSE of localization result is 1.1 m. The proposed target source localization method contains three major processing stages: localization pre-estimation, array phase correction, and high precision localization. The pre-estimation accuracy of TDOA is uncorrelated with the number of sensing channels, and the TDOA pre-estimation of the sensing channels at different locations is quite different, which may be related to the uneven transmission medium and inconsistent cable deployment conditions. Multiple sensing channel groups are used for TDOA pre-estimation, and the final pre-estimation location is the average value. The result of TDOA pre-estimation is (29.7 m, 58.1°), and the RMSE is 5.7 m. The DAS detected phase is corrected according to the pre-estimation location, and the corrected DAS detected phase is used for spatial spectrum estimation by MUSIC method to obtain a multi-dimensional target source localization. In the experiment, the RMSE of localization result can be effectively reduced by increasing the iterations of MUSIC algorithm. When the iteration number is increased to three, the RMSE reaches a minimum value, and a high precision target source multi-dimensional localization result can be obtained. The final localization result is (28 m, 67.5°), and the RMSE is 1.1 m. The proposed method enables that the detected signal of DAS sensing channel can be accurately located using ASP method directly. Moreover, compared with TDOA pre-estimation, the localization accuracy is greatly improved.ConclusionsIn the present study, a multi-dimensional target source localization method for distributed acoustic sensing is proposed, which is suitable for common communication fiber in a wide range of applications. Due to the large detection aperture of DAS, there is a phase deviation between DAS equivalent array and uniform linear array. The DAS detected phase is corrected by the proposed phase correction method, and the target source can be accurately located using ASP method without shrinking the sensing channel aperture. The principle of array phase deviation is analyzed and the feasibility of the proposed localization method is preliminarily verified. Compared with previous DAS target multi-dimensional localization studies, the proposed method does not require special structures to wind the optical fiber and shrink the sensing channel aperture, greatly simplifying the system complexity. The RMSE of localization result can be effectively reduced by increasing the iterations of MUSIC algorithm. The proposed method provides a simple and effective means for DAS target source multi-dimensional localization. It is believed that the proposed method will improve DAS localization performance in actual applications, such as intrusion detection and earthquake monitoring.
Apr. 25, 2024Vol. 51 Issue 8 0810003 (2024)
Xing Huang, Xuyan Hu, Weiwei Liu, and Hong Zhao
ObjectiveChanges in land cover types lead to numerous ecological and environmental issues. For effective resolution of these issues, monitoring changes in land cover is crucial. Numerous studies have explored the use of full-waveform LiDAR for land cover classification. However, its accuracy can diminish with increasing classification categories. Enhancing classification accuracy necessitates the integration of auxiliary features with waveform features. Research indicates that combining waveform features with the spectral features of optical images can enhance the precision of land cover classification. Given the broad distribution of GEDI data across Earth's surface, it is valuable to investigate if merging GEDI waveform features with optical image spectral features positively impacts land cover classification. Improved accuracy could expand training/validation samples, particularly in regions with limited field surveys or high-resolution remote sensing data. This could enrich the sample pool for land cover classification tasks, thereby boosting overall classification accuracy.MethodsA support vector machine (SVM) was used to classify footprints. First, the GEDI L2A footprint points in the study area in 2020 were extracted, and survey data were used to label the ground object categories under the footprint points. Simultaneously, the spectral reflectance of Landsat remote sensing images at the footprint points was extracted and the vegetation index was calculated. Second, the waveform information and spectrum at the footprint point were normalized, and the sample data were randomly divided into training and verification datasets. Among them, 70% of the training data were used to train the SVM classification model, and 30% were used to verify its accuracy of the classification model. Next, the feature vectors in the training dataset were input into the SVM classification model, and GridSearchCV was used to search for the penalty coefficient and kernel function of the SVM to obtain the optimal parameters and train the optimal classification model of the footprint points. Subsequently, the producer accuracy (PA), user accuracy (UA), overall accuracy (OA), and Kappa coefficient were calculated using the validation dataset to evaluate the model. Finally, the sample data from the six subregions of the study area were extracted. The classification results for the other regions were predicted based on the data training model for each region, and the adaptability of the method was evaluated.Results and DiscussionsThe importance of two types of source variables (waveform and spectrum) is calculated by using the experiment of the importance of the general classification model (Fig. 3), and multiple feature groups (Table 6) are set according to the feature source and importance to train the prediction model respectively. The evaluation of the model shows that the overall accuracy of using only one type of feature is less than 82%; however, the OA can reach 90.68 % when used together (Table 7?11). This shows that the combination of the spectral characteristics of Landsat spectral data and the waveform data of GEDI full-waveform LiDAR data improves the accuracy of land cover classification. The applicability of the method is tested across six subregions (plains, mountains, and hilly landforms) within the study area. Tables 12 and 13 demonstrate the proposed method's strong applicability. However, during the applicability test, challenges may arise due to the limited sample size and imbalanced data distribution. The model's practicality can be achieved by increasing the number of samples and ensuring a balanced dataset.ConclusionsThe spectral characteristics of the Landsat spectral data and waveform data of the GEDI full-waveform LiDAR data can be used to improve the accuracy of land cover classification. The overall accuracy of the combined use of spectral and waveform features is 90.68%, which can be improved by more than 8 percentage points when compared to a single feature. When the spectral characteristics of local objects are similar, the structural information provided by the waveform characteristics plays an important role in distinguishing different land cover types. Similarly, when the same types of objects with different structural characteristics or different types of objects with the same structural characteristics appear, the spectral characteristics play a key role. Additionally, data from six subregions in the dataset are utilized to test the applicability of the test model. The results indicate that the proposed method exhibits good universal applicability. Therefore, the combined use of height and spectral features from the GEDI and Landsat OLI data is beneficial for land cover classification of GEDI footprints.
Apr. 25, 2024Vol. 51 Issue 8 0810004 (2024)
Haiyong Zhu, Junlin Chen, Zhijiang Zeng, Qinfei Xu, Xiaokun Wang, Yaran Li, and Xue Li
ObjectiveInfrared detection technology is widely used in the aerospace industry owing to its strong anti-interference capabilities and wide detection ranges. This enables comprehensive and large-scale continuous monitoring of land and oceans. Notable examples include the successful launch of the Ocean No.1 (HY-1A) and Fengyun sequence satellites, both of which are equipped with an infrared payload. However, infrared detection is challenging because of weak target signals and the need for increased detector sensitivity. To address this issue, infrared focal plane detectors such as mercury cadmium telluride (MCT) operate at lower temperatures, necessitating sufficient cooling capacity provided by refrigerators. Currently, most MCT detectors used in space applications employ mechanical refrigeration. These detectors are typically packaged in a metal Dewar to meet low-temperature working requirements and are coupled with the refrigerator through the Dewar cold finger. Hence, the Dewar design directly affects the refrigeration efficiency. Additionally, strict stray light analysis and suppression are essential for satisfying the high-performance requirements of infrared remote-sensing loads. This is crucial for ensuring the accurate quantitative inversion and image quality of infrared remote sensing data. A notable example is the temporary shutdown of the EU Meteosat-5/7 series imager owing to stray light interference. Infrared remote sensing detection systems, particularly those operating at long wavelengths, rely heavily on the suppression of internal stray light radiation to enhance image quality. To reduce the infrared component background radiation, the infrared component barrel, lens, and Dewar window are often low-temperature optically processed, ensuring the infrared optical component cooling capacity in a limited space becomes the key to component design.MethodsTo suppress stray light in the system, the veiling glare index (VGI) is calculated based on the functional relationship between the point source transmittance (PST) and the VGI (Fig.2). In addition, the VGI and noise signal ratio (NSR) are used as indicators to investigate methods for suppressing external stray light and background radiation. This study aims to optimize the design of a Dewar cold screen and window. Initially, the effectiveness of the cold optical design for reducing the background radiation of the system is compared (Figs.3 and 4). Refrigeration is essential for the cold optical design and proper functioning of the Dewar detector. The impact of the Dewar cold screen and window design parameters on the Dewar heat loss is examined (Tables 1 and 3). By fitting the experimental data, the relationship between the Dewar heat leakage and chiller power consumption is defined (Fig.6). Subsequently, a cold-screen design with low cooling power consumption is proposed (Fig.8), and the values of the system VGI and Dewar NSR are calculated through simulations.Results and DiscussionsThe results indicate that the cold optical design effectively reduces stray light from background radiation in the system. The NSR of the three bands operating in the system decreases significantly from above 4.5 to below 0.35 (Fig.4). Theoretical calculations demonstrate that as the distance between the cold screen and window decreases, there is an increase in the Dewar heat leakage and power consumption of the refrigerator (Table 1). Furthermore, the relationship between the Dewar heat leakage and power consumption follows an E-exponential function (Fig.6). By utilizing the new cold-screen design (Fig.8), it is possible to reduce the power consumption of the refrigerator while simultaneously improving the external and Dewar background radiation stray lights (Figs.9 and 10).ConclusionsWith the improvements in the detection accuracy of space remote sensing loads, stray light suppression design has become a key technology in space remote sensing. The infrared optical load benefits from the low-temperature optical design, which effectively suppresses the background radiation of the infrared system. The refrigeration of the refrigerator is crucial for the normal operation of the detector and the low temperature optical design. Therefore, it plays a key role in ensuring an efficient stray-light-suppression design within the limited refrigeration resources of refrigerators. This study utilizes the functional relationship between the PST and VGI to calculate the VGI. It investigates the impact of the Dewar cold screen and window design on the external stray light, system background radiation, and power consumption of the refrigerator using the VGI and NSR as indicators. This study establishes a preliminary system for a Dewar cold screen and window design, encompassing stray light suppression and Dewar heat leakage designs. A cold screen design that achieves both low cooling power consumption and high stray light suppression is proposed. Under these design conditions, the Dewar heat leakage is 1.7 W, the chiller power consumption is 103.72 W, VGI is reduced from 1.95% to 1.92%, and the energy proportion of the window radiation stray light is reduced by 60%, meeting the project design requirements. This study addresses issues related to low-temperature optical design, refrigerator power consumption, and stray light suppression, providing valuable insights for the design and engineering applications of infrared Dewar refrigeration components.
Apr. 25, 2024Vol. 51 Issue 8 0810005 (2024)
Xinyu Guo, Jian Wu, Mingxin Shi, Xinxin Zhu, Yan Qiu, Jinghui Li, Di Wu, and Ziyuan Song
ObjectiveThe nuclear industry is a strategic high-tech industry and an important cornerstone of national security. It involves various areas, such as ore exploration and mining, uranium extraction, isotope separation, reactor power generation, and spent fuel reprocessing. The uranium content of uranium ores is an important criterion for identifying uranium ore types and evaluating their developmental value. The rapid collection of uranium distribution information is necessary for geographical exploration. In particular, this is true for China, where uranium deposits are scattered and ore bodies are relatively small. Laser-induced breakdown spectroscopy (LIBS) is an atomic emission spectroscopy technique that involves irradiating the sample surface with nanosecond pulse lasers (typically at irradiance levels above GW/cm2). The irradiated material on the sample surface is rapidly heated, melted, vaporized, and partially ionized, forming laser-induced plasma (LIP). The elemental composition of the sample material can be measured by analyzing the emission spectra of the plasma. Fiber-optic LIBS (FO-LIBS) is an LIBS system that utilizes optical fibers for laser transmission and simultaneous collection of plasma emission spectra. It uses flexible, long optical fibers to transmit pulse lasers and spectral signals, which make it more suitable for complex and confined spaces in the field than conventional LIBS. Measurement distances can reach tens of meters. This study addresses the demand for the rapid, in-situ, and on-site detection of uranium in the nuclear industry and establishes a laboratory-based FO-LIBS system for investigating the evolution characteristics of uranium emission spectral lines in plasma under a helium atmosphere. Furthermore, it provides parameter optimization schemes and explores the matrix effects of uranium ore samples. A multivariate calibration method for quantitative analysis is proposed, which effectively improves calibration and prediction accuracy while ensuring model generalization performance. This provides a new approach for the rapid elemental analysis of ores.MethodsWe conducted experiments using natural samples and their mixtures to better align the results with practical applications. Spectra of the pressed samples were acquired using the FO-LIBS system. An air-blowing device was used to create a helium atmosphere, and the spectral information in a helium atmosphere was compared with that in an air atmosphere. The detection delay was optimized by comparing the signal-to-noise ratio, signal-to-background ratio, and net spectral intensity of the spectral lines. A multivariate linear calibration algorithm based on an internal standard method was proposed to address the matrix effects caused by the compositional differences among the samples. The model was fitted using partial least squares regression (PLSR) and a constrained genetic algorithm (GA), and the results were compared with calibration results based on spectral net intensity.Results and DiscussionsAmong the U I 356.659 nm, U II 367.007 nm, and U II 409.013 nm lines in the uranium ore, only the U II 409.013 nm line exhibits a higher signal-to-noise ratio and is unaffected by interference from other lines at low mass fraction (Fig.3). In a helium atmosphere, the signal-to-noise ratio of U II 409.013 nm increases by 1.37 times from 13.29 to 31.45. Additionally, the signal-to-noise ratio reaches 8.9 at a mass fraction of 0.0726%. During the study of the variation in the detection delay using FO-LIBS in a helium atmosphere (Fig.4), the signal-to-noise ratio of the characteristic spectral lines remains above 10 until a delay of 1000 ns; however, it rapidly decreases to approximately 5 after a delay of more than 1000 ns. The signal-to-background ratio exhibits a peak of approximately 2.4 at a delay of 1000 ns and continues to increase subsequently when the delay is over 1200 ns, primarily owing to the rapid decay of the background intensity in the later stage of the plasma compared to those of the spectral lines. Therefore, a detection delay of 1000 ns is selected as the optimal value. Finally, a comparison of the results of the univariate calibration, multivariate linear regression using PLSR, and multivariate linear regression using constrained GA (Fig.8) shows that the prediction results obtained using multivariate linear regression are closer to the reference values than those obtained using univariate calibration based on spectral intensity alone. This indicates that the multivariate regression approach can correct for the matrix effects. The R2 (coefficient of determination) values of the calibration models based on PLSR and GA have both the training set and leave-one-out cross-validation (LOOCV) greater than 0.99, indicating the accuracy and robustness of these models. A comparison of PLSR and GA shows that the PLSR model exhibits superior calibration accuracy with a higher R2 and lower root mean square error in LOOCV. By constraining parameter k to positive values using the GA, the calibration accuracy decreases slightly; however, the relative standard deviation (RSD) decreases, resulting in improved prediction stability. The limits of detection and quantification are estimated as 142 mg/kg and 426 mg/kg, respectively.ConclusionsThis study investigates a uranium detection method based on FO-LIBS to meet the demand for rapid, on-site, and in-situ uranium detection in the nuclear industry. Among the dense spectra containing multiple elements, the uranium spectral line U II 409.013 nm is selected. The enhancement effect of the helium atmosphere on the uranium spectral line is explored. For the sample with a uranium mass fraction of 0.425%, the helium atmosphere improves the signal-to-noise ratio of the spectral line by 1.37 times. In addition, the detection delay of the system is optimized, and a peak in the signal-to-background ratio is observed at 1000 ns, which is determined to be the optimal delay for quantitative analysis. Under optimal conditions, the signal-to-noise ratio of the uranium spectral line is 8.9 in a sample with a mass fraction of 0.0726%. A multivariate linear regression model based on the internal standard method is proposed to address the matrix effect caused by differences in the chemical compositions of the natural samples in the experiments. The spectral lines of the matrix elements are introduced for calibration. The fitting parameters are obtained using PLSR and a constrained GA, with PLSR exhibiting superior quantitative performance in terms of R2 and RMSEC. The calibration model achieves an R2 of 0.9984 for uranium and an RMSEC of 0.0404%. Furthermore, the limit of detection for uranium using FO-LIBS is estimated to be 142 mg/kg, and the limit of quantification is 426 mg/kg.
Apr. 25, 2024Vol. 51 Issue 8 0811001 (2024)
Mingxin Shi, Jian Wu, Di Wu, Jinghui Li, Yan Qiu, Xinyu Guo, Ying Zhou, Ziyuan Song, and Minxin Chen
ObjectiveShale oil is an important unconventional resource that has become a major development focus. Owing to the possible reserves of petroleum and natural gas, information from core samples, which mainly contain geochemical and mineralogical information, has attracted increasing attention from geologists and energy enterprises. Conventional analytical methods for mineralogical analysis, including inductively coupled plasma optical emission or mass spectrometry (ICP-OES/MS), instrumental neutron activation analysis (INNA), and X-ray fluorescence (XRF), are unsuitable for the in-situ analysis of shale because of their slow analysis speed and limited detection range. Laser-induced breakdown spectroscopy (LIBS) is a novel analytical method for various materials that uses laser pulses focused on a sample to generate laser-produced plasma and spectral emissions. With the advantages of minimal sample preparation, remote analysis, microsample ablation, and high analytical speed, LIBS is an optional access method for analysis of cores. In this study, multi-element quantitative analysis of natural shale and sandstone samples is conducted using a micro-LIBS system. A standardized spectral preprocessing method is developed to reduce spectral uncertainty, and a model input parameter optimization process is established to prevent model overfitting while improving model prediction accuracy. A quantitative analysis of Si, Ca, Fe, Al, Mg, and other elements in the shales and sandstones is performed, and the average predicted root-mean-square error of most samples is less than 1%, providing technical support for regular mineral component analysis and lithology identification of shales and sandstones.MethodsA micro-LIBS system was established in this study, consisting of a laser, spectrometer, timing synchronizer, computer, and optical microscope. The system used a nanosecond-pulse laser to generate a laser beam that passes through a laser beam splitter and was sampled by a photodiode to detect the laser timing. The transmitted laser beam was introduced into an optical microscope, adjusted to be coaxial with the microscope illumination light path through a laser mirror, and finally focused on the sample surface through a near-infrared objective lens to generate plasma. Plasma emission was collected by a short-focus lens to an optical fiber and connected to a six-channel spectrometer for spectrum collection; the integration time was set to 1 ms. The laser pulse energy was adjusted to 30 mJ, and the detection delay of the spectrometer was set to 800 ns. Before the spectrum acquisition, two laser shots were applied for pre-ablation to stabilize the pulse energy, and 10 accumulated spectra were collected and analyzed. Partial least squares regression was used for the data analysis.Results and DiscussionsBecause of the variety, inhomogeneity, and complexity of the samples, it is necessary to perform spectral line preprocessing and characteristic spectral line identification of the extracted spectra before quantitative analysis. Therefore, this study establishes a set of spectral data pre-processing procedures. After spectral preprocessing, the average relative standard deviation of a single shale sample (Rsingle) decreases from 32.50% to 14.53%, whereas the average Rsingle of the sandstone samples decreases from 56.01% to 33.92%. Simultaneously, the spectral relative standard deviation RS-S between shale and sandstone samples is also reduced after spectral processing, proving that the spectral preprocessing process can significantly reduce spectral uncertainty and improve the precision of the quantitative analysis prediction results. Based on the leave-one-out method, this study constructs a set of PLSR model input dataset parameter optimization processes. When the number of input spectra is fixed, the optimization parameters initially decrease, and then increase as the number of principal components increases. This is because lower principal components cause model underfitting and insufficient interpretation of the training set samples, and the RMSEC is too high. The number of principal components causes overfitting of the model, poor interpretation of the new prediction set, and a high RMSECV value. The PLSR model achieves the best performance only when an appropriate number is selected. Under the optimized parameters, R2>0.95 and RMSEC<1% for most samples, indicating that the PLSR model can better achieve multi-element quantitative analysis of shale and sandstone.ConclusionsTo meet the demands of rapid quantitative determination of mineral element content in natural shale and sandstone samples, a microanalysis laser-induced breakdown spectroscopy system with automated analysis capabilities is developed to rapidly detect and analyze oil and gas shale and sandstone natural samples. A standard process for spectral data preprocessing is established, and the average relative standard deviation of shales is reduced from 32.50% to 14.53%, and from 56.01% to 33.92% for sandstones. This study proposes a quantitative analysis process based on partial least squares regression (PLSR) with Si, Ca, Fe, Al, and Mg quantitatively predicted. The R2 value for most samples is 0.95, and the RMSEC and RMSEP values are lower than 1%. This study provides technical support for the rapid analysis of the mineral components in shale and sandstone samples. The proposed data pre-processing and quantitative analysis is expected to become a technical standard for LIBS analyses.
Apr. 25, 2024Vol. 51 Issue 8 0811002 (2024)
Tao Cui, Lu Yin, Yanan Sun, Jianjun Chen, Yangdong Zhou, Longfei Han, and Le Wang
ObjectiveThe echelle spectrometer, with its high spectral resolution, is increasingly applied in various fields and has become one of the primary spectroscopic analysis instruments. Spectrum reconstruction technology is at the core of data processing in echelle spectrometers. It achieves rapid reconstruction from two-dimensional (2D) images to one-dimensional (1D) spectra by establishing a correspondence between the wavelength and imaging position. The accuracy of the spectrum reconstruction directly determines the performance of the echelle spectrometer, making it a key and challenging aspect of instrument development. Spectrum reconstruction algorithms have evolved from ray tracing, modeling (deviation method and mathematical modeling), and calibration methods. The evolution of algorithms is an ongoing process of continuous optimization and improvement. Each spectrum reconstruction algorithm has its advantages and disadvantages. However, a consistent mainstream approach is to achieve high accuracy and speed. Factors such as environmental conditions and application requirements must also be considered. Therefore, it is crucial to develop a spectrum reconstruction algorithm that combines these various advantages.MethodsThis study proposes a convenient and widely applicable spectrum reconstruction algorithm, adopting a nontraditional approach that initially focuses on improving the modeling speed, followed by further enhancement of accuracy. The main research method involves leveraging the advantage of rapid modeling using the deviation method to establish an initial model quickly. Subsequently, the initial model is subjected to holographic surface fitting with the theoretical model traced using ray-tracing software to obtain a standard model. Calibration is thereafter incorporated into the modeling process, allowing the standard model to fit an actual model comprising elemental lamp spectrum data. Through this process, the final model is obtained, and a spectrum reconstruction model is established. Following this, denoising is applied to the 2D spectra of the elemental lamps, completing the wavelength extraction. Finally, five elemental lamps are selected as test light sources to validate the accuracy of the proposed algorithm.Results and DiscussionsHolographic surface fitting is performed between the initial and theoretical models (Fig.7). After holographic surface fitting, a standard model is obtained (Fig.8). The error within the holographic surface of the standard model is within 2 pixel (Table 3). In the two-stage modeling process, the standard model is fitted with the actual model to obtain the final model. The error within the holographic surface of the final model after fitting is within 3 pixel (Fig.10). In the image denoising process, a denoising algorithm is developed based on the characteristics of the original 2D spectrum, accomplishing the denoising task and removing the majority of the noise (Fig.13). Finally, by selecting five types of elemental lamps as test light sources (Table 4) and 42 characteristic wavelengths as test data (Table 5), experimental results exhibit an extraction error of 0.01 nm for the average wavelength within the selected wavelength range. The entire image surface deviation is validated by the spectrum reconstruction model (Table 6). Within the wavelength range of 200?800 nm, the image surface deviation is within 2 pixel (Fig.16). The spectrum reconstruction algorithm presented in this paper demonstrates excellent accuracy.ConclusionsThis study proposes a spectrum reconstruction algorithm for echelle spectrometers based on holographic surface fitting. The algorithm demonstrates notable advantages in both modeling speed and model accuracy. As concerns calibration during the modeling process, this algorithm overcomes the impact of environmental changes and instrument movements, thereby saving resources and time. This study shifts its focus to the modeling process, initially prioritizing modeling speed, and later pursuing model accuracy. The advantage of rapid modeling using the deviation method is leveraged to establish an initial model. Thereafter, the spectrum reconstruction model is constructed using holographic surface fitting, cleverly incorporating calibration into the modeling process. After model establishment, denoising is applied to the 2D original images, and wavelength extraction is completed. Finally, the accuracy of the model is validated using five types of elemental lamps. The experimental results indicate that within the entire wavelength range (200?800 nm), the average wavelength extraction error is within 0.01 nm, and the pixel deviation for extracting characteristic wavelengths within the holographic surface is 2 pixel, which does not lead to significant misinterpretations. The algorithm can correctly output 1D spectra of the characteristic wavelengths and intensities. These experimental results fully demonstrate the capability of the algorithm to meet precision requirements. Moreover, the algorithm is straightforward, versatile, and applicable, making it more conducive to widespread use in practical production. These aspects are significant for enhancing the performance and practicality of echelle spectrometers.
Apr. 25, 2024Vol. 51 Issue 8 0811003 (2024)
Qianjin Wang, Pengshuai Sun, Zhirong Zhang, Yongjun Cai, Wenbiao Huang, Tao Pang, Hua Xia, and Bian Wu
ObjectiveThe real-time detection of ethylene (C2H4) is significant for the safety of coal mines, the petrochemical industry, and other industries. Currently, the mainstream methods for C2H4 gas concentration detection include gas chromatography and electrochemical sensors. Gas chromatography can separate multicomponent gases and avoid mutual interference. However, this method requires long-term preheating and frequent calibration, making it difficult to complete real-time measurements in industrial scenarios. Although electrochemical sensors have the advantages of small size and low cost, their selectivity is poor, and it is difficult to avoid cross-interference. In contrast, tunable diode laser absorption spectroscopy (TDLAS) has the advantages of real-time measurements, high sensitivity, and strong selectivity. They are widely used in industrial gas detection and environmental monitoring. Unfortunately, there are still some difficulties in real-time high-precision detection of C2H4. First, information regarding the absorption line of C2H4 in the near-infrared band cannot be obtained. Second, the absorption spectrum of C2H4 is described as complex band absorption. Third, the absorption spectra of C2H4 and CH4 in the near-infrared band interfere with each other. Therefore, real-time high-precision detection of C2H4 is a common problem that urgently needs to be addressed.MethodsFirst, the gas concentration can be calculated using traditional direct absorption spectroscopy if the accurate parameters of the absorption line are known. However, for C2H4, it does not contain an absorption line intensity within the near-infrared band in the HITRAN database. This results in an inability to use a calibration-free method to directly calculate the C2H4 concentration. Notably, the concentration calculation method in wavelength modulation spectroscopy does not require accurate spectral line intensity. Therefore, the calibration concept of wavelength modulation spectroscopy is applied to the direct absorption spectroscopy, forming a method named calibrated direct absorption spectroscopy. In addition, faced with the problems of the band absorption of C2H4 and the interference of CH4, a high-precision pressure control system is utilized to complete the spectral line separation under low pressure. In contrast to previous studies, it is necessary to select an appropriately calibrated spectrum in this study. Specifically, standard CH4 and C2H4 gases are measured at a pressure of 100 mbar (1 bar=105 Pa) and the corresponding direct absorption spectra are obtained. By comparing with the simulated spectrum of CH4 in the HITRAN database, the appropriate calibrated spectrum of C2H4 is determined.Results and DiscussionsStable pressure plays a vital role in the experiments. After the pressure value stabilizes to 100 mbar, the pressure results of the continuous measurement within 1 h are collected, and the distribution of the pressure results is well fitted by a Gaussian function; the full width at half maximum is 0.008 mbar, which proves the stability of the experimental system for pressure control. The subsequent experiments are conducted at 100 mbar. Within the volume fraction of less than 100×10-6, the direct absorption spectrum signals of five sets of C2H4 are acquired and the concentration results are also calculated. The correlated coefficient of linear fitting between the result and the standard concentration is greater than 0.999, and the maximum measurement error is -1.47×10⁻⁶. In addition, a direct absorption spectrum signal of 10×10-6 C2H4 is selected for limit of detection (LoD) analysis. The peak value of the signal is 5.80×10⁻⁴, and that of the background signal is 0.80×10⁻⁴, which can be calculated to obtain a signal-to-noise ratio (SNR) of 7.25. The concentration corresponding to one SNR is defined as the LoD, and its value is 1.38×10⁻⁶. Finally, C2H4 with a volume fraction of 20×10-6 is continuously measured for 40 min, and Allan variance analysis is performed on the volume fraction results. At an integral time of 1 s, the precision of measurement for C2H4 is 0.61×10⁻⁶. As the integral time increases, the detection precision can reach 0.04×10⁻⁶.ConclusionsTo address the challenges faced in near-infrared ethylene detection, a calibrated method in wavelength modulation spectroscopy is applied to direct absorption spectroscopy, forming a new method known as calibrated direct absorption spectroscopy. An experimental device for C2H4 detection with a high-precision pressure-control system is established, and the direct absorption spectrum of C2H4 is measured at approximately 1626 nm. Based on experimental verification, the calibrated direct absorption spectroscopy method can complete the real-time detection of C2H4, overcoming the limitations of traditional direct absorption spectroscopy. We also hope to address real-time detection problems of other similar gases, which can significantly expand the application of direct absorption spectroscopy.
Apr. 25, 2024Vol. 51 Issue 8 0811004 (2024)
Yufeng Guo, Shangzhong Jin, Hongguang Li, Ziwei Zeng, and LiaoWentao
ObjectiveTerahertz waves are widely used in security checks and nondestructive testing. However, because of limitations in imaging devices and algorithms, terahertz images face challenges, such as limited spatial resolution and blurry features. Currently, two main approaches are used to enhance the resolution of terahertz images. The first involves improving the imaging system, whereas the second uses super-resolution reconstruction algorithms to improve image quality. In recent years, research teams have applied convolutional super-resolution networks to terahertz image reconstruction. However, these methods construct network models by increasing the number of convolutional layers, leading to an exponential expansion of the parameters and a lack of specific structures to enhance the reconstruction of image details. Although deeper networks can extract more information for image reconstruction, overfitting complicates training. In this study, a super-resolution reconstruction algorithm is developed based on residual-attention generative adversarial networks to further improve the quality of reconstructed images.MethodsThe proposed super-resolution reconstruction algorithm is based on a residual attention generative adversarial network. First, a contrast-limited adaptive histogram equalization method is introduced for terahertz images, effectively addressing the low-contrast issue. Second, building upon the generative adversarial network, a residual generative adversarial network incorporating an improved attention mechanism achieves super-resolution reconstruction of terahertz scanning images. This algorithm features a multibranch residual block convolutional structure and extracts and fuses the feature information from each layer during the feature extraction process. In addition, an enhanced attention mechanism combining spatial and channel attention is added to the residual block. Beyond channel information extraction, it includes orientation awareness and position-sensitive information, compelling the network to focus more on texture and image details while maintaining image shape integrity and reducing the network parameters. Finally, a spectrum-normalized U-net network is employed to discriminate the reconstructed images generated by the generator, thereby enhancing training stability.Results and DiscussionsTest images from the terahertz transmission scanning dataset are selected [Fig.5(a)] to validate the effectiveness of the proposed algorithm in image super-resolution reconstruction. The results of the two images indicate that the proposed algorithm clarifies edge information [Fig.5(f)]. In contrast, other algorithms such as bicubic interpolation, SRResNet, SRGAN, and ESRGAN exhibit various issues [Figs.5(b)?(e)]. The traditional bicubic interpolation algorithm is overall unsatisfactory and appears blurry. Images reconstructed by the SRResNet and SRGAN algorithms show problems, such as increased noise and suboptimal visual coherence. Although the ESRGAN algorithm improves the clarity compared to the original image, pseudoartifacts in the edges lead to image blurriness. The objective evaluation metrics for the images processed using the algorithm in this study show a significant improvement over those of the original images, and the enhancement is higher compared with those of bicubic interpolation, SRResNet, SRGAN, and ESRGAN (Table 1). The experimental results demonstrate that compared to other image super-resolution algorithms, the proposed algorithm uses low-resolution image information more comprehensively, improving information utilization and exhibiting superior reconstruction performance.ConclusionsA terahertz image super-resolution reconstruction algorithm based on generative adversarial networks is established to address issues, such as low clarity and blurred edges in images captured by terahertz line-scan cameras. Building on the SRGAN, a residual dense network incorporating an enhanced attention mechanism is introduced, and a spectrum-normalized U-net is used as the discriminative network. The critical parameters in this network can be adaptively updated using the attention model by incorporating pixel coordinates into the attention mechanism. A terahertz image training dataset is established to apply this network to terahertz image super-resolution reconstruction. The experimental results indicate that the proposed super-resolution reconstruction algorithm, which is based on generative adversarial networks and attention mechanisms, qualitatively aligns better with human observation habits, highlighting more nuanced edge information in the reconstructed images. Quantitatively, various metrics for the reconstructed high-resolution images show improvements, with a 7% increase in edge intensity, 12% increase in average gradient, 13% increase in peak signal-to-noise ratio, and 14% increase in structural similarity. These results validate the superiority and effectiveness of the proposed algorithm in enhancing the clarity of terahertz images.
Apr. 25, 2024Vol. 51 Issue 8 0814001 (2024)
Chengjiang Xiang, Xiaofeng Liu, Chunxian Tao, Dawei Li, Yuan’an Zhao, Ziyuan Xu, Shuai Kun, He Gong, Jian Sun, Weili Zhang, Yuchuan Shao, and Jianda Shao
ObjectiveThe advancement of high-power lasers poses challenges to the damage resistance of coatings. Currently, studies on coating damage largely rely on offline end-state characterization to understand and infer associated damage processes and mechanisms. However, given the thickness and intricate composition of these coatings, coupled with the exceedingly brief damage process during pulsed laser exposure, establishing a link between the origin of the damage and its ultimate morphology becomes challenging. Anti-reflection films commonly apply to windows or lenses and are susceptible to damage due to their transmitted electric field. Depending on specific application needs, anti-reflection films position either on the laser entry or exit surface. In this study, the HfO2/SiO2 anti-reflection coating, operating under both conditions, undergoes exposure to a 1064-nm nanosecond laser. By integrating offline end-state characterization with online dynamic process monitoring, the analysis reveals damage traits and mechanisms. This insight aids in refining anti-reflection coating fabrication techniques and their practical use.MethodsThe output pump beam of an Nd∶YAG laser (wavelength of 1064 nm, pulse width of ~10 ns) is vertically focused on the surface of an anti-reflection coating. A continuous probe beam with a wavelength of 532 nm, perpendicular to the pump beam, sweeps across the surface of the anti-reflection coating. An intensified charge-coupled device (ICCD) is combined with an imaging system to detect dynamic damage processes. By adjusting the delay between the ICCD shutter and trigger signal of the pump laser, damage images at different moments are captured, and the entire dynamic damage process is documented. The optical microscope (OM), scanning electron microscope (SEM), and focused ion beam (FIB) are used to characterize the final damage morphologies. Under irradiation with the same laser fluence, the anti-reflection film is located either on the laser incident or exit surface. The damage characteristics of the two irradiation methods are analyzed and contrasted.Results and DiscussionsIn this study, combining offline end-state characterization with online dynamic process detection, the damage to the HfO2/SiO2 anti-reflection coating under the mentioned two working conditions is investigated. Findings show that under identical irradiation conditions, regardless of the anti-reflection film location on the laser incidence (forward process) or exit (reverse process) surface, two types of damages occur: pits with and without layer peeling-off. However, the central pits in the forward and reverse processes exhibit significant differences. Morphologically, the bottom center of the pits in the forward process displays a smooth and consistent melted region, while the melting characteristics in the reverse process are not pronounced and show signs of stress fragmentation. Moreover, the size of the damaged area, whether considering the lateral diameter or the longitudinal depth of the pit, is larger in the reverse process than in the forward process (Figs.4 and 5). Finite element analysis indicates that the electric field intensity (EFI) at the substrate-coating interface for both processes is comparable (Fig.11). A noticeable large-sized plasma flash appears in the damage process with the peeling-off layer, whereas this phenomenon remains unobservable without layer peeling-off (Figs.7, 8, 9, and 10). The plasma expands in the direction opposite to the laser incidence. In the forward process, the plasma hinders subsequent laser energy transfer to the coating surface, leading to comparatively minor damage. Conversely, a large amount of laser energy absorbed by the plasma in the reverse process is deposited inside the material, intensifying the damage (Fig.12). The more potent shockwave energy in the reverse process further validates this damage process. Regardless of the coating position on the laser incident or exit surface, the energy absorbed by the damage with layer peeling exceeds that without layer peeling (Fig.13 and Table 1).ConclusionsUpon irradiation of the anti-reflection coating positioned on the laser incidence or exit surface with a 1064-nm nanosecond laser, damage morphologies are characterized, and the dynamic damage processes are analyzed using ICCD. The study investigates the dynamic processes of plasma, shock wave, and material ejection corresponding to various types of damage. The conclusions are as follows:1) Two damage morphologies are identified for the coating positioned on the laser incidence (forward process) and exit (reverse process) surfaces. Under OM, the less severe damage reveals a central pit surrounded by a discolored area, indicative of nanoscale holes resulting from plasma ablation. In pits with greater damage, the SiO2 surface layer peels away. The emergence of this peeling layer is associated with larger plasma flashes.2) The damaged areas in the reverse process are larger and deeper than those in the forward process. Electric field simulations for the forward and reverse processes exhibit a similar electric field strength at the film-substrate interface, which is insufficient to form these morphological differences. The energy of the shock wave in the dynamic process of laser damage is calculated using the propagation speed of the shock wave, and the ratio of shock wave energy in the reverse process to that in the forward process is as high as 23.93.3) Due to the plasma propagating in the direction opposite to the laser incidence, in the forward process, the plasma evolves from the coating toward the air, inhibiting subsequent laser pulses from interacting with the material. Conversely, in the reverse process, the plasma moves from the coating toward the substrate, leading to deposition of laser energy within the substrate, which in turn results in enhanced plasma and material ejection. Hence, the notable morphological differences between the forward and reverse processes stem from the varied energy absorptions dictated by the plasma development direction under laser support.
Apr. 25, 2024Vol. 51 Issue 8 0803101 (2024)
© Copyright 2018-2021 | Chinese Laser Press.
All Rights Reserved 沪ICP备15018463号-20