


Please enter the answer below before you can view the full text.

Jing Luo, Xiaoling Ji, and Xiaoqing Li
ObjectiveGround-based laser systems can remove centimeter-scale space debris in the low-Earth orbit region. However, as the high-power laser beam propagates through the atmosphere, it encounters significant challenges. When the beam’s power exceeds the atmosphere’s critical power for the self-focusing effect, the beam quality at the target diminishes due to this nonlinear effect.Interestingly, Airy beams exhibit self-accelerating characteristics, making them potentially advantageous for bypassing obstacles. However, in homogeneous self-focusing media, an Airy beam can lose its self-accelerating traits if its power is exceedingly high. This leads to pressing inquiries: Does the nonlinear self-focusing effect in an inhomogeneous atmosphere disrupt the self-accelerating nature of Airy beams? Is an Airy beam better suited than a Gaussian beam for ground-based laser space debris removal? How to enhance the target quality of Airy beams? Hence, analyzing the influence of nonlinear self-focusing on the attributes and quality of upward-propagating Airy beams in the atmosphere becomes crucial.MethodsUnder the paraxial approximation, the beam characteristics of diffraction and self-focusing nonlinearity were described via a nonlinear Schr?dinger equation. However, solving the nonlinear Schr?dinger equation analytically for an Airy beam propagating in the atmosphere is challenging. In this study, the nonlinear Schr?dinger equation was solved numerically using the multiphase screen method. As the altitude increased, the nonlinear refractive index decreased, and the nonlinear self-focusing effect became negligible at sufficiently high altitudes. Consequently, an Airy beam that propagated upward in the atmosphere experienced two stages: inhomogeneous atmospheric propagation (comprising both diffraction and self-focusing effects) and free space propagation (with only the diffraction effect).Results and DiscussionsAs the exponential truncation factor of the Airy beams increases, the value of the B integral also increases (Fig.1), indicating a strengthening of the nonlinear self-focusing effect. The real focus of Airy beams shifts to the target due to self-focusing in an inhomogeneous atmosphere, a behavior distinct from that of Gaussian beams (Fig.2). By employing the preliminary defocusing method, an Airy beam maintains its Airy profile at the target even when the beam power significantly exceeds the critical power of the self-focusing effect in the atmosphere, and the intensity at the target notably increases (Fig.5). Specifically, a formula for the focal length of the preliminary defocusing of the Airy beams is obtained, and this is also confirmed (Fig.4). With the preliminary defocusing method, the self-accelerating characteristics of the Airy beams remain unaffected by the nonlinear self-focusing effect in an inhomogeneous atmosphere, even when the beam power significantly surpasses the critical power (Figs.6 and 7). This differs from the behavior of Airy beams in a homogeneous atmosphere. Given the same beam power, the intensity of the Airy beam at the target surpasses that of the Gaussian beam (Fig.8). Additionally, the Airy beam’s resistance to the nonlinear self-focusing effect in an inhomogeneous atmosphere exceeds that of the Gaussian beam (Fig.8).ConclusionsIn this study, the influence of nonlinear self-focusing on the characteristics and quality of Airy beams, as they are propagated from the ground through the atmosphere to space orbit, is numerically investigated. The strengthening of the self-focusing effect with the increasing exponential truncation factor of the Airy beams is observed. It is found that the Airy profile can be maintained at the target, even when the beam power significantly exceeds the critical power of the self-focusing effect, when the preliminary defocusing method is used, leading to a significant increase in target intensity. Furthermore, a formula for the focal length of the preliminary defocusing of Airy beams is derived. The self-accelerating characteristic of Airy beams is shown to be preserved with the preliminary defocusing method, proving beneficial for avoiding obstacles in the path. Under the same beam power, the target intensity of the Airy beam is found to be significantly higher than that of the Gaussian beam, suggesting that Airy beams are deemed more suitable than Gaussian beams for ground-based laser space debris removal.
Mar. 10, 2024Vol. 51 Issue 5 0505001 (2024)
Qianwu Zhang, Shucheng Zhan, Boyang Liu, Guanwen Chen, Zhiyu Li, Yuanjiang Ouyang, Bingyao Cao, Zhengxuan Li, and Yating Wu
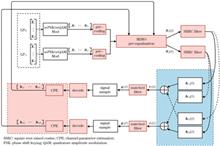
ObjectiveThe explosive development of virtual reality applications, ultra-high-definition videos, and intelligent internet of things (IoT) devices has brought new challenges to existing fiber access network solutions. As the main scheme of optical access networks, widely deployed passive optical networks based on time division multiplexing (TDM), wavelength division multiplexing (WDM), and polarization multiplexing (PDM) are currently limited by the communication capacity of single-mode fibers (SMFs) and the signal orthogonality of the traditional Nyquist transmission mode. To further improve system capacity and spectral efficiency, we proposed a faster-than-Nyquist mode-division multiplexing passive optical network (FTN-MDM-PON) that combines mode-division multiplexing (MDM) and faster-than-Nyquist (FTN) transmission technologies. However, PON based on the MDM channel and FTN transmission mode exhibits mode crosstalk caused by low-mode fiber transmission and intersymbol interference (ISI) caused by FTN transmission. Because the FTN-MDM-PON divides users by mode, the mode crosstalk in the low-mode fiber (FMF) causes the user signals loaded on different modes to interfere with each other. The ISI introduced by the FTN transmission causes adjacent symbols influence each other at the sampling decision time. To mitigate the two types of impairments in FTN-MDM-PONs, we proposed a joint damage compensation method based on matrix decomposition precoding and MIMO pre-equalization and built a simulation system in the VPI Transmission Maker for verification.MethodsBecause the PON downlink is a point-to-multipoint structure, it is impossible to simultaneously receive and eliminate mode crosstalk for all modes on the receivers of user-side optical network units (ONUs). In addition, the ISI introduced by FTN transmission technology is determined by the rolling-down factor of the pulse-forming filter and the time-domain compression factor, which is determined at the end of the transmitter. Therefore, we propose a joint damage compensation method based on matrix-decomposition precoding and MIMO pre-equalization. For matrix decomposition precoding techniques, we used singular value decomposition (SVD) precoding, singular value decomposition with power allocation (SVD PA) precoding, and Cholesky decomposition (Chol) precoding and combine them with the MIMO pre-equalizer. The matrix decomposition precoding technique can obtain the precoding matrix for the sending signal and the decoding matrix for the receiving signal through the matrix decomposition of the interference matrix to realize the diagonalization of the interference matrix to eliminate the ISI. After adding the frame header, the transmission symbol sequence was precoded using the matrix decomposition precoding method, and then transmitted by the FMF. We inserted a time-division training sequence into the frame header to obtain the channel-impulse response of the downlink. The time-division training sequence was divided into multiple time slots of the same number as the mode; each time slot corresponds to only one mode and contains the corresponding time-slot training symbol sequence. After separating the time-division training sequence of different user data frame headers at the receiver end, we adopted a training sequence-based least mean square (LMS) adaptive algorithm for channel estimation. The channel estimate was fed back to the transmitter for MIMO pre-equalization. The transmitter-side MIMO equalizer used in this study had a linear structure and used the feedback channel impulse response to calculate the tap coefficients based on the zero-forcing (ZF) criterion.Results and DiscussionsBased on the FTN-MDM-PON simulation system, we analyzed the performance of three combined damage compensation methods using different matrix decomposition precoding methods and a MIMO pre-equalizer. The curves of bit error rate relative to the received optical power when the time-domain compression factors of the mode signals were 0.8 and 0.9 are shown in (Figs.7 and 8). Simulation results show that in the FTN-MDM-PON system with four linear polarization (LP) modes, FTN signals with time-domain compression factors of 0.8 and 0.9 are transmitted through 5 km low-mode fiber (FMF), and the received optical power ranges from -40 dBm to -26 dBm. The combined damage compensation method of SVD PA precoding or Chol precoding combined with MIMO pre-equalizer reduces the bit error rate of each mode (LP01, LP11, LP21, LP31) below the 7% hard decision forward error correction (HD-FEC) threshold of 3.8×10⁻³. Among the three combined damage compensation methods, Chol precoding and SVD-PA precoding combined with a MIMO pre-equalizer exhibit better improvement effects than SVD precoding combined with a MIMO pre-equalizer. When SVD PA precoding combined MIMO pre-equalizer is used for joint damage compensation, the four LP mode signals reach 7% HD-FEC decision threshold when the received optical power is greater than -36 dBm. The combined damage compensation method of Chol precoding combined with MIMO pre-equalizer, compared with the SVD PA precoding combined with MIMO pre-equalizer, when the time domain compression factor is 0.8, the sensitivity of the four mode signals increase by 3.0 dB, 2.4 dB, 2.0 dB, and 1.3 dB. When the time domain compression factor is 0.9, the increases are 1.1 dB, 2.1 dB, 2.5 dB, and 2.1 dB. With a decrease in the time-domain compression factor, the interval between adjacent symbols in the FTN signal becomes narrower after time-domain compression, and the intersymbol crosstalk becomes more severe. When the time domain compression factor of each mode signal ranges 0.3 to 0.9, the relationship curve between bit error rate and received optical power is shown in (Figs.9 and 10). The results show that when the received optical power is greater than -34 dBm and the time-domain compression factor of FTN signal is ≥0.6, the combined damage compensation method based on SVD PA precoding and Chol precoding combined with MIMO pre-equalizer effectively reduce the bit error rate, and the bit error rate of FTN signal in four LP modes is below the threshold. The abovementioned results show that the combined damage compensation method can effectively compensate for MDM channel damage and FTN transmission damage in the FTN-MDM-PON system, and the combined damage compensation method with Chol precoding and MIMO pre-equalizer exhibits the best performance among the three precoding methods.ConclusionsWe proposed a joint damage compensation method based on matrix decomposition precoding combined with a MIMO pre-equalizer and built an FTN-MDM-PON downlink simulation system to verify the performance of this method in reducing the bit error rate of the system. We used SVD precoding, SVD PA precoding, Chol precoding, and a MIMO pre-equalizer to explore the performance of the three combined damage compensation methods in reducing the bit error rate. Moreover, the bit error rate performance of the FTN-MDM-PON using the joint compensation method was compared with that of the MDM-PON using MIMO pre-equalization only. Results show when using 4 LP modes (LP01, LP11, LP21, LP31) for 4×25 Gbaud FTN QPSK signal transmission, when the time domain compression factor is 0.8, by using the combined damage compensation method of SVD PA precoding and Chol precoding combined with MIMO pre-equalizer, the optical power of four LP mode signals only requires -36 dBm and -39 dBm, respectively, to reach 7% HD-FEC. When the time-domain compression factor is 0.9, the bit error rate performance of the combined damage compensation method using Chol precoding and the MIMO pre-equalizer is close to that of the MDM-PON system using MIMO pre-equalization only. The abovementioned results show that the proposed combined damage compensation method can effectively mitigate mode crosstalk and ISI in FTN-MDM-PON systems.
Mar. 10, 2024Vol. 51 Issue 5 0506002 (2024)
Jun Li, Ruixu Yao, Meiying Ren, Jiarui Zhang, Xinwei Zhang, and Tian Ma
ObjectiveEnsuring the integrity and reliability of oil and gas pipelines is of paramount importance in safeguarding energy security and protecting the environment. However, these pipelines are often exposed to various threats, such as human sabotage and third-party construction excavations, which may cause severe fires and explosion accidents. Therefore, it is necessary to develop an effective method to detect and identify different types of events occurring along pipelines. In this study, distributed optical fiber vibration monitoring technology is used to collect the waveform signals of six types of events that occur along a 28.9-kilometer-long pipeline. Subsequently, the Gramian angular field (GAF) transform is used to convert the one-dimensional time-series signals into two-dimensional image information, enabling the capture of characteristic patterns for each event. Next, the GoogLeNet deep learning model is used to classify and identify image information and evaluate the recognition accuracy and false alarm rate of the model. This study proposes an efficient and accurate method for oil and gas pipeline threat identification based on the GAF transform and deep learning.MethodsThis study proposes a novel method for oil and gas pipeline threat identification based on distributed optical fiber vibration monitoring technology and deep learning. The waveform signals of six types of events (manual excavation, machine damage, noise, walking, vehicle damage, and water flow vibration) were collected along a 28.9-kilometer-long pipeline, which have the potential to jeopardize pipeline safety. To enhance the feature representation of the signals, a filter was employed to remove noise, and then the GAF algorithm was used to convert the one-dimensional time-series signals into two-dimensional images, enabling the capture of the characteristic patterns of each event. Subsequently, three different deep learning networks, GoogLeNet, VGG, and AlexNet, were employed to classify and identify the images and compare their recognition accuracies and false alarm rates. Experiments were conducted to evaluate the performance of our method, demonstrating that GoogLeNet outperformed the other two networks in terms of recognition accuracy and detecting false alarm rates. The effect of the signal-to-noise ratio (SNR) on the classification performance was analyzed. The GoogLeNet network was determined to achieve optimal classification performance when the SNR was 8 dB.Results and DiscussionsThe main contribution of this study is the proposal of a novel method for oil and gas pipeline threat identification based on the GAF algorithm and deep learning. The GAF algorithm was used to transform the waveform signals of six types of field-collected events (manual excavation, machine damage, noise, walking, vehicle vibration, and water flow vibration) into two-dimensional images that captured the characteristic patterns of each event. Subsequently, three different deep-learning networks, GoogLeNet, VGG, and AlexNet, were used to classify and identify the images. Experiments were conducted to evaluate the performance of our method and compare it with existing methods. The experimental results demonstrate that our method has several advantages over existing methods. First, as shown in Table 2, GoogLeNet can achieve a high classification accuracy and recall rate on both the training and test datasets, indicating that our method generalizes well to new data. Second, as shown in Fig. 7, GoogLeNet performs best in terms of accuracy and loss in the training process, indicating that the GoogLeNet model has strong fitting and generalization abilities. Third, as shown in Figs. 8?13, GoogLeNet can obtain high AUC values for machine damage and manual excavation events, can completely and accurately identify manual excavation events, and has a low false-positive rate (2.78%) for machine damage events, which are considered the most critical threats to pipeline safety. This indicates that the proposed method can effectively distinguish between different types of events. Fourth, as shown in Fig. 14, GoogLeNet can achieve optimal classification performance when the SNR is 8 dB, indicating that our method can handle noisy signals well.ConclusionsIn conclusion, this study uses a distributed optical fiber vibration sensing system to collect six types of event signals along a 28.9-kilometer-long natural gas pipeline and transforms them into two-dimensional image information through the GAF transform. It then uses three deep learning models, GoogLeNet, VGG, and AlexNet, to classify and identify the image information and compare the recognition accuracy and false alarm rate of each model. The results show that the GoogLeNet model outperforms the other two models in terms of recognition accuracy and false alarm rate, achieving a recognition accuracy of 97.79% and effectively differentiating between manual excavation and machine excavation events when the system signal-to-noise ratio is greater than 8 dB. It is suitable for the real-time identification of threat events along the pipeline. The method proposed in this paper provides a novel conceptual framework and technical approach for the safety monitoring of long-distance pipelines.
Mar. 10, 2024Vol. 51 Issue 5 0506003 (2024)
Hongxia Liang, Gengxin Zheng, Shaowu Xie, Changsheng Zeng, Yongming Zhong, Yuanyuan Gan, Yongkang Xiong, and Yishi Han
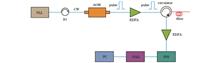
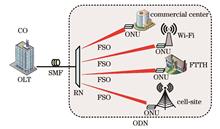
ObjectiveThe traditional passive optical network (PON) architecture faces the problem of difficult fiber deployment. To overcome this problem, free-space optical (FSO) communication technologies have emerged. FSO technology uses a laser as the carrier and an atmospheric channel as the transmission medium, providing a high transmission rate and enabling easy installation. To reduce the construction complexity of PON access systems based on FSO links, wavelength reuse technology is used to realize colorless uplink transmission of the optical network unit (ONU). However, the currently proposed schemes based on devices such as Fabry-Perot laser diodes (FPLDs) and reflective semiconductor optical amplifiers (RSOAs) for wavelength reuse limit the bandwidth of the system. To improve system bandwidth, some scholars have proposed the use of polarization multiplexing technology to realize wavelength reuse, thus entailing the construction of a single light source system. However, system service is singular and cannot meet the diverse needs of users of future broadband access systems. Therefore, researchers have proposed combining multiple services into a single shared infrastructure to enhance system practicality. Nevertheless, these solutions can only achieve one-way multiservice transmission and require complex devices (such as FPLD and RSOA) to achieve colorless ONUs and optical filters to achieve wavelength separation, which severely limits the frequency-adjustment range of the system. In this study, a bidirectional dual-output multiservice transmission system based on an FSO and optical fiber hybrid link is proposed. This system has broad application prospects in broadband wireless communication systems. Under the single-light-source condition, the system can realize the transmission of downlink microwave and millimeter-wave services, as well as the transmission of uplink baseband and microwave services. Simultaneously, the system can be expanded and integrated into a wavelength-division multiplexing (WDM) PON architecture. By simply adjusting the polarizer, the ONU can be made colorless, and a bidirectional dual output can be realized in multiple channels.MethodsIn our proposed scheme, the optical carrier generated by the laser diode is sent to a polarization-division multiplexing Mach-Zehnder modulator (PDM-MZM). The system loads 10 GHz 16PSK and 60 GHz 4QAM-OFDM signals onto the downstream PDM-MZM and combines self-coherent detection and digital signal processing technology at the receiving end to realize the downlink transmission of microwave and millimeter-wave services. The angle between the polarizer and the main axis of the modulator was adjusted to 90° to select the downlink 4QAM-OFDM modulated signal as the optical carrier carrying the uplink signal, rendering the ONU colorless. After the uplink baseband signal and 20 GHz 16QAM microwave signal are transmitted through the FSO and optical fiber hybrid link, polarization separation is realized using a polarization beam splitter, and photoelectric conversion is performed to realize the transmission of the uplink baseband and microwave services.Results and DiscussionsThe error vector magnitude (EVM) values of the 10 GHz downlink 16PSK signal and 60 GHz 4QAM-OFDM signal are 3% and 2.98%, respectively, which are less than those of the 3GPP standard, and the constellation diagrams are clearly identifiable (Fig. 3). The EVM value of the 20 GHz 16QAM signal generated in the uplink wis 2.69%, the bit error rate (BER) of the OOK baseband signal is ≪10-9, and the constellation and eye diagrams are clearly recognizable (Fig. 4). To evaluate the reliability of the system, we analyzed the transmission performance of the system when transmitting different FSO link distances. When the FSO transmission distance is L=2, 3, and 4 km under the corresponding received optical power, the EVM values measured by the 16PSK signal are 4.62%, 5.67%, and 7.58%, respectively, and the EVM values obtained by the 4QAM-OFDM signal are 3.60%, 5.01%, and 6.60%, respectively. The measured EVM is small, indicating that the downlink transmission performance is satisfactory (Fig. 5). The EVM values of the uplink 16QAM signal are 3.41%, 4.39%, and 6.53%, respectively, and when the received optical power is >-17 dBm, the BER of the baseband signal transmission is <10-9, which indicates that the uplink achieves reliable transmission (Fig. 6). In addition, we examined the link performance under dynamic weather conditions. The longest communication distances that FSO links can transmit in clear, low fog, heavy fog, light rain, and heavy rain are 62.0, 4.8, 1.8, 5.6, and 2.7 km, respectively, and the system has certain advantages in various weather environments (Fig. 8).ConclusionsA bidirectional multi-service transmission system that can realize the downlink transmission of microwave services, millimeter-wave services, and the uplink transmission of baseband and microwave services is presented. When downlink transmission is applied, the influence of laser phase fluctuation can be avoided, and high-sensitivity detection can be realized. The system can realize a colorless ONU by simply adjusting the polarizer, and, through the use of polarization multiplexing technology, it can further improve the spectral efficiency after it is integrated into the WDM-PON architecture, and bidirectional dual-output multi-service can be realized in multiple channels. The BER of the uplink OOK baseband signal is <10-9, and the EVM values of the downlink 16PSK 4QAM-OFDM data signals and uplink 16QAM signal are all <3.1%. In addition, the influence of various weather environmental factors and optical fiber transmission loss on the performance of the multi-service transmission system was analyzed, and the results demonstrate the practicability and feasibility of our system.
Mar. 10, 2024Vol. 51 Issue 5 0506004 (2024)
Zhen Zhong, Ningmu Zou, Xuping Zhang, and Meng Li
ObjectiveA phase-optical time domain reflectometer (Φ-OTDR) can quantitatively reflect the external perturbation signal according to the change in extracted phase. Therefore, they have been widely used and actively studied in the fields of perimeter security monitoring, performance monitoring of dredged pipelines, cable partial discharge monitoring, and seismic wave detection. In Φ-OTDR, there are various types of noise, including photoelectric noise of the detector, electronic noise of the data acquisition card, phase noise of the reference light, polarization fading, interference fading. These noises not only affect the signal-to-noise ratio of the detected result, but also induce distortion of the signal waveform. This implies that they degrade the accuracy of the phase signal, thereby affecting the correctness of event discrimination. Moreover, the phase of Φ-OTDR is extracted from its detected intensity or amplitude curve. It implies that the noise of coherent Φ-OTDR is in the form of both amplitude and phase. Given that Φ-OTDR measures the perturbation signal at every sampling position of the fiber, the extracted phase, including the noise, is distributed in the direction of both “fast time axis” and “slow time axis”. Therefore, a three-stage noise suppression method is required to retrieve a more accurate phase signal.MethodsFor obtaining a more accurate measurement result, a dual-layer processing method, which suppresses the noise in the form of both amplitude and phase, was adopted in coherent Φ-OTDR. Furthermore, the noise in the form of phase was suppressed in the direction of both “slow time axis” and “fast time axis”. First, low-pass filters were used to reduce the noise in the form of amplitude separately for the vertical and orthogonal components during the digital orthogonal demodulation process. This enhanced the visibility of the modulus to correctly solve the phase. Then, for the noise in the form of phase, the processing of denoising was performed in the direction of “fast time axis” and “slow time axis”. In the direction of “slow time axis”, the method of wavelet decomposition and reconstruction was used for noise suppression. Based on the characteristic of the linear distribution of phase change in the undisturbed region of the fiber and randomness of noise in coherent Φ-OTDR, the approximate components of phase changes after wavelet decomposition at different sampling positions of the fiber were used for correlation calculation. The number of decomposed layers for wavelet denoising was then automatically determined by the maximum value of the correlation coefficient. This avoided errors due to manual decisions. In the direction of “fast time axis”, according to the linear profile of phase change of each pulse, data fitting with the method of total least squares was performed. Correspondingly, the fitting process effectively reduced noise in the form of a phase.Results and DiscussionsIn the orthogonal demodulation process, low-pass filtering is applied to both the orthogonal and vertical components to suppress noise in the form of amplitude, resulting in a clear visibility of the modulus [Fig.4(c)]. Based on the correlation calculation of the approximate components, obtained via the wavelet decomposition of the phase changes, the highest value of the correlation coefficient is obtained when the number of decomposed layers is four [Fig.5(c) and Fig.5(d)]. Therefore, four is automatically chosen as the decomposition level for subsequent wavelet denoising. Then, the process of wavelet denoising in the direction of “slow time axis” and data fitting in the direction of “fast time axis” are performed. The root mean square error of the sinusoidal waveform of the final extracted phase signal is only 0.17832 rad [Fig.6(d)], which is 23.3% lower than that obtained using the two-stage denoising method without wavelet denoising in the direction of the “slow time axis”. This indicates that the three-stage denoising method with wavelet denoising in the direction of the “slow time axis” achieves more accurate measurements. Additionally, the results of the discussion with respect to the effect of polarization show that in coherent Φ-OTDR using a highly coherent and high-stability frequency laser, the effect of polarization fading on the correct extraction of phase signal can be approximately ignored (Fig.8).ConclusionsIn the process of orthogonal demodulation in coherent Φ-OTDR, the digital low-pass filter is used to reduce the noise in the form of amplitude. Correspondingly, a reference position is selected to retrieve the phase. Then, for the unwrapped phase changes, the method of wavelet decomposition and reconstruction is used to remove the noise in the direction of “slow time axis”. Based on the spatial profile of the phase change and the randomness of noise, the number of decomposed layers of wavelet denoising is obtained via a correlation calculation of the approximate component of the wavelet coefficient. Finally, the data fitting of total least squares for the phase change of each pulse is performed in the direction of “fast time axis” for suppressing the influence of the noise in the form of phase. For the final calculated phase signal, the R-square coefficient and root-mean-square error of fitting with unknown parameters of the sinusoidal function correspond to 0.99996 and 0.17832 rad, respectively. Compared to the results obtained by the data processing method without wavelet denoising, the R-square coefficient increases by 0.00003 and root mean square error decreases by 23.3%. Further studies demonstrate that the phase information obtained using the three-stage denoising method is closer to the true value. Consequently, the newly proposed method is more helpful in achieving an accurate measurement in coherent Φ-OTDR.
Mar. 10, 2024Vol. 51 Issue 5 0506005 (2024)
Yiquan Wu, Huixian Chen, and Yao Zhang
SignificanceWith the continuous development of three-dimensional (3D) acquisition equipment such as 3D Lidar, 3D point cloud data has recently become more accurate and easier to obtain. As the most important representation of 3D data, 3D point cloud is widely used in visual tasks in the fields of autonomous driving, robotics, remote sensing, cultural relic restoration, augmented reality, and virtual reality, among others. Owing to the large amount of original point cloud data and the fact that the acquisition process is easily mixed with noise and outliers, the direct use of the original point cloud data is not effective. Therefore, it is critical to study the processing methods for 3D point clouds.A point cloud is a collection of spatial sampling points of the target surface properties in the same coordinate system. The sampling points contain geometric information such as the 3D coordinates and size, as well as characteristic information such as the object color and texture features. Traditional 3D point cloud processing methods are based on geometric analyses. Point cloud data are processed by estimating the geometric information such as the normal vector, curvature, and density of the point cloud, and by combining traditional feature descriptors. Although its accuracy is high, it is not suitable for complex point cloud scenes such as large rotations, and the calculation function is extremely cumbersome. Classical machine-learning methods can process 3D data and learn effective feature information; however, machine learning is highly dependent on accurate manual identification features. Massive 3D data not only increase the number of manual labels but also make labeling significantly more difficult than two-dimensional (2D) images. Deep learning methods can train and calculate large-scale data, autonomously learn latent-space features and advanced laws in the input information, and are suitable for processing massive amounts of point cloud data. Although deep learning methods require a considerable time for training the samples to learn the parameter information, the test time is significantly shorter than that of machine learning methods, and the prediction results are more accurate. Considering the irregular, sparse, and uneven internal structure of 3D point clouds, the efficient implementation of 3D point cloud processing based on deep learning has recently become the focus of researchers.Therefore, this study reviews the research progress of deep learning-based 3D point cloud processing methods over the past six years and presents the future research trends, aiming to provide inspiration and ideas for researchers in point cloud processing.ProgressIn this study, we focus on deep learning-based 3D point cloud processing tasks and provide a development route for the most commonly used deep learning methods for four point cloud processing tasks over the past six years (Fig.1). The 3D point cloud mainly includes the following four types of processing tasks: 1) denoising and filtering, 2) compression, 3) super-resolution, and 4) restoration, completion, and reconstruction.Deep learning methods for point cloud denoising and filtering tasks can be classified into the following five types: CNN-based, upsampling-based, filter-based, gradient-based, and others. PointProNet and GeoGCN learn feature differences based on convolutional networks to remove noise; however, point cloud information is lost during the preprocessing stage. DUP-Net, PUGeo-Net, and PU-GACNet are classic upsampling-based denoising methods that denoise by modifying the feature extractor and feature expander while ignoring certain local features. NPD and PointCleanNet combine filtering ideas with deep learning and can simultaneously achieve noise removal and point cloud geometric feature retention. The Score-based method constructs a gradient field according to the distribution characteristics of the noise point cloud, and the robustness is enhanced; however, relatively few studies have been conducted. NoiseTrans draws on the idea of a Transformer to achieve the effective extraction and retention of fine features in point clouds. Table 2 presents a comparison of the advantages and disadvantages of the common methods.Deep learning methods for point cloud compression tasks are generalized. According to lossless and lossy compression, they are divided into two categories and analyzed (Tables 3 and 4). The point cloud lossless compression methods, OctSqueeze and VoxelDNN, improve the accuracy of point cloud probability prediction; however, part of the point cloud information is lost. PCGCv2, TransPCC, and SparsePCGC are the typical point cloud lossy compression methods. The point cloud feature is learned through a network structure, which prevents the loss of detailed information and improves the quality of the reconstructed point cloud.Subsequently, deep-learning methods for point cloud super-resolution tasks are outlined. Classification and comparative analyses are performed for the following four methods: convolutional neural network (CNN), graph convolutional neural network (GCN), generative adversarial network (GAN), and other structures (Table 5). PU-Net and PU-GCN extract rich detailed features based on CNN and GCN, respectively; however, numerous calculations are required. PU-GAN exploits the dynamic adversarial optimization details of the generator and discriminator. MPU and PU-Transformers combine the idea of a 2D super-resolution algorithm with the PointNet structure, which is a new idea worth trying.The deep learning methods for point cloud restoration, completion, and reconstruction tasks include three aspects, which are image-based, sampling-based, and completion-based, for which a comparative analysis is performed (Table 6). PCDNet reduces the number of computations by extracting 2D image features and deformations. Sampling-based methods use networks to generate dense and complete point clouds. PCN, TopNet, and SA-Net can fill in missing structures with input point clouds; however, completion-based methods are susceptible to incomplete point clouds.Recently, KITTI, PCN, nuScenes, and other public point cloud datasets and performance indicators, such as CD, P2M, and RMSE, have significantly promoted the in-depth research of point cloud processing tasks (Tables 7 and 8).Conclusions and Prospects3D point cloud processing methods based on deep learning have gradually become an important research direction in the field of computer vision. Although several positive achievements have been made, there is significant room for further development. The following aspects should be considered when conducting in-depth research: the combination of multiple processing tasks, point cloud data feature processing, low-cost network models and hardware devices, and adaptable datasets.
Mar. 10, 2024Vol. 51 Issue 5 0509001 (2024)
Zhaoyang Man, Can Cui, Yulei Wang, Fuhan Liu, Yindong Li, Zhenxu Bai, and Lü Zhiwei
ObjectiveEnd-pumped lasers offer the advantages of high efficiency, good beam quality, and compact structure. However, the exponential decay of pump absorption along the longitudinal direction in commonly used conventional uniformly-doped crystals, produces a large temperature gradient, which leads to a series of thermal problems such as severe thermal lensing effects and end-face deformation, inevitably leading to the deterioration of laser performance. In addition, the thermal stress restricts the pump power limit, beyond which thermal stress leads to crystal damage. Currently, many researchers use gradiently-doped crystals to improve the thermal effect and reduce the temperature gradient. Gradiently-doped crystals are simple in structure, and yet improve the pumping limit with excellent performance in high-power pumping; however, the different concentration distributions of gradiently-doped crystals cause the mode-matching to differ from that of traditional uniformly-doped crystals. Therefore, maximizing the advantages of the gradiently-doped crystal is still a difficult problem. At present, research on the mode-matching of gradiently-doped crystals is lacking. Consequently, studying the mode-matching problem in end-pumped gradiently-doped crystal lasers is of great significance.MethodsIn this study, the effects of pump beam waist radius, beam quality factor (M2) value, and waist position on the mode-matching efficiencies of gradiently-doped and uniformly-doped crystal lasers are theoretically calculated. Subsequently, the effect of pump beam waist position on mode-matching of gradiently-doped crystal lasers is experimentally investigated by changing the pump beam waist position when the radius is 0.4 mm and 0.5 mm, respectively. Finally, the crystals are placed at the center of the resonant cavity and at a position close to the input mirror, with pump beam waist radius of 0.5 mm and beam waist position close to the pump input face of the crystals, to study the performance of gradiently-doped and uniformly-doped crystals under high-power pumping conditions, thereby verifying the excellent performance of the gradiently-doped crystals under high-power pumping conditions with identical pumping optical parameters.Results and DiscussionsThe effects of waist radius, waist position, and M2 value of the pump beam on the mode-matching efficiency of gradiently-doped crystals are theoretically calculated (Fig. 5). The effects of the waist position of the pump beam on gradiently-doped and uniformly-doped crystals are compared and analyzed through experiments (Fig. 10). The influence of the position of the pump beam waist on the two kinds of crystals is analyzed using the temperature distributions of the crystals with the pump beam waist at different positions (Fig. 11). Gradiently-doped crystals exhibit more stable mode matching and are less susceptible to pumping optical parameters. The output characteristics of the crystals under high-power pumping conditions are investigated for crystals located at the center of the resonant cavity and close to the input mirror. The output power of the gradiently-doped crystal increases by 4.67% and 11.84% at the two positions, respectively. Thus, it is concluded that gradiently-doped crystals display excellent performance under high-power pumping (Figs. 12 and 13).ConclusionsIn this study, the mode-matching efficiencies of the end-pumped laser with uniformly-doped and gradiently-doped crystals are examined theoretically and optimized experimentally. First, the influence of the waist radius, M2 value, and waist position in the oscillator of the Gaussian-distributed pump beam on the mode-matching efficiency is analyzed through numerical simulations. Considering the variations of the three parameters, it is demonstrated that the gradiently-doped crystal laser exhibits a more stable and greater mode matching efficiency than the uniformly-doped crystal for a pump waist radius of 0.5 mm and M2 values of 10 and 50. Specifically, the influence of the waist position of the pump beam on mode-matching efficiency is studied through experiments. Through the comparison of the laser output power for pump beam waists located at different positions, it is shown that the mode matching efficiency suffers less from fluctuations in gradiently-doped crystals than uniformly-doped ones, which agrees well with the theoretical analysis. Under the condition of pump power reaching over 70 W, the gradiently-doped laser has a maximum output power of 44.8 W with the laser crystal set in the middle of the oscillator, which is 4.67% greater than that of the uniformly-doped one. For the laser crystal close to the input mirror, the gradiently-doped laser output power reaches 34.0 W, which is 11.84% greater than that of the uniformly doped laser. Therefore, it is concluded that the gradiently-doped crystal has excellent performance for high-power pumping laser systems.
Mar. 10, 2024Vol. 51 Issue 5 0501001 (2024)
Wangcheng Gao, Rui Ma, Xin Quan, Yu Chen, Dianyuan Fan, and Jun Liu
ObjectiveHigh-power laser sources operating in 2-μm band are gaining traction due to their diverse applications, including laser scalpels, plastic welding, and free-space laser communication. Over the past decade, random fiber lasers (RFLs) have emerged as a focal point of interest. These lasers utilize randomly distributed Rayleigh scattering and nonlinear amplification, distinguishing them from traditional resonant cavity lasers. The defining features of RFLs are their open cavity structure and incoherent feedback, which result in modeless lasing and significant suppression of temporal dynamics. However, research on RFLs has primarily concentrated on the near-infrared band, specifically around 1.1 μm and 1.5 μm, due to challenges such as significant transmission loss and weaker Rayleigh scattering in mid-infrared silica-based optical fibers. Historically, RFLs in the mid-infrared band have only realized low power outputs. In this study, we introduce a high-power RFL operating at 2 μm, utilizing the master oscillator power amplifier (MOPA) approach. Impressively, we realize a peak power of 100.40 W with an efficiency slope of 47.8% and a narrow 3 dB spectral width of approximately 0.2 nm.MethodsFigure 1 depicts the experimental arrangement for a high-powered RFL using the MOPA design. The seed consists of a 793-nm laser diode (LD), a (2+1)×1 pump combiner, a 2.4-m long thulium-doped fiber, a 1980-nm FBG, a 200-m single-mode fiber (SMF), and an isolator (ISO). The 1980-nm FBG serves as a point reflector, selecting the wavelength and providing optical feedback, in tandem with the Rayleigh scattering in the extended SMF. An isolator at the SMF end prevents unwanted light reflection. The preamplifier stage consists of a 793-nm LD, (2+1)×1 pump combiner, a 2.4-m thulium-doped fiber, and an isolator. Its role is to enhance the seed laser output power to a specified threshold. Inserting a mode-field adaptor (MFA) between the preamplifier and main amplifier minimizes insertion loss due to mode mismatch among different fibers. The main amplifier takes the laser signal from the MFA and amplifies it using a (6+1)×1 combiner and 4.7-m long large-mode-area thulium-doped fiber (LMA-TDF). This configuration facilitates a lasing output in the 100-W range, powered by two 793-nm high-intensity LDs. To remove residual pump light, a cladding power stripper (CPS) is integrated at the LMA-TDF terminal. Its endpoint is oriented to counter unintended feedback from the Fresnel reflection. Lastly, all gain fibers are positioned on a water-cooled plate for thermal efficiency. In the main amplifier stage, these fibers are coiled to approximately 10 cm in diameter, mitigating high-order transverse modes.Results and DiscussionsThe RFL seeds exhibit superior lasing characteristics, which encompass a narrow spectral linewidth and exceptional temporal stability. The threshold pump power for the seed source is determined as approximately 3.57 W, with a slope efficiency of 13.6%. The standard deviation divided by the mean value (A) stands at 0.0265 with a maximum pump power of 7.40 W. This is primarily attributed to the half-opened, non-resonant structure of the seed, in contrast to a resonant cavity (Fig.2). The preamplifier stage further boosts the output power. At a pump power of 8.96 W, the maximum output power from the preamplifier stage is 3.09 W, having a slope efficiency of 35.6%. Importantly, the output spectrum of the preamplifier stage retains its narrow linewidth feature. This is a benefit of the spectral-broading-free characteristic when the random fiber laser serves as the seed in the MOPA configuration (Fig.3). In the main amplification stage, a hundred-watt-level mid-infrared lasing output materializes. With a pump power of 215.7 W, the maximum output power corresponds to 100.40 W and demonstrates a slope efficiency of 47.8%. No decline in the output power is evident, and potential for further power enhancement is predominantly constrained by laboratory cooling conditions and available pump sources (Fig.4). Notably, the output spectrum of the main amplification stage also upholds a narrow linewidth, which benefits from the unique spectral broadening-free attribute of the power amplification process founded on a half-open-cavity seed. The RFL seed output power showcases extremely minimal power fluctuations, leading to suppressed nonlinear effects. Moreover, the inclusion of a large-mode-field gain fiber in the main amplification stage aids in curtailing nonlinear effects. There is no evident spectral broadening as the output power increases from 10.33 W to 100.40 W in terms of 3 dB and 10 dB bandwidths. The 3 dB spectral bandwidth at an output power of 100.40 W is approximately 0.2 nm (Fig.5). The final laser output also demonstrates remarkable stability in short and long durations. This stability arises from the suppressed temporal dynamics induced by the incoherent feedback process via randomly distributed Rayleigh scattering. The A value decreases from 0.1419 to 0.0319 as the output power increases from 20.00 W to 100.40 W (Fig.6). Furthermore, the output power fluctuation at approximately 72 W, in terms of the A value over a 30-min interval, is only 0.0048 (Fig.7).ConclusionsIn this study, a high-power RFL in 2-μm band is realized using the MOPA configuration. Due to the distinctive properties of the random laser, a lasing output with a remarkably narrow linewidth (approximately 0.2 nm) is obtained. The short-term domain dynamics and long-term power fluctuations of the lasing display excellent stability. This study offers a compelling alternative for crafting a high-performance random laser source in 2-μm band.
Mar. 10, 2024Vol. 51 Issue 5 0501002 (2024)
Quan Sheng, Jingni Geng, Jinhui Li, Shijie Fu, Wei Shi, and Jianquan Yao
ObjectiveStimulated Raman scattering (SRS) in the crystalline Raman gain media is a well-established technique for extending the spectral coverage of lasers. However, as a third-order nonlinear process, the SRS suffers a relatively low nonlinear gain and consequently has a high threshold, specifically when operating in a continuous-wave (CW) scheme. The intra-cavity pump scheme, in which the Raman crystal is located within the fundamental laser cavity, is an effective alternative to achieve efficient CW Raman output with moderate primary pump power because the high circulating fundamental laser power in the cavity generates sufficient Raman gain. To date, the highest CW Stokes output power of end-pumped intra-cavity Raman lasers has been realized with the self-Raman scheme, in which the processes of lasing and SRS take place in one crystal to minimize insertion losses. However, intra-cavity Raman lasers with separate lasers and Raman gain media have the advantages of a more flexible output wavelength and distributed thermal load, which are helpful for power scaling. This study presents an efficient CW Nd∶YVO4/KGW intra-cavity Raman laser. The output power of the CW Stokes wave at 1177 nm reaches 6.63 W under an incident laser diode (LD) pump power of 36.6 W, with the corresponding optical efficiency being 18.1%.MethodsThe experimental setup of the CW intra-cavity Raman laser is shown in Fig. 1. A 15 mm long a-cut Nd∶YVO4 crystal and a 20 mm long Np-cut KGW crystal serve as the fundamental laser and Raman gain media, respectively. The LD pump wavelength is 878.6 nm, and the pump beam radius at the laser crystal is 280 μm. The Nd∶YVO4 crystal has a low doping atomic fraction of 0.2% to alleviate the thermal effect. The 1064 nm fundamental laser cavity is defined by a flat highly reflective (HR) mirror (M1) and a curved HR mirror (M2) with a radius of curvature of 100 mm. The M2 also has a transmissivity of 0.4% at a Stokes wavelength of 1177 nm. A flat dichroic mirror (M3) with HR coating at 1.15-1.18 μm and highly transmissive at 1064 nm is inserted into the cavity to make the Raman Stokes cavity with M2. The lengths of the fundamental and Stokes cavities are 50 mm and 22 mm, respectively.Results and DiscussionsFirst, the polarization direction of the linearly polarized fundamental frequency light generated by Nd∶YVO4 is parallel to the Nm axis of the KGW crystal (E∥Nm). With this polarization, the Raman gain coefficient of the 901 cm-1 Raman line is over two times larger than that of the 768 cm-1 Raman line. The Stokes output power as a function of incident LD pump power is shown in Fig. 2. The SRS threshold is 7.5 W LD power, and the maximum Stokes output power reaches 6.63 W under the maximum pump power of 36.6 W. Only the first Stokes field at 1177.3 nm is observed during the entire process. The spectral linewidths of the fundamental laser and Stokes wave are 0.08 nm and 0.02 nm at the SRS threshold and are broadened to 0.3 nm and 0.2 nm, respectively, at the maximum power, as shown in Fig. 3. Because of the astigmatic thermal lens in the KGW crystal, the Stokes output beam profile becomes the Hermite-Gaussian (HG) mode at the maximum power, as shown in Fig. 4. We also attempt fundamental polarization parallel to the Ng axis of the KGW crystal. In this case, the laser output power and conversion efficiency are lower than those for E∥Ng. The Stokes output power under the same maximum pump power of 36.6 W is only 4.86 W. We find that the output wavelength contains both 1159 nm and 1177 nm components, which correspond to the 768 cm-1 and 901 cm-1 Raman shifts, respectively, when the pump power exceeds the SRS threshold of 7.5 W. The cascaded Raman Stokes light at 1171 nm and 1189 nm corresponded to the 89 cm-1 Raman shift also occurs at higher pump power, as shown in Fig. 5. The multiline Stokes field decreases the effective Raman gain, whereas the cascaded Raman conversion decreases the interaction between the fundamental Stokes fields. Therefore, the E∥Nm arrangement, in which the 901 cm-1 Raman shift dominates, is more suitable for efficiently generating high-power Stokes outputs with high spectral purity.ConclusionsIn conclusion, we present an efficient CW Nd∶YVO4/KGW intra-cavity Raman laser. The effects of the fundamental laser polarization direction on the power, spectral mode, and transverse mode of the KGW Raman laser are investigated experimentally. When the fundamental polarization distribution is parallel to the Nm axis of the Np-cut KGW crystal, the laser benefits from a higher Raman gain at 901 cm-1 Raman shift. The 6.63 W CW Stokes output at 1177.3 nm is obtained under an incident LD pump power of 36.6 W, with corresponding optical and slope efficiencies of 18.1% and 24.7%, respectively.
Mar. 10, 2024Vol. 51 Issue 5 0501003 (2024)
Subinuer Yakufu, Yuxia Zhou, Chuang Xuan, Jianqiang Ye, Mailikeguli Aihemaiti, Xiazhuo Jiao, and Taximaiti Yusufu
ObjectiveOptical vortex lasers, with good beam quality in the mid-infrared spectral region, has many interesting applications such as super-resolution molecular absorption microscopy and molecular spectroscopy. The optical parametric oscillator (OPO) has been established as the most direct method to change the wavelength and transition the orbital angular momentum (OAM) of an optical vortex pump beam. A single-idler resonant cavity can produce a high-quality mid-infrared vortex output. However, one of the main challenges has been to manage the transfer of OAM from the pump beam to the mid-infrared idler output, especially given the significant wavelength difference—over three times—between the 1 μm pump and 3.5 μm idler beam. This discrepancy complicates achieving high spatial overlap efficiency between the pump and idler vortex modes in the optical vortex pumped idler-resonant parametric oscillator. By choosing cavity mirrors with the correct radius of curvature, a half-symmetric OPO system can facilitate the transfer of the pump beam's OAM to the idler output, ultimately producing a high-quality mid-infrared vortex beam.MethodsIn the paper, the idler single resonant optical vortex parametric oscillator based on KTA was examined. A conventional flash-lamped Q-switched Nd∶YAG laser (with a Gaussian spatial form, pulse duration of 25 ns, wavelength of 1.064 μm, and pulse repetition frequency of 50 Hz) was employed as the pump source. The laser output was converted into a first-order optical vortex beam using a spiral phase plate. This beam was then focused into a non-critically phase-matched KTA crystal with dimension of 5 mm×5 mm×30 mm. A plane-parallel cavity was formed using M1, which had high transmission for the pump and high reflection for the idler output beam, and an OC that had high transmission for the pump and signal beams, and a partial reflectivity (80%) for the 3.5 μm (idler) beam. A plane-concave cavity was created using a plane-concave M2 (with a curvature radius of 500 mm) that was anti-reflection coated for the pump field and high-reflection coated for the idler beam. An OC, which was partially reflective (R=80%) for the idler field and high-transmitting for the pump and signal fields, was used. The pump beam was observed using a conventional CCD camera. The spatial forms and wavefronts of the signal and idler outputs were measured with a pyroelectric camera (Spiricon Pyrocam III; with a spatial resolution of 75 μm). A lateral shear interferometer with a Mach-Zehnder geometry was used, allowing the optical vortex output to interfere with its own copy, given a proper lateral displacement.Results and DiscussionsBy using an input mirror with an appropriate radius of curvature and a flat output mirror, plane-parallel and plane-concave cavities are established, respectively. This setup enables the selective transfer of the pump beam's orbital angular momentum to either the signal or idler outputs. The plane-concave cavity produces a high-quality mid-infrared vortex beam with M2 factors of 2.1 and 2.2 in the two orthogonal directions, as shown in Fig. 4. We achieve 0.82 mJ of 3.468 μm mid-infrared vortex output and 3.04 mJ of 1.535 μm near-infrared vortex output, with a maximum pump energy of 20.6 mJ. This corresponds to slope efficiencies of 28.21% and 7.62%, as depicted in Fig. 5. The transfer principle of OAM is theoretically elucidated by considering the spatial overlap efficiency between pump and idler fields in the two cavities. The spectral bandwidths (FWHM) of the signal and idler outputs are measured as Δλs=0.85 nm and Δλi=1.08 nm (Fig. 3), respectively.ConclusionsTo produce high beam quality and high energy vortex laser in the near/mid-infrared band, an idler-resonant mid-infrared optical vortex parametric oscillator, formed by a 1 μm optical vortex pumped KTA, is constructed. We obtain 0.82 mJ of 3.468 μm mid-infrared vortex output and 3.04 mJ of 1.535 μm near-infrared vortex output at the maximum pump energy of 20.6 mJ, corresponding to a slope efficiency of 28.21% and 7.62%, respectively. With appropriate radius curvature of the cavity mirrors, the plane-concave OPO system enables the OAM of the pump beam transfer to the idler output, and it delivers high beam quality mid-infrared vortex beam. Combined with the advantages of the idler single resonant optical vortex parametric oscillator, the beam quality factors of mid-infrared idler beam in the horizontal and vertical directions are Mx2≈2.1 and My2≈2.2, respectively, and the spectral bandwidths of near/mid-infrared vortex are Δλs=0.85 nm andΔλi=1.08 nm, respectively.
Mar. 10, 2024Vol. 51 Issue 5 0501004 (2024)
Hao Li, Baolai Yang, Binyu Rao, Xinyu Ye, Xin Tian, Meng Wang, Baiyi Wu, Rong Zhao, Zhixian Li, Zilun Chen, Hu Xiao, Pengfei Ma, Zefeng Wang, and Jinbao Chen
ObjectiveHigh-power fiber oscillators have significant applications in industrial processing and other fields. Fiber Bragg gratings (FBGs) are key components of high-power fiber oscillators. On the one hand, FBGs can act as cavity mirrors of high-power fiber oscillators to select a signal wavelength and couple output signal power. On the other hand, FBGs with special designs such as chirped and tilted fiber Bragg gratings (CTFBGs) can be used to suppress stimulated Raman scattering (SRS) in high-power fiber oscillators. Generally, the traditional approach for fabricating these two types of FBGs is the ultraviolet laser (UV) phase-mask method. However, hydrogen-loaded and thermally annealed treatments are required. When annealing is not thorough, the residual hydrogen and hydroxyl groups in the FBGs will absorb lasers to generate heat, which is the main factor limiting the power FBGs can withstand. To date, the maximum handling powers of mirror FBGs and CTFBGs written using UV lasers are 8.0 kW and 4.3 kW, respectively. The development of femtosecond laser inscription technology provides a promising new method for the inscription of FBGs. FBGs can be directly inscribed into fibers without hydrogen loading. Thus, the heating generated by the hydrogen and hydroxyl groups in FBGs can be avoided. Currently, the handling power of a CTFBG written using femtosecond lasers exceeds 10 kW. However, the maximum output power of the all-fiber oscillator based on femtosecond-laser-written FBGs is 8 kW due to the limitations of transverse mode instability (TMI).MethodsFBGs and CTFBGs used in cavity mirrors are written using the femtosecond-laser phase-mask method. Figure 1(a) shows the reflection spectra of the high-reflectivity FBG (HR FBG) and low-reflectivity FBG (LR FBG). The 3-dB bandwidths of the HR FBG and LR FBG are 4.0 nm and 2.1 nm with reflectivities of more than 99% and approximately 6%, respectively. Figure 1(b) shows the CTFBG spectrum. The central wavelength of the transmission spectrum is 1135 nm with a 3-dB bandwidth of approximately 18 nm and maximum depth of 15 dB. Figure 2 shows the setup of the fiber oscillator. The oscillator employs a counter-pumping scheme with an active 30 μm /600 μm ytterbium-doped fiber (YDF) and pump source of 969 nm+982 nm dual-wavelength diode laser (LD). The dashed box in Fig.2 indicates the CTFBG, which is inscribed on the side of the LR FBG and located in the resonator to ensure the oscillator system is compact and stable.Results and DiscussionsFigure 3(a) shows the output spectra at maximum output powers. Due to the suppression of SRS by the CTFBG, the Raman light intensity at 1135 nm decreases by approximately 16 dB. In addition, the TMI threshold of the oscillator increases from 8250 W to 8700 W with the CTFBG, as shown in Fig.3(b). Figure 3(c) shows the changes in the output power. The slope efficiency decreases from 85.4% to 83.4% with the CTFBG. Therefore, the insertion loss of the CTFBG is approximately 2%. Despite the decrease in slope efficiency, the output power increases from 8910 W to 9050 W due to the suppression of the SRS and the increase in the TMI threshold.ConclusionsThis study demonstrates an all-fiber oscillator with maximum output power. An all-fiber oscillator is constructed based on femtosecond-laser-written FBGs, and femtosecond-laser-written CTFBGs are used to suppress the SRS, ultimately achieving a 9-kW laser power output.
Mar. 10, 2024Vol. 51 Issue 5 0515001 (2024)
Yanru Tang, Renjie Jiang, Xuezhuan Yi, Shengming Zhou, and Yan Sun
ObjectiveCe∶Y3Al5O12 and Al2O3 composite phosphor ceramics (Ce∶YAG-Al2O3) exhibit high thermal conductivity, excellent thermal stability, high phosphor conversion efficiency, and high luminescence quenching power. Hence, they are considered as the most suitable candidate for high-power excitation and are widely used in traffic signal displays, street lighting, car lighting, home lighting, stadium lighting, liquid crystal display backlights, and full-color displays. The luminescence mechanism and preparation process of Ce∶YAG-Al2O3 composite phosphor ceramics have been extensively studied. However, there is a paucity of studies on the cutting process and packaging technology of phosphor ceramics, which are crucial for the performance of lighting devices comprising blue light emitting diodes/ laser diodes (LEDs/LDs) and phosphor ceramics. Therefore, this study focusses on Ce∶YAG-Al2O3 composite phosphor ceramic and systematically examines the effect of thickness and roughness on the luminescent properties of phosphor ceramics.MethodsBlue LED chips were used to excite the Ce∶YAG-Al2O3 composite phosphor ceramic in transmission mode. Furthermore, the Ce∶YAG-Al2O3 composite phosphor ceramic was cut into 13-mm diameter discs with a laser and polished with boron carbide polishing powder. The effect of the annealing treatment on the luminescence performance of the phosphor ceramic and the variation in the luminescence performance of the phosphor ceramics with different thickness and surface roughness values were systematically examined. Furthermore, different surface roughness values for the blue light incident surface and light-emitting surface were formed using different types of boron carbide polishing powder, which were used to explore the mechanism of the influence of surface roughness on luminescence performance. The photoluminescence (PL) spectra and optoelectronic data of the phosphor ceramic were obtained using a high-precision rapid spectroradiometer equipped with an integrating sphere. The results provide valuable reference for the cutting process and packaging technology of phosphor ceramics.Results and DiscussionsThe results show that annealing can significantly improve the luminescence performance of phosphor ceramics owing to the removal of surface impurities. As the thickness of the phosphor ceramics increases, the intensity ratio of transmitted blue light to yellow-green light emitted by the phosphor ceramics decreases, the color temperature decreases, and the luminescence efficiency increases. Increasing the surface roughness of ceramics can significantly improve the luminous efficiencies of phosphor ceramics. However, the roughness of the blue light incident surface or the light-emitting surface alone slightly affects the luminescent performance of Ce∶YAG-Al2O3 composite phosphor ceramics. Therefore, the influence of roughness on the luminescence performance emerges from multiple factors, including the roughness of the blue light incident surface and the photoluminescence quantum efficiency of Ce∶YAG-Al2O3 composite phosphor ceramics. The test results indicate that the phosphor ceramic sample exhibits the low roughness for the blue light incident surface and high roughness for the light-emitting surface, which is beneficial for reducing the color temperature of the phosphor ceramic and improving its luminous efficiency.ConclusionsThickness and surface roughness can be used to adjust the luminescence performance of phosphor ceramics. Increasing the thickness of the phosphor ceramic results in an increase in the amount of yellow-green light relative to blue light in the PL spectra of the phosphor ceramic, a decrease in the color temperature, and an increase in the luminous efficiency. Inducing surface roughness can significantly improve the performance of high-power white LEDs based on phosphoric ceramics. Furthermore, annealing has a positive effect on the luminescence properties of phosphor ceramics. These results lay a foundation for the development of high-power light devices based on Ce∶YAG-Al2O3 composite phosphor ceramics.
Mar. 10, 2024Vol. 51 Issue 5 0503001 (2024)
Xiaoli Zhang, Chenghao He, Xiujuan Feng, Hui Zhang, Feng Niu, and Longbiao He
ObjectiveAir-coupled ultrasonic transducers offer unique advantages such as non-contact testing, adaptability to complex working conditions, and in situ testing. They are widely used in areas such as ultrasonic ranging, radar, flow meters, and nondestructive testing. Sound field reconstruction holds importance for characterizing the sound field parameters of air-coupled ultrasonic transducers, including beam width and diffusion angle, ensuring the transverse resolution and positioning accuracy of the ultrasonic testing system. The laser method, drawing on the acousto-optic effect, exhibits advantages such as a narrow laser beam, high spatial resolution, extensive frequency range, high sensitivity, and a non-invasive sound field. This makes it an ideal approach for sound field reconstruction. Achieving optimal spatial resolution and superior imaging quality remains pivotal when using laser tomography for sound field reconstruction. Typically, improving the imaging quality involves reducing the translation and rotation step spacing (often to less than half the sound wavelength) to secure more comprehensive sound pressure path data. Given the short wavelength of ultrasonic transducers, the scanning efficiency of ultrasound field reconstruction decreases considerably. This study, therefore, centers on the sound field reconstruction of air-coupled ultrasonic transducers within the 50?200 kHz frequency range and seeks to optimize the scanning parameters. The goal is to enhance scanning efficiency while maintaining the quality of the reconstructed sound field image. We aim for our fundamental strategy and insights to aid in the realization of ultrasound field reconstruction and the enhancement of scanning efficiency via laser tomography.MethodsThis study investigated the sound field reconstruction of air-coupled ultrasonic transducers at frequencies of 50?200 kHz based on acousto-optic effects and tomography technology. The spatial resolution of the sound field was optimized through simulations and experiments. Initially, a model was established to simulate the reconstruction effect under various scanning parameters. By exploring the rules and analyzing the outcomes from the perspective of measurement principles and algorithms, optimized scanning parameters were determined. Subsequently, a two-dimensional sound field scanning system was constructed, and a laser Doppler vibrometer (LDV) was employed to measure the integration of the sound pressure along the path. Employing the classic reconstruction algorithm of tomography technology, the filtered back projection (FBP) algorithm, sound field reconstruction of the air-coupled transducer perpendicular to the sound axis direction was completed, and the simulation results were validated. The reliability of acousto-optic effect tomography for ultrasound field reconstruction was confirmed by comparing the reconstruction outcomes of the sound field with the measurement findings from the microphone method.Results and DiscussionsThe translation and rotation step spacings have different effects on the quality of the reconstructed sound field image. When the rotational step spacing remains unchanged, a smaller translation step spacing results in a higher-resolution reconstructed image. The rotation spacing primarily affects the generation of image artifacts (Fig. 4). As the frequency increases, reducing the translation step spacing weakens its impact on improving the quality of the reconstructed images. The range of the sound-field scanning parameters can expand, and selecting the optimized sound-field scanning parameters can increase the scanning efficiency by 2?4 times (Tables 1,2). Laser tomography allows for the capture of sound pressure amplitudes and radial sound pressure distributions similar to those of the microphone method, verifying the reliability of the LDV for sound field reconstruction (Fig. 8). Experiments yield the reconstructed sound field images of the air-coupled ultrasonic transducer under various resolutions, which show strong consistency with the simulation results (Figs. 9 and 10). To compute parameters, such as sound power or sound intensity, fine sound field scanning parameters are essential. For parameters, such as the beam width and diffusion angle, only a high resolution in the central area of the image is necessary, and the requirement for rotation step spacing diminishes. If artifacts appear unexpectedly in the sound field image, then optimal combination parameters exist for the translation and rotation step spacing.ConclusionsThis article investigates the ultrasound field reconstruction of the cross section perpendicular to the acoustic axis of air-coupled ultrasonic transducers at frequencies of 50?200 kHz, drawing on the acousto-optic effect and laser tomography method. Initially, a simulation provides the original sound field distribution of the ultrasonic transducer, considering air attenuation. Radon and inverse Radon transforms simulate the reconstructed sound field images under various scanning parameters, from which optimization strategies for the sound field scanning parameters emerge. This optimization enhances scanning efficiency by 2?4 times while preserving the quality of the reconstructed sound field image. For experimental verification, a measurement system is constructed. The accuracy of laser tomography for ultrasound field reconstruction is first validated by comparing measurement results to those from the microphone method. Following this, acoustic field reconstruction images of the air-coupled ultrasonic transducer at different scanning parameters are experimentally acquired, showcasing strong alignment with simulation outcomes. This research offers an efficient methodology for optimizing the scanning parameters of the ultrasound field based on acousto-optic tomography imaging, holding significant guidance for ultrasound field reconstruction.
Mar. 10, 2024Vol. 51 Issue 5 0504001 (2024)
Maosheng Hou, Kun Wu, Hongtao Zhang, Chongke Gu, and Jie Duan
ObjectiveA laser scanning projector can deflect a laser beam quickly and accurately, and the path of the laser spot can be shaped into a pattern, thereby facilitating processing and assembly. To ensure the precise calibration of the projection system, several cooperative targets should be scanned to solve the coordinate transformation equations between the world and projector frames. Typically, two calibration methods are employed: One involves manipulation of the laser to scan the cooperative target area, identify points on the edge of the target, and determine the center of the circle through least-squares fitting. This approach requires numerous scanning points, leading to an ineffective calibration process. The alternative approach utilizes binocular cameras for simultaneous multipoint positioning, which results in a reduced calibration time. However, identifying cooperative targets requires significant arithmetic resources. In addition, limited by the performance of the camera, this method is restricted to the calibration distance, and its ability to adapt to ambient light is poor. The correlated double-sampling (CDS) technique can be adopted to enhance the anti-interference ability of the system. Furthermore, a discontinuous scanning method based on the bisection principle is proposed. This technique can precisely identify the boundaries of cooperative targets as well as considerably reduce the number of scanning points, thereby guaranteeing the precision of cooperative target localization.MethodsCDS was investigated to realize band-pass filtering and enhance the adaptability of the detection system to ambient light. Subsequently, an integral sampling circuit was designed to reduce the effects of high-frequency noise. The silicon photodiode operates in a zero-bias state and can produce an output signal proportional to the incident light intensity. According to the abovementioned features, a change in the signal light can be detected under different lighting conditions. TINA-TI was used for circuit simulation (Fig.3), and a circuit prototype (Fig.5) was constructed to verify the performance of the detection module. The control program is written to a 32 bit microcontroller to realize integrated functions, such as the output of control signals, signal acquisition, and information transmission. The designed printed circuit board was placed in the light-exit window of a laser scanning projector (Fig. 9). When the scanning point is within the high-reflection area of the target, the CDS module can stably detect the reflected signal. According to this feature, a scanning method based on the bisection principle was proposed (Fig.13). This can improve the positioning speed and accuracy of the scanning projection systems for target detection. The theoretical error of this scanning method was analyzed, and a comparison experiment between the grid-scanning method and the proposed method was conducted. The grid-scanning method can be used to obtain detailed point-cloud data for cooperative targets. The Canny operator and triangulation algorithm were implemented in MATLAB to extract the edges of the targets. These measurement results were adopted as benchmarks, and the same cooperative targets were measured using the proposed method under the same conditions. Finally, the number of scanned points and positioning deviations of the two methods were compared.Results and DiscussionsThe sampling circuit designed for this study is capable of withstanding the power ripple influence of 60 mVp-p (Fig.4). Furthermore, although the signal-to-interference ratio (RSI) of -29.5 dB was calculated (Tables 1,2), the CDS detection module can stably output the signal. In this study, the scanning positioning error resulting from the perspective projection relation was determined as less than 1/10 of the galvanometer resolution. This suggests that the theoretical accuracy of laser scanning positioning is sufficiently high. Compared with the 10000 scanning points of the grid scanning method (Fig.18), the number of scanning points in the proposed approach is decreased by 97.4%. Moreover, the positioning deviation of the cooperative target is less than 0.06 mm (Tables 5,6). The new scanning method minimizes the irrelevant scanning regions and eliminates the image calculation process, thereby reducing the need for computational resources.ConclusionsIn this study, a novel method for detecting cooperative targets using CDS is proposed, which can achieve reliable detection even in the presence of ambient light interference (RSI=-29.5 dB). In addition, a discontinuous scanning method based on the bisection principle is introduced and verified. The results show that with the reduction of 97.4% in the number of scanning points, the deviation of the proposed method is better than 0.06 mm and simplifies the arithmetic process. Applying this technique to the developed laser scan projection system can improve the anti-interference performance during calibration. In addition, the proposed method can reduce time consumption and ensure position accuracy.
Mar. 10, 2024Vol. 51 Issue 5 0504002 (2024)
Hongxing Zhou, Wanlin Zhou, Haihua Cui, Xiaowei Xu, and Bo Wang
ObjectiveIn the process of using digital laser shearing speckle interferometry technology for measurement and detection, owing to the different interference characteristics of the laser and the measurement environment, there will be multiplicative and additive noise of different properties in the phase map wrapped in the measurement results. However, noise presented in the wrapped phase diagram makes it difficult to conduct and ensure accurate subsequent phase unwrapping. Therefore, investigating how best to suppress and remove noise contained in wrapped phase diagrams is crucial for measurement applications involving shear speckle interferometry. Currently, problems remain with noise suppression and the removal of speckle interference-wrapped phase maps. For example, traditional noise suppression methods (such as sine cosine full variation filtering) consistently fail to fully suppress both multiplicative and additive noise while protecting wrapped phase information, which makes the analysis error from subsequent processing either too large or complex to conduct. Hence, in this study, we propose a homomorphic filtering-based sine cosine full variation fusion filtering method that effectively removes multiplicative and additive noise while protecting wrapped phase map information. Subsequently, the effectiveness of the proposed method is experimentally verified.MethodsThis study proposes the suppression and removal of wrapped phase map noise during digital laser shearing speckle interferometry measurements using a homomorphic filtering-based sine cosine full variation fusion filtering method. First, homomorphic filtering is performed on the original wrapped phase image containing noise to suppress and remove multiplicative noise components from the wrapped phase image. Subsequently, the filtering results undergo sine and cosine decomposition to remove the periodic noise components in the wrapped phase diagram. Finally, the decomposed sine and cosine images are subjected to full variational filtering to remove the remaining additive noise components. Simultaneously, the speckle suppression index is introduced as a criterion to determine whether the filtering process has completed while suppressing the noise. Subsequently, the decomposed sine and cosine images are subjected to arctangent transformation to achieve filtering recovery of the final wrapped phase image. Additionally, the effectiveness of the filtering method is verified through simulation experiments and composite test pieces with preset defects.Results and DiscussionsIt was confirmed that the proposed fusion filtering method achieved the goal of protecting phase information while removing multiplicative and additive noise in wrapped phase images. By simulating the wrapped phase diagram and its corresponding noisy image, noise suppression results were obtained using the proposed method alongside other traditional methods (Fig.3). From their speckle suppression indices , it can be observed that the speckle suppression index obtained using the proposed fusion filtering method was the smallest, indicating that this noise suppression effect is the best, Thus, verifying the feasibility of the proposed method. The proposed filtering method was validated using composite materials with preset defects. According to the filtering results, it can be observed that the speckle suppression index of the image obtained using the proposed method after filtering was approximately 10.7% lower than that of traditional sine cosine full variation filtering. After phase unwrapping the filtering results, the number of phase residual points in the noise suppression image obtained using the proposed method was the smallest, and the phase unwrapping results stabilized, thus, verifying the stability and superiority of the proposed fusion filtering method.ConclusionsThis study proposed a sine cosine full variation fusion filtering method based on homomorphic filtering to address the issue of noise in a wrapped phase map obtained from shear speckle interference. By considering different noise properties, we effectively achieved the suppression and removal of various noises, ensuring smooth future phase unwrapping. Compared to the traditional full variation denoising process based on sine cosine decomposition, this solution reduces the speckle suppression index by approximately 10.7% and protects phase information for subsequent phase unwrapping processes. Moreover, the filtering effect stabilized with fewer phase residual points during the unwrapping process. First, the feasibility and effectiveness of the method were verified by manually adding noise through a wrapped phase simulation. Subsequently, the actual wrapped phase map containing noise obtained by detecting the composite specimen plate with preset defects was filtered, and the filtering effect was quantitatively evaluated using the speckle suppression index. The phase information protection effect was also evaluated through phase unwrapping, and the effectiveness and superiority of the proposed method were verified using both simulation and practical detection experiments.
Mar. 10, 2024Vol. 51 Issue 5 0504003 (2024)
Hao Sun, Le Tang, Chunyan Wang, Weiguo Zhang, Chunlei Du, and Liangping Xia
ObjectiveIn the field of optics, micro-cylindrical lenses and cylindrical lens arrays are commonly used optical devices usually processed by traditional mechanical grinding, ultraprecision turning, and die forming. In the process of diamond lathe machining, the tool machining step often has a constant period, resulting in the formation of a periodic texture structure corresponding to the knife pattern on the lens surface. This structure causes an obvious diffraction phenomenon under strong laser irradiation and produces stray light that interferes with the optical path in the optical system, seriously affecting the function of the optical system. However, there are few reports on this phenomenon at present, resulting in a lack of theoretical guidance for solving this problem.MethodsTo analyze the influence of stray light on the surface of a 100-μm-diameter micro-cylindrical lens caused by lathe machining, a model of the periodic texture structure is constructed, and the influence of the surface periodic texture structure on diffractive stray light is analyzed. The theoretical diffraction model of the structure is established by using Fourier optical theory, and the intensity distribution rules of the diffracted light field at different depths are calculated. The theoretical rules obtained are basically consistent with the physical optics simulation and experimental test results of the commercial optical software VirtualLab, and the theoretical model is verified theoretically and experimentally.Results and DiscussionsBased on the model of the periodic texture structure, the light spots of the ideal lens are compared with those of the lens with the periodic texture structure. As shown in Fig.5, compared with those of the ideal lens, the light spots of the lens with the periodic texture structure produce obvious diffractive stray light along the fast axis direction. In view of this phenomenon, the beam intensity distributions are calculated and simulated at different depths of the periodic texture structure on the surface of the micro-cylindrical lens, as shown in Fig.6. It can be seen that, the deeper the periodic structure, the stronger the diffractive stray light generated. When the surface texture depth of the cylindrical lens is greater than 16.2 nm, the diffracted stray light is more significant, which has a significant impact on the optical performance of the device. This is basically consistent with the experimental result. Finally, according to the research results, a method is proposed to control the depth of the periodic structure and destroy the periodic characteristics of the surface to weaken the diffractive stray light.ConclusionsIn this study, the relationship between the periodic texture of the micro-cylindrical lens and the diffracted stray light of the beam is studied, an analysis model of the periodic texture structure of the micro-cylindrical lens is established, and theoretical calculation and simulation analysis methods for analyzing the relationship between the periodic structure and the intensity of the diffracted stray light are given. This research provides a theoretical analysis method for solving the problem of diffractive stray light caused by periodic knife grain in the machining process of micro-cylindrical lens.
Mar. 10, 2024Vol. 51 Issue 5 0513001 (2024)
Yanyan Qin, Ruidong Huang, Xiaobing Liu, Cheng Qian, Siming Xue, and Qinghe Mao
ObjectiveSurface-enhanced Raman scattering (SERS) spectroscopy has significant applications in various fields such as food safety, environmental monitoring, and life sciences. In recent years, there has been growing interest in the quantitative detection of substance concentrations using SERS spectroscopy. SERS fiber probes, which offer outstanding practical value, enable in situ and on-site detection of substances in complex environments, making them highly suitable for practical quantitative measurements. However, because the reuse of fiber probes is challenging owing to contamination by the substances being measured, it is essential to prepare a large number of fiber probes that exhibit good interchangeability in batches. This allows the establishment of a statistical quantitative relationship between the spectral amplitude and substance concentration through large-sample spectral detection. This statistical quantitative relationship can thereafter be used to determine the concentrations of unknown samples. However, the interchangeability differences of fiber probes prepared from similar and different batches and the elimination or compensation for interchangeability degradation during batch preparation for quantitative detection have not yet been studied. In this study, we employ an electrostatic adsorption self-assembly method to prepare tapered SERS fiber probes. By assimilating, statistically averaging, and fitting large-sample spectral data measured from different batches of fiber probes, we obtain high-precision quantitative curves and achieve quantitative detection of thiram samples.MethodsA batch of bare tapered fibers is fixed onto a specially designed disc. Subsequently, a monolayer of uniformly distributed gold nanospheres is grown on the surface of these fibers at the same density under the optimized electrostatic adsorption self-assembly conditions. Subsequently, a batch of tapered SERS fiber probes with excellent interchangeability is obtained. Tapered SERS fiber probes are prepared by repeating the same preparation process under identical conditions. During the testing stage, fiber probes from the same batch, which exhibit good interchangeability, are initially used to individually test a series of thiram standard solutions with varying concentrations. The spectral data obtained from these single tests are thereafter fitted to establish a quantitative relationship between the spectral amplitude and the sample concentration for that particular batch. Subsequently, spectral data obtained from single tests using different batch probes are fitted to obtain a quantitative relationship for each batch. Based on these relationships, spectral calibration factors are calculated to account for variations across different batches. Ultimately, the spectral data measured by the probes from different batches are assimilated into a single batch using calibration factors such that large-sample spectral data can be collected. Spectral data are statistically averaged and fitted to obtain a high-precision quantitative curve. The quantitative detection capability of this curve is assessed using recovery testing experiments.Results and DiscussionsThe results reveal that fiber probes from the same batch exhibit good interchangeability, with the relative standard deviation (RSD) of the spectral amplitude measured for the same sample concentration being less than 8%. Fiber probes from different batches exhibit greater variability owing to inherent factors in the chemical growth process, with an RSD of 15% for the spectral amplitude measured for the same sample concentration (Fig.3). The quantitative relationship between the spectral amplitude measured by probes from the same batch and concentration is investigated, and the results indicate that for all batches of fiber probes measured, the spectral amplitudes measured by probes from a single batch follow a Langmuir function relationship with thiram concentration, but the quantitative relationships obtained are different for each batch (Fig.4). Using the spectral calibration factors obtained from the quantitative curves of single tests from each batch, ten batches of spectral data are successfully assimilated to the same batch level, and a high-precision quantitative relationship curve is obtained through statistical averaging and data fitting of the assimilated large-sample spectral data with a fitting degree of up to 0.999 (Fig.5). The quantitative curves obtained after assimilating the spectral data to the 1st, 4th, and 8th batches individually exhibit excellent quantitative detection capabilities, and the recovery rates for thiram-spiked samples at concentrations of 8×10⁻⁷ mol/L and 8×10⁻⁸ mol/L fall within the range of 90%?110% (Table 2).ConclusionsIn this study, we investigate the quantitative SERS detection performance of tapered fiber probes prepared in batches using an electrostatic adsorption self-assembly method. Under consistent preparation and detection conditions, different fiber probes from the same batch exhibit excellent interchangeability, with an RSD of the SERS spectral amplitude of less than 8% for thiram samples at the same concentration. To address the issue of the reduced interchangeability of fiber probes from different batches, which does not meet the demands for the number of probes needed in practical quantitative detection applications, we propose and demonstrate a method to assimilate the spectral data measured by probes from different batches to those of probes from a single batch. By statistically averaging and fitting the assimilated large-sample spectral data, we obtain a calibration curve for the SERS quantitative detection of thiram samples in the concentration range of 2×10⁻⁸?10-6 mol/L. Using this calibration curve, the recovery rates for tests on spiked thiram samples at concentrations of 8×10⁻⁷ mol/L and 8×10⁻⁸ mol/L reach 90%?110%. The proposed method for the batch preparation of tapered SERS fiber probes, the assimilation method of spectral data from probes prepared in different batches, and the scheme for obtaining high-precision quantitative detection curves through statistical averaging of large-sample spectral data are expected to provide references for practical SERS quantitative detection applications.
Mar. 10, 2024Vol. 51 Issue 5 0513002 (2024)
Hanshuai Zhao, Baodong Yang, Zhao Xue, and Lanlan Zheng
ObjectiveAtomic optical filters have a broad range of applications in several areas, including atomic clocks, free-space optical communications, and laser remote sensing systems. The Faraday anomalous dispersion optical filter (FADOF) is one of the most popular optical filters because of its narrow bandwidth, high transmission, fast response, and high noise rejection. As a result, it has been intensively studied both theoretically and experimentally. The FADOF is based on the rotation of the polarization direction of a linearly polarized light signal when it passes through an atomic medium in a magnetic field. Most previously published studies have focused on the FADOF of the atomic transition between the ground and excited states; consequently, the selectivity of the operating wavelength of the FADOF is often limited. Some scholars have further investigated the FADOF between two excited states (ES-FADOF), owing to their abundant transitions. However, the bandwidths of the FADOF and ES-FADOF are usually of the order of ~GHz. Currently, the investigation of atomic optical filters with ultranarrow bandwidths remains a focus.MethodsBased on a 133Cs 6S1/2-6P3/2-6D5/2 (852 nm+917 nm) ladder-type atomic system, we present an experimental study on a nonlinear optical filter with an ultra-narrow bandwidth, as shown in Fig.1. A circularly polarized laser with a wavelength of 852 nm was used as the pump light to populate the atoms from the ground state 6S1/2 to the intermediate excited state 6P3/2 and to polarize the atomic medium. The polarization direction of the 917 nm linearly polarized laser as the signal light, with a frequency in the vicinity of the 6P3/2-6D5/2 transition, was rotated when it passed through the polarized atomic medium. The experimental setup is shown in Fig.2. The temperature-controlled 133Cs vapor cell was placed between a pair of Glan-Taylor prisms with perpendicular polarization directions; the extinction ratio of the prisms reached 100000∶1. The 852 nm pump and 917 nm signal lights overlapped in the 133Cs vapor cell and were then separated by two dichroic mirrors. Subsequently, the signal light passed through an interference filter and reached a photodetector, enabling the realization of the induced dichroism excited atomic line filter (IDEALF) operating on the 6P3/2-6D5/2 transition with an ultra-narrow bandwidth.Results and DiscussionsThe influences of parameters such as the temperature of 133Cs vapor cell and the power of the 852 nm pump light on the peak transmittance and equivalent noise bandwidth (ENBW) of the IDEALF, are measured and analyzed. In particular, the difference in the IDEALF between the two experimental configurations is investigated when the 852 nm pump light is co-propagating or counter-propagating with the 917 nm signal light in the atomic medium. Notably, the Autler-Townes splitting phenomenon in the IDEALF spectral signal is observed for the counter-pumping configuration when the power of the 852 nm pump laser is relatively high (>4 mW), as indicated in Fig.6, which is in good agreement with the theoretical calculation result using a simple model, as shown in Fig.7. As a typical result, the IDEALF in the counter-pumping configuration has a higher peak transmission and narrow ENBW in comparison to that of the IDEALF in the co-pumping configuration (Fig.5, Fig.8, and Fig.9). This is because the counter-pumping configuration is Doppler-free with an atomic coherence effect in a ladder-type atomic system, which has been confirmed in many other experiments, whereas the co-pumping configuration is an incoherent experimental system. The difference between the two experimental configurations causes a significant difference in the ENBW of the IDEALF. In our experimental parameters, the ENBW is in the range of ~7?60 MHz for the counter-pumping configuration and the ENBW in the range of ~90?140 MHz for the co-pumping configuration, and thus, the ENBWof the former is approximately half of the latter, as shown in Fig.9.ConclusionsWe demonstrate an IDEALF with ultra-narrow bandwidth in a ladder-type atomic system and compare its properties under two different experimental configurations. Under the optimized experimental parameters, the peak transmission of the IDEALF reaches ~20%. The ENBW of the IDEALF is at least one order of magnitude narrower than that of the FADOF (~GHz). The narrowest bandwidth of ~7 MHz of the IDEALF is realized, which is close to the natural linewidth of 5.2 MHz of the intermediate excited state 6P3/2. Under certain experimental conditions, the IDEALF signal exhibits two distinct profiles: a line-center filter with a single transmission peak is obtained for a co-propagating experimental configuration, and a line-wing filter similar to the popular FADOF is also realized in the case of a counter-propagating experimental configuration. Both of these profiles have significant application value in detecting weak light signals and eliminating the influence of background noise light, particularly in the case of a non-magnetic environment.
Mar. 10, 2024Vol. 51 Issue 5 0508001 (2024)
Yu Cai, Haochen Tian, Shiying Cao, Guanshi Qin, and Minglie Hu
ObjectiveThe femtosecond optical frequency comb (FOFC) comprises a series of ultra-short laser pulses with the same temporal separation in the time domain and discrete, equidistant, and stable phase-related frequency components in the frequency domain. The FOFC can accurately measure the absolute frequency of an atomic clock and serve as a natural time-frequency reference. Currently, the most stable and compact light source is the mode-locked erbium-doped fiber laser with a central wavelength of 1.55 μm, typically employing highly nonlinear fibers to broaden the spectrum across the entire transparent range of silica fiber (350?2400 nm). However, the output power of the erbium-doped fiber FOFC is generally in the range of a few hundred milliwatts. Therefore, increasing the output power of the FOFC remains a crucial challenge. The mid-infrared FOFC holds significant application value in next-generation spectroscopy, as it can be used to detect gases such as carbon dioxide and ammonia and extend the FOFC wavelength to the molecular fingerprint spectrum range (3?20 μm) through nonlinear crystals. This spectrum range is vital for chemical composition analysis, making the development of high-power mid-infrared FOFCs a pressing need.MethodsThis system comprises an erbium-doped fiber FOFC, a super-continuum converter, a double-cladding thulium-doped fiber amplifier system, and a transmission diffraction grating pulse compressor. Initially, the erbium-doped fiber FOFC utilizes a highly nonlinear fiber with normal dispersion for frequency broadening. Additionally, a self-pump amplifier composed of thulium-doped fiber generates a femtosecond seed with a central wavelength of 1925 nm. This seed is injected into a chirped pulse amplification system comprising a 55 m long highly nonlinear fiber with normal dispersion, a three-stage thulium-doped fiber amplifier, and a transmission diffraction grating pulse compressor. To characterize the noise of the high-power mid-infrared FOFC, we analyze the relative intensity noise and the phase noise of the pulse train using a signal source analyzer. Moreover, we co-couple the super-continuum laser generated by the high-power mid-infrared FOFC in the fluorotellurite fiber with a 1064 nm iodine-stabilized Nd∶YAG laser to detect the beat signal and verify the performance of the high-power mid-infrared FOFC.Results and DiscussionsThe 1.55 μm femtosecond laser output from the erbium-doped fiber femtosecond optical frequency comb is symmetrically broadened to the spectral range of 1100?2200 nm by the highly nonlinear fiber with normal dispersion (Fig.2). The resultant super-continuum laser is injected into the self-pump pre-amplifier to obtain a femtosecond seed with a central wavelength of 1925 nm and an average power of 50 mW [as indicated by the dashed line in Fig.3(a)]. This seed is then broadened to hundreds of picoseconds through the normal dispersion fiber and amplified by the three-stage double-cladding thulium-doped fiber amplifier to yield a picosecond pulse with a central wavelength of 2000 nm and an average power of 36.07 W. After compression, a femtosecond pulse with an average power of 22.72 W and a pulse width of 240 fs is obtained [Fig.3(b)]. The integral values of relative intensity noise and timing jitter are 1.16% and 472 fs, respectively (integral range of 10 Hz?1 MHz) (Figs.4 and 5). The super-continuum laser (Fig.6) generated by the high-power mid-infrared FOFC and the 1064 nm laser produce a beat signal with a signal-to-noise ratio of 40 dB, meeting the counting requirements of the counter (Fig.8).ConclusionsWe demonstrate a high-power FOFC based on an erbium-doped FOFC, generating a 2 μm femtosecond seed through a highly nonlinear fiber with normal dispersion and self-pump pre-amplifier. The highly nonlinear optical fiber with normal dispersion effectively overcomes noise sensitivity issues associated with nonlinear dynamics of abnormal dispersion, such as soliton self-frequency shift and Raman soliton, during super-continuum generation. The femtosecond pulse, obtained with an average power of 22.72 W and a pulse width of 240 fs, marks a significant advancement in developing high-power mid-infrared FOFCs. This development contributes to the spectroscopic analysis of molecular structures and dynamics and facilitates the expansion of optical frequency combs into the molecular fingerprint spectrum range (3?20 μm).
Mar. 10, 2024Vol. 51 Issue 5 0508002 (2024)
Xusheng Xiao, Yewei Chen, Wentao He, Yuxuan He, Wentao Liang, Yang Xiao, and Haitao Guo
Mar. 10, 2024Vol. 51 Issue 5 0516001 (2024)
Xiao Chen, Shanmin Huang, Liangjin Huang, Jianing Cao, Zhiping Yan, Zhiyong Pan, Pu Zhou, and Zongfu Jiang
Mar. 10, 2024Vol. 51 Issue 5 0516002 (2024)
Rong Yang, Jihui Dong, Bojia Su, Zhehou Yang, Yong Chen, Xiaofeng Li, Chunli Chen, and Dingfu Zhou
ObjectiveIn the remote detection of bioaerosol clouds by fluorescence lidar, the decision tree method is often used to identify the fluorescence spectral signals of the clouds. The conventional decision tree algorithm selects the intensity values of the echo signals at different wavebands as features rather than extracting the statistical features of the echo signals, thereby effectively recognizing the fluorescence spectra measured under the same environmental conditions. However, in bioaerosol LiDAR, the acquired fluorescence spectra are highly variable because of the great uncertainty of the atmospheric state and background radiation, such that when the signal-to-noise ratio of LiDAR decreases, the previously established decision tree model may be overfitted, resulting in low recognition accuracy. In this study, the conventional algorithm is improved to increase the noise resistance of recognition and make the algorithm applicable to the field of LiDAR detection of bioaerosols.MethodsIn this study, fluorescence spectral signals of six biomaterials are first tested under laboratory conditions. Different Gaussian white noises with different intensity values are added to the fluorescence spectrum of each material to simulate the actual echo signals detected by bioaerosol LiDAR. Subsequently, the fluorescence spectra and recognition algorithms are analyzed mechanistically, and a decision tree recognition algorithm based on statistical feature extraction is designed, primarily based on discrete cosine transform (DCT), central peak position, and normalized spectral area. Finally, the performance of the two recognition algorithms is examined with simulated LIDAR signals under different noise intensity values. The two algorithms are used to train the spectra of the training set to form their respective decision trees, concurrently recording the training time. The decision trees are used to discriminate the test set, whereby the accuracy is calculated to analyze the actual detection ability of the algorithms before and after the improvement.Results and DiscussionsBoth algorithms accurately recognize each biomass when the signal-to-noise ratio (SNR) of the signal is high. The recognition rate is above 90% when the SNR is above 20. However, the performance of the traditional algorithm dramatically weakens with an increase in noise. In the detection of bioaerosol LiDAR, the SNR is 10, leading to greatly reduced recognition accuracies of the traditional algorithms. The recognition accuracy of rapeseed pollen is lower than 60%. When the SNR is 5, the recognition accuracies are even lower than 50% for the four kinds of substances, clearly making it difficult to support the performance of the algorithms to meet the requirements of LiDAR telemetry. The improved algorithm maintains a recognition accuracy of above 65% even when the SNR is 5, and the recognition accuracy is above 80% when SNR is 10. Second, the training time of the algorithm designed in this study is 16?32 ms, which is much smaller than that of the traditional algorithm. This training time does not increase with the noise intensity, whereas the training time of the traditional algorithm, which is 84?509 ms, sharply increases with the noise intensity.ConclusionsTo solve the problem of efficient recognition of biofluorescence spectra by bioaerosol LiDAR, this study designs a novel decision tree algorithm based on statistical feature extraction of fluorescence spectra, by transforming the original primary multiple features into seven main high-level features through DCT, searching for the central wavelength, and calculating the spectral area, which covers almost all the spectral information. The proposed algorithm is faster to train and more noise-resistant, outperforming the traditional algorithm in all aspects. The results show that the decision tree algorithm based on feature extraction improves recognition accuracy and training speed, thereby averting misclassification and enhancing the detection performance of bioaerosol LiDAR.
Mar. 10, 2024Vol. 51 Issue 5 0510001 (2024)
Jianpeng Hu, Minggang Chai, Mengyu Wang, Caijun Xue, Chengfeng Xie, Qinggui Tan, Bin Wei, Lingfeng Wu, Tao Wu, and Yanjun Fu
ObjectiveCurrent sensors are widely used in modern power electronic systems due to their advantages including high sensitivity, great precision, excellent stability, etc. In the electric power industry, they are extremely important in power measurement, electrical protection and control systems. However, due to the low sensitivity of current transformers, Roche coils and Hall sensors, optical systems seem ideal for current sensing because of their resistance to electro-magnetic interference and fast response. In addition, the problems of miniaturization, process simplicity and high sensitivity of current sensors have not yet been solved. Non-contact current sensors based on whispering-gallery mode (WGM) optical microcavities have the advantages of simplified structure, high sensitivity, low detection limit and small size. The sensor designed has the potential in realizing the intelligent monitoring of the current status for practical applications in the fields of wind power generation, smart grids as well as electric vehicles.MethodsA section of thin-walled quartz tube is intercepted to prepare a whispering-gallery mode microcapillary cavity by the method of arc discharge. The microcapillary cavity has a tiny curvature with a surface nanoscale axial photonic structure, which is able to bind more optical modes and improve the storage time of the optical modes, so that the microcapillary cavity with ultra-high quality (Q) factor is prepared. A tapered fiber with a waist diameter of 2 μm is prepared for excitation of whispering-gallery modes in the microcapillary cavity using the heat-and-pull technique. Subsequently, we propose a non-contact current sensor based on the ultra-high Q-factor microcapillary cavity. The copper wire with the diameter of 80 μm is put in the center of the microcapillary cavity, and 50% Fe3O4 and 100% Fe3O4 are filled into the microcapillary cavity, respectively, for comparative study. Subsequently, the optical instrument is adjusted to make the microcapillary cavity coupled with the tapered optical fiber and the measurement circuit is connected. The time interval is set as 90 s. The resonant wavelength shift of the microcapillary cavity with the change of the current can be observed and recorded by the oscilloscope. Finally, the sensitiveness of the microcapillary cavity and its detection limit for the three cases, i.e., the hollow microcapillary cavity, the microcapillary cavity with 50% Fe3O4, and the microcapillary cavity with 100% Fe3O4, are compared.Results and DiscussionsThe resonance spectrum of the microcapillary cavity is measured using the experimental device, and the highest Q-factor of 3.45×10⁷ is obtained by Lorentz fitting (Fig.5). The hollow microcapillary cavity is tested by setting the current interval to 20 mA. Firstly, when the current is increased from 0 to 300 mA, the resonant wavelength is shifted by 0.1393 nm, and the sensitivity is calculated to be1.547 nm/A2 with a current detection limit of 1.874×10⁻⁸ A2/nm (Fig.6). Secondly, by adding 50% magnetic nanoparticles of Fe3O4 into the microcapillary cavity, the resonant wavelength is shifted by 0.1034 nm, with a sensitivity of 4.039 nm/A2 and a current detection limit of 7.176×10⁻⁹ A2/nm when the current is increased from 0 to 160 mA, showing an enhanced sensitivity and a higher precision of detection limit (Fig.7). Finally, by increasing the magnetic nanoparticles in the microcapillary cavity to 100%, when the current is increased from 0 to 30 mA, the resonant wavelength is shifted by 0.0973 nm, the sensitivity is 10.811 nm/A2, and the current detection limit is 2.94×10⁻⁹ A2/nm. The sensor sensitivity and current detection limit show nearly one order of magnitude improvement with respect to the hollow microcapillary cavity, and also have a significant enhancement in comparison with the case of 50% nanoparticles.ConclusionsA non-contact current sensor based on ultra-high Q-factor whispering-gallery mode microcapillary cavity is investigated. The mode spectrum of microcapillary cavity is stably excited and regular, and the highest Q-factor value reaches 3.45×10⁷. By filling the microcapillary cavity with Fe3O4 nanoparticle magnetic fluids, the current sensing sensitivity can reach up to 10.811 nm/A2, and the current detection limit reaches 2.936×10⁻⁹ A2/nm, showing a very high current sensing detection performance. The proposed microcapillary cavity non-contact current sensor has the advantages of high sensitivity, high precision, good signal linearity and fast response. The sensor has a simple structure, small size, and low power consumption, and it is not subject to electromagnetic interference, which provides a new path for the application of microcavity in non-contact current detection. It can be applied to the condition assessment of equipment such as smart transformers, switchgear circuit breakers and insulating devices, etc. It can be used for online monitoring of partial discharges, harmonic currents, faults and leakage currents, etc. It provides a new path for current sensing in the power industry and consumer electronics.
Mar. 10, 2024Vol. 51 Issue 5 0510002 (2024)
Zhongwei Liang, Yufang Chen, Yao Lu, Xinyu Chen, Jingli Wang, and Hongdan Wan
ObjectiveFiber-optic temperature sensors with light waves as the carrier and optical fibers as the medium are used to transmit and sense temperature signals. Compared with traditional sensors, fiber-optic temperature sensors have high information capacity, anti-electromagnetic interference, anticorrosion properties, high measurement accuracy, and safety, along with being explosion proof. They are applied in various fields, such as national defense, military, civil engineering, energy, environmental protection, and medical health. Compared with fiber-optic temperature sensors, such as fiber gratings and Fabry-Perot interferometers, micro-cavity temperature sensors have the advantages of small size, high resolution, fast response time, and low cost. For pure SiO2 micro-cavities, the improvement in temperature sensitivity is limited by the poor thermal sensitivity of the quartz material. Results of previous studies demonstrate that combining SiO2 micro-cavities with thermally sensitive materials is effective for improving temperature sensitivity.MethodsIn this study, a highly sensitive temperature sensor based on a polydimethylsiloxane (PDMS) sensitized hollow-core micro-cavity resonator (PS-HCMR) is developed and implemented. Based on the thermal sensitivity of PS-HCMR wall mode resonance spectrum and the high thermal optical effect and thermal expansion effect of PDMS, the high sensitivity perception and measurement of temperature are achieved. The temperature sensitivity of the HCMR is measured at 27?33 ℃ by coating 50-μm and 150-μm thick PDMS films on the HCMR using a coating method. An experimental comparison with the temperature sensitivities of a solid-core micro-cavity resonator (SCMR) and pure SiO2 HCMR (Table 1) is performed to verify the high-sensitivity temperature-sensing performance of the PS-HCMR and the effect of PDMS film thickness on the HCMR. The thermal sensitivity effects of higher-order-mode whispering gallery mode (WGM) in micro-cavities with different PDMS film thicknesses are compared theoretically and experimentally.Results and DiscussionsThe use of PDMS plated on an HCMR is proposed to achieve high-order-mode high-sensitivity sensing with a fast response, good stability, and high sensitivity because of the high coefficient of thermal expansion. The simulation results (Fig. 2) indicate that, when the coating thickness is 0 μm, the temperature increases and the spectral lines move toward the long wavelength (red shift) owing to the positive coefficient (1.1×10⁻⁵ K-1) of thermal expansion and thermal-optical coefficient (5.5×10⁻⁷ K-1) of SiO2. When the PDMS is very thin (thickness of 2 μm), the positive thermal-optical coefficient of Si and the negative thermal-optical coefficient (-4.5×10⁻⁴ K-1) of PDMS compensate for each other, and the PDMS thermal expansion coefficient (9.6×10⁻⁴ K-1) dominates at this time, resulting in a response to temperature increase that still shifts the spectral lines in the long wavelength direction. When the PDMS thickness is increased further (from 2 μm to 10 μm), the resonance response shifts the WGM resonance spectrum in the short wavelength direction (blue shift) owing to overcompensation because the negative thermo-optical coefficient of PDMS is much larger than the positive thermo-optical coefficient of SiO2, and the blue shift increases with increasing PDMS thickness. When the thickness is significantly larger than 10 μm, the spectral line shifts to longer wavelength direction as the PDMS thickness increases. As shown in Figs. 8 and 9, the experimental results indicate that the combination of the HCMR with the high Q value and the polymer PDMS with a high thermal expansion coefficient achieves a stable structure with a temperature sensitivity of 0.127 nm/℃, which is 2.87 times higher than PS-SCMR (44.16 pm/℃) and 32 times higher than the conventional pure SiO2-based HCMR (3.93 pm/℃).ConclusionsA highly sensitive temperature sensor based on the PS-HCMR is proposed. High-Q PS-HCMRs with 200-μm-diameter PDMS with film layer thicknesses of 150 μm and 50 μm are prepared, and the temperature sensitivity is greatly enhanced by taking advantage of the high thermal expansion coefficient and high thermo-optical coefficient of PDMS material, as well as the high-order mode resonance in the hollow-core structure of the HCMR. The experimental results show that, when the film layer thickness is 150 μm, the temperature sensitivity of the proposed PS-HCMR can reach 0.127 nm/℃, which is 2.87 times better than that of the PS-SCMR and 32 times better than that of the pure SiO2 HCMR. The PS-HCMR temperature sensor proposed has good application prospects in the fields of industrialized control, health monitoring, environmental monitoring, and biochemical reaction control.
Mar. 10, 2024Vol. 51 Issue 5 0510003 (2024)
Xinjiang Ma, Dongjie Yue, Yueqian Shen, Rufei Liu, Minye Wang, Jiayong Yu, and Chunyang Zhang
ObjectiveRoad safety is crucial for public well-being and economic prosperity. Accurate and comprehensive pothole inspection is essential to identify potential safety hazards early and take prompt maintenance measures to ensure public safety. Traditional manual inspection has drawbacks including limited staff safety, slow and expensive processes, etc. Hence, efficient and automated technologies and methods are urgently needed for pavement pothole inspection. Intelligent inspection research focusing on safety enhancements includes vibration anomaly detection, two-dimensional (2D) image processing, and three-dimensional (3D) stereo detection. However, vibration anomaly detection methods may suffer from leakage, while 2D image-based detection methods are susceptible to environmental factors like light, shadows, and water, leading to inaccurate results. Additionally, in 3D stereo detection methods, line structured light scanning technology is limited to single-lane scanning, while 3D reconstruction methods are more demanding in terms of images and algorithms, showing lower robustness. Existing pothole detection methods from vehicle-borne laser point cloud rely on fitting local line or surface models and using height differences to identify pothole, but accuracy is compromised due to the complexity and slope of the pavement. Inaccurate local models and relative distances are significant factors contributing to the incorrect extraction or omission. To address these challenges, we propose a novel method for detecting pavement potholes from vehicle-borne laser point clouds. The goal is to assist road maintenance departments in inspecting and maintaining pavements more effectively, ultimately enhancing the efficiency of pavement damage extraction.MethodsAddressing the challenges associated with pothole detection using vehicle-borne laser point clouds, which can be influenced by road transverse and longitudinal slopes leading to misdetection and omission, in this paper we propose a novel pothole detection method based on roughness and negative skewed distribution. The method involves three main steps: pavement point cloud segmentation, pothole preliminary separation, and statistical quantitative judgement. To begin with, the cloth simulation filter (CSF) algorithm is used to obtain ground point clouds, followed by the segmentation of pavement point clouds from the complex road scenes through verticality and hierarchical clustering. Subsequently, a local plane model is fitted using the M-estimated sample consistency (MSAC) method to obtain the relative directed distance (i.e., roughness), enabling the localization of potential potholes. Density-based spatial clustering of applications with noise (DBSCAN) and point cloud continuity are then utilized for the singularization and denoising of potential potholes. Next, a neighborhood expansion process is conducted for potential monolithic potholes, and their identification is accurately determined based on the statistical laws of roughness distribution and the skewness coefficients. Geometric features such as depth, projected area, and repair size are computed considering the independence and regional connectivity of the potholes. Finally, experiments are conducted using both open source data and measured data to validate the effectiveness and accuracy of the proposed method.Results and DiscussionsBased on the continuity and flatness of the pavement, as well as the vertical characteristics of road curbs and their separation as pavement boundaries, this study firstly acquires the accurate pavement point clouds (Fig. 14). The proposed method can accurately detect potholes in multiple lanes and different shapes in both open source data (Figs. 15 and 16) and measured data (Figs. 17 and 18), which proves the effectiveness of the proposed method. Field inspections of the measured data scene reveal impressive results for pothole detection using the proposed method, with a recall rate of 89.2% and an accuracy rate of 76.7%. Notably, both indicators outperform similar methods by over 10% (Table 2). Additionally, the maximum relative deviation of potholes' 3D geometric features between the proposed method and manual field measurement is 9.4% (Table 3 and Fig. 19), further highlighting the applicability and robustness of the proposed method. The experimental results demonstrate the applicability and robustness of the proposed method, which can avoid the inaccuracy of the relative distance due to local grids (Fig. 3) and further improve the judgement of potholes by statistical features.ConclusionsIn this study, a novel method for pavement pothole detection that integrates roughness and negative skewed distribution is proposed. Firstly, the pavement point cloud is extracted from the intricate road environment using the CSF method, along with verticality and hierarchical clustering. Then, MSAC is used to fit the planes in order to obtain accurate local planes and relative distances. For the noise issue, DBSCAN and point cloud continuity are used for denoising and singularization of potential potholes. To achieve accurate judgement of potholes, the potential potholes along with their neighboring pavement point cloud are taken as a whole, and the statistical features of roughness are used for quantitative judgement of potholes. Finally, 3D geometric features such as depth, projected area, length and width of potholes are automatically extracted from the point cloud. Experimental results demonstrate the effectiveness of the proposed method in detecting potholes within large-scale complex road scenes. In the measured data, the recall rate and accuracy rate of pothole detection reach 89.2% and 76.7%, respectively. The maximum relative deviation between extracted 3D geometric features and manually measured field results is only 9.4%. Overall, the proposed method offers a valuable technical reference for extracting pavement damage information, enabling accurate detection of road damage and precise evaluation of road conditions.
Mar. 10, 2024Vol. 51 Issue 5 0510004 (2024)
Chengli Ji, Zhenyi Chen, Yifeng Huang, Jiajia Mao, Zhicheng Wang, Ruichang Gu, Aiming Liu, Chunsheng Zhang, and Yan Xiang
ObjectiveThe technology for retrieving aerosol extinction coefficients from LiDAR is mature. However, further progress is required to retrieve the vertical distribution of aerosol mass concentration. In addition, accuracy evaluation of aerosol mass concentration from LiDAR is challenging owing to the lack of standard vertical PM2.5 mass concentration. Therefore, in this study, a PM2.5 mass concentration retrieval algorithm was developed by integrating real-time temperature, relative humidity, and extinction coefficient profiles. The PM2.5 mass concentration at four heights of the Shenzhen Meteorological Gradient Observation Tower was used as the standard value to evaluate the accuracy of the model under different weather conditions and seasons.MethodsThe influence of meteorological factors on the vertical distribution of aerosol mass concentration is extremely complex, particularly under precipitation conditions where the LiDAR signal attenuation is severe. Therefore, in this study, only the effects of temperature and relative humidity on the vertical distribution of aerosols under non-precipitation weather conditions were investigated. In practical applications, sample data are initially preprocessed, including the outlier handling (triple standard deviation removal), rainy day data, and missing value removal. The extinction coefficient at the lowest height of the LiDAR, ground temperature, relative humidity from the microwave radiometer, and PM2.5 mass concentration near the ground were substituted into an exponential model. The data from 2500 h were subsequently used for model fitting. The model parameters were automatically determined based on the minimum mean square error. Thus, the extinction coefficient, temperature, and relative humidity profiles at a specific height could be selected to calculate the PM2.5 mass concentration at the corresponding height. To investigate the accuracy of the PM2.5 mass concentration inversion, comparisons were conducted between PM2.5 mass concentrations at four heights (70, 120, 220, and 335 m) on the Shenzhen Meteorological Gradient Observation Tower.Results and DiscussionsBy comparing different weather conditions, the correlation coefficients between the simulated and measured values at the four heights are over 0.68 (Figs.3 and 4). The maximum mean absolute error (MAE) and root mean square error (RMSE) are 6.88 μg/m3 and 18.56 μg/m3, respectively, appearing at a height of 335 m on sunny days. In different seasons, the correlation coefficients at the four heights range from 0.78?0.93, 0.71?0.81, 0.73?0.80, and 0.63?0.75, respectively (Table 4). The PM2.5 mass concentration spatiotemporal distribution and transport process on July 29, 2022, was selected as a case study for analysis (Fig.6). Before 08:00, the aerosol extinction coefficient within 1 km of the boundary layer is relatively low (<0.3 km-1), and the PM2.5 mass concentration, and extinction coefficient decreased with increasing altitude. However, the decrease in gradient was insignificant. This is because the PM2.5 mass concentration mixed unevenly with altitude changes owing to stable stratification on that day. Moreover, relatively weak winds are not conducive to diffusion. Under high temperature and relative humidity conditions, the hygroscopicity of aerosols at high altitudes increases. Thus, the averaged extinction coefficient over 0.48 km is greater than 0.5 km-1, and high PM2.5 mass concentration (40 μg/m3) is observed simultaneously. This indicates that atmospheric aerosol vertical distribution is significantly influenced by temperature and relative humidity. In addition, the vertical distribution of aerosols is fully reflected in the height variation of PM2.5 mass concentration, which provides an analytical tool for examining the vertical distribution of aerosol microscopic physical characteristics.ConclusionsThis study established a multivariate PM2.5 mass concentration fitting model based on an exponential model combining temperature, relative humidity, and extinction profiles. The optimal parameters were selected based on the minimum mean-square deviation index, and the output was validated. Compared to the linear and exponential basic models, the accuracy of the multivariate fitting model has been improved, with correlation coefficients at all four heights above 0.80. The minimum MAE and RMSE are approximately 4 μg/m3 and 7 μg/m3, respectively. Under clear and cloudy weather conditions, the correlation coefficients at four altitudes exceed 0.68, and the MAE and RMSE are below 7 μg/m3 and 19 μg/m3,respectively. The simulation results spanning different seasons demonstrate that the average mass concentration of PM2.5 in Shenzhen is below 35 μg/m3. The simulated PM2.5 mass concentration exhibited seasonal variation patterns. In addition, the simulation results for spring, summer, and autumn are better than those for winter. This may be due to the uncertainty caused by the relatively high aerosol mass concentrations in winter. Considering the uncertainty caused by the LiDAR and microwave radiometer measurement processes, the validation results of the proposed multivariate model performed well within an acceptable range.
Mar. 10, 2024Vol. 51 Issue 5 0510005 (2024)
Qianjin Wang, Pengshuai Sun, Zhirong Zhang, Yongjun Cai, Wenbiao Huang, Tao Pang, Hua Xia, and Bian Wu
ObjectiveTunable diode laser absorption spectroscopy, a commonly used gas concentration detection technology, has the advantages of non-contact real-time measurement, high sensitivity, and strong selectivity. It includes direct absorption spectroscopy and wavelength modulation spectroscopy. Compared to direct absorption spectroscopy, wavelength modulation spectroscopy technology has a strong anti-interference ability, higher sensitivity, and lower detection limit; it has been widely used in environmental monitoring, industrial gas detection, combustion diagnosis, and other fields. However, real-time wide-range detection of gas concentration has increasingly become a necessity. For example, the volume fraction of methane in coal mines and petrochemical pipelines varies from 0% to 100%, and the water vapor in air fluctuates significantly. Therefore, there is an urgent need for a new method for wide-range detection of gas concentration in petrochemical pipelines, coal mines, and other fields.MethodsTo meet the requirements of wide-range detection of gas concentration in many fields, this study utilizes the high sensitivity characteristics of wavelength modulation spectroscopy, examines the nonlinear characteristics of wavelength modulation spectrum (WMS-NL), and then achieves high sensitivity and wide range detection of gas concentration using the wavelength modulation method. According to the principle of laser absorption spectroscopy, the Taylor expansion of the absorption term is analyzed. Specifically, linear approximation and cubic polynomial approximation of the Taylor expansion are adopted at low concentration (low absorbance) and high concentration (high absorbance), respectively. Moreover, methane (CH4) is taken as an example to verify the feasibility of this method in the wide-range detection of gas concentration. Additionally, combined with the three parameters of absorption line intensity, effective optical length, and gas concentration, the specific details of the method are described based on the calculation of the absorbance of CH4.Results and DiscussionsBased on experimental verification, this method can achieve the detection of CH4 volume fraction in the range of four orders of magnitude (1.5×10⁻⁶-10000×10-6). The volume fractions below and above 1000×10-6 (the corresponding integrated absorbance is below and above 0.0236) are detected separately, and there is a good linear correlation between the inverted concentration and the standard concentration. The correlation coefficients in both the low and high concentration ranges are 0.999. In addition, combined with this method, the error, detection limit, and stability of the CH4 detection system are analyzed. In the range where the volume fraction exceeds 1000×10-6, the maximum relative measurement error is 0.93% and the absolute error is 92.1×10⁻⁶. Similarly, in the range where the volume fraction is lower than 1000×10-6, the maximum relative measurement error is 4.00% and the absolute error is -34.2×10⁻⁶. In addition, CH4 with a volume fraction of 5000×10-6 is measured for a period of time, and then the Gaussian distribution of the inverted concentration is counted. Its half width at half maximum is 15.9×10⁻⁶, and the stability of this method is well demonstrated under high concentrations.ConclusionsThe proposed method overcomes the limitation that conventional wavelength modulation spectroscopy can only measure low concentrations, provides a new idea for wide-range detection of gas concentration, and can considerably expand the application ranges of wavelength modulation spectroscopy.
Mar. 10, 2024Vol. 51 Issue 5 0511001 (2024)
Beibei Xie, Xuanyu Zhou, Jiawei Zhao, and Zhichong Wang
ObjectiveDuring the production and transportation of crude oil, a large amount of sludge is inevitably produced, which is loaded with high concentrations of toxic, teratogenic, and carcinogenic substances that can significantly damage the ecosystem. Laser-induced fluorescence (LIF) technology is currently one of the most effective methods for detecting oil spills. Soil is a common natural porous medium that allows oil droplets to enter its pores when mixed with it. This unique structure causes multiple reflection and absorption of light, leading to differences in the fluorescence distribution obtained by LIF for the detection of soil petroleum contaminants. Recent studies have shown that LIF technology can effectively detect soil petroleum contaminants. However, studies regarding the microscopic analysis of photon transmission in oily soils are limited. Based on the optical transmission theory, building a fluorescence simulation model of oily soil and analyzing its fluorescence distribution can provide theoretical support for the LIF detection of soil petroleum contaminants. Therefore, this study uses the Monte Carlo method combined with the implicit function representation of porous media to build a fluorescence simulation model of soil petroleum contaminants to simulate the transmission process of laser and fluorescence photons in soil petroleum contaminants, and to analyze the impact of the detection and soil parameters on the fluorescence signal.MethodsBased on the varying amounts and distribution characteristics of the soil oil content, we classify soil petroleum contaminants into oil sludge and oil-containing soil. A simulation model is established for soil petroleum contaminants using the Monte Carlo method in conjunction with a representation of the implicit function of porous media. In this model, the soil particles are viewed as a framework of porous media with petroleum hydrocarbon pollutants filling the pores. To track the exact path of photons (laser and fluorescence) within the soil petroleum contaminants, the position of the photons is first determined in the soil petroleum contaminants based on the implicit function values, followed by determining the phenomena occurring on the surface of the soil particles. During the simulation, photons enter the medium with the initial information (including position, direction, and weight), and the motion process is accompanied by changes in the photon weight. When the photon weight is too small or radiates out of the calculated area, the next photon is emitted. This process is repeated until all photons are emitted, after which the information regarding the fluorescent photon emission is collected. By simulating the fluorescence conversion efficiency of the oil sludge and oil-containing soil polluted by the different types of oil under various incident zenith angles, porosities, and pores per inch, we analyze the influence of the different oils, LIF system parameters, and soil factors on the fluorescence distribution.Results and DiscussionsThe simulation results indicate that for the same type of oil pollution, the oil sludge generates a stronger fluorescence signal than oil-containing soil owing to the higher oil content of the sludge (Fig. 4). The fluorescence intensity of the soil petroleum contaminants increases as the porosity increases. When the soil contaminated with light oil is irradiated with a laser, the resulting fluorescence signal is weaker than that of the soil contaminated with heavy oil owing to the lower oil absorption coefficient (Fig. 5). The incident angle of the laser also affects the power of the LIF light received. Overall, the energy received by the receiver is mainly concentrated in the direction of incidence. When the laser is vertically incident, the fluorescence signal collected by the LIF system is the strongest, whereas an increase in the incident angle causes the fluorescence signal to gradually decrease (Fig. 6). The number of pores per inch of the medium is closely related to the average pore size, which affects the emission of the fluorescent photons. The results demonstrate that the fluorescence signal decreases as the number of pores per inch increases because when the pores per inch is low, the average pore size is larger, allowing more fluorescence photons to be emitted through the pores (Fig. 8).ConclusionsBased on the Monte Carlo method and implicit function representation of the porous media, a fluorescence simulation model of the soil petroleum contaminants is established. By simulating the transmission of photons in the soil petroleum contaminants, the relationship between the fluorescence signal based on the LIF reception and various parameters is obtained. First, the fluorescence conversion efficiencies of the oil sludge and oil-containing soil under the same oil pollution are simulated. The oil content of the soil petroleum contaminants is found to have a certain impact on the fluorescence signal. Subsequently, the numerical values of the fluorescence conversion efficiency of the oil sludge and oil-containing soil polluted with different oils at various porosity rates are simulated. A comparison of the results indicates that both the porosity of the soil petroleum contaminants and absorption coefficient of the oil affect the fluorescence signal. The signal intensity increases as the porosity increases, and the fluorescence signal of the light oil is weaker than that of the heavy oil. Subsequently, the effect of the pores per inch of the soil petroleum contaminants on the fluorescence signal is investigated, and the fluorescence signal is found to decrease as the number of pores per inch increases. Finally, the fluorescence conversion efficiency values of the oil sludge at different incident angles are compared, revealing that the intensity of the fluorescence signal received by the system gradually decreases as the laser incidence angle increases. Therefore, the laser incidence angle should not be excessively large when detecting soil petroleum contaminants. This study presents the optimal range of the detection angle for the LIF detection system as well as the effects of the oil content, structural parameters, and types of oil in the soil petroleum contaminants on the fluorescence signal, providing theoretical support for the LIF detection of terrestrial oil spill pollution.
Mar. 10, 2024Vol. 51 Issue 5 0511002 (2024)
Yuyin Dai, Yan Sun, Zhishu Feng, Dan Yu, Anmin Chen, and Mingxing Jin
ObjectiveLaser-induced breakdown spectroscopy (LIBS) is a spectroscopic technique that uses laser-induced plasma. In recent years, research has focused on spectral-enhancement techniques aimed at improving the detection sensitivity and resolution of LIBS. During LIBS analysis, the sample temperature can influence the intensity and shape of the observed spectral signals. Increasing the sample temperature increases the thermal motion of atoms, ions, and molecules within the sample, thereby increasing the probability of excitation and emission and ultimately enhancing the intensity of the spectral signals. Moreover, the sample temperature can affect the excited-state lifetimes of the elements, which influences the spectral signals. Different elements have different excited-state lifetimes, and changing the sample temperature can alter the width, shape, and position of the spectral peaks. With the advancement of laser technology, femtosecond (fs)-pulsed lasers have been introduced in LIBS research, offering several advantages over traditional nanosecond LIBS. Owing to the extremely short pulse duration of femtosecond lasers, they can reduce background noise interference and improve the spectral signal resolution compared to nanosecond pulses. The energy of femtosecond pulses is highly concentrated and short-lived, resulting in minimal heat and energy transfer to the sample. Thus, using femtosecond lasers for spectroscopic analysis does not damage or alter the sample, making them particularly suitable for samples with low tolerance. Spark-induced background signal interference, which often occurs in nanosecond LIBS, is reduced or avoided in fs-LIBS owing to the shorter pulse duration of femtosecond lasers. Furthermore, in nanosecond LIBS, longer pulse widths can lead to secondary heating of the plasma and plasma with a higher temperature, where atoms or ions dominate and molecules tend to dissociate. In contrast, femtosecond lasers generate plasma at a lower temperature, making it more favorable for molecular formation. Although numerous studies have explored the effect of the sample temperature on LIBS, there is limited research on the influence of the sample temperature on the molecular spectra of fs-LIBS. Therefore, this study aims to investigate the effect of the sample temperature on the AlO molecular band spectrum in Al plasma excited by femtosecond pulses.MethodsThe experimental setup of the fs-LIBS system comprises femtosecond laser system, laser energy attenuator, beam focusing system, sample heating and motion system, spectral acquisition system, and data acquisition and analysis system. Femtosecond laser system utilizes a Ti∶Sapphire femtosecond amplifier. Laser energy attenuation is achieved using a half-wave plate and Glan polarizer. The lens has a focal length of 100 mm. The sample is heated using a proportion-integration-differentiation (PID)temperature-controlled heating table, and motion control is accomplished using a three-dimensional motorized stage. The spectral acquisition system comprises a spectrometer and an intensified charge coupled device (ICCD) camera. The data acquisition and analysis system primarily includes a computer used for collecting and processing the measured spectral data. During the experiment, the sample temperature is initially increased using a heating stage, and then a femtosecond laser is focused on a pure aluminum target to produce plasma. Simultaneously, the motorized stage moves the heating stage and aluminum target to ensure laser ablation on a fresh sample surface. The plasma emission is collected by a lens and guided into the spectral detection system through an optical fiber. The acquired signals are transmitted to a computer. The experiment is conducted under atmospheric conditions.Results and DiscussionsFirst, a comparison is made of the ablative effects of femtosecond lasers on Al targets with three initial sample temperatures: 30, 100, and 200 ℃. The measurements focus on the AlO molecular spectral band from the B2Σ+ to the X2Σ+ transition. The experimental results show that at two laser energies (100 μJ and 200 μJ), the Al targets heated to 100 ℃ and 200 ℃ yield stronger AlO spectra compared to the spectra from the Al target at 30 ℃. To understand the influence of the Al target temperature on the AlO molecular spectrum in detail, the experiment records the intensity of the AlO (0-0) peak as a function of the Al target temperature under laser energies of 100 μJ and 200 μJ. The intensity of the AlO (0-0) peak increases monotonically with the increasing Al target temperature. This result indicates that using a lower laser energy and higher target temperature makes it possible to achieve the emission of molecules in laser-induced plasma at the same or even stronger levels. This implies that at higher target temperatures, stronger molecular emissions can be obtained with a lower laser energy, potentially affecting the optimization and application of laser-induced plasma spectroscopic analysis techniques. To further understand the effect of the Al target temperature on the AlO molecular spectrum in fs-LIBS, it is necessary to consider the influence of the sample temperature on the vibrational temperature of the AlO molecules. The experimental results demonstrate that the vibrational temperature of the AlO molecules increases with the Al target temperature. Clearly, greater laser energy produces stronger plasma, resulting in higher vibrational temperatures for the AlO molecules within the plasma. Moreover, in LIBS, the plasma generated by the laser ablation of a target changes dynamically. Therefore, a time-resolved spectroscopic analysis of the AlO molecules is essential to better understand the influence of the Al target temperature on the AlO molecular spectrum in fs-LIBS. The experimental results reveal that increasing the Al target temperature significantly enhances the spectral intensity and prolongs the lifetime of the AlO molecules in fs-LIBS. Thus, the time-integrated spectra of AlO at higher Al target temperatures are stronger than those at lower Al target temperatures.ConclusionsThis study investigates the influence of the Al target temperature on the AlO molecular spectrum in fs-LIBS. Increasing the Al target temperature effectively enhances the spectral signal of AlO molecules in fs-LIBS. This is because, at higher temperatures, the femtosecond laser can more efficiently excite the target material, leading to the generation of more electrons and greater energy for molecular excitation, thereby increasing the production and emission of AlO molecules. Furthermore, as the Al target temperature increases, the vibrational temperature of the AlO molecules also increases. This indicates that the molecules are subjected to higher thermal excitation and exist in higher energy states, which increases their spectral intensity and activity. Moreover, increasing the target temperature further enhances the molecular excitation and emission processes, thereby increasing the intensity and duration of the spectral signals. Time-resolved spectroscopy reveals that the AlO molecules exhibit longer lifetimes and higher spectral intensities at higher Al-target temperatures. This suggests that at higher Al target temperatures, AlO molecules can remain in an excited state for longer time, thereby increasing the intensity and duration of the molecular emission. Therefore, by adjusting the Al target temperature, the spectral intensity and vibrational temperature of AlO in fs-LIBS can be optimized, thereby improving energy utilization and analytical accuracy.
Mar. 10, 2024Vol. 51 Issue 5 0511003 (2024)
Jing Xu, Qi Huang, and Jingsong Li
ObjectivePhotoacoustic spectroscopy (PAS) is a powerful and non-destructive optical analysis technique that can be used to quantitatively analyze the composition of gases, liquids, and solids. With the continuous innovation of modern laser techniques, various new laser light sources have emerged that play an important role in promoting the development of photoacoustic spectroscopy based on laser light sources. Moreover, novel signal processing algorithms and detection strategies have been reported. In theory, PAS is essentially established with wavelength independence, high resolution, and high sensitivity. These unique characteristics make them widely used in environmental science, solid-state physics, industrial process control, biomedicine, and other fields. However, the thermal noise caused by the absorption of the incident laser by the windows or inner wall of the photoacoustic (PA) cell (particularly when the high-power laser source is used as the signal excitation light source), and the electrical noise of electronic devices (such as acoustic signal detectors) are still key technical issues that limit the detection sensitivity of PA-spectroscopy-based gas sensors. To resolve the background noise problem in these technical issues, a differential resonance photoacoustic gas detection method that fully utilizes the phase-dependent characteristics of the PA resonance cavity is proposed.MethodsConsidering the problem of noise limitation in PAS system sensitivity, resonance enhancement detection strategies are usually adopted to achieve effective suppression of the background noise of the PA system. Typically, cylindrical resonant PA cells, Helmholtz resonators, spherical resonators, and quartz tuning forks are used. In the field of signal processing algorithms, differential detection is an effective method for eliminating background noise interference, improving signal quality, and improving the spectral signal-to-noise ratio (SNR), and has good application value in various signal processing. Therefore, in this study, a high-sensitivity PA gas detection technique is developed by combining resonance PAS characteristics based on the differential detection principle. To demonstrate the proposed technique, a cylindrical PA cell with double resonant cavities is designed, and relevant theoretical and experimental studies are conducted for sensitive sensing gas detection. A differential-resonance PAS gas sensor system is integrated by using a near-infrared diode laser near 1391.6 nm and a double PA cell. To further improve the detection sensitivity, a wavelength modulation spectroscopy second-harmonic (WMS-2F) detection method is employed. Moreover, the Allan variance analysis algorithm is used to evaluate the system sensitivity and stability.Results and DiscussionsTo evaluate the gas-sensing technique, ambient water vapor (H2O) is analyzed. The potential crosstalk effect between the double-resonance cavities is investigated using theoretical simulations (Fig.1) and experimentally confirmed. Differential detection is applied for measuring background noise and H2O PA spectral signals. The calculated results indicate that the standard deviations of the background noise can be improved by approximately 1.9 times (Fig.4) by utilizing the phase-dependent characteristics of the two resonance cavities (Fig.5), and the PA spectral signal amplitude can also be significantly enhanced (Fig.7). Moreover, a detection limit of ~3.0×10⁻⁶ is obtained for ambient H2O concentration measurements under the optimal averaging time of 115 s without using differential detection (Fig.8). After using the differential algorithm, the system stability is further improved, the optimal stability time is increased to more than 200 s, and the corresponding detection sensitivity is improved to 2.0×10⁻⁶ (Fig.8).ConclusionsThis study proposes a high-sensitivity gas detection technique based on resonant PAS with differential detection principle. Allan variance analysis indicates that high-sensitivity detection of several 10-6 level H2O concentrations can be achieved using a low-power near-infrared (NIR) diode laser. Compared to the traditional single-channel PA detection mode, the results prove that the proposed differential resonant PAS detection technique can effectively improve the system stability and detection sensitivity, and the optimal signal average time can be doubled.
Mar. 10, 2024Vol. 51 Issue 5 0511004 (2024)
Peng Wu, Changgong Shan, Wei Wang, Yu Xie, Qianqian Zhu, Bin Liang, Xiangyu Zeng, Xuan Peng, and Cheng Liu
ObjectiveWater vapor, the most prevalent greenhouse gas in Earth’s atmosphere, plays a pivotal role in atmospheric chemistry and climate dynamics. Its sources, sinks, and transportation mechanisms are integral to the hydrological cycle. Analyzing the isotopic composition of water vapor sheds light on diverse hydrological processes. Furthermore, concurrent observations of atmospheric water vapor and its isotopes offer insights into the origins of atmospheric humidity across various regions. Ground-based Fourier Transform Infrared Spectroscopy (FTIR) technology is a powerful tool for remotely sensing atmospheric gases through the collection of solar spectra, characterized by high accuracy and precision. A portable FTIR spectrometer is employed to conduct continuous observations at the Shenzhen Observatory over a period of approximately two weeks. It successfully collects the solar near-infrared (NIR) spectra of the coastal atmosphere, leading to the derivation of measurement results for water vapor and its stable isotopes in the ambient atmosphere through sophisticated inversion techniques.MethodsThe experimental setup for this study primarily included a portable FTIR spectrometer, an automated sun tracker, a comprehensive meteorological station, and a dedicated computer system. This spectrometer utilized natural sunlight as its primary incident light source, while the sun tracker continuously and accurately followed the sun’s position in real time. The solar rays were precisely channeled into the interferometer, where the resulting interference pattern was captured by a sensitive detector. This pattern was then transformed into a detailed NIR spectrum through a Fourier transform process. The spectrometer was designed to capture a NIR spectral range spanning 5000‒11000 cm-1, offering a spectral resolution of 0.5 cm-1. The core of the analysis lay in the utilization of a sophisticated non-linear least squares iterative algorithm, which enabled precise inversion of the vertical column concentration of the target gas. This involved a two-step process: initial forward modelling followed by meticulous spectral iterative fitting calculations. Upon determining the vertical column concentration of the sample gas, the dry air mole fraction (DMF) was then derived by correlating it with the total column concentration of dry air.Results and DiscussionsIn our study, several specific spectral window bands are meticulously selected for the inversion of characteristic absorption features of atmospheric H2O and its isotope, HDO, in NIR spectroscopy. The average root mean square error of the residual fits for H2O and HDO spectra stands at 0.026% and 0.032%, respectively (Fig.2, Fig.3). This small residual indicates a high-quality fit to the solar spectra. During the observation period, the mean molar mixing ratio of water vapor (XH2O) in the dry air column demonstrates an increasing trend, with a standard deviation of 27.42 mg/kg. Notably, the peak concentration of XH2O is recorded at 5298.21 mg/kg on March 11, exhibiting a daily variation range of 1111.69 mg/kg, while the minimum value of 1377.45 mg/kg occurs on March 6, with a much narrower daily variation range of 323.09 mg/kg (Fig.6). To explore the relationship between surface XH2O and temperature during this period, a correlation analysis is performed, revealing a strong correlation between the natural logarithm of XH2O ln(XH2O) and surface temperature, evidenced by a high correlation coefficient of 0.94 (Fig.7). Regarding the isotopic ratio of water vapor (δD), our observations indicate a variation range from -122.52 ‰ to 16.54‰, averaging at -72.83 ‰. The lowest δD value, averaging at -103.43‰, is measured on March 6, while the highest average value of -53.36‰ is observed on March 3 (Fig.8). These δD values are primarily influenced by factors such as humidity, characteristics of water vapor evaporation, and the isotopic composition of the atmosphere in the measurement area. Employing the Keeling ratio method, we observe the water vapor evaporation characteristics of the coastal city. The evaporative δDET during the measurement period varies between (-289.92±8.89)‰ and (21.79±7.19)‰, averaging at (-111.85±14.51)‰ (Fig.11). The significant variability in δDET values in the Shenzhen area can be attributed to its coastal location, where evaporation predominantly originates from the sea. This evaporation process is influenced by various factors, including sunlight, temperature, wind force, and humidity.ConclusionsThis study utilizes near-infrared solar absorption spectra captured by a portable Fourier Transform Infrared (FTIR) spectrometer. We employ the advanced PROFFAST inversion algorithm to accurately derive the column concentrations of atmospheric H2O and its isotope, HDO. A key aspect of our experiment involves vigilant monitoring of the Instrument Line Shape (ILS) and Xair, revealing that the spectrometer maintains excellent long-term measurement stability. We simultaneously correct portable FTIR instrument readings with high-resolution FTIR instrument readings. Our research, leveraging the portable FTIR spectrometer, focuses on the coastal atmosphere of Shenzhen. We successfully measure water vapor and its isotopes, yielding valuable data on the column concentration of water vapor, the water vapor isotope ratio, and the characteristics of water vapor evapotranspiration during the measurement period. These results demonstrate the spectrometer’s capability to precisely monitor variations in water vapor and its stable isotopes in a coastal atmospheric setting. The data provided by these measurements offer a robust scientific foundation for understanding and tracking the diffusion and transport dynamics of water vapor in the ambient atmosphere. In future, our research endeavors will concentrate on the accurate retrieval of the water vapor isotope H218O from solar absorption spectra. By integrating data on H2O, HDO, and H218O, we aim to achieve a more comprehensive understanding of the water cycle, enhancing our insights into its complexities and interactions within the Earth’s atmosphere.
Mar. 10, 2024Vol. 51 Issue 5 0511005 (2024)
Xianhua Yin, Huicong Chen, and Huo Zhang
ObjectiveThe content of rubber additives is an important determinant of rubber quality. Current testing methods for these additives include combustion testing, chemical analysis, chromatography, and infrared spectroscopy. However, these detection techniques present challenges such as intricate pre-processing, time-intensive operations, laborious procedures, and potential inaccuracies in reflecting the genuine additive content. These types of limitations hinder their ability to cater to the growing demand for swift, precise, and non-destructive detection in rubber. This is a significant challenge for the advancement of the rubber industry in China. Furthermore, when analyzing multi-component mixtures, the absorption spectra can overlap and become distorted, leading to unreliable results. In this study, we leverage terahertz time-domain spectroscopy, data fusion, and chemometrics to quantitatively assess additives in five-component mixtures. This offers an innovative approach for detecting and analyzing the content of target components in multi-component mixtures of rubber and its auxiliaries.MethodsIn this study, a five-component mixture composed of NBR, silica, zinc oxide, antioxidant H, and antioxidant MB was used as an experimental sample. The terahertz time-domain spectroscopy system was utilized to capture and compute the absorption spectra of the five-component mixture within the range of 0.3?1.6 THz and to analyze its spectral characteristics. The derivative spectral data of the sample were derived by taking the first-order derivatives. Initially, the KS algorithm was employed to segment the sample set data, which was then quantitatively analyzed using partial least squares regression and support vector machine regression models. Subsequently, three data fusion methods were employed to process the data. Specifically, the low-level data fusion directly combined the absorption spectrum data with the derivative spectrum; the mid-level data fusion merged variables after feature extraction via the Monte Carlo uninformative variable elimination and successive projections algorithm; and the high-level data fusion was executed using multiple linear regression. Finally, the predictive accuracy of the models was assessed based on the correlation coefficient and root mean square error.Results and DiscussionsThrough the absorption spectra of five pure substances ― NBR, silica, zinc oxide, antioxidant H, and antioxidant MB ― it is evident that there are noticeable absorption peaks within the range of the analyzed frequency band for all five pure substances (Fig.3). The absorption spectra of the five-component mixtures are averaged individually for each proportion. It is observable that as the content of antioxidant MB in the mixtures increases, the absorbance also rises, suggesting a linear relationship between the absorption spectra of the mixtures and content of antioxidant MB (Fig.4). The full absorption spectra of the five-component mixtures reveal complexity in the mixtures, with overlapping and some distortion (Fig.5). The comparison between the predicted and reference values of the antioxidant MB content in the prediction set reveals that SVR aligns more closely with the actual value than PLSR does when predicting the antioxidant MB content in the five-component mixtures. This indicates that the SVR model predicts more effectively (Fig.6). Both the correlation coefficient and root mean square error demonstrate that SVR predicts with superior accuracy, suggesting a non-linear relationship between the content of antioxidant MB in the five-component mixture and absorbance (Table 2). Based on the SVR model, when comparing the prediction results of absorption spectra to derivative spectra, it is found that the analytical results for the content of antioxidants MB from absorption spectra fluctuate less (Fig.7). In comparing the correlation coefficients and root mean square errors of absorption and derivative spectra using the SVR model, the prediction accuracy for antioxidant MB content from absorption spectra is higher, indicating a superior predictive capability of absorption spectra (Table 3). The comparison between the predicted and reference values of antioxidant MB content for the data fusion prediction set demonstrates that the data fusion model predicts significantly better than a single spectrum, suggesting that the data fusion method enhances the model’s predictive performance (Fig.8). The predictive accuracy of the Monte Carlo-based uninformative variable elimination method for mid-level data fusion surpasses the accuracy of the single spectrum and other data fusions (Table 4).ConclusionsIn the current study, a new method for rapid detection of antioxidant MB content in rubber multi-component mixtures is investigated using terahertz time-domain spectroscopy, MCUVE mid-level data fusion, and SVR. Analysis of the absorption spectra of the five-component mixtures and quantitative analytical models reveals linear and non-linear relationships between the absorbance of the mixtures and antioxidant MB content. Results from quantitative analyses, which combine data fusion methods based on SVR, indicate that prediction accuracy and stability of all four data fusion methods significantly surpass that of a single spectrum. Specifically, the prediction performance of MCUVE mid-level data fusion is the best. In conclusion, the combination of terahertz time-domain spectroscopy, data fusion methods, and SVR modeling addresses the shortcomings of existing rubber and additive detection methods and the accuracy challenges posed by overlapping and distortion phenomena in the absorption spectra of multi-component mixtures. This approach holds significant scientific value and promises substantial market application potential.
Mar. 10, 2024Vol. 51 Issue 5 0514001 (2024)
© Copyright 2018-2021 | Chinese Laser Press.
All Rights Reserved 沪ICP备15018463号-20