


Please enter the answer below before you can view the full text.

Wanqing Sun, Zixiong Wang, Jinlong Yu, and yang Jiang
Results and Discussions The far-field normalized light intensity (NLI) distribution of the double-beam is obtained using MATLAB simulation (Fig. 3, Fig. 4). The phase depression between adjacent pixels results in diffraction side lobes. The maximum NLI of the diffraction side lobes generated using the composite phase, sub-aperture, and IFT methods are 14%, 8%, and 5%, respectively. The IFT method can suppress the diffraction side lobes more effectively than the composite phase and sub-aperture methods. The camera records the far-field light intensity distribution of the double-beam during the experiment (Fig. 5). The experimentally measured far-field light intensity distribution is consistent with the simulated far-field light intensity distribution. The beam tracks and aims the double-target moving at different speeds. The trajectories of the double-target positions approximately coincide with those of their corresponding spot position estimations when the double-target moves at a speed of 2 mm/s (Fig. 9), indicating that the synchronicity of beam tracking and aiming is better. As the moving speed of the double-target increases, the lag between the trajectories becomes increasingly evident (Fig. 10, Fig. 11), and the error of beam tracking and aiming also gradually increases. In addition, both the measured root mean square error (RMSE) and estimated RMSE progressively increases (Table 1).ObjectiveAcquisition, tracking, and pointing (ATP) technology is a core technology for establishing stable physical links in the field of laser communications. Research on ATP technology focuses on beam deflection. Traditional beam deflection techniques are typically implemented using mechanical devices such as gimbals and mechanical mirrors. However, mechanical devices have the disadvantages of large mass, high energy consumption, and mechanical inertia that result in a slow response to beam deflection and unstable beam control. Therefore, new nonmechanical beam deflection devices have been widely used in recent years, such as acousto-optic modulators, electro-optic modulators, and liquid crystal spatial light modulators (LCSLMs). LCSLMs can overcome the defects of mechanical inertia; therefore, they are widely used for beam tracking. In addition, LCSLMs can overcome the defects of traditional mechanical beam deflection techniques, which require multiple devices to achieve multibeam deflection. The deflection direction of multiple beams can be simultaneously controlled using a single LCSLM. The methods for generating multibeams based on the LCSLM mainly include the composite phase, sub-aperture, and iterative Fourier transform (IFT) methods. Currently, double-target tracking can be achieved using the spatial polarization division method that employs a polarizing beam splitter to generate two beams with perpendicular polarization directions to track two targets. However, this method requires two LCSLMs. To use a single LCSLM to deflect multiple beams for synchronously tracking multiple targets, a scheme of synchronous beam tracking and aiming for multiple targets is proposed by combining LCSLM-based beam tracking technology and the multibeam generation method. This scheme is expected to be applicable to the multibeam tracking mechanism of laser communication networks. We also construct an experimental system of synchronous beam tracking for double-target that can communicate with two mobile target terminals.MethodsIn this experiment, a camera was employed as the position detector, and an LCSLM was employed as the beam deflection device. The tracking system mainly consisted of an LCSLM, a laser, collimator, polarizer, nonpolarizing beam splitter (NPBS), an angle magnifier, a camera, and stepper motor. First, the stepper motor controlled the movement of the two targets within the field of view. The two targets were imaged in the camera using scattered light, and the images were processed using the feature matching method to obtain the initial and current positions of the two targets. Subsequently, the offsets of the initial and current positions were converted into pre-deflection angles that were substituted into the grating equation to calculate the period of the corresponding blazed grating. Next, a phase grayscale map was generated using the sub-aperture method and loaded onto the phase screen of the LCSLM. Finally, the NPBS spatially divided the beam into two mutually perpendicular beams, one of which was incident perpendicular to the LCSLM. The LCSLM controlled the deflection direction of the double-beam based on the phase grayscale map, enabling passive tracking and aiming of two mobile targets.ConclusionsThe results show that the double-target tracking system can achieve synchronous tracking of two targets using a single LCSLM to deflect two beams. Moreover, the double-target tracking algorithm is also applicable to beam tracking and aiming for multiple targets that verifies the feasibility of the multitarget synchronous beam tracking and aiming scheme. This tracking system can achieve beam tracking of a target within a field of view of ±57.9 mrad. The tracking error of the system is less than 20 μrad that meets the tracking error requirement. This multitarget tracking scheme has promising applications in the multibeam tracking mechanism of laser communication networks. However, improved synchronicity of beam tracking and aiming can be obtained using the filter prediction technique in the tracking algorithm.
Feb. 25, 2023Vol. 50 Issue 5 0505001 (2023)
Guoliang Zheng, Jianxun Liu, Tiefeng He, Xuhui Zhang, and Qingyang Wu
On the other hand, the propagation of light beams in anisotropic media has always been of interest. In 2001, Ciattoni A discovered that when a circularly polarized (CP) beam propagates along the optical axis of a uniaxial crystal, a portion of the light beam acquires a topological charge vortex phase of ±2 due to spin reversal. In 2020, Ling X H et al. found that the conversion efficiency of spin angular momentum (SAM) to orbital angular momentum (OAM) is related to the anisotropy of the crystal and shape of the beam. To improve the “abruptly autofocusing effect” of the CAB and improve the conversion efficiency of SAM to OAM, this study investigates the propagation characteristics of a modified CAB (MCAB) propagating along the optical axis of a uniaxial crystal.Results adn Discussions In our numerical study, the incident light is a left-hand CP (LHCP) MCAB without a vortex. During the propagation, a right-hand CP (RHCP) component is generated. First, we investigate the intensity, phase, and polarization distributions of the MCAB at z=100 mm. Due to the “abruptly autofocusing effect,” the radii of the first rings for the LHCP and RHCP components become smaller [Figs. 2(c),(d)]. The phase distribution shows that the LHCP component has no vortex, whereas the RHCP component has a vortex phase with a topological charge number of 2 [Figs. 2(e),(f)]. This is the singularity of the central phase that causes the RHCP component to be a hollow beam throughout the propagation. The polarization distribution shows that the beam is no longer a uniformly CP beam (Fig. 3). Due to the anisotropy of a uniaxial crystal, the abruptly autofocusing positions of the two components differ. The “abruptly autofocusing effect” of the MCAB is approximately 3.4 times as strong as that of an ordinary CAB (Fig. 4). Furthermore, we investigate the propagation dynamics of the two components. The results show that both the LHCP and RHCP components exhibit an “abruptly autofocusing effect”. The LHCP component without a vortex forms a solid beam at the focus, whereas the RHCP with a vortex forms a hollow beam at the focus (Fig. 5). For a 10 cm long crystal, the efficiency of conversion from the LHCP component to the RHCP component with a vortex can reach 43.28%, which is approximately 10% higher than that of an ordinary CAB (Fig. 6).ObjectiveThe circular Airy beam (CAB) has received significant attention because of its peculiar “abruptly autofocusing effect”. The “abruptly autofocusing effect” has shown significant advantages in biomedical treatment, laser cutting, and other applications because the CAB can be applied solely to the target without damaging other areas. Various schemes have been designed to improve the “abruptly autofocusing effect”. For example, direct blocking of the first few rings of the CAB and modulation of the CAB’s angular spectrum can significantly enhance its “abruptly autofocusing effect”.MethodsThe method proposed by Ciattoni A is adopted to deal with the propagation of light beams along the optical axis of a uniaxial crystal. According to the results of Ciattoni A, a light field propagating along the optical axis of a uniaxial crystal can be treated as a linear superposition of ordinary and extraordinary components. Based on the angular spectrum theory, the propagation dynamics of these two components can be obtained by the Fourier transform of the MCAB’s angular spectrum. A closed-form approximation of the CAB’s angular spectrum with a suitable plane wave angular spectrum representation has been reported by Chremmos I et al. A modulation function is introduced to modulate the CAB’s angular spectrum. The “abruptly autofocusing effect” of the MCAB is superior to that of the ordinary CAB. Following the approach proposed by Ciattoni A, the propagation characteristics of the MCAB in a uniaxial crystal can be obtained.ConclusionsSimilar to other ordinary beams, when an LHCP MCAB propagates along the optical axis in a uniaxial crystal, an RHCP vortex MCAB with a topological charge number of 2 is generated. With a proper modulation function, the “abruptly autofocusing effect” of the MCAB is much stronger than that of an ordinary CAB, and the efficiency of conversion from the LHCP component to the RHCP component with a vortex is also improved.
Mar. 02, 2023Vol. 50 Issue 5 0505002 (2023)
Zhaopeng Si, Bangning Mao, Zehua Bu, Huaping Gong, Ben Xu, Juan Kang, Chunjun Yang, and Chunliu Zhao
ObjectivePhase-sensitive optical time-domain reflectometry is a type of distributed optical fiber sensing technology that has become one of the most rapidly developing sensing methods in modern sensing technology because of its wide monitoring range, high sensitivity, low monitoring cost, and many measuring parameters. Compared with other distributed optical fiber sensing technologies, this technology can perform distributed multipoint measurement of weak signals over long distances. Distributed acoustic sensing (DAS) technology uses coherent Rayleigh backscattering technology in common single-mode sensing fibers that can realize the continuous detection of remote external vibration, sound, and temperature changes. This technology has strong environmental applicability, electromagnetic interference resistance, chemical corrosion resistance, and good concealment. Therefore, research on the DAS technology of a phase sensitive optical time domain reflectometer (φ-OTDR) system has great scientific and practical significance for social engineering applications. A DAS system typically adopts IQ and Hilbert demodulation, but both have certain defects. Although the IQ demodulation method has a simple structure, its demodulation results are easily affected by phase noise caused by the frequency drift of narrow linewidth laser and polarization instability of local light and Rayleigh scattering light, decreasing the demodulation accuracy. Hilbert transform can be used in DVS and DAS systems, but the low noise term cannot be eliminated in low pass filtering; therefore, the anti-noise performance is poor. In order to address the limitations of IQ and Hilbert transform demodulation methods, a signal demodulation method based on fast Fourier transform (FFT) is adopted in this study to improve the signal-to-noise ratio of vibration signals and to reduce the interference of low frequency noise, pulse optical coherence fading, and harmonics.MethodsThe digital signal collected by the acquisition card is first passed through a belt pass filter such that the signal frequency near the intermediate frequency signal passes through, and then, the step size is set according to the range resolution of the DAS detection system. To prevent signal vibration at the connection of two steps, the phase of vibration signal extraction is discontinuous. The set step size is transformed by FFT, and the frequency point is set according to the intermediate frequency signal of an acoustooptic modulator. Then, the phase information of the vibration signal is extracted. The signal phase is differentiated to eliminate the phase noise of the signal, and then, the phase signal is unwound in the fiber and time directions. Finally, the extracted phase signal is processed by high-pass filtering to eliminate the influence of system components and low-frequency noise.Results and DiscussionsCompared with IQ and Hilbert transform demodulation methods, the FFT signal demodulation method has strong phase periodicity, uniform period distribution, better amplitude stability, and less influence from signal coherent fading (Fig. 5). The phase signals demodulated by IQ and Hilbert transform have poor amplitude stability and uneven periodic distribution, and the amplitude of the demodulated signals extracted by both IQ and Hilbert transform demodulation methods is smaller than that extracted by FFT demodulation. Further, the frequency spectrum of the FFT demodulation signal shows that the phase of the vibration signal is not disturbed by harmonic and low frequency noise. Both IQ and Hilbert transform demodulation methods are disturbed by many harmonics and low frequency noise (Fig. 6). Furthermore, the signal-to-noise ratio (SNR) of vibration signals extracted by three demodulation methods is compared; the FFT demodulation method has the highest SNR (Fig. 7).ConclusionsIn this study, we adopted a DAS signal demodulation method based on FFT. The phase information of vibration signals is extracted by FFT for the vibration of the wrapped phase difference. Then, the phases secondary wrapped in fiber and time directions are obtained, and finally, a DC signal is achieved with high-pass filtering processing. The 200 Hz sinusoidal periodic signal loaded on PZT is demodulated successfully. Compared with the IQ and Hilbert demodulation methods, the phase signal demodulated by FFT is less affected by the signal coherent fading, and the frequency information display signal is not interfered by harmonics. The signal demodulated by the IQ and Hilbert demodulation methods has good periodicity, and the phase amplitude of FFT demodulation method is larger than that of the IQ and Hilbert demodulation method. The SNR of 200 Hz signal extracted by FFT is 36.71 dB, that is, 21.04 dB and 20.91 dB higher than that extracted by IQ and Hilbert transform, respectively. Moreover, this method filters the interference of low frequency noise. For sinusoidal vibration signal extraction at 2000 Hz and 5000 Hz, the experimental results show that this method has good applicability.
Mar. 10, 2023Vol. 50 Issue 5 0506001 (2023)
Yushan Wu, Junli Wang, Xiaoxin Mao, Longsheng Wang, Zhiwei Jia, and Anbang Wang
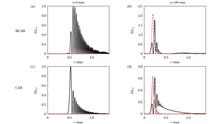
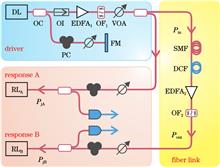
Results and Discussions Filtering width, fiber dispersion compensation deviation, and fiber input power are important factors that affect the fidelity of chaotic transmission. After amplification by the EDFA, ASE noise is involved in the chaotic signal, degrading the fidelity of the chaotic transmission. An optical filter suppresses the ASE noise. The most appropriate filtering width (0.2 nm) was confirmed (Fig. 4). Furthermore, an optimized dispersion compensation deviation of 0 ps/nm was achieved in the scenario with a fiber length of 90 km while the filtering width was set to 0.2 nm (Fig. 5). In addition to the ASE noise and fiber dispersion, fiber nonlinearity can also affect transmission fidelity: the greater the fiber input power, the greater the nonlinearity-induced distortion. With the optimized filtering width and dispersion compensation deviation, the most appropriate fiber input power of 3.1 mW was identified for a fiber length of 90 km (Fig. 6). For a larger fiber length, the optimized power increased correspondingly. Finally, chaotic transmission over single-span fibers with different lengths was examined, and a transmission limit of 200 km with a fidelity of 0.9214 was achieved experimentally, with a filtering width of 0.2 nm, dispersion compensation deviation of 0 ps/nm, and fiber input power of 18 mW (Fig. 7). Driven by the laser chaos after 200 km transmission, long-distance chaos synchronization with a synchronization coefficient of 0.9043 was obtained (Fig. 8).ObjectiveChaotic secure communication, including carrier communication and key distribution, has been widely studied owing to its advantages of high speed, long distance, and compatibility with current communication networks. For practical applications in communication networks, the rate and distance of chaotic secure communication are factors that must be considered. Much effort has been devoted to improving the rate to the order of gigabits per second. In terms of distance, it has been extensively reported that chaotic transmission over a single-span fiber of approximately 100 km can be realized experimentally. However, the transmission limit of single-span fibers remains unclear. It is worth noting that, the fidelity of laser chaos is degraded by the amplified spontaneous emission noise of optical amplifiers, as well as fiber dispersion and nonlinearity, thus affecting the transmission distance. In this study, by optimizing the filtering width, dispersion compensation deviation, and input fiber power, the aforementioned influences on the transmission performance are reduced, and the distance limit of chaotic transmission over a single-span fiber is ascertained. In the experiment, chaotic transmission over a 200 km single-span fiber with a fidelity of 0.9214 is achieved. Driven by this chaotic signal, commonly driven chaos synchronization with a synchronization coefficient of 0.9043 is obtained. This provides a basis for long-distance chaotic carrier communication and key distribution.MethodsWe used a semiconductor subject to external optical feedback to generate laser chaos as the drive signal. To meet the input power of the fiber, an erbium-doped fiber amplifier (EDFA) was used to pre-amplify the drive signal. Then, the drive signal was divided into two branches: one branch was directly transmitted to the local response laser, and the other was transmitted to the remote response laser through the single-span and dispersion-compensated fibers. In the transmission path, an EDFA and optical filter were arranged to compensate for the power loss of the fiber and reduce the amplified spontaneous emission (ASE) noise of the EDFA, respectively. In the experiment, the effects of the filtering width, dispersion compensation deviation, and fiber input power on the transmission fidelity of laser chaos over single fibers with different lengths were investigated in detail, and the optimized parameters to realize the transmission limit were ascertained. Finally, to realize chaos synchronization, the drive signals before and after transmission were injected separately into the response lasers with matched parameters.ConclusionsIn this study, the effects of the filtering width, fiber dispersion compensation deviation, and fiber input power on the fidelity of chaotic transmission were investigated experimentally. The transmission limit over a single-span fiber is confirmed. With filtering width of 0.2 nm, a dispersion compensation deviation of 0 ps/nm, fiber input power of 18 mW, and 200 km chaotic transmission distance with a fidelity of 0.9214 are realized. By using the laser chaos after 200 km transmission as the drive, long-distance chaos synchronization with a synchronization coefficient of 0.9043 is obtained, providing a basis for chaotic carrier communication and key distribution oriented toward metro area networks.
Mar. 10, 2023Vol. 50 Issue 5 0506002 (2023)
Yanpeng Zhang, Xiaoqi Zhu, Dongya Zhu, and Xia Xiao
ObjectiveSubways are necessary to alleviate the pressure of public transportation in metropolises. Currently, communications-based train control (CBTC) systems are the mainstream train operation control systems for subways. And the train positioning information obtained by positioning technology is an important parameter for ensuring safe train operation. Traditional train-positioning methods include balises, inductive loops, axle counters, wireless local area networks (WLANs), and long-term evolution (LTE) technology, but the above methods are facing certain inevitable shortcomings and hard to completely meet the needs of continuous positioning. The main drawbacks to these methods cover high cost, difficulty of maintenance, low precision, susceptibility to electromagnetic interference, limited spectrum resources and so on. Therefore, it is of great practical significance to conduct research on a train positioning method with high positioning accuracy, strong real-time performance, and low cost. With the recent advances in visible light communication (VLC), the technology is widely used in many fields owing to its high transmission rate, considering lighting and communication, environmental protection, and free spectrum resources. In this study, optical camera communication technology was applied to CBTC systems, using light-emitting diode (LED) lamps in the tunnel as the transmitter of an optical camera communication system. A train positioning method is proposed based on optical camera communication with double LED lamps, which has advantages such as high positioning accuracy, excellent real-time performance, low cost, and strong anti-interference ability. It can be used as a supplement or alternative to the existing train positioning methods in CBTC systems and has broad application prospects.MethodsTo improve the real-time performance and accuracy of train positioning, we propose a train positioning algorithm based on backpropagation (BP) neural network and optical camera communication. The proposed algorithm is divided into two parts: the detection and recognition of LED lamp information and a positioning algorithm of optical camera communication with double LED lamps. First, in the detection and recognition stage, the feature images of different LED lamps, such as frequency, area, and duty cycle, are obtained using an optical camera communication system. After training by machine learning based on the BP neural network, a training model is developed. Furthermore, in the train positioning stage, the imaging principle and geometric principle are adopted. The characteristics of the LED lamp images are extracted when the camera captures the images. After decoding, the identity (ID) information of the LED lamps is collected for the location coordinates of the lamps. Due to the distance between two adjacent LED lamps in the subway tunnel is 10 m (taking Chengdu Metro Line 1 as an example), the distance between the two adjacent LED lamps in the imaging plane can be determined using image processing technology. The focal length of the camera is provided, and the image coordinates of the LED lamps are calculated. Using geometric principles and coordinate conversion, the world coordinates of the train position can be determined. Finally, an experimental platform of optical camera communication for train positioning is established, and the proposed train positioning algorithm is verified by MATLAB. The static and dynamic performance of train positioning in the proposed algorithm is tested.Results and DiscussionsTo verify the effectiveness of the algorithm for train positioning, we set up an experimental platform for train positioning with a size of 4 m×1 m×1.2 m and arranged 20 test points for testing 400 times at four different vertical heights. The average of five tests at each position was taken as the final train positioning results for comparison. The experimental results show that the average positioning error in the proposed algorithm did not fluctuate significantly when the vertical height changed. Considering the positioning results with a vertical height of 0 for error statistics, 90.1% of the error was less than or equal to 2.650 cm. To verify the effectiveness of the proposed train positioning algorithm during operation, when a train was running at a speed of 4 m/s in the same scenario, the algorithm was used to determine the real-time train position. The experimental results show that the position coordinates predicted by the proposed algorithm were basically the same as the actual trajectory coordinates, and the positioning error was within 5 cm. The positioning results could be obtained 20 times in 1 s, and the average positioning time was 51.34 ms. The positioning accuracy reached the centimeter level, and the positioning time was near the millisecond level using the proposed algorithm.ConclusionsBased on the fixed arrangement of LED lamps in subway tunnels, we attempted to apply optical camera communication technology to CBTC systems. We classified the information characteristics of the collected LED lamps through a BP neural network to identify the ID information of LED lamps, which can solve certain problems such as few addresses, more recognition conditions, and susceptibility to electromagnetic interference in signal modulation. In addition, when the location coordinates of a single LED lamp are found, the proposed algorithm can achieve positioning results and reduce the positioning time without affecting accuracy. In summary, the proposed algorithm can improve the real-time performance and accuracy of train positioning as a supplement or alternative to the existing train positioning methods in CBTC systems.
Mar. 10, 2023Vol. 50 Issue 5 0506003 (2023)
Kun Cheng, Wentao Zhang, Wenzhu Huang, and Jianxiang Zhang
ObjectiveOptical fiber sensors have been investigated extensively for crustal strain observation owing to their advantages of high resolution and excellent environmental resistance. Currently, the most typically used high-resolution optical fiber static strain sensing technologies include frequency sweep detection and the Pound-Drever-Hall detection. In a frequency sweep detection scheme based on a tunable laser and fiber Bragg grating resonator, the frequency sweep range of the laser is relatively small and realizing the simultaneous multiplexing of multiple fiber Bragg grating resonator sensors in a single detection optical path is difficult. Generally, in the Pound-Drever-Hall detection scheme, a single-frequency laser source can only be frequency locked to a fiber Fabry-Perot resonator; therefore, this technology can only be used for single-sensor detection. Hence, achieving large-scale multiplexing using the current nano-strain optical fiber static strain sensing technology is difficult. In this study, time-division multiplexing and ellipse-fitting reference compensation techniques are proposed for high-resolution multiplexing optical fiber static strain sensing.MethodsA optical fiber Michelson interferometer is used as a sensor and each sensing interferometer is attached to a reference interferometer to compensate for the effects of temperature fluctuation and laser frequency drift. Time-division multiplexing technology is used to realize sensor multiplexing as it offers the advantages of high device utilization and high multiplexing gain. The sensor signal is demodulated using a phase-generated carrier (PGC) scheme. In this scheme, the measurement and correction of the phase modulation depth and carrier phase delay in orthogonal signals are key to reducing nonlinear errors and improving the consistency of the phase demodulation results. Therefore, an improved ellipse-fitting algorithm, referred to as the bias-corrected ellipse-specific fitting (BCESF) algorithm, is adopted to suppress the effects of phase modulation depth and carrier phase delay. The curve equation of the Lissajous figure composed of two orthogonal signals is solved using an ellipse-fitting method and the coefficients of the ellipse are obtained. Subsequently, these coefficients are used to correct the signal demodulation results to eliminate the effects of the phase modulation depth and carrier phase delay as well as to improve the consistency between the reference and sensing interferometers. Thus, the compensation effects of the temperature fluctuation and laser frequency drift are optimized, and the resolution for static strain sensing is improved.Results and DiscussionsWe place the interferometer in a sound and vibration isolation box (Fig. 3) and perform the experiment in a 5 m deep basement . To verify that the ellipse-fitting algorithm can improve the consistency of the demodulation phases of both the reference and sensing interferometers, we place the sensing arms of the reference interferometer and the sensing arm of the sensing interferometer around a piezoelectric phase modulator (PZT). Next, we apply a sinusoidal signal to the PZT using a signal generator. Based on the classical PGC-ARCTAN demodulation algorithm, the amplitudes of the sinusoidal signal demodulation results of the sensing and reference interferometers differ significantly [Fig. 4(a)]. The processing results using the ellipse-fitting algorithm show that the peak-to-peak value of the difference between the two sinusoidal signals decreases significantly [Figs. 4(a) and 4(b)]. The experimental results show that the ellipse-fitting algorithm can improve the consistency of the demodulation phase between the reference and sensing interferometers. Next, the multiplexed channels in the time division multiplexing (TDM) sensor array are expanded into four channels. Based on the elliptical fitting and reference compensation calculation, the peak-to-peak values indicated by the phase demodulation results of four channels are consistent within 10 min (Fig. 7), and the static strain resolution of each channel exceeds 0.26 nε. Compared with other types of fiber-optic sensing systems (Table 1), the proposed time-division multiplexing system based on elliptical-fitting reference-compensation technology offers a high strain resolution during the multiplexing of multiple sensors.ConclusionsHerein, we propose a high-resolution static strain sensing technique that uses a fiber Michelson interferometer as the sensor and utilizes time-division multiplexing and ellipse-fitting reference compensation techniques to achieve multiplex static strain sensing. A time-division multiplexing system with four channels is constructed, and the static strain resolution of each channel exceeds 0.26 nε. The proposed time-division multiplexing and ellipse-fitting reference compensation technologies are confirmed to be feasible for high-resolution static strain measurements and can satisfy the requirements of network multiplexing in crustal strain observation.
Mar. 10, 2023Vol. 50 Issue 5 0506004 (2023)
Naling Zhang, Cuiluan Wang, Cong Xiong, Lingni Zhu, Wei Li, Suping Liu, Xiaoyu Ma, Xin Zhao, and Xiaohui Ma
Results and Discussios The performance of the laser arrays for different head sink temperatures and injected currents under quasi-continuous conditions (pulse width of 200 μs and frequency of 20 Hz) is reported. At an injection current of 150 A, the heat sink temperature increases from -10 ℃ to 60 ℃, and the drift coefficient of the laser emission wavelength with temperature is 0.06 nm/℃ (Fig. 3). At 25 ℃, the drift coefficient of laser emission wavelength with current is 0.006 nm/A at 50-150 A (Fig. 4). 808 nm DFB laser arrays exhibit suitable wavelength stabilization. Under the same injection current, the output power of the DFB laser array decreases as the temperature of the heat sink increases (Fig. 5). When the heat sink temperature exceeds 40 ℃, the DFB laser array is saturated, indicating that the characteristic temperature of the DFB laser array is low. In order to improve the stability of DFB laser at different temperatures,the morphology of the grating should be optimized it by optimizing the process conditions of the grating preparation.Objective8XX nm high-power semiconductor lasers have wide applications in pumping solid-state lasers. The absorption peak of doped ions in the solid state is extremely narrow, typically only a few nanometers. However, the temperature drift coefficient of a typical Fabry-Pérot laser is approximately 0.3 nm. When the operating temperature changes just a bit, the emission spectrum deviates from the absorption spectrum of the ions doped in the crystal, decreasing the pumping efficiency. Developing 808 nm semiconductor lasers with stabilized wavelengths is crucial for improving pumping efficiency. In this study, an 808-nm-distributed feedback (DFB) laser diode array is prepared, and the theoretical basis of the grating design, device structure, and fabrication process are introduced. The emission wavelength of the 808 nm array laser exhibits a drift coefficient of 0.06 nm/℃ with temperature, a locking range of 70 ℃ (-10-60 ℃), and a drift coefficient of 0.006 nm/A with the current. This study demonstrates favorable conditions for improving the temperature-locking range of array lasers.MethodsFirst, the relevant parameters of the first-order grating, such as the grating period and etching depth, were determined using the coupled wave theory. Next, 808 nm laser arrays were grown via metal-organic chemical vapor deposition (MOCVD) in two steps. After the first epitaxial growth, the grating (Fig. 2) was prepared using nanoimprinting lithography and inductively coupled plasma (ICP) dry etching and wet etching processes. Subsequently, in the second epitaxial step, the p-AlGaAs grating covering layer, p-AlGaAs cladding layer, and GaAs contact layer were grown. Finally, the wafer was prepared in laser arrays using lithography, electrode preparation, coating, and packaging processes. The performances of the DFB laser arrays and the laser arrays without an inner grating with different heat sink temperatures and injection currents were measured. The results were analyzed.ConclusionsA high-power DFB laser array is prepared by combining theoretical analysis and experiments. The laser has a transverse length of 1 cm and cavity length of 1 mm with 83 emitters. The fill factor reaches a maximum of 80%. The test results show that the drift coefficient of the laser emission wavelength with temperature is 0.06 nm/℃, the wavelength locking range is 70 ℃, and the drift coefficient of laser emission wavelength with current is 0.006 nm/A. When the current is 150 A and the heat sink temperature is 10 ℃, the quasi-continuous output power of the laser can reach 140 W.
Feb. 25, 2023Vol. 50 Issue 5 0501001 (2023)
Shibiao Liao, Tao Luo, Runheng Xiao, Yingbin Xing, Yingbo Chu, Jinggang Peng, Haiqing Li, Jinyan Li, and Nengli Dai
ObjectiveSince the 1990s, fiber lasers have been widely used in the medical, communications, national defense, and industrial processing fields because of their all-solid state, high efficiency, high reliability, and high beam quality. At present, in the 1 µm band, the output power of a single-link ytterbium-doped continuous fiber laser exceeds 20 kW, and there is a theoretical limit to further increases in this power. Most studies on high-power fiber lasers have focused on randomly polarized ytterbium-doped fiber lasers. However, the development of long-distance laser communication, coherent detection, high-power beam coherent synthesis, and other applications has higher requirements for laser power, linewidth, polarization state, and other properties. Obtaining a high-power, narrow-linewidth, and high polarization extinction ratio fiber laser output has become the focus and research direction in the field of high-power fiber lasers. The most important part of a high-power narrow-linewidth linearly polarized fiber laser is the ytterbium-doped polarization-maintaining fiber, which provides gain. In this study, based on a modified chemical vapor deposition (MCVD) process combined with solution doping technology, a ytterbium-doped polarization-maintaining fiber is successfully fabricated. The polarization extinction ratio (PER) is determined by using an extinction ratio tester. An all-fiber oscillator structure test platform is built, and the performance, polarization characteristics, and linewidth performance of the ytterbium-doped polarization-maintaining fiber lasers are studied.MethodsIn this study, a 11 µm/125 µm ytterbium-doped polarization-maintaining fiber (PM-YDF ) was fabricated using the MCVD process combined with solution doping technology. Using existing MCVD machine tool equipment in the laboratory, the preform was prepared after etching, deposition, liquid-phase doping, drying, vitrification, collapse, and burning. Two holes were drilled symmetrically along the fiber core in the cladding region of the preform, and a boron-doped low-refractive-index quartz rod was placed in the holes. Finally, at a temperature of 1980 ℃, the preform assembly was drawn into a fiber with the target size, coated, and UV-cured. The refractive index profile (RIP) of the fiber was analyzed and the absorption coefficient of the fiber was test. A birefringence coefficient measurement system was built, and hybrid fiber Sagnac interferometry was used to measure the birefringence coefficient of the polarization-maintaining fibers. An all-fiber oscillator structure test platform was built to evaluate the laser performance of the fiber.Results and DiscussionsThe experimentally prepared 11 µm/125 µm PM-YDF is shown in Fig. 1, in which Fig. 1(a) shows the microscope cross-section of the fiber, and Fig. 1(b) shows the refractive index cross-section of the preform. It can be observed that the core ellipticity of the fiber is very low. The optical fiber cladding absorption coefficient is measured by the truncation method, and the cladding absorption coefficients of 11 µm /125 µm PM-YDF at 915 nm and 976 nm are 2.48 dB/m and 7.05 dB/m, respectively. The spectrum of the fiber beat length is shown in Fig. 3. After calculation, the birefringence coefficient value of the fiber to be tested, 11 µm/125 µm PM-YDF, is 3.0×10⁻⁴, with good performance. Simultaneously, the polarization-maintaining (PM) fiber is measured using a polarization extinction ratio tester. Linearly polarized light with a PER>25 dB and a wavelength of 1310 nm is passed into the 11 µm/125 µm PM-YDF sample with length of >2.25 m, and the PER measured by the PER tester is >18 dB, which confirms that 11 µm/125 µm PM-YDF can meet the needs of practical applications. An oscillator structure test platform is constructed. When the active fiber is 11 µm/125 µm PM-YDF , the output power of the laser varies with the pump power, as shown in Fig. 5(a). As the pump power increases, the output power also increases. The power tends to increase linearly, and there is no power jitter. When the pump power is 57 W, the output laser power is 48.9 W, which represents the maximum output power obtained. Further increase in the output power is limited by the pump power, and the linear fitting efficiency is 85.5%. Figure 5(c) shows the output spectrum of the fiber laser with a laser power of 12 W. The spectral shape is the Lorentzian type with a single peak. The full width at half maximum is 0.0466 nm. The frequency noise is well-suppressed, no spurious peaks appear, and the polarization extinction ratio at this power is >18 dB.ConclusionsA domestically produced 11 µm/125 µm PM-YDF is successfully fabricated using an MCVD process combined with solution doping technology. It has a birefringence value of 3.0×10⁻⁴ and maintains a degree of polarization greater than 18 dB over a fiber length of >2.25 m. An all-fiber oscillator structure test platform is built to achieve a laser output of 48.9 W at 1064 nm, and the slope efficiency is as high as 85.5%. The high laser performance of the PM fiber is verified, laying a solid foundation for the localization of high-performance PM fibers.
Feb. 25, 2023Vol. 50 Issue 5 0501002 (2023)
Yan Xu, Baojian Wu, Xinrui Jiang, Haomiao Guo, and Feng Wen
Results and Discussions The experimental data and simulation results are compared to demonstrate the feasibility of the above simulation method. Two-mode amplification experiments of LP01 and LP11 under bidirectional pumping were carried out using the optically isolated wavelength-division multiplexers (IWDMs). In the experiment, the total pump power is fixed at 200 mW while the forward pump powers are varied. The optimal equivalent erbium doping concentrations for forward-pumping and backward-pumping cases are determined using the VPI simulation platform. The equivalent erbium doping concentration under the bidirectional-pumping case is obtained using a simple weighting method of Nˉ=(1-ηb)Nfˉ+ηbNbˉ and the simulation curve and experimental data of the mode gain are shown in Fig.3. The feasibility of the weighting method is shown by the 1.3 dB difference between the simulation and the experimental data. The weighting method is very useful for the realization of FM-EDFA’s automatic gain control. The maximum difference between the simulation and the experimental results increased to 2.1 dB when the fitting process is done by use of the conventional method with a fixed erbium ion doping concentration, which is greater than that of the equivalent concentration simulation method proposed in the paper. The simulation method of equivalent erbium doping concentration doesn't limit to the two-mode amplification. Figure 6 shows that our simulation curve coincides with the VPI reference data for the six-mode amplification. An equalized FM-EDFA with a mode gain of about 11 dB is designed by optimizing the power ratio of the forward and backward pumps. Our simulation shows that the DMG and optical signal-to-noise ratio (OSNR) after loop transmission with 10 FM-EDFAs are respectively 0.56 dB and 27 dB, exceeding the OSNR threshold of no bit error for 32 GBaud DP-32QAM MDM system.ObjectiveSpace-division multiplexing appears to be the only way to increase the capacity of optical transport networks since wavelength-division multiplexing is rapidly approaching its scaling limits. As a key relay device, the few-mode erbium-doped fiber amplifier (FM-EDFA) plays an important role in long-distance mode division-multiplexing (MDM) systems. The differential mode gain (DMG) and modal gain are important factors to evaluate the FM-EDFA’s performance. The intensity model of FM-EDFA can be described by the rate equation of erbium ion concentration and the power evolution equation of the signal (or pump) mode. The distributions of erbium ion doping concentration and signal (or pump) mode field should be known in advance for theoretical calculations, with application to compare with experimental results or to optimize the performance of FM-EDFA. For example, the refractive index distribution must be imported into the simulation system as files in many simulation platforms. However, the complicated erbium-doped concentration distribution and the refractive index profile are usually unknown in most experiments. This research aims to offer a new simulation method to bypass the erbium-doped concentration distribution and accomplish the consistency of FM-EDFA’s theoretical calculation (or simulation results) with the experimental data as possible.MethodsAccording to the relationship between the parameters used in the FM-EDFA’s theoretical model shown in Fig.1, an equivalent erbium doping concentration parameter was introduced to replace the real erbium doping concentration N0 in the theoretical model, and then the equivalent erbium doping concentration parameter was obtained by simulating and fitting the mode gain curve measured by the experiment. Regardless of whether the actual N0 is uniform in the erbium-doped fibers, the gain of the signal modes depends on the pumping mode, pumping mode distribution, and its power; therefore, the equivalent erbium doping concentration also varies with the pumping parameters. Based on the equivalent erbium doping concentration, a new simulation method was proposed for FM-EDFAs, in which the equivalent erbium doping concentrations under the bidirectional pump case can be obtained from the two separate experiments with forward and backward pumping by weighting the pump power ratio. The simulation method is also used to efficiently simulate the cascading transmission performance of the FM-EDFAs.ConclusionsThe two-mode amplification experiment of bidirectionally pumped EDFA is carried out using few-mode IWDM devices, which shows the feasibility of the FM-EDFA simulation method based on the equivalent erbium doping concentration, and provides a simple method to calculate the equivalent doping of bidirectionally pumped FM-EDFA. The highest difference between the simulation results and the experimental data using the weighting method of erbium concentration in the VPI simulation platform was only 1.3 dB. A gain-balanced FM-EDFA with mode gain of about 11.2 dB is built, and its cascaded transmission properties are investigated using optical cycle simulation. This is accomplished by optimizing the bidirectional pump power distribution to compensate the mode-dependent loss of FM-IWDM. The simulation shows that after ten cyclic transmissions, the DMG and OSNR of the entire system are about 0.56 dB and 27 dB, respectively, which applies to the long-distance transmission of DP-32QAM high-order modulation format signals.
Feb. 25, 2023Vol. 50 Issue 5 0501003 (2023)
Jiye Zhang, Hangyu Peng, Junsheng Cao, Jun Zhang, and Jingbo Wang
Results and Discussions Figure 1 shows a schematic of an MCC mini-bar. The MCC mini-bar has eight emitting points soldered onto a macro-channel cooler. The optical procedure for every mini-bar consists of three steps: fast axis collimation, beam symmetrizing with beam transformation systems, and slow axis collimation. The spot widths and divergence angles of the fast and slow axes for each emitting points were 3.2 mm, 6 mrad and 2.6 mm, 6 mrad, respectively (Fig. 4). Every four mini-bars with the same wavelength were mounted in a stair-step manner (Fig. 5), leading to the formation of a simulated beam spot with a 7 mm×6 mm field-shape distribution (Fig. 6). Then, all emitting units were coupled theoretically into a fiber with core diameter of 200 μm and numerical aperture of 0.22 using polarization and wavelength multiplexing, as shown in Fig. 7. In the experiment, a fiber-coupled module comprising 16 MCC mini-bars (eight of 915 nm and eight of 976 nm) achieved an output power over 800 W and wall-plug efficiency of 45% under macro-channel cooling with industrial water (Fig. 8). Furthermore, the lasing beam from 19 fiber-coupled modules was coupled by a 19×1 fiber optic combiner into a 1 mm optical fiber (Fig. 10), achieving a maximum output power over 15 kW (Fig. 11) and spot size of 165 mm×25 mm (Fig. 12).ObjectiveWith the increase in wind turbine equipment volume, the scale and performance requirements of wind turbine bearings are increasing. This is a significant challenge for the production and manufacturing of large-scale wind turbine bearings. In recent years, high-power lasers have been applied for the processing of workpieces such as crane-main and worm-shaft bearings. Therefore, high-power lasers, while serving as quenching light sources, are expected to solve the surface hardening of large-scale wind turbine bearings, enabling the development of large-scale wind turbine bearing technology. After CO2 and solid-state lasers, high-power diode laser systems have gained substantial interest in laser quenching for metal materials because of their high wall-plug efficiency, high reliability, long lifetime, relatively low investment costs, small footprint, and high absorption efficiency. Currently, high-power diode laser sources have achieved an output of over ten thousand watts in many countries, particularly in the USA and Germany. However, domestic development has been relatively slow. In this scheme, a novel method of 19 fiber-coupled laser modules, one of which is coupled with 16 macro-channel cooling (MCC) mini-bars, is used to develop a 15-kW fiber-coupled diode laser-quenching light source.MethodsAiming at the practical application of laser quenching in the production of large-scale wind turbine bearings, a 15-kW fiber-coupled diode laser-quenching light source was designed. First, 16 MCC mini-bars with linear array beam shaping, eight of 915 nm and eight of 976 nm, were used by adopting a space/polarization/wavelength beam combination to obtain a high-power fiber-coupled module with an optical fiber with core diameter of 200 μm and numerical aperture of 0.22. Under cooling with industrial water, the high-power fiber-coupled module achieved a continuous output power of over 800 W and high wall-plug efficiency. Then, the laser beams from the 19 fiber-coupled modules were coupled by a 19×1 fiber optic combiner into a 1 mm optical fiber. Finally, the intensity distribution of the lasing beam spot was further homogenized using the microlens array combined with the focusing lens. In addition, the performance of the fiber-coupled module was analyzed in our simulations and experiments.ConclusionsIn this study, a high-power and high-efficiency fiber-coupled module is demonstrated by adopting a space/polarization/wavelength beam combination composed of 16 MCC mini-bars, eight of 915 nm and eight of 976 nm. Under macro-channel cooling with industrial water, an output power of over 800 W and wall-plug efficiency over 45% are demonstrated for a fiber with core diameter of 200 μm and numerical aperture of 0.22. Then, the lasing beams from the 19 fiber-coupled modules are coupled by a 19×1 fiber optic combiner into a 1 mm optical fiber. A better homogenized intensity distribution of the light spot is achieved using a microlens array combined with a focusing lens. The results show a maximum output power over 15 kW and spot size of 165 mm×25 mm, satisfying the power required for quenching the bearing raceway surface of a large wind turbine spindle.
Feb. 25, 2023Vol. 50 Issue 5 0501004 (2023)
Fei Chen, Jinghua Yu, Yi Chen, Junjie Sun, Zhihuan Yao, Yiwen Zhang, Deyang Yu, Yang He, and Kuo Zhang
Results and Discussions The regenerative amplifier provides a laser output with a repetition rate of 1 kHz, single pulse energy of 107.3 mJ [Fig.2(a)], pulse width of 1.2 ns [Fig.2(c)], and optical-to-optical conversion efficiency of 11%. In the experiment, a CMOS camera is used to measure the diameter of the light spot in the x and y directions. The Gauss fitting of the measurement results indicates that the beam quality factor (Mx2) of the output laser beam in the x direction and the beam quality factor (My2) of the output laser beam in the y direction are 1.07 and 1.05, respectively [Fig.2(b)], and the beam quality is near the diffraction limit. The root-mean-square (RMS) of pulse amplitude stability is 1.26%. The amplified laser spectral width is 2.04 nm [Fig.2(d)], which supports the compression of the laser pulse width to 735 fs, as shown by theoretical calculations.ObjectiveIn recent years, the thin disk laser has been shown to have significant advantages in terms of structure, efficiency, and beam quality. It has been used to realize ultrafast lasers with high repetition rates, large pulse energies, and high average powers. It has important applications in basic scientific research, industrial production, national defense and military, biomedicine, and other fields. Based on theoretical and numerical analyses, this paper presents an analysis and design of a thin disk regenerative amplifier with a large fundamental mode volume. It can afford a laser output with pulsed energy exceeding 100 mJ.MethodsBased on ABCD matrix theory, the optical resonator of the thin disk regenerative amplifier is designed to ensure a laser output with basic mode size. By optimizing the parameters of the pump and seed lasers in the amplifier cavity and managing the thermal effect in the amplification process, the regenerative amplifier can achieve high energy pulse laser output. The experimental device of the disk regeneration amplifier, shown in Fig. 1, contains a seed source, optical isolator, Faraday rotator, Pockels cell, thin film polarizer, regeneration amplifier cavity, and thin disk module with a 48-pass pump structure.ConclusionsThis paper presents the optimization of the mode matching of the amplifier cavity based on the single thin disk module regenerative amplifier and the realization of the amplification laser output with a single pulse energy of 107 mJ. In future studies, we will continue to optimize the design and experimental scheme of the regenerative amplifier cavity and use multi-layer dielectric gratings to compress the pulse width of a chirped pulse with high pulse energy to achieve laser output with higher pulse energy, higher average power, and narrower pulse width.
Mar. 10, 2023Vol. 50 Issue 5 0515001 (2023)
Fang Li, Chun Zhang, Jiangyun Dai, Changle Shen, Nian Liu, Yi Chen, Lei Jiang, Lihua Zhang, Lü Jiakun, Qiang Shu, Ruoyu Liao, Hongbing Zhou, Cong Gao, Honghuan Lin, Longbiao Zhao, Jianjun Wang, and Feng Jing
ObjectiveFiber lasers are widely used in industry, national defense, and military fields owing to their advantages of high electro-optical efficiency, compact structure, and excellent stability, and Yb-doped fiber (YDF) lasers are a crucial fiber laser direction. Compared with 25 μm/400 μm fiber, 20 μm/400 μm YDF is less expensive and exhibits easier mode-controlling. Hence, 20 μm/400 μm YDF lasers have been widely applied and developed rapidly. Here, we successfully prepare high-quality 20 μm/400 μm YDF by improving the YDF preform fabrication technique. A master oscillator power amplifier (MOPA) system with the domestic 20 μm/ 400 μm double-clad YDF realizes the highest output laser power of 4 kW without the transverse mode instability (TMI) by adopting the backward pumping method.MethodsUsing a homemade 20 μm/400 μm double-clad YDF, we construct a MOPA system to test the property of the fiber at high power. The seed has a center wavelength of 1064 nm and output power of 19 W. A mode field adapter with a 10 μm/130 μm input fiber and 20 μm/400 μm output fiber is adopted to connect the seed and the chirped and tilted fiber Bragg grating which is utilized to suppress the stimulated Raman scattering (SRS) signal. We adopt a cladding power stripper (CPS) before the main amplifier to discard the residual pump power from the backward pump sources. The active fiber of the amplifier is a 15-m-long 20 μm/400 μm YDF and coiled with a 9-cm diameter to suppress the TMI effect. The pump sources comprising five 976-nm-LD pump modules are injected into the 20 μm/400 μm YDF using a (6+1)×1 signal-pump combiner with a 25 μm/400 μm signal fiber. The maximum output power of each pump module is 1030 W. A CPS is utilized before the quartz block holder to discard the higher-mode in laser signal. After passing through the system, the output power of the seed decreases to 8 W. The beam quality of the output laser is measured at different output powers, and the TMI effect is assessed according to time-frequency characteristics. The continuous laser output power at the 4-kW level is recorded to examine the long term stability of the laser system.Results and DiscussionsA laser output power of 4015 W with a slope efficiency of 81% is obtained . At the highest power, the beam quality factor (M2) is approximately 1.39. The output laser spectrum has a center wavelength of 1064 nm and broadens as the output laser power increases. When the output power reaches 2875 W, the SRS effect emerges. The 3-dB linewidth of spectrum at the highest output power is 1.3 nm, and the Raman suppression ratio reaches 31 dB. Here, TMI does not emerge. In addition, the continuous stable operation at 4 kW is realized for 1830 s. The obtained result indicates that the maximum variation of output power is 2.5% (Fig.4).ConclusionsBased on the homemade 20 μm/400 μm double-clad Yb-doped fiber, we construct a master oscillator power amplifier system to test the property of the fiber at high power. The output laser power reaches 4 kW with a center wavelength of 1064 nm and a slope efficiency of 81%. At the highest power, the M2 is 1.39 and the Raman suppression ratio is better than 30 dB. In the future, we will optimize the structure of the laser system and increase the pump power to further study the property of homemade 20 μm/400 μm Yb-doped fiber.
Mar. 10, 2023Vol. 50 Issue 5 0515002 (2023)
Changwen Liu, Fajie Duan, Jie Li, Yi Xu, and Shaoying Xing
Results and Discussions To verify the proposed calibration method, the two methods were used for repeated calibration, and the repeatability of the two method’s results was compared to verify the calibration algorithm’s precision. Ten repeated experiments showed that the direction vectors based on the joint estimation had a smaller standard deviation and higher precision. Following calibration, the size of the measuring block was measured to verify the algorithm’s accuracy. The size of the gauge block was 25 mm, measurement error of the traditional method was 32.7 μm, and measurement error of the method proposed in this study was 25.2 μm (Fig. 8). To verify the stability of the calibration method, a total of ten repeated calibrations were performed, and the results of the ten repeated calibrations were used to measure the size of the gauge blocks. The average measurement error of the proposed method is 25.0 μm, while the average measurement error of the traditional method is 35.7 μm. Compared with the traditional method, the measurement error of this method was reduced by an average of 30% (Fig. 9). According to the experimental results, the proposed calibration method has a higher scanning direction calibration accuracy and good robustness.ObjectiveIn a visual measurement system, the scanning mechanism is used to move the vision sensors or the measured object to expand the measurement range, which is known as translation scanning. The measurement range of a single image, particularly for a line-structured light three-dimensional (3D) sensor, is only the light stripe formed by the intersection of the light plane and object. To achieve a 3D reconstruction of the measured object, a scanning mechanism must scan the entire surface of the light plane. In practical applications, line-structured light 3D sensors and translation scanning mechanisms are used in combination to measure flat objects and in defect detection, quality control, geometric dimension measurement, positioning, and other applications. However, before use, it is necessary to unify the coordinate systems of the scanning mechanism and sensor, that is, to calibrate the translation direction of the scanning mechanism. In the traditional calibration method, the checkerboard plane target is fixed, sensor is moved along the scanning direction, and camera captures target images. Subsequently, the extrinsic camera parameters corresponding to each image are estimated separately, and the 3D coordinates of the same feature point on each target image are calculated in the camera coordinate system. Finally, the 3D coordinates of the same feature point are fitted with a straight line, and the straight line’s direction vector is the scanning direction. Because of the different sharpness of the target images captured at different positions, the corresponding camera extrinsic parameters contain different noises for each image separately, introducing noise several times when calculating the 3D coordinates of feature points and then reducing the calibration accuracy.MethodsFirst, the study analyzed and verified the disadvantages of the traditional calibration method, which introduces noise several times. In the verification experiment, the target was only translated by the high-precision stage; the orientation of the plane target relative to the camera remained unchanged, and the translation distance of the target was measured using the laser interferometer as the reference value. The ideal rotation matrix for each capture position should be identical to the initial capture position. However, the experimental results show that the rotation matrices estimated by the traditional methods are different (Fig. 3), and the estimated value of the target translation differs significantly from the reference value (Fig. 4). This proves that the traditional method introduces noise several times, decreasing the accuracy of the scanning-direction calibration. To reduce noise caused by different image sharpnesses, a scanning direction calibration method based on joint estimation was proposed. The scanning direction vector was added to the camera imaging model, and in the calibration process, the translation stage was used to move the plane target at a fixed distance. Therefore, the rotation matrix of the target relative to the camera coordinate system at each capture position remains unchanged, and the change in the translation vector is constrained by the translation stage’s movement distance. By adding constraints on the rotation matrix and translational vector, the 2D feature points on the plane target are expanded to 3D feature points, which are all combined for one homography estimation, and the noise caused by different image sharpnesses is reduced.ConclusionsTo improve the 3D reconstruction accuracy of line-structured light 3D sensors, this study first analyzes and verifies the shortcomings of the traditional scanning direction calibration method, which introduces noise several times, and then proposes a scanning direction calibration method based on joint estimation. The 2D feature points on the plane target are expanded to 3D feature points by adding constraints to the rotation matrix and translation vector, which realizes one joint homography estimation for all the calibration images and improves the calibration accuracy of the scanning direction. The experimental results show that this method improves the scanning direction calibration accuracy and reduces the sensor’s 3D reconstruction error.
Mar. 10, 2023Vol. 50 Issue 5 0504001 (2023)
Xiaosong Liu, Zhehao Pei, Weijiang Chen, Qiaogen Zhang, Zhong Fu, and Bin Du
ObjectiveOwing to rapid development in laser technology, femtosecond lasers can form plasma filaments of up to 100 m in length. This type of plasma channel has good continuity and relatively low resistivity, which is conducive to guiding long-distance discharge. Therefore, it has broad application prospects in the fields of high-voltage discharge and electric field measurement. Accurate measurement of the relevant parameters of femtosecond lasers is the premise of applying femtosecond lasers in various fields. Existing optical photography methods can accurately measure optical parameters such as the size, number, and service life of the laser filament, but there are few accurate measurement methods for the electrical characteristics of femtosecond laser filaments. The electrical characteristics of laser filaments mainly include the current characteristics and equivalent resistance in an external electric field. Scholars have studied the plasma characteristics of femtosecond laser filaments. This type of research can reflect the current-carrying capacity of the laser filament and qualitatively reflect the equivalent resistance of the laser filament; however, it cannot quantify the equivalent resistance of the laser filament. To measure the femtosecond laser filament equivalent resistance, the measurement principle, measurement accuracy, equivalent circuit, and measurement signal processing of the experimental measurement device must be considered. In this study, a method combining experiments and simulations is used. The experimental data are input into the simulation model, an expression for the femtosecond laser filament equivalent resistance is obtained, and the influence of the laser parameters on the femtosecond laser filament equivalent resistance is analyzed. We hope that this research method can characterize the electrical characteristics of femtosecond laser filaments under specific laser energies and focusing distances to provide parameter support for the application of femtosecond lasers in high-voltage fields.MethodsIn this study, the laser filament is injected into a plate-plate gap with a central opening, and a uniform electric field is applied between the plates. The sampling resistance and direct current (DC) voltage source are connected in series between the two plate electrodes to form a discharge circuit. The high-voltage probe is connected through the oscilloscope at both ends of the sampling resistance to obtain the voltage waveform of the sampling resistance. According to the circuit principle, the board-to-board discharge branch in the discharge circuit is equivalent to a discharge branch comprising resistance, inductance, and capacitance. The sampling resistance waveform measured in the experiment is input into the simulation model to obtain the parameter values of each equivalent element in the plate-plate gap discharge branch and the equivalent resistance of the laser filament in a uniform electric field.Results and DiscussionsThrough the joint analysis of experimental data and simulation, the equivalent circuit of the experimental circuit and the parameters of each element in the equivalent circuit are obtained. The waveform simulated in the equivalent circuit better simulates the wavefront characteristics of the sampled resistance voltage waveform in the experiment and has good follow-up to the subsequent waveform. The oscillation period and amplitude of the simulated waveforms are similar to those of the measured waveforms. According to the experimental data and simulation circuit, the characteristics of the laser filament equivalent resistance are as follows: the applied electric field and laser energy have a significant impact on the laser filament equivalent resistance. Under an applied electric field of 0.2-1.2 kV/cm and within 2-30 mJ laser energy, the laser filament equivalent resistance decreases approximately linearly with the increase in the applied electric field or laser energy, as shown in Fig. 2 and Fig. 3. The equivalent resistance of the filament formed by femtosecond laser-assisted focusing in the experimental circuit first decreases and then increases with an increase in the propagation distance of the filament. When the 2.7 mJ femtosecond laser filament passing through a 5 m focal length lens passes through a 2.5 cm discharge gap, the equivalent resistance corresponding to the propagation distance of the filament in the range of 473.6-501.6 cm is 457.5-9122.5 kΩ, as shown in Fig. 11.ConclusionsIn this study, a method for measuring the equivalent resistance of femtosecond laser filament is improved, which could give the measurement results more accurate physical significance, and the electrical characteristics of femtosecond laser filaments are studied in combination with a simulation circuit. The current characteristics of the femtosecond laser filament in a uniform electric field and the variation effect of the equivalent resistance of the filament channel in the circuit are obtained when the distance between the focusing lens and plate gap changes. This measurement method considers the influence of stray capacitance, laser filament inductance, and charging capacitance of the measuring device on the measurement results, and it can more accurately measure the equivalent resistance of the laser filament when the laser energy and focusing distance are determined to provide parameter support for the application of femtosecond lasers in the field of high voltage.
Mar. 10, 2023Vol. 50 Issue 5 0504002 (2023)
Siguang Zong, Xin Zhang, Shanyong Liang, and Jing Cao
ObjectiveShip wake is the disturbance of water flow caused by the propeller when the ship is sailing, drawing air into the water to form bubbles. In addition, the cavitation of the propeller itself also generates a large number of bubbles around the propeller, creating a wake belt full of bubbles in the stern of the ship. The optical characteristics of the wake differ from those of the surrounding water environment. By studying the laser characteristics of the ship wake, we can further judge the characteristics of the ship’s trajectory and speed in the sea and then realize the precise guidance and damage attack of underwater vehicles such as torpedoes. The bubbles in the ship wake have the characteristics of sparsity, discreteness, small scale, and low numerical density. The scale and number density are related to the ship speed, propeller speed, and distance from the measurement area to the ship. The laser detection method of ship wake must have the ability to sense bubbles with a large dynamic diameter range of 10-1000 μm, and it must adapt to different water environments.MethodsIn this study, the Monte Carlo simulation method is used to simulate the backscattering of wake bubbles with diameter of 40-500 μmin pure seawater, clean seawater, coastal seawater, and port seawater. To address strong water scattering interference in close range and low signal-to-noise ratio of weak signal detection in underwater laser wake detection, an anti-saturation and gain control signal processing method is studied. By adjusting the bias voltage to change the photocurrent gain of the avalanche photodiode, the APD (avalanche photo diode) gain can be controlled. An underwater microbubble laser measurement and analysis system that can suppress the strong scattering interference of near-field water is designed, and the matching adjustment between the APD receiving gain and the signal strength under different water environments can be realized.Results and DiscussionsThe backscattering law of wake bubbles in different seawater qualities is investigated. The echo amplitude of laser backscattering of wake bubbles in pure seawater is the strongest, and the amplitude of laser backscattering echo of port seawater is the weakest. With the increase in the water quality attenuation coefficient, the laser backscattering echo amplitude of wake bubbles gradually decreases (Fig. 3). With the increase in the distance, the backward laser echo of wake bubble gradually moves backward, and the amplitude gradually decreases (Fig. 5). When the bubble number density is below 109 m-3, the bubble echo amplitudes of pure, clean, and coastal seawater decrease with the increase in the bubble size. In the port seawater environment, the backward echo of bubbles always maintains consistency with the water signal. In the port seawater environment, when the bubble layer thickness is less than 1.8 m, the laser detection system faces difficulty in detecting the bubble echo. When the bubble layer thickness is greater than 1.8 m, the laser detection system can detect the bubble echo (Fig. 6). By designing an underwater micro bubble laser test and analysis system that can suppress the strong scattering interference of near-field water body, the detection of large-scale wake bubbles in different water environments can be realized (Figs. 10, 14, 15, 16).ConclusionsThe simulation results show that the echo amplitude of laser backscattering of wake bubbles in pure seawater is the strongest and the amplitude of laser backscattering echo in port seawater is the weakest. With the increase in the water quality attenuation coefficient, the laser backscattering echo amplitude of wake bubbles decreases gradually. With the increase in the distance, the laser backscattering echo delay of wake bubbles increases and the amplitude decreases gradually. When the bubble number density is below 109 m-3, with the increase in the bubble size, the bubble echo amplitude of pure, clean, and coastal seawater decreases in order, and the echo amplitude of port seawater maintains consistency with the water signal. In the port seawater environment, the laser detection system faces difficulty in detecting the bubble echo when the bubble layer thickness is less than 1.8 m, while the system can detect the bubble echo when the thickness is greater than 1.8 m. In the indoor laboratory environment, when the APD gain is 10 dB, the detection signal-to-noise ratio is the highest. In the anechoic pool environment, the bubble echo changes more evidently than the water background echo, effectively detecting the simulated bubbles with diameter of 20-30 μmand 100-300 μm. In the lake environment, the bubble echo changes more evidently than the water background echo, effectively detecting the bubbles in the wake of actual ships.
Mar. 10, 2023Vol. 50 Issue 5 0504003 (2023)
Chen Meng, Shan Gao, X. Steve Yao, Shengwei Cui, and Peng Hao
ObjectiveA non-polarizing beam splitter (NPBS) is commonly used in interferometer systems. Ideally, the NPBS can ensure consistency between the polarization state of the outgoing light and that of the incident light. However, because of defects in the actual process, the birefringence effect of NPBS has a non-negligible impact on the nonlinear error, polarization error, and measurement accuracy of the interference system. Therefore, it is necessary to measure the polarization sensitivity of an NPBS to compensate for the birefringence error. At present, the general system structure used to measure polarization sensitivity is relatively complex, and some methods require a combination of spectrometers or modulators and additional circuitry for measurement, which is cumbersome with respect to data processing and inconvenient to operate. In this paper, we propose a different method to measure the polarization sensitivity of NPBS, which has the advantages of fast measurement speed, simple system structure, efficient data processing, high repeatability, and can eliminate the influence of light source jitter, optical path system error, and PD responsivity inconsistency. This method is significant for evaluating the NPBS error to provide high-quality NPBSs for use in interferometer systems.MethodsNPBS polarization sensitivity measurements include transmittance/reflectance measurement and transmission/reflection phase difference measurement. First, the measurement principles of the four characteristic parameters affecting the polarization sensitivity of NPBS are introduced. Regarding transmittance/reflectance measurements, circularly polarized light is incident to the NPBS, and the intensities of the s- and p-polarization directions in the transmitted/reflected light are measured synchronously. The voltage values corresponding to the light intensity of s light and p light are obtained by photodetector. The measurement results are then normalized to suppress the influence of light source jitter, optical path system error, and PD response inconsistency on the measurement results. Regarding the phase polarization sensitivity measurement, we use a polarization measurement system (PSGA) to measure the S2 and S3 Stokes components of the transmitted/reflected light. Using the Stokes parameter method to calculate the phase difference can eliminate the effect of light intensity jitter. The relative values of the transmission/reflection phase difference of the s light and p light of the NPBS are then obtained by the difference method to eliminate the influence of the optical path system error.Results and DiscussionsThe accuracy of the proposed NPBS polarization sensitivity measurement method was verified experimentally. In terms of the verification of the transmittance/reflectance polarization sensitivity measurement system, the blank transmittance in air without NPBS was measured, and the transmittance after normalization correction was 1.0001, indicating that the transmittance/reflectance polarization sensitivity measurement of the system has good accuracy (error of 0.01%). This is an improvement compared to the result before normalization correction (3.32%) and clearly demonstrates the error correction effect obtained by normalization correction (Fig. 4). To verify the transmission/reflection phase difference polarization sensitivity measurement system, the measurement system was used to measure the phase retardation of the quarter-wave plate, and the measurement result deviated by 0.09° from the theoretical value of 90°, indicating the high measurement accuracy of the measurement system (Fig. 4). The polarization sensitivities of three customized NPBS samples were measured ten times repeatedly using the proposed measurement method. The measurement accuracy of the NPBS transmittance/reflectance is -0.08%-+0.08%, and the repeatability is better than 0.1%. The measurement accuracy of the NPBS transmission/reflection phase difference is -0.84%-+0.84%, and the repeatability is better than 1% (Fig. 5). These results demonstrate that the proposed measurement method has the advantages of good measurement stability and high measurement accuracy. Furthermore, the polarization sensitivities of the NPBS samples were measured at different incident wavelengths and incident angles. Within the range of 1540 nm-1560 nm, the change in the transmittance/reflectance was less than 0.02, and the transmission/reflection phase difference between s light and p light decreased with increasing wavelength (Fig. 6). When the incident yaw angle changes from -5° to +5°, the phase difference between s light and p light decreases (Fig. 7). The change in the NPBS reflection phase difference is larger than that in the NPBS transmission phase difference, indicating that the former is more sensitive to wavelength and angle changes.ConclusionsIn this paper, a method for measuring the polarization sensitivity of NPBS is proposed. The transmittance and reflectance are measured by simultaneously measuring the intensities of the transmitted/reflected circularly polarized light in the s- and p-polarization directions. The light source jitter, optical path system error, and error caused by inconsistencies in the detector response are eliminated through normalization correction. By using a polarization measurement system to measure the S2 and S3 Stokes components of the transmitted/reflected light, the s light and p light transmission/reflection phase difference of the NPBS can be obtained. Based on the above method, the measurement accuracy for transmittance and reflectance is -0.08%-+0.08% and the repeatability is better than 0.1%. The measurement accuracy of the transmission phase difference and reflection phase difference is -0.84%-+0.84%, and the repeatability is better than 1%. The proposed NPBS polarization sensitivity characteristic measurement method has the advantages of simple system structure, efficient data processing, high repeatability, and can eliminate the influence of light source jitter, optical path system error, and PD responsivity inconsistency. The method is significant for analyzing and compensating for the errors caused by an NPBS to obtain high-quality interferometer systems.
Mar. 10, 2023Vol. 50 Issue 5 0504004 (2023)
Jingbo Yin, Huangping Yan, Shengzhu Cao, Rui Zhou, Zijun Wang, and Yuanzhe Li
ObjectiveReflection, transmission, and absorption are several forms of interactions between light and matter. The reflected light caused by the refractive index difference between different media results in low energy conversion efficiency and signal interference. Therefore, reducing broadband reflection to improve transmission or absorption is crucial for improving the performances of optical components and optoelectronic devices. Currently, the main methods to achieve antireflection are the thin-film and micro-nano structure methods. However, a single-layer antireflection film can only act at a specific wavelength, whereas the material selection of a multilayer antireflection film is difficult. Simultaneously, the film thickness is strictly controlled, and there are certain thermal mismatch and mechanical stability problems among the multiple layers. Research on the micro-nano structure methods concentrates on the subwavelength antireflection structure, which is an ordered micro-nano periodic structure that can be equivalent to a dielectric layer with a gradual refractive index to eliminate refractive index mismatch. At present, research on subwavelength antireflection structures mostly focuses on adjusting the size parameters and distribution forms of existing geometric structures, such as cylinder, cone, and moth-eye structures. The optimal value is a special case for such structures. Alternatively, an improved structure is directly proposed based on the original structure, and its antireflection ability is compared with that of the original structure to prove its superiority. Both methods are based on the analysis of specific situations; therefore, proposing a general design method is useful for expanding the potential application of subwavelength antireflection structures.MethodsThe antireflection ability of different subwavelength structures is related to the forms of their equivalent refractive indices . In contrast to the above two methods, this study investigates the relationship between the equivalent refractive index of the subwavelength structure and antireflection performance. An equivalent refractive index expression with optimal antireflection performance is obtained. The equivalent refractive index can satisfy the expected expression when combined with geometric modeling, and the design requirements of a new structure with optimal antireflection performance in broadband can be achieved. In this study, the equivalent refractive indices of the cylinder, cone, and moth-eye structures are obtained using the equivalent medium theory. The reflectance curves of the three structures are obtained using the finite-difference time-domain (FDTD) method. According to the simulation results, the performance of antireflection is best when the equivalent refractive index curve is closest to the linear transition and there is no abrupt change at the top and substrate. To further improve the broadband antireflection of the subwavelength structure, a design method for the geometric structure and distribution form of a subwavelength structure that meets the ideal equivalent refractive index curve is investigated. The relationship between the equivalent refractive index and filling factor of the subwavelength structure is studied using a graphic method, and a single subwavelength structure whose equivalent refractive index is closest to the linear change is established by structural parameter control through three-dimensional modeling. Subsequently, a subwavelength array structure with no abrupt refractive index change at the top and substrate is obtained by adjusting its distribution form. Based on this, a cone-like structure design method with an ideal equivalent refractive index curve that meets the above two requirements is proposed.Results and DiscussionsThe triangular, tetragonal, and hexagonal pyramid structures that meet the design requirements are selected and compared with the moth-eye structure to verify the antireflection ability. The reflectances of four structures with the same size are compared using the FDTD method in the wavelength range of 300-1100 nm. Specifically, the diameters of the inscribed circles at the bottom of the microstructure are 200, 300, and 500 nm, and the aspect ratios are 1.0, 1.5, 2.0, and 2.5. The reflectances of the three structures are lower than that of the moth-eye structure when the aspect ratios are 1.5, 2.0, and 2.5, respectively (Figs. 9 and 11). All four structures achieve the lowest average reflectance when the aspect ratio is 2.5. Among these structures, the hexagonal pyramid structure exhibits the best antireflection performance (Figs. 9 and 11). When the diameter of the inscribed circle at the bottom of the microstructure is 500 nm and the aspect ratio is 2.5, the optimal average reflectance of the hexagonal pyramid structure (0.029%) is 22.5% of that of the moth-eye structure (0.129%) (Fig. 11). Under other conditions, compared with the optimal reflectance of the moth-eye structure, the average reflectance can still be reduced by nearly 70% (Figs. 9 and 11). Subsequently, two characteristic wavelengths (500 nm and 850 nm) are selected to further investigate the wide-angle antireflection performance of the cone-like and moth-eye structures. Overall, the three cone-like structures have an advantage over the moth-eye structure, among which the average reflectance of the tetragonal pyramid structure is reduced by 62% and 40% under two characteristic wavelengths, respectively (Fig. 12). According to the above results, the cone-like structure has the better antireflection performance.ConclusionsIn this study, based on the equivalent medium theory and finite difference time domain method, the equivalent refractive index curve and transition form when the subwavelength structure has the best antireflection performance are proposed. A design method for a series of cone-like structures based on this equivalent refractive index curve is proposed. The average reflectance of the cone-like structure in the wavelength range of 300-1100 nm is reduced by approximately 70% compared with that of the traditional moth-eye structure, with excellent antireflection performance. Meanwhile, the wide-angle antireflection ability of the cone-like structure is better than that of the moth-eye structure at the two selected characteristic wavelengths. The results demonstrate that the cone-like structures designed using this method have better antireflection performance than traditional subwavelength structures. In addition, when combined with advanced manufacturing technology, this design method has potential applications in the fields of ultra-precision optical chips, on-chip optical integration, and optical interconnections.
Feb. 25, 2023Vol. 50 Issue 5 0513001 (2023)
Shenghua Zhang, Guizhong Zhang, Guoyue Fu, Wei Shi, and Jianquan Yao
Theoretically, we can obtain the PMDs by solving the time-dependent Schr?dinger equation (TDSE); however, solving TDSE is difficult because of the microscopic process control to achieve the best nanoscopic physical picture. Therefore, the semiclassical theory becomes an alternative in numerical simulation. The distributed bouquet-like PMDs in momentum domains perpendicular to the laser polarization is relatively weak. However, this interference structure carries the characteristic information of the above-threshold ionization (ATI) and the inner-cycle interference (ICI) processes.Results and Discussions We used the SFA and the saddle point approximation theory to simulate the bouquet-like PMDs of hydrogen atom ionization under different laser intensities. The light intensity range was 3.5×10¹³-7×10¹⁵ W/cm2, as shown in Fig.1. The overall bouquet-shaped interference structure consists of various interference fringes: the ATI process-induced semicircle structure and the ICI process-induced partial circle structure. The interference of the electron wave packets generated by these two ionization processes results in the formation of bouquet-like PMDs. The coherent superposition between the ATI and ICI processes further turns these intersected circles into isolated island-shaped patterns.The ATI interference fringes are concentric semicircles with centers at px=0 and py=0. As the perpendicular momentum py increases, these fringes become highly monotonically denser in the PMDs. When the PMDs are converted from the momentum space to the energy space, the ATI interference fringes become horizontal with equal spacing. This spacing is equivalent to the single photon energy (Fig.2). We derive a formula for the quantitative description of the ATI interference fringes valid over the laser intensity range of 3.5×10¹³-7×10¹⁵ W/cm2.Although the ICI interference fringes are also partial circles, these interference fringes center at the symmetric positions on the parallel momentum px axis. The ICI interference fringes are generated from the electrons ionized at the laser peak and valley times within the same optical cycle. The centers of the ICI interference fringes are located symmetrically in the positive and negative parts of the parallel momentum axis px. When the light intensity increases, the ICI interference fringes become highly denser. We also obtained a formula to describe the properties of the ICI interference fringes.Additionally, we proposed an analog model of triple-slit interference in momentum space to better understand the formation of the bouquet-like PMDs. The wavefronts of electron waves that emanate from the middle slit form a set of concentric semicircles. These represent the ATI semicircles. The wavefronts of electron waves that ensue from the left and right slits form two symmetric concentric partial circles, representing the ICI partial circles. The intersections of these semicircles and partial circles are analogous to the interference maxima in the electronic bouquet-like PMDs (Fig. 4). Similarly, this intuitive model can help understand other interference processes in the strong field ionization of atoms and molecules.ObjectiveIn a stronger laser field, electrons move along different paths after ionization. This process involves two phases: first, the electron moves directly to the detector, and second, the ion scatters the other. Interference occurs when the electrons arrive at the detector with the same final momenta. Moreover, an interference structure in the photoelectron momentum distributions (PMDs) appeared. The interference structure encodes the dynamic information of electrons and the structural information of the parent ions, which are vital tools for studying the microscopic states of atoms and molecules in strong-field processes. Generally, these two kinds of ionized electrons are named reference electron: reaching the detector directly and being analogous to the reference light in laser holography, and the signal electron: returning to the parent ion and being scattered off by the ion and reaching the detector eventually, being analogous to the signal light in laser holography.MethodsThe study used the strong field approximation (SFA) theory and saddle point approximation method for investigations. Electrons are ionized at the peak of the laser field. In SFA, ionized electrons are affected only by the laser field, whereas the influence of parent ions is negligible. The final state of the ionized electron in the laser field was considered the Volkov state. It is simple to obtain the PMDs from the expression of the wave function amplitude of ionized electrons. We used the saddle point approximation method to calculate the bouquet-like PMDs. Moreover, we obtained the ionization time and rescattering time of the electrons and calculated the probability amplitudes by summing all the saddle points to obtain PMDs. Similarly, we carefully examined the bouquet-like PMDs produced by hydrogen atom ionization concerning laser intensity variations in the numerical investigation.ConclusionsWe performed an extensive numerical simulation of the bouquet-like PMDs induced by the stronger laser ionization of hydrogen atoms using SFA and saddle point approximation theories. The results show that the bouquet-like interference structure can be decomposed into semicircle-shaped interference fringes generated using the ATI process and partial-circle-shaped interference fringes obtained using the ICI process. We derived two analytical formulas using the classical action phase analysis to describe these two types of interference structures. These are valid over a relatively large laser intensity range. Furthermore, we proposed a physical picture of triple-slit interference in momentum space, which could help understand the bouquet-like PMDs, shedding light on studying electronic interference in strong field processes.
Feb. 25, 2023Vol. 50 Issue 5 0508001 (2023)
Zhonghua Guo
ObjectiveIsolated attosecond pulses provide an extremely high temporal resolution for studying ultrafast electron dynamics. The high-order harmonic generation (HHG) process by atomic or molecular gas targets remains the most efficient method for obtaining ultrashort isolated attosecond pulses in experiments. The harmonic spectra of molecular gas targets can be significantly extended and exhibit abundant and complex phenomena that merit attention and research. Because of the intrinsic dipole moment of asymmetric structured molecules such as CO, variations in molecular orientation in the laser field cause the ionization process to be very different, which can be used to modulate HHG and produce a supercontinuum spectrum. Furthermore, a two-color few-cycle laser drive can effectively enhance and control the ionization of molecules in the experiment, allowing the platform area to be extended and the intensity of harmonic radiation to be increased. The relative phase structure of the two-color field can be changed to further control and optimize its interaction with molecules. Based on the foregoing, this study investigates the effects of CO orientation differences and full relative phase modulation of two-color fields on achieving ultrashort isolated attosecond pulses.MethodsThis study calculates the attosecond pulse obtained by driving CO molecules to generate high-order harmonics in a two-color laser field using the extended Lewenstein model to the oriented molecule CO. The two-color line polarization fields are used in the calculations. One has a pulse duration of 9 fs, peak intensity of 2.0×10¹⁴ W/cm2, and wavelength of 1600 nm; the corresponding values of the other are 5 fs, 1.0×10¹³ W/cm2, and 800 nm, respectively. First, the microscopic ionization properties of CO molecules in the laser field with different orientations (molecular axis and laser field orientation angle from 0° to 180°) are considered in the case of a two-color laser field with a relative phase of 0. Then, after evaluating the intensity, conversion efficiency, and super-continuum of the plateau region under different conditions, the orientation angles 0° and 180° are chosen as representatives for the next step of the analysis. The effect of the change in relative phase on the molecular ionization is then induced at different molecular orientations by varying the carrier phase of the driving and control fields separately to analyze the mechanism of harmonic generation and the results for isolated attosecond pulses.Results and DiscussionsResults and Discussions Any relative phase can cause supercontinuum broadening of the harmonic plateau region at different molecular orientations. When the driving field s carrier-envelope phase changes and the molecular orientation is 0°, the ionization rates at different relative phases exhibit a double-peaked structure, with the intensity of each peak varying. At 0 and π, the ionization rate is the lowest (Fig. 3). When the molecular orientation is 180°, the ionization rate has a single-peak structure between the relative phases [0, π/2], whereas between [π/2, π], it has a double-peak structure with similar peak intensities, and the lowest ionization rate occurs at π/2. When the ionization rate is high, the cut-off energy for generating the HHG spectrum is low, and interference effects exist between the half-cycles, which makes acquiring ultrashort attosecond pulses difficult. This issue can be overcome by changing the carrier-envelope phase of the control field to yield shorter isolated attosecond pulses at a lower ionization rate (Fig. 6). As a result, ultrashort, isolated attosecond pulses can be easily obtained at lower ionization levels without constructing a specific relative phase to control the extent of field asymmetry (Fig. 4 and Fig. 7).ConclusionsBy driving CO molecules, two-color few-cycle laser pulses can achieve supercontinuum broadening of the harmonic plateau at any relative phase. Lower ionization rates are observed when the driving field s carrier-envelope phase shifts at molecular orientations of 0° and 180° with relative phases 0 and π/2, respectively. As a result, the plateau region s many harmonics were superimposed to produce isolated attosecond pulses with a duration of 94 as. Modulating the relative phase of the combined field causes a significant change in the ionization of electrons when the molecule orientation and laser field polarization direction adopt distinct orientations, making it simpler to construct a super continuous broadening plateau region with lower ionization rates. That is, the pulse emission energy can change more quickly over time, making it easier to obtain ultrashort attosecond pulses.
Mar. 10, 2023Vol. 50 Issue 5 0508002 (2023)
Yu Xie, Yuanci Gao, Shuyu Zhou, Su Fang, Tang Li, Ang’ang Liang, Wenwen Li, Mingshan Huang, Wenli Wang, Bin Wang, and Liang Liu
Results and Discussions The measured S-parameters are in good agreement with the simulation data in 100 kHz-150 MHz band (Fig. 4). The maximum deviation between the simulation and measurement results is less than 1 dB, the impedance bandwidth of the antenna ranges from 100 kHz to 127.1 MHz, and the relative bandwidth reaches 199.69%, which meets the demand of an ultra-wideband antenna. A cross-validation experiment is performed using a ring probe antenna for an RF field radiation test (Fig. 5), which proves the credibility of the RF antenna simulation results from the perspective of signal transmission. The electronic evaluations imply that the simulation results are credible and the antenna performance meets the design requirements. By exponentially fitting the evolution of the number of atoms at a low density (after 10 s) (Fig. 6), the atomic lifetime is found to be 1/γO.D.=(41.5±3.5)s and the derived background vacuum degree in the atomic region is found to be 2.1×10⁻⁸ Pa according to Equation (6), which is even better than that (5×10⁻⁸ Pa) of our previous ultra-high vacuum chamber with no RF antenna inside, indicating that our built-in antenna has little influence on the vacuum environment. The phase space density (PSD) rises while the temperature and atomic cloud size decrease with increasing power, and all of them begin to gradually level off after the power reaches 50% of full-load power (Figs. 7 and 8). When the excitation power is higher than 50% of full-load power, the difference in the final PSD is less than 1.27×10⁻⁶, and temperature is not more than 50 μK, implying that the evaporative cooling efficiency tends to saturate. These results indicate that the RF magnetic field strength meets the evaporative cooling requirements, the antenna excitation meets the task needs, and the design achieves a closed loop.ObjectiveAs one of the means to acquire degenerate quantum gases of ultracold atoms, radio frequency evaporative cooling is crucial for the realization of Bose-Fermi sympathetic cooling. To obtain ultra-cold quantum degenerate gases on a space station, we design a unique radio-frequency (RF) antenna built in a vacuum chamber. The universal ultra-cold atomic physics experimental system, which consists of cooling, detection, an optical trap, a magnetic trap, an optical lattice, a Feshbach magnetic field, an RF antenna and other devices integrated in the chamber, meets the stringent requirements of manned aerospace engineering in terms of size, weight, power consumption, reliability, and electromagnetic compatibility. In this study, we use finite element simulations to design and evaluate the antenna and experimentally verify its various performance indicators on a ground-based experimental platform. In addition to reducing the RF power requirement by 90%, this design can maintain an ultra-high vacuum degree and perform well in terms of electromagnetic compatibility, meeting the requirements of manned aerospace engineering.MethodsThis paper presents a standard engineering design flow of RF antenna system. First, a circular arc antenna prototype is set up to evaluate the design specifications. The prototype design is then modified to a single-turn multi-segment circular arc structure to match the actual cooling beams. The well-designed model is imported into the finite element analysis software, HFSS, to obtain the simulation results of the antenna’s S-parameters and the emitted RF field in the region of the cold atom cloud under different excitation conditions. After the antenna is assembled into the system, the electronic parameters of the antenna are measured by a vector network analyzer and compared with the simulation data to verify the reliability of the simulation results. Next, the influence of the antenna on the background vacuum of the scientific chamber is evaluated according to an atomic lifetime measurement experiment in the optical dipole trap. Finally, RF-induced evaporative cooling experiments are conducted to judge whether the antenna design meets the actual experimental requirements.ConclusionsIn the present study, a RF antenna design inside a vacuum chamber for Chinese Space Station applications is proposed. In addition to allowing the antenna to be closer to the atomic action area, this design also uses the absorption of the titanium chamber to reduce the crosstalk of RF signals and meet the electromagnetic compatibility design requirements. We model and simulate the antenna, with the results indicating that the RF intensity at the center of the magnetic field is approximately 60 mG under an excitation of 3 W signal, and the direct current component of impedance bandwidth of the RF antenna is 0-127.1 MHz. After assembly, we measure the vacuum pressure by the atomic lifetime method and use a vector network analyzer to test the S-parameters of the antenna. The antenna has little impact on the vacuum system, and the measured electronic performances are in good agreement with the simulation results. Finally, we use the antenna to perform RF-induced evaporative cooling in a quadrupole magnetic trap. Under an excitation of more than 1 W RF signals, the atomic temperature is less than 50 μK, and the PSD is increased by an order of magnitude. The experimental results show that the RF signal strength is fully saturated. The RF antenna design realizes a closed loop. This design could have applications beyond space, including gravimetric measurements, magnetometers, and optical lattice clocks.
Feb. 25, 2023Vol. 50 Issue 5 0512001 (2023)
Zhuowei Liu, Ziqin Li, and Zhigang Su
Results and Discussions When the noise intensity is 20000 counts/s, the signals after 200 counts are subjected to noise reduction processing. Compared with original data, the noise intensity and variance of preprocessed data decrease, and the noise distribution is transformed from a binomial distribution to a Gaussian distribution (Fig. 2). After noise reduction processing, the Gaussian filter distribution is determined using the Gaussian filter parameters. As the Gaussian filter width increases, its distribution becomes closer to the Gaussian distribution (Fig. 3). We further verify the effect of noise reduction on the detection performance using the Monte Carlo experiment, the results show that the detection probability of proposed method is 4-6 times higher than that of bin-grouping constant false alarm detection method [Fig. 6(a)]. Compared with current constant false alarm detection methods, the detection probability of proposed method increased by approximately seven times [Fig. 6(b)]. Based on actual experimental point cloud data, the noise reduction process can filter out many interference points (Fig. 8). Therefore, the weak target detection results with linear array radar data can be improved compared with the conventional method (Fig. 9). The detection results show that the highest detection probability increases by 7.4 times compared with D-CFAR [Fig. 10(a)]; moreover, the rate of change in the false alarm probability decreases [Fig. 10(b)].ObjectiveSince the development of single-photon radars, humans can detect more distant targets. However, the echo signals weaken, and the target detection technology requires urgent improvement. The target detection theory of single-photon LiDAR has been adopted from classical microwave radar. Many detection theories in classical radar have been transferred to quantum LiDAR and achieved good results, but research on single-photon LiDAR detection theory is not as advanced as that of classical radar. Current quantum laser detection methods still have limitations, such as the inability to precisely detect targets when the cumulative number of times is few; thus, it is difficult to detect echo targets with low signal-to-noise ratios. In addition, the current methods used to improve the detection probability are applied through signal-noise reduction, which in turn, complicates the detection process. Therefore, it is essential to improve the target detection performance at different accumulation times and noise intensities to overcome the shortcomings of the current detection methods.MethodsThis study focused on the target detection of photon-counting LiDAR in a noisy background. First, according to the echo characteristics of the single-photon LiDAR, noise reduction was processed using numerical comparison and a Gaussian filter, which significantly decreased the noise intensity while maintaining the echo target information. Next, based on the processed signal which has obeyed a Gaussian distribution, we applied CFAR to determine the target. In CFAR process, we proposed an algorithm to estimate parameters of target and noise more accurately, thus further improving the detection ability. Finally, the detection performance was verified through experiments and simulation comparisons.ConclusionsThis study demonstrates that the target can still be detected with a high detection probability in the case of strong noise or weak echo signal. Compared with the conventional methods, the proposed method improves the average detection probability of the target by 40% in the same signal-to-noise ratio environment, and the noise intensity is decreased.
Mar. 10, 2023Vol. 50 Issue 5 0512002 (2023)
Yonglang Lai, Chaoxia Zhang, Yazhe Cheng, Zhe Liu, Jing Zhang, Kui Liu, Hengxin Sun, and Rongguo Yang
Results and Discussions In the experiment, the piezoelectric ceramics were loaded with signals of 600, 700, 800, and 900 kHz, and the influence of low-frequency noise on displacement measurements was explored (Fig. 4). The results show that the noise in the measured noise power spectra in this frequency band remain higher than the shot noise reference, although no signal less than 600 kHz is loaded on the piezoelectric ceramics. This is because a variety of noises in the experimental environment, such as those from mechanical vibration, beam pointing, and laser intensity, affect the measurement results. In the experiment, the signal changes under different driving voltages were measured at a center frequency of 2 MHz. Upon adjusting the driving voltage, the noise in the power spectrum of the signal light at 2 MHz is 3 dB to 7 dB higher than the shot noise baseline (Fig. 7). At 2 MHz, the signal-to-noise ratio can be increased by increasing the optical power of the signal (Fig. 9). In the experiment, by changing the driving voltage amplitudes under different signal powers, the noise in the signal light is set 3 dB higher than the shot noise. The measurement results show that the minimum measurable displacement of the system decreases with an increase in the optical power of the signal. When the signal light power is 90 μW, the minimum measurable displacement is 0.176 nm.ObjectiveMeasurement has always been important in science; the improvement of precision measurement technology can facilitate the exploration of the micro world and has great significance in daily life and production activities. Atomic clocks, for example, can accurately measure time and frequency, which is crucial for coordinating information systems. Similarly, the accurate measurement of displacement is important. For example, the measurement of beam lateral displacement can be used in many fields, such as in atomic force microscopy, optical imaging, space satellite position stability, optical tweezers, and biological measurements. In displacement measurement, noise interference from mechanical vibration, beam pointing, laser intensity, and other factors is inevitable. These noises affect measurement results and increase the difficulty of measurement. However, most of the noise is concentrated at low frequencies. To improve the signal-to-noise ratio of beam lateral displacement measurement, we test the influence of signal optical power on beam lateral displacement measurement. We prove that increasing the power of the light signal can improve the signal-to-noise ratio of beam lateral displacement measurement and reduce the minimum measurable displacement.MethodsFigure 3 shows the experimental devices. An all-solid-state single-frequency laser outputs infrared light with a wavelength of 1064 nm through a Faraday optical isolator and phase modulator. A beam splitter then divides the infrared light into two parts. One part of the laser generates a TEM00 mode signal through mode conversion cavity 2 (MC2). The other part uses mode conversion cavity 1 (MC1) to generate the TEM00 mode required for interference adjustment or TEM10 mode as background light. MC1 and MC2 are locked by two sets of electronic servo systems. Before the displacement measurement, the TEM00 mode is outputted by MC1, and its power is adjusted to the same level as that of the signal light. Simultaneously, a high-voltage amplifier is used to drive a piezoelectric ceramic 1 (PZT1) to control the local light phase of a balanced homodyne detection system, and the interference visibility of the two beams is then adjusted to ensure high coincidence of the two beams after passing through the beam splitter. Following the interference visibility adjustment, the TEM10 local light generated by MC1 is locked with the power of 1 mW, and the TEM00 signal light generated by MC2 is locked with the power of 50 μW. PZT2 is driven by a sinusoidal signal outputted by an arbitrary waveform generator to produce a small optical transverse displacement. The noise power spectra of signal light under different measurement conditions can be obtained by changing the signal optical power or adjusting the frequency and intensity of the signal source.ConclusionsIn this study, the minimum measurable displacements at different frequencies from 0 Hz to 3 MHz are tested, and the signal-to-noise ratios obtained at 2 MHz for different driving voltages are measured. The changes in the signal-to-noise ratio and minimum measurable displacement of the signal light for different powers are investigated. This study will promote research on methods and techniques for improving the extent of beam lateral displacement measurement and provide a theoretical and experimental basis for the application of beam transverse displacement measurement.
Feb. 25, 2023Vol. 50 Issue 5 0512003 (2023)
Jinghan Gao, Daojing Li, Kai Zhou, Anjing Cui, Jiang Wu, Yefei Wang, Kai Liu, Songnian Tan, Yang Gao, and Yuan Yao
Results and Discussions Based on the three beam expansion methods proposed in this study, the experimental prototype expanded the transmitted beam to 5 mrad in the elevated direction under the condition of beam expansion by a cylindrical lens (Fig. 6). Simultaneously, in the defocus beam expanding mode, to realize coherent detection of the laser echo signal based on the all-fiber optical path, a fiber collimator with a high-order phase beam expander is used to bring the field-of-view of the 3 mrad laser echo signal into a single-mode polarization-maintaining fiber with a core diameter of 9.5 μm (Fig. 3). The echo signal is further received by the optical fiber collimator array with a high-order phase spherical lens, the overlapping field-of-view of 0.5 mrad is realized, and the total receiving field-of-view of the system is 5.5 mrad (Fig. 4). In the case of beam expansion, the chimney at 1.1 km and the high-reflectivity target at 5.4 km are detected. After multipulse coherent accumulation and self-focusing processing, the signal-to-noise ratio is greater than 30 dB (Figs. 12 and 13), which satisfies the requirements of high-resolution imaging.ObjectiveTo ensure a detection range, the receiving telescope of lidar should adopt a larger aperture to receive more echo energy. When receiving with a single-element detector, increasing the receiving aperture typically reduces the receiving beam width. Array detectors are commonly used to receive wide field-of-view echo signals to achieve a wide receiving beam and form a large observation width. Considering an optical system with a 100 mm aperture and 480 mm focal length as an example, it is assumed that a single-element detector with a photosensitive surface size of 9.5 μm is used for reception. For a central wavelength of 1.55 μm, the corresponding receiving beam width is approximately 20 μrad, which is close to the diffraction limit. The size of the detector array required to cover a receiving field-of-view of 3 mrad is 150×150, resulting in a sharp increase in the number of LiDAR channels with a coherent detection system and an extremely complex technical implementation of the system. The size of photosensitive surface of the single-element detector increases to approximately 1 mm. In principle, one channel can realize the reception of a wide field-of-view laser echo signal.MethodsReceiving beam broadening can realize the function of a detector with a large photosensitive surface. Receiving beam broadening can be realized at the primary lens or the feed, and the method of realizing receiving beam broadening at the feed can include the common aperture function of the primary lens. Following references [5-6] and the feed beam expansion method, three receiving beam broadening methods, including defocus beam expansion, cylindrical lens beam expansion, and wavelength-conversion beam expansion based on a membrane diffractive lens, are proposed. A simulation calculation was performed. Some verification results are provided in combination with the development of the actual system. In addition, considering the problem of receiving gain reduction caused by beam expansion, the working distance equation of LiDAR in the case of beam expansion is also provided in this paper, and the analysis and verification are conducted based on experimental data.ConclusionsThe LiDAR prototype developed in this study utilized the lightweight and thin characteristics of the membrane diffractive lens to realize the lightweight and large aperture of the receiving system. Combined with the receiving beam expander system, the targets at 1.1 and 5.4 km were detected using the receiving beam expander system. These results indicate that the proposed method is effective. Under the condition of a large receiving aperture, combined with transceiver beam broadening, it can not only reduce the number of receiving channels but also ensure the imaging resolution and long-distance detection signal-to-noise ratio, as well as obtain a large instantaneous observation width. It is of great significance to continue relevant research, which is expected to meet the requirements of long-distance, wide-range, high-resolution imaging. The decrease in the receiving gain caused by the receiving beam expansion can be compensated by adding amplifiers to the electronics. At present, electronic amplifiers with a gain of 40-50 dB are very common, and a reasonable design of the system parameters is of great significance.
Mar. 10, 2023Vol. 50 Issue 5 0510001 (2023)
Guoqing Ma, Changhe Zhou, Rongwei Zhu, Fenglu Zheng, Junjie Yu, and Guohai Situ
SignificanceDeep learning (DL) has become a powerful driving force in the era of intelligence and has been widely used in computer vision, speech recognition, natural language processing, etc. However, more than 80% of calculations in DL are matrix-matrix multiply-accumulate (MM-MAC) operations. Large-scale MM-MAC operations result in a large number of memory access requirements when the algorithm is converted into CPU-executable code. Limited by the von Neumann architecture of electronic computers and the physical constraints of the interconnection limit of copper wires on a chip, the training efficiency and speed of deep neural networks (DNNs) are severely restricted. According to the research of de Lima et al., the computing power required to train state-of-the-art DNNs doubles approximately every 3.5 months, far exceeding the computing power supply of electronic integrated circuits (EICs) that follow Moore’s Law.Compared to traditional electronic computing, optical computing is expected to build artificial intelligence (AI) accelerators with high computing power and energy efficiency ratio owing to the high parallelism, high speed, and low power consumption of photons. Currently, various optical computing architectures have demonstrated advantages in terms of high computing power and energy efficiency ratio, and their development routes can be divided into two types. One route is to realize dedicated optical information processing based on multidimensional optical signal modulation and to primarily focus on analog optical computing, such as multiply-accumulate (MAC) operations, convolutions and correlations, differentiation and integration, Fourier transform, and optical neural networks (ONNs). The other route is to use the conception of electronic computers to design digital optical computers, such as optical transistors, optical logic devices, optical directed logic operations, space-time parallel coding, and ternary optical computers. Additionally, some important supporting technologies such as optical interconnections, optoelectronic copackaging, optoelectronic heterogeneous integration, and three-dimensional advanced packing have been widely used to improve the performance of electronic computers.In general, owing to the lack of efficient and reliable weak-light nonlinear optical effects and optical logic devices, it is difficult for photons to realize general digital logic computers like electrons. In addition, the technology that uses photons to store information has not been proven effectively, which implies that photons cannot independently complete the entire process between memory and computing, and all-optical signal processing is still challenging to achieve. Therefore, from electronic information storage to photonic information loading or from photonic information loading to electronic information storage, high-precision and high-speed parallel electronic control systems and analog-to-digital conversion circuits are still required to fully utilize the parallelism of optical computing. Currently, optical computing is primarily based on linear analog computing, and its computing accuracy is sufficient to build practical high-performance AI accelerators. Moreover, by developing suitable coding schemes, parallel algorithms, and architectures to further fully utilize the parallelism of each dimension of photons, photons are expected to provide a computing power density and energy efficiency ratio that exceed those of electrons on the same footprint. Furthermore, a high computing accuracy can be realized even with error-sensitive photonic devices and optical systems. Although binary electronic logic computing can simulate various practical physical scenarios with a sufficiently high computational accuracy, the ever-increasing computational load will significantly increase power consumption. Optical computing is expected to build high-performance and high-energy-efficiency fuzzy parallel computing systems similar to the human brain with limited computing precision.ProgressThis review analyzes and discusses mainstream optical computing technologies from the perspective of analog and digital optical computing, aiming to guide the development of optical computing. First, we introduce three main technical paths for solving the bottleneck of computing power supply and power consumption in the post-Moore era (Fig.1). Additionally, we indicate that optoelectronic computing or all-optical computing is the most promising method for building the next generation of human-like fuzzy parallel computing systems with high computing power and energy efficiency (Fig.2). We then summarize the advantages and disadvantages of analog and digital optical computing (Table 1) and discuss the main progress and representative achievements of optical computing at different stages, including early optical computing (Fig.3), integrated optical computing (Fig.4), free-space interconnected optical computing (Fig.5), and multi-imaging-casting architecture (Fig. 6). On this basis, we describe the limitations and key technical bottlenecks facing the further development of optical computing. Finally, we discuss future trends and directions of optical computing.Conclusions and ProspectsThe route of imitating the digital electronic computer to construct a general computer for photonic logic is severely limited by optical logic devices. Currently, the focus of optical computing should be on special application scenarios that take full advantage of optical parallelism and are challenging to solve by electronic computing. From a long-term perspective, in addition to AI technology, the contradiction between the strategic goal of carbon neutrality and the significant energy consumption of data centers that provide high computing power for the rapidly increasing data processing requirements will continue to aggravate. Before the advent of practical quantum computers, the development of energy-saving, highly efficient, and high computing power optoelectronic intelligent computing is the most promising solution.
Mar. 10, 2023Vol. 50 Issue 5 0500001 (2023)
Jun Wang, Jianying Zhong, Wei Ke, Fan Yang, Xiaomin Zhao, Jinxi Hu, Huan Yuan, Aijun Yang, Xiaohua Wang, and Mingzhe Rong
Results and Discussions The experimental results show that the spectral intensity of the characteristic line Cu Ⅰ 521.8 nm does not show a monotonic relationship with the ambient pressure, and there is an obvious interval effect, as shown in Fig.4. The spectral intensity decreases with the ambient pressure in the range of 10-2-1 Pa, increases with the ambient pressure in the range of 1-104 Pa, and decreases again with the increase in ambient pressure in the range of 104-105 Pa. The radiation lifetime of the characteristic line Cu Ⅰ 521.8 nm is analyzed, and the results show that the radiation lifetime of the characteristic line Cu Ⅰ 521.8 nm increases with the ambient pressure. As shown in Fig.8, the spectral intensities of the characteristic spectra of the gaseous elements N, H, and O are monotonically related to the ambient pressure. The spectral intensities of the characteristic spectra of the gas elements increase monotonically with the ambient pressure owing to the increase in the particle number density of the ambient gas and the enhancement of the restriction effect of the ambient gas. However, the characteristic spectral intensities of the gas elements N, H, and O have different attenuation rates with delay time owing to the different molecular bond energies of different gas elements. Among them, the characteristic spectral intensities of N have the fastest attenuation with the delay time, followed by H, and O has the slowest attenuation. The results show that the radiation lifetime of the characteristic spectra of gaseous elements increases with an increase in atmospheric pressure. Furthermore, it is found that the lowest pressure at which the characteristic spectra of gaseous elements can be detected is not the same, in which the characteristic spectra of N can be detected only when the ambient pressure is greater than 10 Pa, while the characteristic spectra of H and O can be detected at a pressure of 10-2 Pa. The signal-to-noise rate (SNR) analysis of the gas element LIBS signal shows that the SNR of the N, H, and O gas element LIBS signal changes with the delay time in the same way, which increases first and then decreases with the delay time. However, the time required to obtain the maximum SNR of the gas-element LIBS signals is not completely consistent but is roughly between 500 ns and 1000 ns. The maximum SNR of the LIBS signals of each gas element is inconsistent at different ambient pressures, and the maximum SNR of the O element reached 19 when the air pressure was 105 Pa and the delay time was 1000 ns.ObjectiveLaser-induced breakdown spectroscopy (LIBS) technology has attracted the attention of numerous researchers since its inception. It has been widely used in material analysis owing to its advantages such as high detection speed, small sample damage, no sample preparation, and online analysis. It has applications in fields such as material detection, element analysis, deep space exploration, and various other fields. However, current studies on LIBS mainly focus on the LIBS signals of target material elements, and there is little analysis of the LIBS signals of environmental gas elements. In the laser-induced plasma process, the high-energy pulse laser will not only excite the target material elements but the ambient gas elements near the target surface will also be excited by the high-energy pulse laser, resulting in a unique LIBS signal of the ambient gas elements. Therefore, the laser-induced plasma process is related to not only the target material elements but also environmental gas elements. The laser plasma expands rapidly after it is generated and interacts with the ambient gas during the expansion process. The plasma expansion process is significantly influenced by the types of gases and air pressure environments. High-pressure ambient gases restrict the expansion of the plasma and affect its spectral radiation. Both the laser-induced plasma and the plasma expansion processes can be significantly impacted by ambient gas. The variation in the target element LIBS and the gas element LIBS signal with air pressure and delay time is of major significance for understanding the influence of ambient gas on laser-induced plasma.MethodsNd∶YAG laser with wavelength of 1064 nm and pulse width of 10 ns was used to irradiate Cu target without O and with Cr, Fe, Cr elements to generate plasma. The pulse laser energy and repetition frequency were set to 50 mJ and 1 Hz, respectively. Pulsed laser was reflected by two mirrors and then focused by a focal lens with a focal length of 100 nm on Cu target in the vacuum cavity. Mechanical and molecular pumps were used to realize the experimental vacuum degree of 5.5×10⁻⁵-1.0×10⁵ Pa. The characteristic spectra of the target elements Cu, N, H, and O in laser plasma were analyzed by collecting plasma spectra from the normal direction of the laser incident plane. The variation in the characteristic spectra of the target element Cu and gas elements N, H, and O in the laser plasma with ambient pressure and delay time was studied.ConclusionsThis work can help understand the influence of ambient gas elements on laser plasma and on the optimization of the experimental parameters of LIBS technology.
Feb. 25, 2023Vol. 50 Issue 5 0511001 (2023)
Chengjie Liang, Xiangyang Pang, Mingying Sun, Huai Xiong, Wenfeng Liu, and Jianqiang Zhu
ObjectiveOptical products are often coated with a sol-gel antireflective film that has a porous structure with a tendency to adsorb organic contamination easily. This reduces their performance in terms of transmittance and laser-induced damaged threshold (LIDT). Hence, organic contamination volatilized from non-metallic materials under a high vacuum environment poses a significant limitation on the output capacity of high-power laser systems. In this study, we investigate the influences of the surface deposition of organic contaminations on the surface morphology and roughness, transmittance and LIDT at 355 nm for 3ω sol-gel antireflective film quantitatively. Based on the experimental results, we discuss the mechanism by which the organic contamination influences the performance of sol-gel antireflective coating. Finally, we propose two measures to reduce organic contamination in high-power laser systems, which serves as a basis for improving the cleanliness and output capacity.MethodsThe experimental section was divided into three parts: sample preparation, optical properties characterization, and laser-induced damage test and characterization. First, an experimental vacuum device was set up to simulate the deposition of organic contamination released from non-metallic materials onto optical elements surface in high-power laser systems. The deposition of the organic contamination on the sol-gel antireflective coating was precisely controlled using a heating evaporation chamber. The volatilization of organics was measured using a high precision balance, and the surface mass density of organic deposition was calculated by the principle of angle factor equal division. The second step was to characterize and compare the optical properties of samples before and after contamination. The surface morphology of sample was observed using scanning electron microscope (SEM), the surface roughness was determined using atomic force microscopy (AFM) and the transmittance was measured using LAMBDA 900 UV spectrometer. The last step was the damage test and morphology characterization. Nanosecond laser damage testing platform was used to measure the LIDT at 355 nm. The damage morphology of the coating was characterized using an optical microscope.Results and DiscussionsWe prepared four groups of samples with different surface deposition qualities using the experimental vacuum contamination device. Based on SEM images of samples before and after contamination, we found that a “mist” was formed on the coating after contamination, which reduced the resolution of the surface topography (Fig.4). It proves that organic molecules in the evaporation chamber were volatilized, diffused and deposited on the sol-gel antireflective coating. When the surface deposition quantity was low, such as in Group 1, the surface roughness decreased from 2.785 nm to 2.453 nm. This may be due to the small amount of organic contamination molecules filling in the pores of the sol-gel antireflective film. As the amount of organic contamination deposited on the sample surface increased, the surface roughness also gradually increased. Here, the organic molecules not only filled the pores, but also accumulated on the film surface (Fig.5 and Fig.6). With the increase in deposited mass, the transmittance and LIDT at 355 nm of sol-gel antireflective coating decreased gradually [Fig.7, Fig.8, Fig.9(b)]. When the surface mass density of organic deposition in Group 1 was 1.665 mg/m2, the sample was not damaged. This indicates that the NVR cleanliness class A/10 meets the cleanliness requirements of high-power laser systems [Fig.9(b)]. The damage morphology was observed under an optical microscope. In Group 1, the low-fluence damage morphology was all subsurface-defects induced by substrate damage, leading to film protrusion or rupture that presents as a white-color morphology. The damage morphology of Group 4 samples with the higher surface deposition was significantly different from that of Group 1, indicating that organics played an important role in the damage initiation. When the amount of deposited organic contamination was high, both the film and the substrate of the sample surface were damaged. The morphology of the damage site was irregular and the edge showed thermal ablation contours (Fig.10). With increasing laser fluence and constant deposition quantity on the sample surface, the area of damage sites increased gradually. For Groups 1 to 3, the area of the damage sites of the sample before and after contamination hardly changed, whereas in Group 4 it was significantly larger after contamination. The deposition quantity of organic contamination on the sample surface in Group 4 was high, therefore, the absorption of laser energy by the organics caused strong thermal effect, leading to a larger damage site with smoother contours (Fig.11).ConclusionsIn this study, an organic mixture of C30H62 and C24H38O4 with mass ratio of 17∶3, a common contamination in high-power laser systems, was selected as the contamination source. The influence of different contamination quantities on the properties of sol-gel antireflective coating was studied quantitatively. The interaction between organic molecules and porous structures influences the optical properties, where the size of organic molecules, refractive index and deposition quantity determine the change in properties. The extent of damage was related to the absorption of organic molecules, deposition quantity of organic contamination and surface defects. First, organic contamination deposited on the coating increased the surface roughness of the film and changed the morphology of the film. As organic molecules filled the pores of the film, the equivalent refractive index was increased, which reduced the transmittance and enhanced the intensity of stray light. Second, the organics on the surface of the thin film had stronger absorption characteristics of laser energy than the substrates. Both these factors can easily lead to laser damage. Finally, to reduce the influence of organic contamination in the high-power laser system on the performance of sol-gel antireflective film, we proposed two measures to improve the cleanliness of the high-power laser systems.
Mar. 10, 2023Vol. 50 Issue 5 0503101 (2023)
© Copyright 2018-2021 | Chinese Laser Press.
All Rights Reserved 沪ICP备15018463号-20