


Please enter the answer below before you can view the full text.

Tianqi Zheng, Chen Wang, Kaihui Wang, Junjie Ding, Bowen Zhu, Bohan Sang, Wen Zhou, Lei Shen, Lei Zhang, Ruichun Wang, Changkun Yan, and Jianjun Yu
ObjectiveIn recent years, the explosive growth of data volume has challenged the backbone transmission network whose core technology is optical fiber transmission. In the past, single-mode fiber transmission has long been the first choice for large-capacity and long-distance transmission due to its low loss and high bandwidth. Till now, single-mode fiber still occupies most of the optical transmission networks. However, the rate of single-mode fiber transmission which combines polarization division multiplexing (PDM) and wavelength division multiplexing (WDM) technologies is limited to 100 Tbit/s. It becomes weaker and weaker in the face of the expected increase of several orders of magnitude in the demand for transmission rate. With the emergence of more mature mode division multiplexing (MDM) and demultiplexing technologies, low-dispersion, low-loss few-mode fibers (FMFs), and more advanced digital signal processing (DSP) algorithms, it becomes possible to use few-mode fibers to achieve greater capacity and longer distance transmission.MethodsOur few-mode transmission experiment uses a self-developed graded few-mode fiber that can transmit six modes. In the experiment, we choose two modes of LP11a and LP11b for transmission. Compared with other modes, the LP11 mode has a lower loss, and this kind of few-mode transmission can perform power control and dispersion control more easily than the few-mode transmission of different linear polarization modes. The transmission distance of each loop is 50 km, and 1000 km transmission is achieved by transmitting 20 loops. In terms of the experimental setup of the long-distance few-mode fiber loop experiment, at the transmitting end, 80 laser sources with a frequency interval of 50 GHz output a total of 80 carriers through the arrayed waveguide grating control. The two IQ signals output by the arbitrary waveform generator modulate the WDM signal of 79 channels and another test signal in the IQ modulator respectively, and then a section of decorrelation signal is generated through the delay line and is used to perform polarization division multiplexing. After being amplified by the erbium-doped fiber amplifier (EDFA), it is divided into two independent signals through delay and de-correlation again, and then multiplexed and transmitted by the mode multiplexer in the loop.After entering the loop, the two independent signals are mode multiplexed and modulated in two modes of LP11a and LP11b in the mode multiplexer and output. The ring includes 50 km of few-mode fiber, mode multiplexer/demultiplexer, EDFA, wavelength selective switch (WSS), and acoustic-optic modulator (AOM). EDFA balances the optical power of each mode signal, and WSS controls the flatness between channels of each mode signal after the EDFA power balancing. The dispersion of the FMF link in all fiber modes is about 21.01 ps/(nm·km), and the effective area of the used fiber is 121 μm2 when transmitting the LP11 mode. After 20 FMF loop transmissions for a total of 1000 km, the measurement channel signal is selected using a wavelength division multiplexer, and the coherent optical receiver detects the signal. The detected signal is captured by an oscilloscope with a sampling rate of 80 GSa/s and processed by DSP. In order to reduce the number of oscilloscope input ports, we use heterodyne coherent detection, so we only need to use a 4-channel oscilloscope to achieve coherent detection of two-mode signals. The frequency difference between the local oscillator signal and the detected transmission signal is about 18 GHz.In offline DSP, the signal passes through frequency domain dispersion compensation, down-sampling (retaining twice the symbol rate), clock recovery, multiple-input multiple-output (MIMO) frequency domain least mean square (FDLMS), MIMO time domain least mean square (FTLMS), carrier phase recovery, and direct decision least mean square (DDLMS) in sequence and quadrature amplitude modulation (QAM) demapping and bit error rate (BER) calculation.Results and DiscussionsWe experimentally tested the transmission performance of the two modes (LP11a and LP11b) under different optical signal-to-noise ratios (OSNRs) and compared them with additive white Gaussian noise (AWGN) channel simulation tests. In the interval of the OSNR of each channel in the experiment, the BER is close to the theoretical channel result under the condition of low signal-to-noise ratio (SNR). Since the crosstalk between modes and polarizations is dominant in the noise when the SNR is relatively high and cannot be completely eliminated, it may lead to a large difference between the BER performance and the theoretical value when the SNR is high.We tested the C30 channel BER performance of the two modes under back-to-back (BTB) case and transmission distances of 250 km, 500 km and 1000 km, respectively. After adding the frequency- and time-domain joint algorithm called MIMO-FTDLMS, even with the huge inter-channel symbol interference caused by the other three-way crosstalk and the channel state changes caused by the inevitable disturbance superposition of each channel, every channel can be effectively recovered. This greatly shows the effectiveness of the algorithm in multimode transmission. Likewise, both modes exhibit similar performance in transmission, and the BER is less than the low-density parity check (LDPC) soft decision threshold of 28% redundancy at all transmission distances. In the experiment, the BERs of 80 channels, two modes and two polarization multiplexing signals transmitted over 1000 km are all below the soft decision threshold, thus the total net transmission rate is 32 Tbit/s.The excellent performance of the system benefits from the two-stage cascaded MIMO equalization algorithm and self-made low-loss, low-dispersion few-mode fiber. This few-mode long-distance transmission system provides a new solution for the next generation optical backbone network transmission. At the cost of algorithm complexity at the receiving end, the quaternary phase shift keying (QPSK) format used in traditional long-distance transmission is replaced by 16QAM with higher spectral efficiency. In addition, less costly few-mode fibers are used at the same rate for spatial multiplexing.The main limitation of the current system is the complexity of the algorithm. The least mean square (LMS) algorithm in the cascaded time-frequency domain will bring a large delay to the system, and the algorithm needs to be optimized in terms of feedback structure and parallelism.ConclusionsOur experimental design verified the transmission of the WDM-MDM-PDM-16QAM system over a 1000 km few-mode fiber. By adjusting channel flatness through WSS, and using MIMO-TDLMS and MIMO-FDLMS two-stage MIMO algorithms for channel equalization at the receiving end, we finally achieve a transmission rate of 32 Tbit/s with 80 channels of two-mode and dual-polarization signals. After the transmission system is combined with multi-core optical fiber, it is expected to achieve a transmission rate increase of 1?2 orders of magnitude.
Dec. 10, 2023Vol. 50 Issue 23 2306001 (2023)
Yibin Zhang, Rujie Deng, Heshan Liu, and Ziren Luo
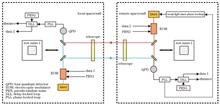
ObjectiveThe Taiji program consists of three satellites that form an equilateral triangle with a side length of 3 million kilometer. The main scientific goal is to detect gravitational wave sources, such as the merger of medium-mass black holes and the rotation of medium-mass black hole binaries. The Taiji program uses laser interferometry to measure small shifts between stars caused by gravitational waves. Limited by satellite loads, laser interferometry systems must be highly integrated with the measurement systems. First, the laser communication link transmits data from the two satellites to the main spacecraft. After preprocessing is completed, the scientific data are transmitted to the ground station. The main requirement of the Taiji program laser communication is real-time communication, with a bit error rate of less than 10-6 and a rate of more than 15 kb/s. To meet the needs of the Taiji program inter-satellite laser communication, a communication scheme and system parameter design based on a phase meter system are proposed in this paper. An experimental verification system is planned to be set up under laboratory conditions to verify the rationality of the designed parameters and implementation of the scheme.MethodsThe validity of the proposed method was verified under laboratory conditions by setting up a ground electronic simulation system. To more closely simulate the actual transmission process of inter-satellite laser communication links, a ground optical verification system was built in this study. To fully simulate the actual situation of inter-satellite laser communication, the ground optical verification system was divided into three parts: spread-spectrum modulation, link transmission, and phase demodulation. Modulation and demodulation were completed on K7-FPGA (field programmable gate array, FPGA). Link transmission was performed using a laser with a wavelength of 1064 nm. In this experiment, the communication codes and the pseudo-random noise (PRN) code were modulated to the laser phase using a direct sequence spread spectrum at the transmitting end. This information was sent to the receiving end through a laser link. At the receiving end, a phase-locked loop (PLL) was used for carrier synchronization, and a delay‐locked loop (DLL) for code synchronization, completing the communication function.Results and DiscussionsThe demodulation performance is evaluated in this study by measuring the error rate of the mixed code parsing. The mixed codes are transmitted in three experiments, and the correct and incorrect numbers are counted. The test results indicate that the average error probabilities of the electronic and optical systems are 0.20% and 1.3%, respectively. This is mainly because the filter has a wide transition band. If the sampling decision is made in the transition zone, phase ambiguity can easily occur. This phenomenon leads to sampling decision errors that affect the demodulation performance. In addition, the background noise caused by the components and environment of the system is the main cause of mixed code errors, which are widely found in optical and electronic systems. Noise in an optical system is significantly higher than that in an electronic system. Therefore, the error rate of mixed code analysis in an optical verification system is much higher than that in an electronic system. The communication bit error rate was then measured to evaluate the communication performance of the entire system. The test results show that when 106 codes were transmitted by the electronic simulation and optical verification systems, the number of correct codes received by the three tests is 106. The experimental results show that a ground verification system based on the requirements of the Taiji program inter-satellite laser communication can be effectively integrated with a phase meter system. The parameters of the communication system designed in this study are verified to be reasonable. Under the condition that the communication bit rate is 19.5 kb/s, the bit error rate of the communication system is within 10-6, which can meet the requirements of the Taiji program.ConclusionsBased on the current phase meter system, an inter-satellite laser communication scheme is designed in this study using system parameters according to the requirements of the Taiji program. In this paper, a scheme for inter-satellite laser communication is described in detail and the reasons for the selection of various system parameters are analyzed. In addition, the validity of the modulation and demodulation system based on the FPGA are verified using an electronic simulation system. Then, the rationality of the laser communication system parameters and scheme is verified using an optical system. The communication error rate is tested in this study. The experimental results show that the bit error rate of the communication system is within 10-6 under the premise of meeting the communication rate, which satisfies the requirements of laser communication in the Taiji program. The conclusions obtained in this study lay a solid technical foundation for future laser communication parameters and scheme designs within the parameters of the Taiji program.
Dec. 10, 2023Vol. 50 Issue 23 2306002 (2023)
Cencen Zhu, Jia Li, Qiuping Lan, Xu Wang, and Yanming Chen
ObjectiveIn recent years, with the rapid development of LiDAR, algorithms for point cloud edge extraction have been widely used in coastline extraction. Compared to coastline extraction, riparian line extraction has more significance; however, it often presents more challenges, especially when confronted with the task of extracting riparian lines in environments characterized by substantial elevation variations and dense tree cover. To address these problems, we propose an accurate extraction process for riparian lines in complex environments using a line-scanning laser point cloud. This approach enables precise riparian line extraction even in scenarios where the riverbank elevation varies significantly and the riverbank is obscured by tree canopies.MethodsFirst, the original river point cloud data were preprocessed, and the number of points within a certain range was counted using the center point neighborhood and elevation information. The center points were then categorized into noise and riverbank points, and an initial representation of the riverbank was established using the breakpoint analysis method (Fig.2). Second, an adaptive threshold frame was generated. With the rough outline as the reference and the rough outline point as the center point of the threshold frame, elevation statistics were performed on the object elevation within the threshold frame. Concurrently, ground objects, such as tall trees, were selectively removed to refine the threshold frame (Fig.11). Finally, considering the smoothness characteristics of the riparian edge in real conditions, “defective” points were removed by the normal gradient constraint between adjacent edge points. This ensured the smoothness of the edge, and the remaining edge points were subsequently connected to form vector riparian lines. The detailed process for precisely extracting a riparian line in a complex environment is shown in Fig. 1.Results and DiscussionsExperiments were conducted on islets in the middle of a river and shorelines obscured by trees using the method described in this study and the mainstream contour tracing method, respectively. The shorelines extracted using the two methods were compared with real shorelines. The root mean square error (RMSE) of the calculated distances was used to qualitatively analyze the performance of the two methods. As shown in Table 1, the proposed method exhibit an approximately 24.6% lower RMSE compared to the contour tracing method, along with 30.2% more error-free matches. Moreover, it is evident from the statistical histogram of the error distribution that the errors of the proposed method are mainly concentrated within 0.3 m, with only a few points exceeding 1 m (Fig.16). Although the error of the contour line tracking method also achieved excellent results, it is significantly larger than that of the proposed method, with certain points exhibiting an error of approximately 1.5 m. For island and reef terrain, both methods demonstrate excellent capability in extracting the bank edge. However, when dealing with coastlines concealed by trees, the edge extracted by the proposed method is more closely aligned with the actual terrain (Fig.17). In summary, the proposed method outperforms the traditional contour tracing method in terms of extraction quality and error control, making it particularly well-suited for processing data in complex terrains.ConclusionsConsidering the complex environment of riverbanks, this study proposes an accurate extraction method for riparian lines using line-scanning laser point clouds in complex environments. The advantages of the method are as follows: (1) it utilizes scan line characteristics to identify breakpoints; (2) an adaptive threshold is employed to eliminate non-riparian point cloud data like shoreline canopy; (3) riparian point cloud data are further transformed into smooth, closed vector data using the normal gradient constraint method. The experimental results show that this method can effectively extract riparian lines in a complex environment. This proposed method holds promise in supporting critical tasks such as river surveys, river track detection, and riverbank soil and water loss monitoring.
Dec. 10, 2023Vol. 50 Issue 23 2309001 (2023)
Yang Zhou, Shumin He, Wei Shen, and Qifa Liu
ObjectiveWith the development of a new generation of electronic communication technology, data traffic for transmitting information is increasing, thereby driving the development of optical communication technology for higher speed, larger capacity, and lower power consumption. Photonic crystal surface-emitting lasers (PCSELs) are the key devices in this field that have a wide range of potential applications. PCSELs exhibit outstanding features, such as large-area single-mode excitation, arbitrary beam shaping and polarization, and high power. Simultaneously, GaN compounds can be flexible and adjustable to cover any wavelength band from ultraviolet (UV) to green, thereby the laser based on this is complementary to the mature GaAs- and InP-based lasers. Using a photonic crystal heterostructure design can improve the performance of a laser, particularly for achieving large bandwidths. In this study, the expressions for the threshold current, 3 dB modulation bandwidth, and output power of PCSELs are derived using the rate equation model, and the fundamental and modulation performances of a GaN-based photonic crystal surface emission laser are analyzed and compared with those of other reported lasers. This investigation lays the foundation for the design of blue-light lasers with large modulation bandwidths.MethodsIn this study, we first derive expressions for the threshold current, 3 dB modulation bandwidth, and output power of PCSELs using the classical rate equation model to lay the foundation for subsequently writing the code in MATLAB. GaN-based PCSELs are selected for modulation analysis, and the core parameters of the laser are derived after strict finite-domain difference (FDTD)-based calculations and verified using the ensemble wave analysis method (RCWA). The MATLAB codes are written using the derived equations and the laser parameter values are substituted into this code to obtain a plot in which the 3 dB modulation bandwidth, output power, and minimum energy consumption are indicated. The relationship between the calculated and simulated values of the threshold current is investigated by changing a single parameter using the control-variable method. Finally, properties such as the modulation bandwidth are compared with those of vertical cavity surface-emitting, wavelength-level active region buried photonic crystal defect, nanobeam, and Si-based distributed feedback lasers to highlight the advantages of GaN-based heterostructure PCSELs.Results and DiscussionsWe first derive the expressions for the threshold current, 3 dB modulation bandwidth, and output power of PCSELs. The calculated and simulated values of the threshold current can be obtained by changing the volume of the active region of the laser, and the values show good agreement. When the quality factor (Q) of the laser increases, the calculated and simulated values of the threshold current decrease, and when Q increases further, the calculated and simulated values of the threshold current converge to remain constant (Fig. 2). Subsequently, the FDTD calculations of the PCSELs (Fig. 3) yield a threshold current of 1.76 mA for the laser and a minimum data transmission energy consumption of 62.78 pJ/bit for direct modulation at 2.4 mA bias current when the 3 dB modulation bandwidth is 6.166 GHz and the output power is 0.795 mW. With an increase in the injection current, the 3 dB modulation bandwidth peaks at 42 GHz (Fig. 4). Finally, the threshold currents, maximum modulation bandwidths, minimum energy loss values, and output powers of various types of lasers that have been reported (Table 2) are listed to compare their advantages and disadvantages with those of PCSELs, and it is observed that GaN-based PCSELs can make up the shortcomings of the current laser applications.ConclusionsThis study focuses on the modulation, threshold, and output power characteristics of PCSELs. We first derive the expressions for the threshold current, 3 dB modulation bandwidth, and output power of the PCSELs based on the rate equation model theory of the laser. Subsequently, the fundamental performance and modulation bandwidth performance of a GaN-based photonic crystal surface emission laser are analyzed, and the threshold current of 1.76 mA, the maximum 3 dB modulation bandwidth of 42 GHz, and the minimum data transmission energy consumption of 62.78 pJ/bit are obtained by simulation, thus demonstrating the fundamental performance and high-speed modulation characteristics of the proposed GaN-PCSEL with the studied structure parameters. This study provides the basic performance and high-speed modulation characteristics of the laser and the comparisons with other reported lasers. In this study, a methodology for simulating and analyzing the fundamental and dynamic modulation characteristics of semiconductor lasers is developed, which provides a theoretical basis and guidance for the design of PCSELs with excellent high-speed modulation characteristics.
Dec. 10, 2023Vol. 50 Issue 23 2301001 (2023)
Jiao Gao, Fengping Yan, Ting Feng, Dandan Yang, Ting Li, qi Qin, Hao Guo, Haoyu Tan, and Guangbo Li
ObjectiveIn recent years, the development of thulium-doped fiber lasers (TDFL) gradually followed the footsteps of ytterbium-doped and erbium-doped fiber lasers. The tunable range of TDFL is 1400-2200 nm, covering the atmospheric transmission window. In this window, the allowed power transmission of light in free space can be several orders of magnitude higher than that of the other wavelength bands. In particular, optical power transmission exceeds 80% in the 2050 nm wavelength band, making it possible to use TDFL in this band for free-space optical communications and atmospheric Doppler lidar. The TDFL operating wavelength is in the 2 μm band, which is a safe operating band for human eyes, and in which there is a high transmittance atmospheric window and strong absorption peaks of multiple gas molecules and OH- ions. Therefore, lasers in this band are favored by various application industries, especially in the free-space optical communication field, where human eye safety is a requirement. Single longitudinal mode (SLM) fiber lasers have excellent characteristics, such as high beam quality, good coherence, and narrow linewidth, and are widely used as the preferred light source in multiple important fields. For example, fiber lasers with a narrow linewidth output have been used in ultra-long-range coherent optical communication, fiber optic sensing, optical metrology, high-resolution spectroscopy, and lidar, and have potential applications in optical atomic clocks, fundamental constant measurements, and physics. Therefore, the realization of a stable single longitudinal-mode narrow-linewidth laser source in the 2050 nm band is indispensable.MethodsThe proposed structure predominantly consists of a ring main cavity and a compound sub-cavity (Fig.1). The 793 nm pumped source output is input into the ring cavity through the fiber combiner, a 4 m long double-clad thulium-doped fiber is used as the gain medium, and the circulator ensures unidirectional transmission of light inside the ring cavity. A 0.5 m length of unpumped thulium-doped fiber is added to port 2 of the ring as the saturable absorber (SA), making it equivalent to a dynamic self-tracking narrow-band filter, which effectively suppresses the multi-longitudinal mode oscillation, realizing single longitudinal mode operation and compressing the narrow linewidth. A fiber Bragg grating (FBG) is used as a wavelength-selective device. The optical signal reflected by the FBG is injected into a composite double-loop cavity composed of three couplers and a composite double-loop cavity structure (Fig.3), which consists of one 3×3 coupler OC1 and two 2×2 couplers OC2 and OC3 which are connected in sequence. The 3×3 coupler OC1 has a 33∶33∶33 output and divides the input optical signal into three optical signals. The coupling ratio of both 2×2 couplers is 20∶80. The output laser is generated from the 10% port of the 90∶10 coupler.Results and DiscussionsThe laser was developed and tested on an ultrastable optical stage at room temperature. A stable laser output was obtained when the pumping power reached 4 W. The central wavelength was 2048.76 nm, and the optical signal-to-noise ratio was 68 dB. The output spectrum was measured every 6 min for 60 min, and the spectrum obtained after ten consecutive scans [Fig. 8(a)]. To further quantify the stability of the laser, the power jitter and wavelength drift results over 60 min were analyzed with power fluctuation less than 0.15 dB and wavelength drift less than 0.02 nm [Fig.8(b)], indicating that the laser had good output stability at room temperature. The results of the single longitudinal mode of the output laser using the self-homodyne method show no obvious mode-hopping phenomenon over the three measurement ranges (Fig.9). To demonstrate the stability of the laser’s single longitudinal mode, ten sets of measurements were performed within 60 min, and no beat frequency signal generated by the longitudinal mode was captured [ Fig.9(a) inset]. When the SA was removed, a nonzero frequency rate peak was observed in the 0-500 MHz measurement range [Fig.9(d)]. The results show that the composite double-ring cavity effectively suppresses most longitudinal modes in the cavity; however, the remaining longitudinal modes must be further suppressed using saturable absorbers. To further characterize the linewidth characteristics of the TDFL, the frequency noise of the laser was measured using an unbalanced Michelson interferometer based on a 3×3 fiber coupler, and the linewidth of the laser was calculated using the β-separation line method. The laser linewidth was 9.17 kHz at 0.001 s and the relative intensity noise is below -129.69 dB/Hz at frequencies above 1 MHz.ConclusionsA single longitudinal mode narrow linewidth TDFL based on a compound double-ring cavity with a saturable absorber operating in the 2050 nm wavelength band is reported, with its output stability and linewidth characteristics characterized in detail. The performance of the proposed filter was analyzed in detail, and it was confirmed that the structure suppresses dense multilongitudinal modes well and has the advantages of simple fabrication and high tolerance. In combination with the excellent single longitudinal mode selection capability of the unpumped thulium-doped fiber, the laser was guaranteed to be in a stable single longitudinal mode state. Experimental results demonstrate that the proposed laser has the advantages of a high optical signal-to-noise ratio (OSNR), high stability, and narrow linewidth, and can be more widely used in lidar and space optical communication systems by reducing fusion loss, good vibration isolation, and temperature compensation to achieve a superior laser output.
Dec. 10, 2023Vol. 50 Issue 23 2301002 (2023)
Weikang Wang, Xiang Zhang, Wei Luo, Guowen Yang, and Xiao Yuan
ObjectiveSemiconductor lasers are widely used in industrial processing, consumer electronics, and the military because of their high electro-optical conversion efficiency, large power-to-volume ratio, and long lifetime. One of the most important applications of semiconductor lasers is to pump other types of lasers. Their overall pumping efficiency is significantly higher than that of conventional pumping sources; however, their output spectral linewidth and central wavelength drift with temperature limit the actual pumping effect. One of the key research directions has always been to narrow the output spectral linewidth of semiconductor lasers and improve the efficiency of the external cavity. It is important to adopt effective technical methods to optimize the output spectral characteristics of semiconductor lasers and expand their application in fields of high spectral stability and precision.MethodsThis study proposes a compact external-cavity semiconductor laser. Based on this structure, the effects of the facet reflectivity of the semiconductor laser on the output characteristics of the system are studied. First, the effects of the facet reflectivity of the laser and the grating diffraction efficiency on the gain are discussed based on the net gain coefficient formula of the external cavity mode of the semiconductor laser. When the grating diffraction efficiency is maintained at a certain value, a high-contrast output can be achieved by reducing the facet reflectivity. Next, the optimization of the semiconductor laser dispersion characteristics with a fast-axis collimating lens is verified using the ZEMAX optical design software. A volume Bragg grating (VBG) external cavity feedback element is used to effectively compress the output spectral linewidth of the semiconductor laser and achieve a stable wavelength output. Finally, based on the discussion of the output spectra and power-current (P-I)curves of semiconductor lasers with different facet reflectivities, the optimization of the system output characteristics by reducing the semiconductor laser facet reflectivity is verified, which helps to pump alkali metal vapor lasers.Results and DiscussionsWith the external cavity feedback of the VBG, the output spectrum of the semiconductor laser achieves a stable narrow band output (Fig.4). The central wavelength stabilizes around 779.8 nm with a spectral linewidth of 0.1 nm. After spectral locking, the central wavelength current drift coefficient reduces to 0.9 pm/A at an operating temperature of 31 ℃ (Fig.5). The temperature drift coefficient of the central wavelength reduces from 0.2 nm/℃ to 6.25 pm/℃ for the same pumping current. The stability and monochromaticity of the semiconductor laser output spectrum are significantly improved. For laser chips with 0.20% and 0.40% facet reflectivities, the uniformity of the laser output spectrum deteriorates with an increase in the pumping current (Fig.6) and their linewidths at 1/e2 energy with a 160 A driving current are 0.30 nm and 0.34 nm, respectively. Simultaneously, the external cavity mode ratio is 97% at a 0.02% facet reflectivity of the laser chip (Fig.7). The laser output power reaches 134 W and 138 W at 0.20% and 0.40% facet reflectivity, respectively, at a pumping current of 160 A, and drops to 127 W for the same pumping current at 0.02% facet reflectivity of the laser chip (Fig.8). A facet reflectivity of the laser chip of 0.02% achieves an output spectral linewidth of 0.08 nm and an external cavity efficiency of 106% with a 160 A pumping current.ConclusionsTo further compress the output spectral linewidth of the semiconductor laser and improve the efficiency of the external cavity, a VBG laser external cavity and laser chips with facet reflectivities of 0.02%, 0.20%, and 0.40% are used. For a semiconductor laser chip with 0.02% facet reflectivity, the output spectral linewidth is compressed to 0.08 nm and the external cavity efficiency reaches 106% with a continuous output power of 127 W, using a reflective VBG. A high-efficiency laser output with a narrow linewidth and 100 watts for a single bar is achieved, which has important application value for pumping high-power rubidium vapor lasers.
Dec. 10, 2023Vol. 50 Issue 23 2301003 (2023)
Shengjie Yu, Jian Feng, Xin Zhang, Yao Xiao, Zhicheng Zhang, Jun Wang, and Cunzhu Tong
ObjectiveThe attenuation coefficients of blue and green light in the 470‒580 nm band are the smallest in seawater, especially at the peak of transmittance near 490 nm. Therefore, blue-green lasers have important application prospects in underwater communications, laser detection, and radars. Currently, blue-green lasers can be realized using a middle-infrared laser quadruple frequency, solid-state laser sum frequency, and gas laser and AlGaN semiconductor laser direct excitation. However, these methods have low energy conversion efficiency and poor beam quality. The advantages of semiconductor disk lasers used to produce blue and green lasers are good beam quality, high-frequency doubling efficiency, and improved stability and reliability. The thermal problem is a key factor affecting the performance of semiconductor disk lasers and must be improved by optimizing the packaging structure. The semiconductor disk packaging process uses Ti-Pt-Au as the bonding layer and realizes bonding between the chip and diamond by the solid-liquid diffusion bonding of gold and indium. Pt acts as a diffusion medium for bonding. The experiment conducted herein identified that this method has some problems. Pt tends to spread onto the diamond surface and condense to form points during electron-beam evaporation. Packaging quality decreases and thermal resistance increases, limiting laser performance improvement.MethodsThe epitaxial structure of the 980 nm semiconductor disk consists of 26 pairs of distributed Bragg reflectors with undoped AlAs/GaAs layers, six pairs of active regions with InGaAs double quantum wells, and a high bandgap energy cap layer (Fig.1). The quantum well spatial position in the epitaxial structure of the semiconductor disk must coincide with the standing-wave peak at the designed wavelength (Fig.2). Based on the Ti-Pt-Au packaging technology, a Cu-Sn alloy with high thermal conductivity is selected as the barrier layer to increase the thickness between Pt and diamond. Pt is prevented from condensing on the diamond surface and the packaging process is improved. A 490 nm laser with high power is obtained by constructing a V-shaped cavity and using an LBO crystal cavity with intracavity frequency doubling (Fig. 6).Results and discussionsA direct cavity is used to test the performance of the semiconductor disk laser. The output coupler M1 is a concave mirror with curvature radius of 77.5 mm and reflectance coating of 97%. The resonator cavity length is 90 mm (Fig.4). A fiber laser of 808 nm wavelength of is used as the pump source and the spot size is 400 μm. The temperature of the chip is controlled using a thermoelectric cooler (TEC) and the temperature is set to 10 ℃. The laser slope efficiency reaches 47.3%. When the absorption pump power reaches 52.7 W, the output power will reach 22.5 W. The total optical-to-optical conversion efficiency is 42.7% (Fig.5). The V-shaped cavity is used for second harmonic generation output. The output coupler M1 is a concave mirror with curvature radius of 77.5 mm, the reflection film of 996 nm 99.5% and antireflection film of 498 nm 99.5% are coated. M2 is a parallel-plane mirror-plated 996 and 498 nm 99.5% reflection film. The size of the LBO crystal is 3 mm×3 mm×10 mm (Fig.6). The temperature of the crystal is controlled using a thermoelectric cooler (TEC) and the temperature is set to 10 ℃. The slope efficiency of the blue and green light output is 17.8%, the maximum output power is 4.8 W and the total optical-optical conversion efficiency is 15.4% (Fig.8). After frequency doubling, the wavelength of the blue and green light is 496.1 nm (Fig.9). The pump spot on the surface of the disk has a 400 μm diameter. Under the spot size, the maximum output power of blue and green light produces a frequency-doubling light intensity of 3.8 kW/cm2 per unit pumping area. This study compares the experimental results of a 490 nm optically pumped semiconductor disk laser at home and abroad (Table 1). In this research, a high fundamental frequency optical power and higher frequency doubling light intensity per unit area are obtained under a higher pump power density, indicating that the proposed chip unit area has an improved heat dissipation capacity. The frequency-doubling light power and efficiency reported in this study can be improved and the pump spot area can be further increased in the future.ConclusionsA packaging process is developed that significantly improves the heat dissipation capacity of semiconductor disk lasers. This packaging technology can suppress Pt condensation on diamond surfaces during packaging. This packaging process bonds the laser chip and diamond heat sink more closely, reduces device thermal resistance, and improves heat-dissipation capacity. A fundamental-frequency optical output of 22.5 W with a pump spot diameter of 400 μm is obtained using the packaging process. The optical conversion efficiency is 42.7% at the maximum output power. A blue and green light output of 4.8 W is obtained through frequency doubling. The total optical-optical conversion efficiency is 15.4%, and the intensity of blue and green light produced per unit pumping area is 3.8 kW/cm2.
Dec. 10, 2023Vol. 50 Issue 23 2301004 (2023)
Xin Zheng, and Yujiao Li
ObjectiveTo improve the long-term stability of a laser gyro, a real-time loss measurement system for space triaxial laser gyro mirrors exposed to He-Ne discharge plasma is designed. The loss-change process of the mirror in plasma is experimentally studied. The influence of low- and high-temperature environments on the variation law of loss is studied. Combined with the gas discharge fluid model, the discharge characteristics of the He-Ne plasma in the cavity of the laser gyro are simulated, and the energy and distribution of electrons and ions are obtained. The loss change mechanism in the plasma environment is discussed. The research results play an important role in further improving the stability of laser gyro mirrors under the action of plasma.MethodsConsidering that the cavity ring-down and resonant measurements are both based on a passive cavity, the loss change process of a mirror in plasma cannot be measured. Therefore, a real-time loss measurement system for space triaxial laser gyro mirrors exposed to He-Ne discharge plasma was designed based on the characteristics of the orthogonal optical paths of three resonators and shared mirrors. For example, channels Ⅰ and Ⅱ shared concave mirror 3 and plane mirror 1 (Fig. 1), and the loss of channel Ⅰ was monitored using the cavity ring-down method (Fig. 2). It was found that the loss of channel Ⅰ increased when channel Ⅱ was powered on. Since concave mirror 3 is in the discharge path, the increase in loss was caused by the action of the plasma on concave mirror 3. Based on this method, the loss of concave mirror 3 before and after plasma action in the cavity was monitored. The results showed that the loss increased rapidly and tended to be stable during discharge. Once the power supply was turned off, the loss decreased dramatically, flattened out, and finally dropped to the initial value in the subsequent natural standing process. Furthermore, the variation law of the loss under low- and high-temperature conditions after power failure was studied (Table 1). The experiments showed that high temperature had a positive effect on reducing the incremental portion of loss caused by the plasma, but low temperature did not.Results and DiscussionsThe loss of the mirror increases under the action of the plasma in the cavity; therefore, it is necessary to deeply analyze the parameters of the electrons and ions in the plasma, especially the energy and distribution of these particles located at the mirror. A gas-discharge fluid model is constructed in combination with the structure of the laser gyro. The simulation results show that the energies of the electrons and He+ are the highest at the inner surface of the cathode (Fig. 3). During the discharge process, the energy range of electron is 6.6‒10.5 eV (Fig. 4) on the mirror, and when the discharge reaches equilibrium, the energy range of electron is 2.1‒3 eV on the mirror. The electron energy is higher than the binding energies of SiO2 and Ta2O5 in the discharge process, and the electron energy is equivalent to the defect absorption peak when the discharge reaches equilibrium. Therefore, the electrons will produce more defects in the mirror, leading to changes in its reflection and loss characteristics. In general, a high temperature can be applied to the mirror to eliminate defects and impurities in the mirror, such as electrons and holes, to reduce the loss. Therefore, the loss is reduced after the high-temperature experiments. However, the heat treatment commonly used for the mirror is several hundred degrees Celsius, and most defects and impurities in the mirror cannot obtain enough energy to be completely eliminated at 75 ℃, so the loss reduction is limited.ConclusionsIn this study, an accurate and effective real-time measurement system for space triaxial laser gyro mirrors exposed to He-Ne discharge plasma is designed. The variation law of the loss before and after plasma action is studied. The corresponding experiments are designed based on the loss-change phenomenon. It is found that high temperatures have a positive effect on the loss recovery. Finally, the energy and distribution of the electrons and ions on the surface of the mirror are simulated. The simulation results show that the energy of the electrons is high enough to cause numerous defects in the mirror. Therefore, the stability of the laser gyro mirror in the plasma can be improved by reducing the electron energy on the surface of the mirror and enhancing its anti-electron damage ability, thereby improving the long-term stability of the laser gyro.
Dec. 10, 2023Vol. 50 Issue 23 2301005 (2023)
Wei Dou, Shanshan Hou, Zhiyuan Zheng, Bowei Yu, Xi Chen, and Quan Zheng
ObjectiveThe features of deep-ultraviolet lasers are high single-photon energy, short wavelength, and easy absorption by materials. They are widely used in high-density optical data storage, high-resolution optical microscopy, material processing, spectral analysis, scientific research, and medical sterilization and diagnostic equipment. Currently, most deep-ultraviolet lasers are obtained by two or more nonlinear frequency conversions of near-infrared lasers; however, the efficiency of this method is generally low. In recent years, rare-earth ions (Pr3+) that can emit a visible laser directly at room temperature have attracted considerable attention. Its emission wavelengths span over the blue (485 nm), green (523 nm), orange (604 and 607 nm), and red (640, 698, and 721 nm) regions. The appearance of Pr3+ also makes it possible to obtain a deep-ultraviolet laser through a single nonlinear frequency conversion. Polarized emission spectra of the Pr3+∶LiYF4 crystal were measured at room temperature. In addition to the standard transition wavelengths, a weak fluorescence spectrum of the 3P0→3H5 transition was observed in the tested fluorescence lines at 546 nm. Recently, in our experimental group, we used a double-end-pumping Pr3+∶LiYF4 crystal for frequency-doubling of the weak spectral line with a β-BaB2O4 (BBO) crystal and obtained a continuous deep-ultraviolet laser at 273 nm with a power of 128 mW. Compared to ordinary solid-state lasers, single-frequency lasers have the advantages of excellent stability, narrow spectral lines, and good coherence. This study added a mode selection element to explore the 273 nm deep-ultraviolet laser further. A single longitudinal mode deep-ultraviolet laser with a center wavelength of 272.93515 nm was successfully obtained, and the maximum output power was 32 mW. This study is essential for measuring the content of the antidepressant sertraline hydrochloride.MethodsThe absorption properties of polarized Pr3+∶LiYF4 crystals were studied. The absorption efficiency of the Pr3+∶LiYF4 crystal at 444 nm wavelength for π polarization was measured (~94%), and the absorption efficiencies at two wavelengths for σ polarization were compared. The absorption efficiency at 441 nm (~79.5%) was higher than that at 444 nm (~53%). The absorption of laser by the Pr3+∶LiYF4 crystal has polarization characteristics; thus, two laser diodes (LDs) of different wavelengths were combined by polarization as the pumping source. As a result, the entire pump power can be improved, and the polarization characteristics of the pump can be retained such that the absorption efficiency of the crystal correspondingly improves. Therefore, two LDs with an output power of 3.5 W, 444 nm in π-polarization direction and 441 nm in σ-polarization direction were used as the pump source; the length of Pr3+∶LiYF4 crystal was 7 mm and that of the BBO crystal was 5 mm for intracavity frequency doubling. A V-shaped folded cavity was designed (Fig. 4). The beam waist radius (69 um) in Pr3+∶LiYF4 crystal was designed to be small to ensure absorption efficiency. In contrast, the beam waist radius (102 μm) in BBO crystal was designed to be relatively large to reduce the power density of deep-ultraviolet laser and damage to the crystal (Fig. 5). Simultaneously, two different Fabry-Perot (F-P) etalon combinations were used to select the longitudinal mode. Two F-P etalons, with thickness of 0.5 mm and 1.2 mm and reflectivity of 60% and 70%, respectively, were selected with an incident angle of 0.25°. According to the cavity length, the longitudinal mode interval was calculated to be 2.34 GHz (0.00233 nm). The transmittance curves of the etalon sets were simulated for different longitudinal modes when the beam was incident at a small angle. When one of the longitudinal modes had the maximum transmittance (T=100%), the adjacent longitudinal mode exhibited a single-transmission loss of approximately 20% (Fig. 6). Under the condition that the longitudinal mode in the resonant cavity oscillates and is lost multiple times, only a single longitudinal mode at T=100% can initiate the oscillation, thereby ensuring a single longitudinal mode output of the laser.Results and DiscussionsWithout any mode selector in the cavity, a deep-ultraviolet laser at 273 nm with an output power of 85 mW was obtained, and the measured results were multiple longitudinal modes. After adding two etalons, the single longitudinal mode 273 nm laser spectrum was measured using a wavelength meter (High Finesse WS7). The wavelength was single, and there was no adjacent longitudinal mode. The center wavelength was 272.93515 nm, the spectral linewidth was less than 80 fm (Fig. 7), and the wavelength stability was measured for two hours at a wavelength variation of 4.5 pm(Fig. 8). The output power of a single longitudinal mode deep-ultraviolet laser at 273 nm was measured using a power meter (Coherent FieldMaxII-TO). The maximum output power of a single longitudinal mode deep-ultraviolet laser at 273 nm (32 mW) was obtained when the combined output power of the two LDs at 441 and 444 nm was 6240 mW. The curve of the laser output characteristics was fitted to the experimental results. The output power of the single longitudinal mode deep-ultraviolet laser at 273 nm increases with increasing pump power. The slope also tends to increase potentially owing to the gradual adjustment of the LD wavelength to the absorption peak of the Pr3+∶LiYF4 crystal. As the pump power continues to increase, the LD wavelength gradually deviates from the absorption peak of the crystal, the thermal lens effect of the crystal intensifies, and the slope of the curve gradually flattens (Fig. 9). We used a coherent power meter to test the stability of the maximum power of a single longitudinal mode 273 nm deep-ultraviolet laser. The root-mean-square (RMS) of the power stability was 0.717% after 1 h of continuous testing (Fig. 9). We measured the far-field beam shape using a beam profile analyzer (Spiricon BM-USB-SP928-IOS), which was a long strip owing to the walk-off effect of the BBO crystal. The beam quality (M2 factor) was measured as 2.29 in the X- and 2.21 in the Y- direction using a beam quality analyzer (Thorlabs BP209-VIS/M) (Fig. 10).ConclusionsIn this study, a simple and effective V-shaped folded cavity was designed using a Pr3+∶LiYF4 crystal made in China as the laser gain medium, and a π-polarized laser with a center wavelength of 444 nm and a σ-polarized laser with a center wavelength of 441 nm were used as the pump sources. Two different F-P etalons were used to select the longitudinal mode in the cavity, and the BBO crystal doubled the fundamental frequency of 546 nm to realize the stable operation of a 273 nm single longitudinal mode deep-ultraviolet laser. The measured center wavelength is 272.93515 nm, the maximum output power is 32 mW, and the RMS power stability is 0.717% in a 1 h continuous measurement. The pump source selected in this experiment matches the absorption peak of the crystal well, maximizes the absorption efficiency, and improves the laser output power. In future, we plan to continue to optimize the resonator, increase the power of the injected pump light, and further improve the output power of the 273 nm single longitudinal mode deep-ultraviolet laser.
Dec. 10, 2023Vol. 50 Issue 23 2301006 (2023)
Lei Huang, Qingli Zhang, Jianqiao Luo, Wenpeng Liu, Junrui Zhang, Renqin Dou, Guihua Sun, Cong Quan, Yingying Chen, Shoujun Ding, Yao Liu, and Ying Fan
ObjectiveAtmospheric water vapor has a significant impact on the greenhouse effect, water cycle, weather phenomena, atmospheric physical and chemical reactions, and air quality; therefore, the detection of atmospheric water vapor profiles is crucial. Differential absorption lidar (DIAL) is a high-precision, high-spatiotemporal-resolution atmospheric water vapor detection system with important application prospects for airborne and satellite platforms. The absorptivity values of light with wavelengths in the vicinity of 940 nm, 935 nm/936 nm, 942 nm/943 nm, and 944 nm are high in water vapor and are less affected by interference from other gases, making it suitable for lidar emission light sources. Nd∶GSAG crystals exhibit excellent radiation resistance and are therefore suitable for use in space environments. It can directly generate the laser with wavelength of 942 nm pumped by laser diode (LD) and has advantages such as high efficiency and stability, long lifespan, light weight, and small volume. It is suitable for use on airborne and satellite platforms. Differential absorption lidar for water vapor detection requires high wavelength stability, linewidth, and spectral purity of the emitted laser. Therefore, further research on the spectral and laser performances of Nd∶GSAG, as an excellent 942 nm laser working material, is warranted. In addition, reducing the doping concentration of Nd3+ in garnet laser crystals is expected to increase the fluorescence lifetime, reduce the thermal lensing effect, and improve the laser beam quality. Therefore, optimizing the doping concentration of Nd∶GSAG is expected to improve its 942 nm laser efficiency and beam quality.MethodsAccording to the stoichiometric ratio of Nd0.045Gd2.955Sc2Al3O12, the raw materials Gd2O3, Sc2O3, Al2O3, and Nd2O3 are weighed, evenly mixed, pressed into circular blocks, and calcined in a muffle furnace to obtain polycrystalline raw materials. Finally, a single-crystal furnace is used to grow crystals with a size of 50 mm×70 mm, and the laser ablation (LA)-inductively coupled plasma mass spectrometry (ICP-MS) is used to measure the crystal composition. Single-crystal rocking (XRC) and X-ray powder diffraction (XRD) tests are performed on the crystals using an X-ray diffractometer. The transmittance spectra are measured using an ultraviolet(UV)/visible/near-infrared spectrophotometer. The fluorescence lifetime and emission spectra are obtained using a steady-state/transient fluorescence spectrometer, wherein the fluorescence lifetime is excited by an optical parametric oscillator and the fluorescence emission spectrum is excited by an 808 nm fiber coupled laser. The pump source in the laser experiment is an 808 nm fiber-coupled laser, and the resonant cavity is a 10-mm long flat cavity. The dimensions of the laser gain medium are 2 mm×2 mm× 6 mm.Results and DiscussionsThe crystal formula is Nd0.025Gd2.64Sc1.79Al3.28O11.60, in which the Nd3+ doping atomic fraction is 0.94%. Further, the full width at half maximum (FWHM) of the XRC curve is 0.019°, and the XRD peak is consistent with that in the standard card ICSD78052. At the strongest absorption peak of 808.5 nm, the absorption coefficient is 3.79 cm-1, the absorption cross section is 3.41×10⁻²⁰ cm2, and the FWHM of the absorption peak is 3.23 nm, which is better than that (2.79 nm) of Nd∶YAG crystal with doping atomic fraction of 0.6%. Moreover, 1060 nm is the strongest emission wavelength excited at 808 nm, with emission cross-sections of 5.62×10⁻²⁰ cm2 and 2.33×10⁻²⁰ cm2 at 1060 nm and 942 nm, respectively. The fluorescence lifetime is 275 μs, which is 22 μs longer than that of Nd∶GSAG crystal with doping atomic fraction of 1.20%. The FWHM of the spectrum of the 942 nm laser is 0.53 nm, with a maximum output power of 0.54 W, a conversion efficiency of 5.6%, a slope efficiency of 9.1%, and a laser threshold of 3.35 W. At a laser power of 0.4 W, the beam quality factors Mx2 and My2 in the horizontal and vertical directions are 2.72 and 3.45, respectively. The waist diameter is small and the waist diameters dx and dy in the horizontal and vertical directionsare 0.1048 mm and 0.1185 mm, respectively. All indicators are better than those of the 466 nm laser of Nd∶YAG crystal with doping atomic fraction of 0.6%.ConclusionsThe grown Nd∶GSAG crystal with doping atomic fraction of 0.94% has good crystal quality. The Nd doping increases the cell parameters and crystal density. At 808.5 nm, the absorption coefficient of the Nd∶GSAG crystal with doping atomic fraction of 0.94% is less than that of Nd∶GSAG with doping atomic fraction of 1.20%, and the thermal lensing effect can be reduced by increasing the crystal length. The FWHM of the absorption peak is greater than that of Nd∶YAG, which has a lower requirement for a pump source. The fluorescence lifetime and emission cross-section at 942 nm are better than those of high-concentration crystals; the grown crystal is therefore more conducive to 942 nm laser output and energy storage. The maximum laser output power, optical conversion efficiency, slope efficiency, laser threshold, and beam quality of the 942 nm laser are superior to those of the 946 nm laser of Nd∶YAG crystal with doping atomic fraction of 0.6%. The 942 nm waist diameter and laser spectral FWHM are the smallest among those of the four wavelengths (i.e., 942 nm, 946 nm, 1060 nm, 1064 nm), indicating good monochromaticity. The results indicate that the Nd∶GSAG crystals with low doping concentrations exhibit excellent laser performances at 942 nm.
Dec. 10, 2023Vol. 50 Issue 23 2301007 (2023)
Ting Ma, Qiao Lu, Chenliang Zhao, Jindong Ma, and Qinghe Mao
ObjectiveMid-infrared optical frequency combs are widely used in precision spectroscopy, optical frequency metrology, instrument calibration, and other fields. Fiber-type dual-arm structure difference frequency generation (DFG) mid-infrared combs based on mode-locked fiber lasers are currently the primary technology for generating mid-infrared combs. The spectral tuning range and spectral bandwidth are two key indicators of DFG mid-infrared combs. The spectral tuning range is ensured by the wide tuning range of the fundamental frequency pulse, and the spectral bandwidth is associated with the crystal phase-matching acceptance bandwidth and the spectral width of the fundamental frequency pulse. Generally, the fundamental frequency pump pulse is generated by directly amplifying the oscillator output pulse, whereas the fundamental frequency signal pulse is obtained by amplifying and compressing the output pulse of the oscillator and then pumping a highly nonlinear fiber (HNLF) to generate long-wave frequency shift solitons. Although many reports on wide-tunable DFG mid-infrared combs exist, the bandwidth of two-color fundamental frequency pulses is narrow, owing to the limitation of the gain bandwidth of fiber amplifiers, and thus limits the bandwidth of the generated DFG mid-infrared combs. Therefore, the generation of a fundamental frequency pulse with a wider spectrum to obtain DFG mid-infrared combs with larger bandwidths and tuning ranges as well as the design and development of a practical light source device requires further research.MethodsA fully polarization-maintaining 9-cavity fiber laser was used as the pulse source, and the repetition frequency was locked to the rubidium atomic clock through a servo feedback loop. The output of the oscillator was filtered and shaped and further divided into two paths using an optical coupler (OC) after erbium-doped fiber amplification (EDFA-1). It was then amplified by self-similarity fiber amplifiers EDFA-2 and EDFA-3. The EDFA-3 output pulse after being compressed serves as fundamental frequency pump pulse, the EDFA-2 output pulse after being compressed was used to pump HNLF to generate a supercontinuum (SC), and the frequency-shifted solitons were extracted as the fundamental frequency signal pulse. The two-color fundamental frequency pulses were output through the collimator (Co) collimation space, and the polarization state was adjusted by half-wave plates. The mirrors (M) of M1 and M2 were added to the collimator-2 output port to form a time delay line for adjusting the time synchronization of the two-color fundamental frequency pulses. After the two-color fundamental frequency pulses were combined by a dichroic mirror (DM), they were focused on a GaSe crystal by a lens (L1) with a 40 mm focal length to generate a DFG mid-infrared comb. The comb output by L2 collimation after the fundamental frequency light was filtered by a long pass filter (LPF) (Fig. 1). The integration and packaging of the optical combs were performed using a photoelectric separation method.Results and DiscussionsThe average power of the fundamental frequency pump pulse is 485 mW, the center wavelength is 1.57 μm [Fig. 4(b)], and the pulse width is 45 fs [Fig. 4(a)]. The central wavelength of the fundamental frequency signal pulse is 1.85 μm, and the bandwidth is 250 nm [Fig. 5(a)]. The optical comb system was integrated and packaged by photoelectric separation packaging, and a prototype was prepared (Fig. 6). The measured center wavelength of the difference frequency light was continuously tuned in the 8.0‒10.5 μm range. The bandwidth of each tuning band obtained is greater than 1 μm, and the bandwidth of the 9.5 μm band reaches 2.43 μm, indicating that the wider fundamental frequency signal pulse expands the spectral tuning range and bandwidth of the DFG comb. The average power of each tuning band is greater than 240 μW, and the average power of the band with an 8 μm central wavelength reaches 470 μW [Fig. 7(a)]. The average power fluctuation is less than 1.5%, indicating that the power stability of the optical comb is excellent [Fig. 7(b)].ConclusionsWe independently designed and developed a stable broadband and wide tuning range DFG infrared comb. The fiber link was designed with full polarization-maintaining fiber. By locking the repetition frequency of the pulse source and using technologies such as self-similar fiber amplification, soliton compression, and SC generation, the two-color fundamental frequency pulses with center wavelengths of approximately 1.57 μm and 1.85 μm were obtained. An adjustable time delay line was used to precisely control the time synchronization of the two-color fundamental frequency pulses, and the spatial overlap of the two-color fundamental frequency pulses was strictly regulated. Using a GaSe nonlinear variable frequency crystal, the DFG mid-infrared comb output was obtained through the DFG process. The integrated and packaged instrumented mid-infrared comb has a spectral coverage of 7‒13 μm and a maximum spectral bandwidth of 2.43 μm. The design and development of the DFG mid-infrared optical comb offers a base for the development of optical combs for practical applications such as wavelength calibration and multi-component gas detection.
Dec. 10, 2023Vol. 50 Issue 23 2301008 (2023)
Hailin Hu, Yihang Yu, Dijun Chen, Guangwei Sun, Kangwen Yang, Fang Wei, and Fei Yang
ObjectiveCombined with current testing technology and space-based gravitational wave detection requirements, relative intensity noise (RIN) testing must cover the frequency range of 0.1 mHz?5 GHz. Currently, low-noise spectrum analyzer is used for RIN testing in the higher frequency band of 50 kHz?5 GHz, and relevant theories and testing methods are relatively mature. OEWaves of the USA SYCATUS of Japan and Shanghai Institute of Optical Machinery have launched corresponding standard test instruments. However, the current test methods in the low-frequency band are limited in the test band or have high background noise, which cannot fully meet the requirements of RIN low frequency band test and evaluation of laser light source for space-based gravitational wave detection. It is necessary to develop the low background noise measurement technology and complete and accurate evaluation standard of all low frequency band.MethodsIn this study, the low-frequency RIN within 0.1 mHz?100 kHz is completely tested and characterized, and the background noise of the test system is reduced to form a standardized test system and test algorithm. First, based on low-noise photodetector, high-precision digital multimeter, Labview control data acquisition, and data processing algorithm programming, the test characterization of laser RIN in the frequency band of 0.1 mHz?0.5 Hz was realized. In the time domain, the high-precision acquisition was conducted using the Labview software to control DMM. The fast Fourier transform (FFT) algorithm was used to analyze the noise characteristics of the collected data in the frequency domain. The smoothing function of different resolutions was used in the calculation of RIN to ensure that the test results in the low-frequency band are not true, while the serious "trailing" phenomenon in the high-frequency band was reduced. Besides, frequency domain analysis can be performed immediately upon the completion of the time domain collection, and the data can be stored in real time. Combined with the data of different sampling time, the accuracy of the very-low-frequency test results was verified. Second, FFT spectrum analyzer (SR770, Stanford Research Systems) was used to test the RIN of laser in the frequency band of 1 mHz?100 kHz. By adding low noise amplifier (LNA) into the test system, the background noise in the frequency band of 1 mHz?1 Hz was effectively reduced. The testing capacity was reduced by 18 dB. Finally, the consistency of the test results of the two test methods in the overlapping frequency band was compared to verify the uniformity and accuracy of the two test results. Finally, the low-background-noise RIN test band was expanded to 0.1 mHz?100 kHz. The RIN noise measurement system has the advantages of wide coverage of low-frequency band, high precision, and high accuracy. It can provide a standardized measurement means for the relative intensity noise of laser in space gravitational wave detection and can also be applied to other low-frequency precision measurement applications of laser light source noise assessment.Results and DiscussionsAccording to the sampling time listed in Table 3, data segments ranging from 10000 s to 8000 s are captured to calculate the laser very-low-frequency RIN, respectively, and the results are shown in Fig. 7. It can be seen that the high-frequency "tail" after Smooth piecewise smoothing algorithm is only 2 dB; in the range of 0.04 Hz to 0.5 Hz, different data lengths have little influence on RIN results. However, in the frequency range of 0.1 mHz?0.04 Hz, the sampling time of 8000 s is significantly different from that of 10000 s, and more noise information can be detected at 80000 s. Moreover, Fig. 7 shows that the curves with the sampling time of 10000 s and 2000 s have poor coincidence compared with other long periods. This is because the short test time leads to fewer data points in the frequency band of 0.1 mHz?0.04 Hz, resulting in decreased accuracy. In combination with the abovementioned and theoretical analysis, it can be seen that the longer the sampling time, the more accurate the test results.Figure 8(a) shows the RIN test results of two kinds of high-precision DMM and FFT spectrum analyzer simultaneously. Their test frequency bands cover 0.1 mHz?0.5 Hz and 1 mHz?100 kHz, respectively. As can be seen from Fig. 8(a), the two maintain a good consistency within 1 mHz?0.5 Hz in the overlapping frequency band, which on the one hand verifies the correctness of the test results. On the other hand, a complete test of RIN characteristics in the frequency band of 0.1 mHz?100 kHz can be completed by splicing the noise spectrum of the two test results. Figure 8(b) shows the complete relative intensity noise spectrum of the low-frequency band of 0.1 mHz?100 kHz obtained after splicing.The test technique in this paper is applied to test the RIN of different types of lasers, and the characteristics of laser RIN in the low-frequency band are obtained to guide the development and optimization design of the laser and the parameter performance of the application system.ConclusionsBased on the strict demand for laser noise in space-based gravitational wave detection, we complete the establishment of low-background relative intensity noise test characterization system in the low-frequency band, background noise up to -99 dBc/Hz@0.1 mHz, -165 dBc/Hz@100 kHz. This technology converts the optical signal of the laser into an electrical signal based on low-noise photodetector and performs the complete and accurate characterization of intensity noise in the range of 0.1 mHz?100 kHz through the combination of high-precision DMM, FFT spectrum analyzer, and other test means. The RIN of four typical lasers is tested and analyzed. The main noise characteristics of each laser and the subsequent available intensity noise suppression technology are obtained, and according to the noise performance of the self-developed NPRO laser, the direction of improving the relative intensity noise in the very-low-frequency band is proposed in the next stage. The relative laser intensity noise characterization test can provide accurate and unified evaluation method for laser source noise level in space gravitational wave detection and provide reference for laser source noise suppression.
Dec. 10, 2023Vol. 50 Issue 23 2301009 (2023)
Hao Zhan, Xin Zhang, Junqing Meng, Dawei Zhang, Chaoyang Zhong, Xia Hou, and Weibiao Chen
ObjectiveWith the development of single-photon detection technology, human exploration of Earth and space has enhanced the study of Earth's surface changes, such as those in ice, terrain, and vegetation, and improved the understanding of the impact of glaciers on sea level change. These detections have led to new requirements for the light source of LiDAR technology, including lasers with high repetition rates, narrow pulse widths, and narrow linewidths for improved detection distance and accuracy, enabling better observations of changes in surface characteristics. Lasers with all-fiber structures are more compact and stable, which have higher photoelectric conversion efficiency and longer lifespan. The optical fiber structure is more conducive to the multi-beam ground detection. This is because a certain detection blind zone between the beams exists, and the detection of multiple beams reduces the distance interval between the beams, resulting in a certain degree of gridded high-precision detection. All-fiber lasers are expected to enable thousand-beam laser ground detection and direct ground measurement.MethodsIn this study, a continuous seed light of 62.6 mW is used, which is modulated into pulsed light by an electro-optical modulator through a rectangular pulse signal from a signal generator. First, the pulsed seed light is amplified by a gain optical fiber to obtain pulsed light with a wavelength of 1064.43 nm, a linewidth of 0.037 nm, and a peak power of approximately 9.33 W. Then, through a gain fiber for two-stage two-pass amplification, the pulsed light with a linewidth of 0.037 nm and a peak power of approximately 383.5 W is obtained. After the first two-stage amplification, an acousto-optic modulator (AOM) is connected to filter out the continuous wave components of the front stage and improve the contrast of the pulsed light. The third-stage amplification is done through a PLMA-YDF-15/130 double-clad gain fiber to obtain pulsed light with a linewidth of 0.046 nm and a peak power of 7.11 kW. The main amplification stage uses the PLMA-YDF-25/250 and photonic crystal fiber (PCF) for amplification effect comparison. The PCF amplified linewidth is smaller than that of the PLMA-YDF-25/250, with no spontaneous radiation, stimulated Raman scattering, or other nonlinear effects. It obtains a wavelength of 1064.44 nm, pulse energy of 298 μJ, and pulse width of 1.34 ns for lasers with a linewidth of 0.05 nm. The corresponding maximum peak power of the laser is approximately 223 kW. The temperature-matched lithium triborate (LBO) is used for the frequency doubling of fundamental frequency light at an energy of 298 μJ, resulting in a green light output of 155.5 μJ. The frequency doubling conversion efficiency is 52%, and a beam quality of Mx2=1.28 and My2=1.26 are also obtained.Results and DiscussionsTo simplify the optical path and maintain the stability of the output, the forward amplification method is selected (Fig. 1). The main amplification stage uses the PLMA-YDF-25/250 and PCF for comparison. Under varying pump currents (Fig. 6), the former exhibits slightly higher optical conversion efficiency than the latter. At a current of 5.6 A, the PLMA-YDF-25/250 exhibits self-phase modulation effects, as shown by the spectral comparison (Fig. 7). Because the mode field area of the PCF is larger than that of PLMA-YDF-25/250, the threshold of nonlinear effects is increased, and other nonlinear effects, such as amplified spontaneous radiation and stimulated Raman scattering, are not observed at 298 μJ (Fig. 8). The optical path design uses a temperature-matched LBO crystal for frequency doubling on fundamental frequency light of 1064 nm, resulting in 155.5 μJ green light output with a frequency doubling conversion efficiency of 52% (Fig. 9).ConclusionsIn this study, a master oscillator power amplifier (MOPA) structure combined with photonic crystal fiber is used to obtain stable fundamental frequency light with a repetition rate of 10 kHz, a wavelength of 1064.44 nm, a linewidth of 0.05 nm, an energy of 298 μJ, and a peak power of approximately 223 kW. After the temperature-matched LBO frequency doubling, the resulting 155.5 μJ green light with a frequency doubling efficiency of 52% and beam quality of Mx2=1.28 and My2=1.26 can be used as a light source for space detection lidar.
Dec. 10, 2023Vol. 50 Issue 23 2301010 (2023)
Zhifang Du, Jie Fan, Haizhu Wang, Yonggang Zou, and Xiaohui Ma
ObjectiveDistributed Bragg reflector laser diodes (DBR-LDs) are widely used in pump sources, detectors, sensors, solar cells, and other applications because of their small size, long operating life, and high photoelectric conversion efficiency. With the development of modern technology and the demand for laser sources, higher requirements have been proposed for lateral modes of semiconductor lasers. The output of the fundamental lateral mode can be achieved by etching a narrow-ridge waveguide structure as this can limit the formation of higher-order lateral modes; however, it is difficult to further improve the maximum output power owing to the limitation of the narrow-ridge structure. Lasers, integrated by connecting a narrow-ridge waveguide to an optical amplifier, can obtain higher output power in the fundamental lateral mode. However, integrated devices are large, and the manufacturing process is complex. The method of etching microstructures on wide-ridge waveguide devices proposed in recent years ensures that the device overcomes lateral mode limitations and achieves excellent output performance. In addition, research on DBR devices has primarily focused on the spectral study of Bragg gratings. There has been less analysis of the influence of the Bragg grating on lateral mode distribution. In this study, a wide-ridge waveguide-based distributed Bragg reflector semiconductor laser with a combination grating structure (CDBR-LD) is designed and fabricated, and the influence of the combined grating structure on the modulation of lateral modes is investigated. The combination grating can modulate the spectral characteristics of the device and overcome higher-order lateral mode limitations.MethodsThe internal action of a semiconductor laser resonator with a combined grating structure is analyzed and calculated using a finite-difference time-domain method. Owing to the complex internal actions of the device, the internal process is divided into two parts, which are analyzed separately: the incident light and feedback light . The combined grating consists of hybrid and Bragg grating areas. Herein, the incident light refers to the light from the direction of the ridge waveguide to the hybrid grating area (Fig.2). The feedback light refers to the light from the Bragg grating area after the incident light is acted upon by the hybrid grating area (Fig.3). According to the distribution law of lateral modes, the energy of the fundamental lateral modes is concentrated in the central region, whereas that of the higher-order lateral mode is dispersed. The loss mechanism of each order of the lateral modes in the incident light and feedback light in the hybrid grating area is analyzed. The value of the narrowest width of the mixed grating region is WG; the effect of WG on the energy transmittance of each order lateral mode is compared (Fig.4). The ideal energy transmittance difference between the fundamental and the higher-order lateral modes is obtained with WG of 15 μm. Therefore, the hybrid grating area in the combined grating structure can suppress the higher-order lateral modes of the device.Results and DiscussionsAccording to the analysis of the far-field spots of the device (Fig.5), spectra(Fig.6), and the output power characteristics (Fig.7), the far-field spot of the DBR-LD has significant spot-splitting as the injection current increases from 0.7 A to 1.0 A because of the strong mode competition caused by the higher-order lateral modes. The far-field spot-splitting effect of the CDBR-LD is significantly eliminated as the injection current increases from 0.7 A to 1.0 A because the loss of the higher-order lateral modes caused by the hybrid grating area reduces mode competition. This indicates that the combined grating structure can play a role in modulating the lateral modes of the DBR device. The DBR-LD has a red shift from 1031.87 nm to 1036.1 nm, and the full width at half maximum (FWHM) of the spectrum increases from 1.17 nm to 1.44 nm as the injection current varies from 0.35 A to 0.95 A. The CDBR-LD can maintain good spectral characteristics, which shows a red shift from 1031.25 nm to 1037.15 nm, and the FWHM of the spectrum increases from 0.5 nm to 0.61 nm. Moreover, the FWHM of the CDBR-LD spectrum is narrower than that of DBR-LD because CDBR-LD has a larger grating area. Finally, the DBR-LD exhibits a saturation output power of 406 mW at an injection current of 1.2 A with a slope efficiency of 0.333 mW/A. Additionally, the CDBR-LD exhibits a saturation output power of 433 mW at an injection current of 1.25 A with a slope efficiency of 0.337 mW/A.ConclusionsA DBR semiconductor laser with a combined grating structure is proposed in this study. By etching a hybrid grating area on the front side of the Bragg grating area, the loss of higher-order lateral modes increases and weakens the mode competition, eliminating the far-field spot-splitting phenomenon in wide-ridge waveguide DBR semiconductor lasers. Subsequently, a CDBR-LD is fabricated and tested. The experimental results show that the far-field spot splitting of CDBR-LD is significantly reduced as the injection current increases from 0.7 A to 1.0 A. The FWHM of the CDBR-LD spectrum is narrower than that of the DBR-LD as the injection current increases from 0.35 A to 0.95 A. A minimal difference is observed between the output powers of the DBR-LD and the CDBR-LD at an injection current of 1.2 A. In addition, the waveguide and grating structure of the CDBR-LD are etched in one step using the ultraviolet lithography, which has the advantages of being a simple process with a low cost. Based on these results, it is expected that a DBR semiconductor laser with good lateral-mode characteristics can be obtained by optimizing the structure.
Dec. 10, 2023Vol. 50 Issue 23 2301011 (2023)
Keshuai Wu, Chunhua Wang, and Xiang Gu
ObjectiveMulti-wavelength Brillouin random fiber lasers (MBRFLs) are a new type of laser based on a random distributed feedback resonant cavity and the gain of the stimulated Brillouin scattering (SBS) effect. Because the SBS effect in MBRFLs have excellent properties, such as higher gain, lower threshold, narrower gain spectrum width, and higher sensitivity to environmental factors, it has been widely utilized in the study of fiber lasers. However, most studies are limited to non-polarization parameters, including wavelength, laser linewidth, intensity noise, and phase noise, and are rarely related to the polarization characteristics. In this study, we propose two novel orthogonal polarization interleaving multi-wavelength Brillouin random fiber lasers (OPI-MWBRFLs) that emit orthogonally polarized multi-wavelength light with single and double Brillouin frequency shift (BFS) intervals, based on the axial polarization pulling property of the SBS effect in polarization-maintaining fibers (PMFs). This system yields highly stable orthogonally polarized light, with an adjacent polarization extinction ratio as high as 33 dB. Compared with conventional MBRFLs, OPI-MWBRFLs can provide multi-wavelength lasing light with orthogonal polarizations between adjacent wavelengths, thus effectively eliminating inter-channel interference in dense wavelength division multiplexing (DWDM) systems with potential application in the fields of fiber sensing, optical fiber communication, and optical spectrum analysis.MethodsIn this study, we design two novel OPI-MWBRFLs that emit orthogonally polarized multi-wavelength light with single and double BFS intervals. First, based on the polarization vector propagation equation and the simplified intensity equation of the pump and signal lights of the SBS effect in PMFs, which theoretically indicate that the SBS effect in the PMF has an explicit axial polarization-pulling behavior. Second, we deduce the relationship between the traction direction and the state of polarization(SOP)of incident pump light, SBS gain, pump light polarization state, and pump light power. Finally, we realize a single BFS OPI-MWBRFL using a 3 km long PMF as the SBS gain medium, and demonstrate a double BFS OPI-MWBRFL by cascading a 21 km long single mode fiber(SMF)random cavity and a 3 km long PMF random cavity in the feedback loop of the single BFS OPI-MWBRFLs. In the double-BFS OPI-MWBRFL, we use a tunable laser (TLS) to output the pump light with a center wavelength of 1553.73 nm, then the pump light is adjusted by a polarization controller (PC1) and launched into 21 km long SMF through an ordinary SMF circulator (Cir1). In the random cavity, the SMF acts as a Brillouin gain medium and excitation of even-order Stokes light occurs in the opposite direction, of which 10% is output through the optical coupler (C2), and the rest is amplified by an erbium-doped fiber amplifier (EDFA1) and launched into a 3 km long PMF to stimulate higher-order Stokes light. Thus, by controlling the polarization state of the triggered Stokes light in the feedback loop, orthogonally polarized multi-wavelength lasers with single and double BFS intervals are output.Results and DiscussionsFor single BFS OPI-MWBRFLs, the number of output Stokes light wavelengths is positively correlated with the pump optical power. The total output spectrum when the EDFA is in the range of 80‒170 mW is measured (Fig.3). When the output power of the EDFA is set to 80 mW and 100 mW, six and seven wavelengths, respectively, are observed with a space of 0.088 nm (Fig.2). Under these power settings, four odd-orders of Stokes lights resonating at sign (p^in⋅β^l)β^l are measured, and the even-order Stokes light resonating at -sign(p^in⋅β^l)β^l are measured. Further, the extinction ratio of the polarization component exceeds 33 dB [Fig.2(c)]. In contrast, a double BFS OPI-MWBRFL is demonstrated by cascading a 21 km long SMF random cavity and a 3 km long PMF random cavity in the feedback loop of a single BFS OPI-MWBRFL. An orthogonally polarized 4-wavelength lasing light with a double BFS interval is observed, and the adjacent polarization extinction ratio is as high as 34 dB (Fig.6). Finally, after monitoring and measuring the power fluctuation and wavelength shift of the output laser of both schemes for 1 h without any mechanical and temperature stabilization measures, we observe that the maximum power fluctuation and maximum wavelength shift are within 0.21 dB and 0.02 nm (Figs.4 and 7), respectively, indicating the good stability of the system.ConclusionsIn this study, two novel OPI-MWBRFLs are proposed and implemented based on the axial polarization pulling effect of the SBS in PMFs. First, we analyze and discuss the polarization-mode operating region of the PMF-BRFL system and the corresponding operating conditions. Second, two experimental systems that can output polarization multi-wavelength light are realized using different random laser cavities, and the polarization extinction ratio is higher than 33 dB. Finally, the polarization orthogonality of these systems is guaranteed by the natural nonlinear axial polarization pulling effect of the SBS in the PMFs, rather than by the artificial precise polarization control of the systems; thus, the two OPI-MWBRFLs exhibit excellent working stability in experiments in the absence of mechanical or temperature control. The results of these experiments are highly consistent with expectations and have broad application prospects in the fields of optical fiber sensing, DWDM optical fiber communication, and spectral detection.
Dec. 10, 2023Vol. 50 Issue 23 2301012 (2023)
Yiming Meng, Jingfeng Xiang, Bin Xu, Biao Li, Jinyin Wan, Wei Ren, Siminda Deng, Di Zhang, and Lü Desheng
ObjectiveRubidium (Rb) atomic two-photon spectra have attracted great attention in connection with small atomic frequency standards due to their narrow linewidth, absence of Doppler background, and broadening characteristics. In the past few decades, extensive research has been conducted on Rb atomic two-photon spectroscopy. As early as the 1990s, F. Nez et al. measured the absolute frequency of the two-photon transition with an uncertainty of 1.3×10⁻¹¹. In 1994, Y. Millerioux et al. locked two lasers to the relevant hyperfine levels using Rb atomic two-photon transitions and achieved an instability of 3×10-13 in the 2000 s. In 2000, J.E. Bernard et al. used a frequency-doubled 1556 nm laser to precisely measure the two-photon transition frequency with a stability of 4×10-13 in 200 s. In 2020, Vincent Maurice et al. demonstrated a two-photon transition frequency standard on a micro-optical substrate using a miniature gas cell, achieving an instability of 2.9×10⁻¹² at 450 mW power for 1 s. In 2021, Zachary L. Newman et al. reported a two-photon frequency standard at NIST with an instability of 1.8×10⁻¹³ in 100 s averaging time. The Rb two-photon optical frequency standard has the advantages of compactness and high precision, and with the support of micro-comb technology, it is expected to be adaptable to a wider range of application scenarios to become the next-generation high-performance atomic clock. Therefore, it is necessary to investigate this two-photon optical reference with compact volume and high performance.MethodsWe conducted a two-photon fluorescence spectroscopy experiment using a high-purity 87Rb vapor cell and a 778.1 nm laser. The laser was generated by an external cavity diode laser (ECDL) and stabilized by direct current modulation. The laser was split into two beams by a polarization beam splitter (PBS) and coupled into single-mode polarization-maintaining fibers. One beam was used to excite the atoms in the vapor cell, which was heated to 110 ℃, and the other beam was used as a reference for the beat frequency measurement with an optical frequency comb. The fluorescence signal was detected by a photomultiplier tube (PMT) and amplified by a trans-impedance amplifier (TIA) and lock-in amplifier. The laser frequency was locked to the zero-crossing point of the error signal using a laser servo device. The experimental setup was fixed on an optical bench with no adjustable components so as to reduce the influence of optical alignment. We used a Glan-Taylor prism to maintain polarization, two focusing lenses to enhance the fluorescence signal, a high-reflectivity mirror, collecting lenses, a high-precision heating system, and an interference filter to optimize the fluorescence signal with a high signal-to-noise ratio and a magnetic shield to minimize the Zeeman effect.Results and DiscussionsWe obtained the fluorescence spectra and error signals of the two-photon transition 5S1/2-5D5/2 at 420 nm in 87Rb atoms using an external cavity diode laser (Fig.3). The laser frequency was scanned near the resonance and modulated by a sinusoidal current. We measured the dependence of the fluorescence on the laser power from 10 mW to 28.89 mW (Fig.4) and on the temperature of the Rb cell from 100 ℃ to 120 ℃. We determined the frequency shift coefficient of -7.11 kHz/mW (Fig.6), which shows a linear relationship between the optical power and the optical frequency shift over a range of optical power. We recorded the frequency distribution in two different situations (Fig.7) which shows that the beat frequency after locking is more stable than that before locking. Figure 8 illustrates the schematic diagram of the beam-focusing system. The alignment is shown near the focal point with the reflected light undeflected (left) and deflected by 0.005° (right). We tested the relation between the modulation width and the frequency shift (Fig.9). The Allan deviation of the beat frequency reached 1.50×10⁻¹² at an averaging time of 1 s and 2.88×10⁻¹³ at 500 s (Fig.10).ConclusionsA high-stability optical frequency reference based on the two-photon transition in 87Rb is developed and characterized. The system parameters such as laser power, temperature of the 87Rb cell, and modulation width are optimized for the locking performance. The key factors that limit the stability of the two-photon optical frequency reference are identified, including the signal-to-noise ratio of the spectrum, the internal modulation noise, the optical alignment of the counter-propagating beams, and the environmental sensitivity of the system structure. The two-photon optical frequency reference achieves a stability improvement of 1‒2 orders of magnitude over the conventional saturated absorption optical frequency reference and also reaches a high level among similar experimental schemes. To further reduce the frequency drift caused by environmental disturbances, future work can use low thermal expansion coefficient glass for the base and bracket of the optical components. Smaller Rb cell and optical elements are good ways to compress the optical path size. Ensuring a vacuum on the physical platform is another efficient way to decrease the influence of the environment. External modulation methods can also help to improve the system's performance.
Dec. 10, 2023Vol. 50 Issue 23 2301013 (2023)
Xiaobing Liu, Bin Wang, Bo Yao, Xiumei Yang, Chunge Yue, and Qinghe Mao
ObjectiveUltrastable lasers have important applications in precision measurement, precision spectroscopy, and quantum information. However, it is difficult to meet the requirements of the aforementioned applications using lasers in the free-running state because of frequency jitter and drift caused by external environmental factors. Various active techniques for stabilizing the laser frequency have been proposed and implemented. Among them, the ultrastable cavity Pound-Drever-Hall (PDH) frequency stabilization technology has a high locking accuracy and it is mature with wide application. Single-frequency fiber lasers have undergone rapid development in recent years. Based on the fiber laser's characteristics of narrow linewidth and low noise, ultrastable lasers with superior performance are developed. However, according to current reports, the most widely used ultra-stable laser sources are DFB fiber lasers. Because the resonance cavity and the fiber grating cavity mirror of DFB fiber lasers are integrated into the same structure, the length of the laser resonance cavity and the fiber grating cavity mirror can be simultaneously controlled when used for frequency stabilization of an ultrastable cavity PDH, which is very beneficial for obtaining a long-term locked ultrastable laser. Compared with DFB fiber lasers, DBR fiber lasers have more practical value for achieving ultra-stable cavity PDH frequency stabilization because DBR fiber lasers do not require rare earth-doped fibers to exhibit photosensitivity, are easier to manufacture, and have more advantages in terms of the laser band, wavelength flexibility, and other aspects. However, when DBR fiber lasers are used for ultrastable cavity PDH frequency stabilization, owing to the independent active temperature control of the fiber resonant cavity, coordinating the frequency of the FBG center with the frequency of the ultrastable cavity mode locked by the PZT during the PDH frequency-locking process is difficult. This makes long-term locking of the frequency of the DBR fiber laser difficult due to degradation of the frequency locking owing to laser mode hopping, making it difficult to meet the requirements of special applications, such as quantum entanglement experiments. Therefore, further study is required to achieve long-term locking of DBR fiber lasers based on ultra-stable cavity PDH frequency stabilization.MethodsA home-made 2 μm band DBR single-frequency fiber laser was used as the laser source. In order to quickly tune the frequency of the laser, a PZT that can be stretched axially along the fiber was pasted on the side of the laser resonator. The laser resonator was strictly insulated and equipped with an active temperature control device to reduce the influence of the external environment on the frequency stability of the laser so that it can meet the requirements of ultrastable cavity PDH frequency stabilization. A 1.0 μm band ultrastable cavity with an FSR of 1.5 GHz and a fineness of 15000 was used as the frequency reference, and the 1950 nm laser was locked to a transmission peak of the ultrastable cavity by using the ultrastable cavity PDH frequency stabilization scheme after using PPLN crystal frequency doubling. We experimentally confirmed that it is difficult to achieve long-term locking of ultrastable cavity PDH frequency stabilization based on a DBR single-frequency fiber laser. Therefore, herein, we propose and demonstrate a real-time temperature control scheme for DBR fiber resonators using a PZT feedback control signal to generate temperature control signals based on the frequency reference of the ultrastable cavity. This method first generates a temperature control signal by calculating and processing the PZT feedback voltage using a single-chip microcomputer and then realizes real-time temperature control based on an ultrastable cavity frequency reference for the DBR fiber resonator and its cavity mirror FBG through the temperature control signal, thereby resolving the issue of long-term locking of the DBR fiber laser.Results and DiscussionsThe quality of the laser output characteristics is a determinant of whether the laser can be locked; therefore, we first tested the laser output characteristics. Herein, the laser temperature is set to change from 15 ℃ to 35 ℃, the laser wavelength is changed by 1.06 nm [Fig. 2(a)], and when the temperature is stable, the laser can ensure a single-longitudinal-mode operation. The results of single-longitudinal-mode operation measured using the F-P scanning interferometer are shown in Fig. 2(b). By applying triangular wave modulation signals of different frequencies and voltages to the PZT, the measured frequency tuning range of the laser is found to be 1.6 GHz@52 V and the response bandwidth is approximately 8 kHz [Fig. 2(c)]. To characterize the quality of the laser-locking results, the frequency noise is measured before and after laser locking. The measurement results [Fig. 4(a)] show that the laser frequency noise is decreased by to 3‒4 orders of magnitude compared with that before locking, reaching a minimum of 0.08 Hz2/Hz@18 kHz. Through indirect beat frequency measurements, the laser linewidth after locking is determined to reach 255 Hz [Fig. 4 (b)], the frequency jitter of the laser reaches approximately 7 kHz within 2 h, and frequency instability reaches 3.76×10⁻¹³@1000 s (Fig. 5). Implementing a real-time temperature control scheme based on the frequency reference of the ultrastable cavity for the laser prevents the PZT voltage of the laser from reaching the voltage value at which the laser generates mode hopping [Fig. 7(a)]; thus, the laser will not lose its lock because of mode hopping. By monitoring the light intensity at the transmission port of the ultrastable cavity for 240 h using a photodetector followed by a digital multimeter, it is found that the transmitted light intensity remains relatively stable [Fig. 7(b)], which indicates that the developed laser achieves long-term locking.ConclusionsWe report a custom-built 2 μm band DBR fiber laser that can be used as an ultrastable laser source, in which frequency locking was achieved based on ultrastable cavity PDH frequency stabilization. The adiabatic constant-temperature packaging of the laser and built-in PZT with a frequency-tuning function meet the requirements of ultrastable cavity PDH frequency stabilization experiments. After frequency doubling using a PPLN crystal, the 1950 nm fiber laser successfully achieves frequency locking by using a ultrastable cavity with an FSR of 1.5 GHz, a fineness of 15000, and operation in 1 μm band as a frequency reference. DBR fiber lasers are difficult to lock in for a long time when implementing ultrastable cavity PDH frequency stabilization. We propose and demonstrate a scheme for using the PZT feedback control signal to trigger the generation of temperature control signals. Real-time temperature control is implemented based on an ultrastable cavity frequency reference for DBR fiber resonators to achieve long-term frequency locking of such DBR fiber lasers based on ultrastable cavity PDH frequency stabilization. The real-time temperature control scheme based on the frequency reference of the ultrastable cavity for DBR fiber resonators proposed herein provides an important reference point for realizing long-term ultrastable cavity PDH frequency stabilization of DBR fiber lasers.
Dec. 10, 2023Vol. 50 Issue 23 2301014 (2023)
Lingling Jiang, Shengjie Ma, Yongbin Zhu, Tingqing Cheng, and Haihe Jiang
ObjectiveCurrently, nanosecond pulsed 3 μm lasers are of interest for many scientific research and practical applications. For mid-infrared optical parametric oscillators (OPOs), pumping sources with longer wavelengths are desirable to reduce the quantum loss in the parametric conversion. Moreover, pumping sources with short pulse duration and high peak power can improve the conversion efficiency to the mid-infrared wavelength (3‒12 μm range) and obtain greater output power or energy. Another important application of nanosecond pulsed 3 μm lasers is related to the distinctive features of water and hydroxyapatite, i.e., extremely high absorption in the vicinity of the 3 μm wavelength range. Therefore, pulsed lasers in this wavelength range are widely employed for medical ablation surgery, particularly for dental and orthopedic applications. Further, lasers with high repetition rate can improve the ablation efficiency of hard tissue and speed up the treatment process. If the laser pulse duration is less than the thermal diffusion time, unnecessary thermal damage to the surrounding healthy tissue can be reduced. Therefore, it is a common endeavor to achieve a stable 3 μm laser output with a high peak power and short pulse duration at a high repetition rate.Bulk LiNbO3 crystals have excellent acousto-optical (AO) properties and can be used as an ideal AO medium, exhibiting higher transmission in the 3 μm wavelength range, lower acoustic attenuation coefficient (1 dB/cm @ 1 GHz), and higher damage threshold (>200 MW/cm2). More than 30 years ago, scientists attempted to use LiNbO3 crystals to create an AO Q switch, but it failed to work at 3 μm wavelength. Recently, we innovated and developed a LiNbO3-based AO Q switch, and its effectiveness was verified in our previous study. In this work, the output characteristics of a LiNbO3 AO Q switch at a high repetition rate are investigated in an Er, Cr∶YSGG laser. Hence, the output characteristics of an AO Q-switched Er, Cr∶YSGG laser pumped by a flash lamp at a high repetition rate are studied. The thermal focal lensing effect in the gain medium is compensated using a plane-convex resonator (PCR), which significantly improves the beam quality and output capacity of the laser at a high repetition rate. A stable output of the LiNbO3 AO Q switch in the Er, Cr∶YSGG laser is realized.MethodsTo effectively compensate for the thermal focal lensing effect, the thermal focal lengths of Er, Cr∶YSGG laser crystals are calculated theoretically. Because the thermal focal length of the laser crystal is related to many factors, the corresponding theoretical calculation cannot be completely accurate. Hence, the thermal focal length of the Er, Cr∶YSGG laser crystal is measured using the critical resonator stabilization method in a plane-parallel resonator at 100 Hz. The theoretical calculation and actual measurement results are presented in Fig.2. According to the design theory of the resonator with the embedded thermal lens, the curvature radius of the convex mirror in the plane-convex resonator should be -166.3 mm. Therefore, convex mirrors with curvature radii of -100, -150, and -200 mm are adopted as rear mirrors in the respective experiments to measure and collect laser pulse energy. It can be seen from Fig.3 that the compensation effect of the convex mirror with a curvature radius of -150 mm is better than those with -100 mm and -200 mm curvature radii.Results and DiscussionsTo explore the influence of the reflectivity of the output coupler(OC)mirror on the output performance of the LiNbO3 AO Q switch, the reflectivity is set at 60%, 70%, and 80% for experimental research in the plane-convex resonator, and the results are shown in Fig.4. The optimum reflectivity of the OC mirror of the LiNbO3 AO Q-switched Er,Cr∶YSGG laser is 70%. To explore the influence of the thermal focal lensing effect on the output performance of the LiNbO3 AO Q switch, a comparison experiment of Q-switching between the plane-parallel resonator and the plane-convex resonator is performed. It can be seen from Fig. 5 that the structure of the plane-convex resonator can improve the output performance of the LiNbO3 AO Q-switched Er, Cr∶YSGG laser in a certain pump energy range. The diffraction efficiency is varied by changing the radio frequency driving power(RFDP) added to the Q switch, and the output performance of the laser is explored. As can be seen from Fig.6, when the repetition rate is 100 Hz, the maximum pulse energy and minimum pulse duration are 4.36 mJ and 76.8 ns, respectively, when the RFDP is 30 W. Moreover, thebeam qualityfactor (M2) and the stability of the LiNbO3 AO Q-switched Er, Cr∶YSGG laser are examined. As shown in Fig.7, for the pulse energy of 4.36 mJ, the beam quality factor (MX2) in the X direction and the beam quality factor (MY2) in the Y direction are 8.3 and 7.7 at 100 Hz. Further, as shown in Fig.8, the degree of energy stability (standard deviation) of the laser is 2.55%.ConclusionsThe results show that the designed LiNbO3 AO Q switch can realize nanosecond pulse output at a high repetition rate in a 2.79 μm Er, Cr∶YSGG laser. The plane-convex resonator structure can effectively compensate for the thermal lensing effect of the gain medium, optimize beam quality, and improve the output performance of the laser. Increasing the radio frequency driving power of the AO Q switch can increase the pulse energy and compress the pulse duration, thus improving the output performance of the LiNbO3 AO Q-switched Er, Cr∶YSGG laser.
Dec. 10, 2023Vol. 50 Issue 23 2301015 (2023)
Lihua Deng, Baiyi Yan, and Wei Liang
ObjectiveThe advancement of continuously tunable, miniaturized, narrow-linewidth external-cavity semiconductor lasers holds a key position in applications such as continuous-wave LIDAR and quantum technologies. By coupling a distributed feedback (DFB) laser with a short Fabry-Perot (FP) cavity and using piezoelectric ceramics (PZT) for cavity length modulation, a miniaturized tunable laser system operating at a wavelength of 1550 nm is realized. Experimental validation using a Mach-Zehnder interferometer (differential fiber length of 1 m) reveals a mode-hop-free tuning range exceeding 10 GHz. The frequency tuning ranges of 25.0, 21.6, 18.0, and 10.0 GHz are demonstrated at the repetition rates of 0.1, 1.0, 10.0, and 100.0 kHz, respectively. Additionally, utilizing the self-delayed heterodyne technique, the laser exhibits a 3 dB linewidth approaching 10 kHz. Forthcoming endeavors would aim to achieve a broader tuning range with a narrower linewidth by optimizing the optical pathway and modifying the cavity mirror reflectivity.MethodsThis study introduces a meticulously designed butterfly encapsulated laser module with dimensions of 20.8 mm×12.7 mm× 8.9 mm. The configuration leverages a dual-output 1550 nm DFB laser diode that is controlled in terms of both current and temperature via an in-house circuit system. A schematic of the laser architecture is shown in Fig. 1. The optical resonator is formed by a planar mirror (M1) and concave mirror (M2), with M2 affixed to the PZT. This fosters cavity length modulation. Emissions from the DFB diode undergo meticulous collimation via a silicon lens and propagate within the cavity. Subsequently, these leak out of the cavity and are fed back into the diode. This results in a self-injection-locked state. The feedback phase is controlled using a heating resistor placed on top of a silicon lens.Results and DiscussionsLinewidth evaluations are conducted using a 20 km fiber-based self-delayed heterodyne measurement system. The spectral characterizations reveal a 20 dB linewidth close to 200 kHz, as shown in Fig.3. The corresponding self-injection frequency-locking signal is shown in Fig.2. To demonstrate the continuous-tuning capabilities of the laser, we use a function generator with two output channels to apply two triangular modulation signals to the PZT and the current of the diode with the same phase. Both feedback phase and amplitudes of the two modulation signals are optimized to extend the continuous tuning to the extent feasible. Using a fiber Mach-Zehnder interferometer with a differential length of 1 m, we measure a continuous tuning range of 25 GHz at a repetition frequency of 0.1 kHz. This is shown in Fig. 4. An increase of the repetition frequency to 100 kHz still permits continuous tuning exceeding 10 GHz.ConclusionsWe successfully develop a wide-range continuously tunable narrow-linewidth external cavity semiconductor laser. By scanning the DFB laser current, synchronizing the phase control, and manipulating the PZT to alter the effective cavity length, the external cavity laser consistently maintains its self-injection lock during dynamic tuning. This results in a continuous tuning range of 25 GHz and linewidth of 10 kHz at a low repetition frequency of 0.1 kHz. In scenarios with higher repetition frequencies, the laser achieves continuous tuning beyond 10 GHz. Future plans would involve the design of a more compact feedback optical path and optimization of the control circuitry to achieve a wider continuous tuning range.
Dec. 10, 2023Vol. 50 Issue 23 2315001 (2023)
Yang Lai, Jindong Wang, Haoran Guo, Xu Wang, Mengxin Fu, and Weiwei Liu
ObjectivePantograph is an important part of the metro traction power system. In the long-term operation of the metro, the pantograph carbon slider continues experiencing wear. If the pantograph wear detection is not timely or accurate enough, it is easy to cause failure and even metro safety accidents. Therefore, it is important for the safe operation of the metro to realize high-precision online detection of pantograph wear. At present, the metro pantograph wear detection is mostly manual detection and image detection. The manual detection method requires metro shutdown, and the detection efficiency is low. The image detection method can realize the non-contact online detection of pantograph wear, which improves the detection efficiency and accuracy. However, the image detection method is affected by factors such as illumination, vehicle speed, and interference. There is a situation that the quality of the original picture is poor and the pantograph profile cannot be accurately extracted, which greatly lowers the accuracy of the pantograph wear detection. Aiming at the pantograph wear detection in metro operation, an online detection method of metro pantograph wear based on line-laser measurement is proposed to realize high precision, high efficiency and online detection of metro pantograph wear.MethodsIn this study, the line-laser sensor is used to realize the data acquisition of the pantograph profile of running metro. For the collected pantograph profile data, firstly, the effective pantograph profile data are selected by threshold setting. Secondly, a feature point search algorithm based on point cloud window moving calculation is proposed to realize the feature point search of pantograph profile data and separate the carbon slider profile data. Then, the Savitzky-Golay filtering algorithm is used to denoise the carbon slider profile data. Finally, the combination of coarse registration based on principal component analysis (PCA) and accurate registration of iterative closest point (ICP) algorithm with interval constraints is used to realize the registration of carbon slider profile and standard profile, and the evaluation of pantograph wear is completed. The accuracy and effectiveness of the feature point search algorithm based on point cloud window moving calculation and the pantograph wear detection method are verified by experiments.Results and DiscussionsIn order to realize the detection of pantograph wear in running metro, an online detection system of pantograph wear in metro based on line-laser measurement is designed, and the data of pantograph profile are collected by line-laser sensor (Fig.3). The effective profile data of pantograph are screened out by setting thresholds for the height and number of pantograph profile data, and the effective profile data of pantograph are screened out (Fig.4). The feature point search algorithm is used to solve the minimum variance index and the maximum point-line distance of the profile data (Figs.7 and 8). The accuracy of the feature point search algorithm is verified by four sets of collected pantograph profile data (Fig.9 and Table 1). The Savitzky-Golay filtering algorithm is used to denoise the separated carbon slider profile data (Fig.10). The initial position of the separated carbon slider profile and the standard carbon slider profile is adjusted by the rough registration based on PCA (Fig.11). The profile intervals involved in accurate registration are divided, and the final registration result is obtained by ICP to complete the pantograph wear evaluation (Figs.12 and 13). The accuracy of the detection method is verified by the pantograph wear detection experimental platform, and the wear values of five positions of the pantograph are detected and compared with the standard values (Table 2).ConclusionsIn this paper, an online detection method of metro pantograph wear based on line-laser measurement is proposed to achieve the accurate and efficient detection of running metro pantograph. The detection method realizes the collection of running metro pantograph through line-laser sensor. Firstly, the collected pantograph profile data are preprocessed by threshold setting, and the effective pantograph profile data are selected. After preprocessing, a feature point search algorithm based on point cloud window moving calculation is proposed. The feature point search algorithm finds the critical feature point of the horn profile and the carbon slider profile by traversing the profile data, and separates the carbon slider profile data. The Savitzky-Golay filtering algorithm based on least squares is used to denoise the separated carbon slider profile data to eliminate the interference of noise points on profile registration. Finally, the combination of coarse registration based on PCA and accurate registration of ICP with interval constraints is used to realize the registration of carbon slider profile and standard profile. According to the registration result of carbon slider profile, the accurate evaluation of pantograph wear is realized. The effectiveness of the pantograph wear detection method is verified through the detection experimental platform for pantograph wear, and the detection method meets the wear detection requirement of ±0.5 mm.
Dec. 10, 2023Vol. 50 Issue 23 2304001 (2023)
Chen Hu, Chaoyang Wei, Songlin Wan, Guochang Jiang, Haojin Gu, and Jianda Shao
ObjectiveWith the continuous development of laser pulse width limits and improvement of peak power, the size of the pulse compression grating (PCG) must be further increased. However, the high-precision manufacturing and testing of large aperture and long focal distance off axis parabolic (OAP) mirrors required by reflective exposure systems, has presented a difficult challenge that restricts the manufacturing of large aperture gratings. The method based on computer generated holograms (CGH) does not require a complex design and setup, however, it introduces non-rotational symmetry and complex two-dimensional projection distortion. When correcting distortion, traditional marker point s and analytical methods have limited accuracy or complex calculations, which are not conducive to engineering applications. Therefore, this study proposes a distortion correction method based on numerical calculation, with the advantages of simplicity, versatility, and ease of programming. Based on the CGH test optical path, high-precision surface measurement can be achieved using system error calibration and distortion correction methods, laying the foundation for OAP mirror surface accuracy manufacturing and subsequent establishment of large aperture reflective exposure systems.MethodsInitially, a Φ800 mm folding mirror is adopted to effectively shorten the optical path length, enabling development of a CGH measurement optical path on an 18 m vibration isolation air flotation optical table (Fig.2), and design a beam expansion system that matches the measurement aperture of the interferometer and CGH. Subsequently, the measurement errors introduced by the main optical elements in the optical path, excluding the interferometer, including CGH, beam expansion system, and fold mirror, are analyzed in detail, and the errors introduced are calibrated and removed. Thereafter, to ensure that the machining coordinate system matches the testing coordinate system, to achieve the precise positioning and convolution of the removal function and figure error, it is necessary to correct the distorted surface map measurement. Therefore, the mapping relationship between mirror, CGH, and CCD coordinate points is established based on the imaging distortion model (Fig.9). Finally, according to the corrected surface map, the OAP mirror is fabricated using Magnetorheological Finishing (MRF) technology.Results and Discussion. Once the measurement optical path is established, the surface map measured by the interferometer was compared with that measured by the coordinate measurement machine (CMM). Except for the projection distortion in the interferometric measurement results, the distribution of other features is basically consistent (Fig.3). When the CGH calibratable errors, beam expander system, and fold mirror are superimposed, the measurement optical path system error is 11 nm RMS (Fig.8). After error compensation, the measurement optical path error does not exceed RMS 5.4 nm (Table 5). Among them, the fold mirror figure error is the main error source. The coordinate positions and positional errors of the distortion correction points are listed (Table 6). The maximum correction error is 1.96 mm, which is smaller than the testing interferometer measurement resolution. This measurement accuracy meets the of magnetorheological computer numerical control (CNC) machining positioning accuracy requirements. Post processing, the OAP mirror figure error after distortion correction is PVr: 0.130λ, RMS: 0.013λ (Fig.11). By comparing the surface map distributions before and after distortion correction, it can be observed that the corrected surface map distribution and values are fundamentally consistent with those uncorrected s, and with the mirror coordinates. This result provides a good basis for subsequent light field exposure analysis and performance evaluation.ConclusionsFor the measurement of a 1650 mm×1120 mm long focal distance OAP mirror, an Φ800 mm fold mirror is introduced to shorten the CGH compensation measurement optical path. Using error analysis and calculation, the calibratable error in the optical path is projected onto the CCD, and then calibrated and removed, thereby achieving improved measurement accuracy. Considering the projection distortion error caused by simultaneous measurement, a correction method based on ray tracing and imaging distortion model fitting is proposed. Compared with traditional methods, the proposed method is extremely suitable for numerical programming calculations. Once processing verification completes, the figure accuracy can converge to RMS 0.013λ, and meet the requirements of high-precision OAP mirror specifications and manufacturing, laying a foundation for the subsequent establishment of large aperture reflective exposure systems.
Dec. 10, 2023Vol. 50 Issue 23 2304002 (2023)
Ting Wang, Jingpei Hu, Lihua Huang, Aijun Zeng, Huijie Huang, and Sergey Avakaw
ObjectiveLithographic technology is crucial for fabricating ultralarge-scale integrated circuits. The performance requirements of lithography machines are constantly increasing owing to rapid developments in the semiconductor industry. The use of various resolution enhancement techniques has also led to a continuous reduction in the critical dimensions of integrated circuits. Among them, the source mask optimization (SMO) technology optimizes the pupil illumination mode and mask pattern of the illumination system, effectively improving the lithography resolution and increasing the depth of focus, and thus has been widely used in immersion lithography machines at ≤28 nm nodes. In particular, two methods are commonly employed to implement the freeform illumination: One uses diffractive optical elements to achieve freeform illumination. However, it lacks flexibility because a single element can only produce a single pupil shape. The other method involves precise control of the angular position distribution of the micromirrors in a freeform illumination module to realize different freeform illumination modes. This method is more flexible and can compensate for illumination system deviations in real time. Currently, the freeform illumination module has become a standard feature of immersion lithography machines at ≤28 nm nodes . Micromirror arrays (MMAs) are the core components for implementing freeform illumination, and accurate monitoring of their angular positions is a prerequisite for implementing any illumination mode. However, owing to the high integration and small size of the micromirrors in an MMA, adjacent mirror surface reflections can easily cause crosstalk during the actual detection. This study proposes a spot crosstalk suppression algorithm for detecting the angular positions of MMAs, which enables high-precision detection of the angular position of each micromirror, even under crosstalk conditions.MethodsA spot crosstalk suppression algorithm for monitoring the angular position of an MMA is proposed to address the issue of crosstalk between adjacent mirror surface reflections, which is prone to occur because of the high integration and small size of the MMA. Accordingly, the relative light intensity matrix is first calibrated by the light intensity of the micromirrors under test and neighboring micromirrors in the array. Because the relative light intensity matrix remains unchanged during the testing process, the centroid light intensity matrix equation can be derived through unified testing and data processing of the MMA. Solving the light intensity matrix equation, the influence of spot crosstalk during the testing process can be eliminated, and ultimately, the angular position information of each micromirror in the MMA can be obtained.Results and DiscussionsThis study is based on an MMA angle position detection unit (Fig.2), and three different spot overfill ratios are considered (Table 1). The simulation results show that when the MMA is illuminated with spots under different extra spot ratios, the use of spot crosstalk suppression algorithms can improve the accuracy of the angular position of each micromirror in the MMA (Tables 2 and 3). When the crosstalk exists between the spot size and the size of a single micromirror, the spot-crosstalk suppression algorithm significantly improves the accuracy of the angular position of each micromirror in the MMA. The maximum detection error of the micromirror is reduced from 5387.48 μrad to 7.29 μrad, meeting the requirement of the free pupil illumination module specification that the detection error is less than 10 μrad. The data also show that the accuracy of the angular position of the middle micromirror in the MMA is 10-2 μrad for different spot sizes; whereas, the error of the angular position of the peripheral micromirror is larger owing to its deviation from the detection system axis. Overall, the spot-crosstalk suppression algorithm can significantly improve the accuracy of the angular position of each micromirror in the MMA when crosstalk exists.ConclusionsThis study proposes a spot crosstalk suppression algorithm. The reflection intensities of the micromirrors to be tested and their neighboring mirrors are measured in advance to determine the relative light intensity matrix in the MMA angle position measurement. The centroid light-intensity matrix equation of the MMA can be derived by combining this matrix with the relative light-intensity matrix obtained through MMA scanning and calibration. The angle position of each micromirror in the MMA can be obtained by solving the centroid light intensity matrix equation, which significantly improves the accuracy of the angle position determination when spot crosstalk is present. With this method, the accuracy of the angle-position determination of each micromirror in the MMA can be improved to within 10 μrad, which meets the requirements for detecting the angle positions of the micromirrors in the free-illumination module of lithography machines. Therefore, the proposed detection method effectively solves the crosstalk problem in the MMA detection process, which is of great significance for the practical application of free-pupil illumination modules in lithography machines.
Dec. 10, 2023Vol. 50 Issue 23 2304003 (2023)
Bo Mei, and Zhinan Zeng
ObjectiveWith its ultrafast time resolution, broadband spectrum, full coherence, and simple generation and selection devices, high-order harmonic generation (HHG) has shown its potential in the fields of ultrafast optics, strong-field physics, and semiconductor imaging. The characterization of the spatial domain properties of the high-order harmonics is important for applications in the attosecond electron dynamics processes. Although spatial measurements such as the Hartmann wavefront sensor (HWFS) and holography have been proposed in many areas, the extreme ultraviolet (EUV) or X-ray wavelength of the high-order harmonics and the difficulty of introducing reference light make spatial measurements of high-order harmonics a challenge. This paper introduces an improved mixed-state ptychography scheme to realize the spatial measurement of high-order harmonics. This approach makes good use of the multiple wavelengths of the high-order harmonics as well as reduces the stability requirements of the light source. We hope that it will be useful for spatial domain measurements of high-order harmonics and for the study of high-order harmonics generation and focusing.MethodsIn order to reduce the experimental requirement for the reconstruction of high-order harmonics, we try to make use of known information in our algorithm as more as possible and focus only on the reconstruction of the probe; the reconstruction of the sample is not important. Therefore, we modify the existing mixed-state ptychography scheme and introduce two priori conditions: the spectral distribution at different wavelengths and a specific sample with a certain contrast. These priori conditions are easily obtained experimentally. For the first iteration, the probe size is obtained, and then it is substituted into the initial estimated probe along with the priori spectral distribution. Subsequent iterations are performed with the modulus and frequency domain constraints to achieve complex amplitude reconstruction of the probe. The sample is not updated during the iterative process, thus making it more applicable to high-order harmonics. The effect of sample absorption or contrast on the reconstruction is investigated by varying the sample thickness.Results and DiscussionsIn the reconstruction of high-order harmonics with simple wavefront (Fig. 3), we successfully reconstruct the complex amplitudes of the five EUV wavelengths with very low errors as well as a highly consistent spectral distribution. Also, we perform additional reconstructions of the sample without changing the scan matrix, resulting in poorer reconstruction quality of the probes. This indicates that the priori sample information is important for the probe reconstruction at such a small scan matrix. In the reconstruction of the complex wavefront (Fig. 4), we find that the reconstruction of the phase is great, but the reconstruction of the amplitude is not satisfactory (Fig. 5). In addition, the error curve is larger and the spectral distribution is deviated compared with that of the simple wavefront case (Table 1).By varying the contrast of the particular sample, we find that different sample absorption has an important effect on the reconstruction and that the best complex amplitude reconstruction is obtained at a sample contrast of about 0.19 (Fig. 6). Despite continuing to increase the sample contrast, the quality of the probe amplitude reconstruction remains good. However, the reconstruction of the phase is affected by introducing a large phase due to the increase in thickness. Furthermore, our investigation using the optimum sample contrast (Fig. 7) reveals that the scan matrix could be reduced while maintaining the reconstruction quality, thus reducing the stability requirements for the light source.ConclusionsIn this work, a scheme that is more favorable for the characterization of spatial domain wavefront of the EUV high-order harmonics is proposed. The scan matrix is reduced by means of known sample information and spectral distribution, thus ensuring the reconstruction quality with reduced stability requirements for the light source. We have succeeded in reconstructing simple wavefronts with a small 3×3 scan matrix. For more generalized complex wavefronts, we have also carried out simulations, illustrating the feasibility and advantages of the scheme for high-order harmonic wavefront recovery. More critically, we find that sample contrast has a significant impact on the reconstruction. The best reconstruction quality is obtained when the sample contrast is around 0.19. And samples with a certain contrast can reduce the scanning matrix while maintaining the reconstruction quality. This scheme makes up for the shortcomings of traditional phase measurement methods and requires low stability of the light source. It is an important tool for recovering high-order harmonic wavefronts.
Dec. 10, 2023Vol. 50 Issue 23 2304004 (2023)
Yi Shen, Biaofeng Zeng, Zhenrong Zheng, and Longhua Tang
ObjectiveLaser-coupled tunneling junction devices can lead to various phenomena such as electromagnetic field local enhancement and optical rectification effects, which have significant applications in fields such as plasmon optical tweezers, single-molecule imaging, and single-photon light sources. Using optical fields to drive tunneling junction nanodevices may also reduce the size of electronic devices and improve their speed. The main methods to construct tunneling junction devices include tunneling junctions with adjusted nanogap through dynamic methods and tunneling junction devices with fixed nanogap through methods like electromigration and feedback electrodeposition. However, the fabrication of tunneling junction devices by electromigration still has the issues of high cost, time consumption, and low success rate. In previous works, our group successively fabricated novel solid-state tunneling junction nanodevices with stable nanogap through feedback electrodeposition, and these devices are appropriate for such research. In the present study, we couple continuous laser to the characteristic solid-state tunneling junction nanodevices and systematically study the cause of photoinduced tunneling current. We hope that our results may provide a reference for the optical manipulation and optoelectronic coupling of solid-state tunneling junction nanodevices, and contribute to the development of optically coupled solid-state tunneling junction-related devices and technologies.MethodsThe fabrication of solid-state tunneling junction nanodevices includes seven steps. Firstly, pull θ-shaped double-hole quartz glass tubes into nanoprobes with conical tips through external forces at both sides while heated at the center using a cone puller. Secondly, introduce butane gas into the double holes of the nanoprobes and use a butane spray gun to heat the tip, causing the butane gas to undergo pyrolysis and carbon deposition at the tip. Thirdly, insert copper wires with a diameter of 0.5 mm into the two holes, so that the front ends of the copper wires are in contact with the carbon inside the nanoprobes. The copper wires are fixed using a hot melt adhesive. Fourthly, etch the exposed carbon material at the tip of the nanoprobes using an electrochemical workstation, to form deposition sites as the preparation for subsequent gold electrodes. Fifthly, pre-electrodeposit gold electrodes at the tip of the nanoprobes using the constant current method. Sixthly, feedback-electrodeposit gold electrodes at the tip of the nanoprobes using the constant potential method. Finally, soak the fabricated electrodes in deionized water for more than 12 h, so that the gold atoms on the tip surface of the electrode reach a stable state through a self-resetting effect, and solid-state tunneling devices with sub-5 nm nanogaps are obtained.Results and DiscussionsThe current in the devices increases when the laser is switched on, and decreases when the laser is switched off at zero bias voltage, which proves the presence of photocurrent. The tunneling junction nanodevices exhibit quick optical response, and the photocurrent at zero bias voltage shows that a significant spontaneous thermal current exists in such devices. Influencing factors of the photocurrent are then researched. When the laser power grows, the photocurrent grows linearly within the power range of 0‒1000 μW. And the photocurrent decreases when the power exceeds 1000 μW due to irreversible optical damage. When the modulation frequency grows, the photocurrent decreases inversely within the frequency range of 250‒6000 Hz. This result shows that thermal expansion effects play an important role in photocurrent (Fig.3). The relation between photocurrent and polarization angle follows a square-of-cosine rule, and the photocurrent has a period of 180°. This result shows that plasmon resonance effects contribute to the photocurrent, which includes plasmon-induced thermal expansion current and hot carrier current. And the photocurrent does not decrease to zero whatever the polarization angle is, which proves the presence of thermal voltage current. When the bias voltage grows, the photocurrent grows linearly, which shows that optical rectification effects are not significant in our experimental conditions (Fig.4). The simulation results also show the polarization dependence of electrical field intensity, which is positively correlated with the temperature rise. When the devices are put in the air and illuminated by the laser with a power density of 106 W/m2, the temperature in the devices rises from 300 K to 312.6 K in less than 5 ms (Fig.5).ConclusionsIn the present study, the influencing factors and causes of the photocurrent in solid-state tunneling junction devices are systematically studied. Under laser illumination, significant photocurrent is generated in the tunneling junction nanodevices. The experiment and simulation results show that the local thermal expansion effects, thermal voltage effects, and hot carrier effects are the main reasons for photocurrent generation, while optical rectification effects are not significant. Additionally, the optical rectification effect is not significantly limited by the laser peak power. To get the maximum photocurrent, we can increase laser power and bias voltage (under threshold), decrease modulation frequency, and choose an appropriate polarization angle. And it is possible to amplify the optical rectification effects using a pulsed laser. Our study may contribute to the study of the interaction mechanism between laser and nanostructures, as well as provide a reference for the control of photocurrent.
Dec. 10, 2023Vol. 50 Issue 23 2313001 (2023)
Pengxiang Liu, Wei Li, Feng Qi, Chuncao Niu, Weifan Li, Qiaoqiao Fu, Liyuan Guo, and Zhongyang Li
ObjectiveThe 2‒3 μm short-wave infrared band exhibits unique properties during interactions with gas molecules and biological tissues. Thus, it finds applications in various domains such as remote sensing of greenhouse gases, atmospheric pollution, and medical treatments. Coherent sources in this band play a key role in the above fields and the tunability of the coherent sources is an important factor, especially in multiple molecule spectroscopy. OPOs have proved to be effective light sources with desired wavelengths, owing to the following merits: the commercial availability of well-developed lasers and nonlinear crystals, coupled with their agile frequency tunability. Bulk KTiOPO4 (KTP) serves as an excellent OPO medium owing to its high optical damage threshold, moderate nonlinearity, wide phase-matching (PM) wavelength region, and low cost. However, most previous studies focused on doubly resonant operation at wavelengths below 2.4 μm. In this study, we perform an experimental analysis of nearly singly resonant KTP-OPO with a wide tuning range of 2.05‒2.97 μm under a small rotation angle.MethodsA commonly used PM geometry of Nd∶YAG laser pumping KTP-OPO (type-II, θ-tuning in the x-z plane) is presented in Fig.1. In the range of θ<50°, the output wavelength changes rapidly with the PM angle. Thus, a KTP cut at θ≈48° incorporating properly coated cavity mirrors can theoretically perform a singly resonant OPO, covering 2.2‒3.0 μm under a rotation (external) angle of ±4°. The experimental setup of the OPO is illustrated in Fig.2. A Q-switched Nd∶YAG laser is used as the pump source. The pump pulses pass through a variable attenuator (comprising a half-wave plate and a Brewster polarizer) and an isolator (ISO) and are incident on a plane-parallel OPO cavity. Two configurations are tested: single-pass OPO (SP-OPO) and double-pass OPO (DP-OPO). In the first case, the cavity mirrors M3 and M4 are identical (CaF2 coated with high-reflection films at 1.65‒2.00 μm and anti-reflection films at 1.06 μm and 2.2‒3.0 μm) with a spacing of 28 mm. Two long-pass filters (CaF2 coated with high-reflection films at 1.06 μm and anti-reflection films at 1.65‒3.00 μm) are used to block the residual pump. In the second case, M4 is changed into a total reflection mirror M4' at 1.06 μm and 1.65‒3.00 μm. The backward idler beam is transmitted through M2 (CaF2) and a long-pass filter and is detected by a pyroelectric sensor. The KTP crystal has cut angles of θ=47.8° and φ=0°, and dimensions of 10 mm×8 mm×20 mm, and is mounted on a rotation stage.Results and DiscussionsThe output wavelength of the KTP-OPO at normal incidence is measured by a spectrometer. In Fig.3, the main peak at 2.43 μm is corresponding to the idler light, and the secondary peak at 1.89 μm is corresponding to the resonant signal light. The values at different KTP incidence angles, plotted as scatters in Fig.1, almost follow the calculated curves. By adjusting the half wavelength plate and changing the pump attenuation, the relationship between the OPO output and pump input is observed at 2.43 μm (Fig.4). The SP-OPO has an extremely high threshold of 209.3 mJ, which is approximately 3 times that (70.46 mJ) of the DP-OPO. The idler pulse energies of SP- and DP-OPO rise above 18 mJ under pump energies of 328 mJ and 148.3 mJ with slope efficiencies of 24.9% and 27.9%, respectively. The input and output pulse envelopes are captured with an InGaAs photodiode. Figure 5 shows that the idler pulse of DP-OPO arises earlier than that of SP-OPO. The tuning curves are measured under given pump energies. Here, the outputs of the two configurations are set to be approximately equal at normal incidence. The wavelength band extends from 2.05 μm to 2.97 μm (Fig.6) by rotating the PM angle of KTP from -6° to 4.6°. In the region below 2.2 μm, both the idler and signal lights are emitted from the OPO cavities because the transmittance of M3/M4 increases gradually from less than 1% at 2.0 μm to more than 98% at 2.2 μm. The signal energies are excluded by separating the two orthogonally polarized wavelengths with a Glan prism. The curve of DP-OPO is mostly higher than that of SP-OPO. Under a pump energy of 148.3 mJ, the output at 2.05‒2.57 μm exceeds 10 mJ (56.5% coverage), and that at 2.77 μm exceeds 5 mJ (78.3% coverage).ConclusionsWe present a tunable short-wave infrared source based on a Nd∶YAG laser pumping KTP-OPO. A wide tuning range from 2.05 μm to 2.97 μm is obtained under a small KTP crystal rotation angle. The highest output energy exceeds 18 mJ. The advantages of the pump-reflected double-pass OPO over the single-pass OPO are demonstrated, including the reduced threshold, enhanced efficiency, and decreased build-up time. The wavelength coverage with an output above 5 mJ is 78.3%. The continuous and wide tunability, as well as the high peak power, can find application in the fields such as multiple gas analysis and DP-OPO can be used as the pump source of semiconductor crystal based nonlinear long-wave generation.
Dec. 10, 2023Vol. 50 Issue 23 2308001 (2023)
Xuejie Gao, Jiqiao Liu, Chuncan Fan, Cheng Chen, Juxin Yang, Shiguang Li, Yuan Xie, Xiaopeng Zhu, and Weibiao Chen
ObjectiveSince the industrial revolution, anthropogenic activities have resulted in unprecedented carbon emissions that exceed the carbon sink capacity of terrestrial and marine ecosystems, with CO2 concentrations increasing by approximately 30% over the last few decades to 418 μL/L by 2022. To meet the needs to effectively implement carbon emission management, lidar detection based on the differential absorption principle has been proposed using the existing technology. With an average global cloud coverage of up to 60%, there are many cloud echo signals in addition to ground and ocean echo signals when laser penetrates the atmosphere to the ground, and effective use of cloud echo signals can improve data utilization and contribute to the analysis of carbon sources and sinks. For complex cloud echo signals, an outlier screening method based on the absolute deviation from the median is proposed to extract signals, which can separate multi-layer cloud echo signals and the signals in which the cloud and ground echo signals co-exist. In addition, this paper analyzes the detection capability of cloud signals, studies effective data processing methods for cloud echo signals to calculate the CO2 column concentration on the cloud, and compares the results with the data obtained with in-situ instrument.MethodsThis paper uses data from an airborne flight experiment conducted by the integrated path differential absorption (IPDA) lidar system in Qinhuangdao in March 2019. Firstly, the types of signals that may be received by the IPDA lidar are analyzed, and an outlier screening method based on the absolute deviation from the median is proposed to extract the echo signals. A correction method for the target altitudes is proposed, and the extraction results are compared with those extracted using the traditional minimum method. Secondly, the online and offline monitor signals and echo signals of the clouds are analyzed, and data suitable for CO2 column concentration inversion are selected. Then, the relative reflectance of the clouds is calculated using the offline monitor signals and echo signals. The relationship between the relative reflectance and cloud density is investigated by combining the cloud density distribution with the cloud images taken by the airborne camera. Finally, the CO2 column concentration on the clouds is obtained by using the differential optical thickness and the integral weighting function corrected for Doppler shift, and the results are compared with the trends of single-point CO2 concentrations measured by in-situ instruments. Meanwhile, the relationship between cloud altitude and CO2 column concentration on the clouds is also investigated.Results and DiscussionsAccording to the signal extraction results, the amount of valid cloud signal extracted using the outlier screening method based on the absolute deviation from the median is 1.9 times greater than that extracted using the minimum value method (Fig.10). The relative reflectance of the clouds is obtained by the offline monitor signals energy and the echo signals energy. Based on the experiment, the relative reflectance of the clouds over the mountainous area is 0.1897, that over the residential area is 0.1418, and that over the sea is 0.1656 (Fig.12). The number of signal points in the time-altitude grid area is counted to get the cloud density distribution, and combined with the photographs taken by the airborne camera (Figs.13 and 14), the cloud tops are found to be around 3400 m for thin clouds and 3800 m for thick clouds on the day of the experiment. We use differential optical depth and the integral weighting function corrected for Doppler shift to calculate the concentrations of CO2 on clouds (Fig.15). On the day of the experiment, the average CO2 column concentration over the cloud is 415.98 μL/L, the average CO2 column concentration over the residential area is 416.96 μL/L, and the average CO2 column concentration over the sea area is 413.92 μL/L, with an overall average value of 416.23 μL/L. The trend is consistent with those of the single-point CO2 concentrations measured by the in-situ instrument. The altitude variation of CO2 column concentrations over clouds (Fig.16) is calculated to show the distribution of CO2 column concentrations over clouds with altitude in different regions.ConclusionsIn this paper, cloud echo signals from an airborne IPDA lidar are investigated to obtain the CO2 column concentration. An outlier screening method based on the absolute deviation from the median to extract cloud echo signals is proposed, which can improve the effective utilization of the data measured by the airborne platforms. The stable cloud echo signals from the level flight phase of the airborne experiment are selected for analysis. The offline wavelength echo signals are used to calculate the relative reflectance of the clouds, and the different spatial distributions of the clouds and their reflectance variations in the experiment are analyzed. The CO2 column concentration data on the clouds are analyzed and compared with the data from the onboard in-situ carbon dioxide instrument equipped on the same aircraft. The CO2 concentration trends measured by the two methods are in good agreement, with an average deviation of 2.8 μL/L. The research conducted in this paper provides an important reference for processing the cloud echo signals of the spaceborne lidar to calculate the CO2 concentration.
Dec. 10, 2023Vol. 50 Issue 23 2310001 (2023)
Jiahui Kang, Haiyang Gao, Shujun Liao, Leilei Kou, Piman Ding, Zhen Wang, and Lingbing Bu
ObjectiveGlobal wind field measurement is the basis of weather forecasting and climate research since wind speed is one of the basic parameters to describe the atmospheric state. Spaceborne lidar is an effective means to obtain the global wind field due to the characteristics of high accuracy, high vertical resolution, global coverage, etc. At present, spaceborne wind lidar technology is in development in China, and it needs a lot of theoretical and experimental support. In many research directions of this technology, the simulation technology of detection mode and observation results is very important. Previous research has simulated different detection modes of spaceborne lidar, but those simulations mostly came from standard ideal scenes, and have not involved the analysis of complex real scenes. In this work, we carry out a practical simulation by employing a real scene from the WRF model in which both clouds and aerosol exist at the same time. The results from the analysis on detection ability can improve the practicability of the simulation method, and provide support for the design and improvement of spaceborne wind lidar.MethodsWe build a forward model including six sub-modules (Fig. 1): atmospheric scene, calculation of atmospheric radiation transfer, satellite orbital platform parameters, instrument parameters, inversion analysis and comparison verification, and parameter sensitivity analysis. The parameters such as wind speed, aerosol mass density, mixture ratio of hydrometeor, and molecular number density are obtained from the atmospheric scene. The optical properties of particles in clouds and aerosol depend on the Optical Properties of Aerosols and Clouds (OPAC) database. The atmospheric absorption calculation comes from the line-by-line integration model of LBLTRM. Then the overall attenuation backscattering coefficients at different altitudes can be calculated through atmospheric radiation transfer. Substituting the parameters of the satellite orbit platform and lidar instruments into the forward model, the photon signal received before the discriminator can be obtained. By coupling the Fizeau interferometer, accumulation charge coupled device (ACCD) detector, and other models, the output signal on the detector is simulated. To verify the simulation results, the retrieved wind speed from the simulation signal is compared with the original wind speed provided by the scene. In addition, parameter sensitivity analysis is also used to discuss the impact on the simulation detection results.Results and DiscussionsThe forward model in this paper can simulate complex real scenes, and the authenticity and practicability of the simulation have been greatly improved (Fig. 1). The results of wind speed profiles with regard to altitude show that clouds and aerosol can increase the signal-to-noise ratio (SNR) of the detection and improve the inversion accuracy. However, when the cloud layer is thick, due to the attenuation effect of the cloud layer on the signal, the SNR below the cloud layer will decrease, thus increasing the error of wind speed error (Fig. 6). The two-dimensional (2D) profiles of wind speed are then simulated with the horizontal resolutions of 1 km and 5 km, respectively. The results show that the wind speed error can be reduced by the decreasing horizontal resolution due to the increasing echo signal intensity through accumulating pulses. When the centroid method is used to retrieve the wind speed, the wind speed oscillation error can be reduced by increasing the number of channels of the ACCD detector (Fig. 10).ConclusionsBased on the spaceborne wind lidar detection mode of the Fizeau interferometer and using the Atmospheric Laser Doppler Instrument (ALADIN) instrument parameters as input, we simulate the detection signals in the presence of clouds and aerosol. By comparing the inversion results with the input original value, we discuss the main factors affecting the wind speed error and analyze the parameter sensitivity. The results show that the clouds and aerosol in the atmosphere can increase the attenuation backscattering coefficient, improve the SNR and reduce the wind speed error. When the maximum likelihood function method is used to retrieve the wind speed, the wind speed error ranges within ±1.2 m/s. However, when the cloud layer tends to be thicker, the lidar cannot penetrate the cloud layer due to the strong attenuation effect of the cloud layer on the pulse energy, so the information below the cloud layer cannot be detected effectively. For the same vertical resolution, the wind speed error with the horizontal resolution of 5 km is significantly better than that with the horizontal resolution of 1 km, which means that reducing the horizontal resolution and increasing the number of cumulative pulses can improve the wind speed detection accuracy. Through the sensitivity analysis of typical parameters, the lower satellite orbit altitude or the greater laser emission power can enhance the SNR and reduce the wind speed error. Furthermore, the increasing number of the ACCD detector channels can reduce the system oscillation error caused by the principle of the centroid method.
Dec. 10, 2023Vol. 50 Issue 23 2310002 (2023)
Zhijiang Zeng, Liyi Yang, Zhenyi Hao, Lin Xu, Guangyu Fan, Cui Fan, Jun Li, Xue Li, and Haimei Gong
ObjectiveFor some infrared (IR) optical systems, due to the wide field of view of the instrument, some cryogenic optical lenses must be packaged near the detector, otherwise the entire optical system will be very complicated. Moreover, for weak signal and multi-spectral detection, it is necessary to reduce the background. Except IR detectors, if several cold filters and lenses are housed in Dewar, then it is conducive to eliminating the infrared radiation background, improving system sensitivity and integration. This paper presents the package of mid-wave infrared (MWIR) and long-wave infrared (LWIR) detectors Dewar with integrated cryogenic optics. The micron-scale alignment requirement of a 32×4 array detector with a pitch of 120 μm×120 μm and a dual-lens module at each band is comprehensively described. The key parameters such as detectors temperature uniformity, differential temperature packaging and low thermal mass are analyzed. We hope that Dewar package structure integrating 4 lenses, 2 optical filters and 2 detectors will be successfully developed.MethodsFirst, several lenses and detectors are packaged, so the size of the Dewar cold platform is large, and the mass of the infrared detector Dewar cold finger and its top load reaches 364.7 g. If the acceleration in space application is 500 m/s2, the maximum stress at the root of the cold finger can be calculated to be 352.9 MPa. In order to ensure the reliability under environmental vibration, it is necessary to use a new titanium alloy TC4 as the cold finger material, which can not only ensure sufficient mechanical strength, but also effectively reduce Dewar thermal loss. Secondly, in order to solve the problems of large longitudinal and axial thermal resistance between the detector, the cold lenses and the cold filter, as well as the low temperature uniformity of the detector array, both low thermal resistance heat transfer and the structure to realize differential temperature of the detectors are required. The cold platform is designed as the shared base of alignment for MWIR and LWIR detectors and cryogenic optics lenses. The structures of the sapphire cold link of the LWIR and the titanium alloy heat insulation ring of the MWIR are shown in Fig. 4. Through the combination of cold platform, sapphire cold link and titanium alloy heat insulation ring, the cooling capacity from the tip of cooler is non-uniformly introduced to the detector and the cryogenic optics lenses and filters, and the single-point cooling capacity is effectively transferred to different temperature zones. Thirdly, considering the material matching and assembly thermal stress of the detector at low temperature, the material whose linear expansion coefficient at low temperature matches the detector, lens, and filter is selected as the supporting structure material for assembling the cryogenic optics modules. The thermal stress simulation analysis of the infrared detector and optics is carried out, and the analysis results are shown in Fig. 6. The maximum cold shrinkage stress of the detector LWIR HgCdTe material is 15.8 MPa when it works at a low temperature of 65 K. Such a stress is relatively low.Results and DiscussionsThe selection of titanium alloy cold fingers can not only ensure the mechanical reliability, but also reduce the heat conduction between the top of the cold fingers and the environment. Measured under liquid nitrogen environment, the thermal loss of titanium alloy cold fingers is about 160 mW smaller than that of stainless steel cold fingers. The brazing of the titanium alloy cold finger and the Kovar cold platform is realized by Ag-based solder. The weld structure after multiple temperature cycles from 300 K to 77 K is normal. The photo of the brazing sample is shown in Fig. 7. The average thermal loss value of the four Dewar assemblies tested at 77 K is 818.8 mW. In the orbit application, when the LWIR detector works at 65 K and the temperature window of Dewar is 195 K, the thermal loss is about 620 mW. In experiment, the LWIR detector works at 65 K, and its temperature uniformity is 0.08 K. Meanwhile, the temperature of the MWIR detector is about 73 K, and its temperature uniformity is 0.36 K. The temperatures of the long-wave lens 2 and lens 3 are stabilized at about 68 K and 70.5 K, and the temperatures of the mid-wave lens 2 and lens 3 are stabilized at about 80.5 K and 81 K, as shown in Fig. 10. According to the experimental data in Fig. 10, the longitudinal thermal resistance of the MWIR and LWIR detector-optics is relatively large. There is a bit difference about the temperature between the actual MWIR detector and the designed one, which should be related to too many heat transfer interfaces, the contact thermal resistance controlled by the screw torque during installation, and the shape of special heat-insulating titanium alloy TC4 rings. The adjustment of axial distance and pitch is adopted by partially adding different polyimide shims with the thickness of 5?20 μm between the detector substrate and the cold shield, combined with assembly and testing by several instruments. Finally, the maximum measured value of alignment between the detector and the cryogenic optics lenses is 7.8 μm, and the axial center deviation value between the detectors is 14.3 μm.ConclusionsThis paper presents the MWIR and LWIR detectors Dewar assembly with integrated cryogenic optics. The new structures in Dewar such as monolithic cold platform and lens support (cold shield) with low thermal mass are designed to realize the alignment of single detector and its related cryogenic optics lenses, to solve the high-precision alignment between two detector-lens modules, and to solve new brazing processes of single high-strength cold finger and so on. This paper also proposes the key parameters of the Dewar such as detectors temperature uniformity, differential temperature packaging and low thermal mass. The thermal mass of Dewar at liquid nitrogen temperature is less than 0.85 W. The LWIR detector allows for focal plane array (FPA) operation at the temperature of 65 K, with a temperature uniformity of 0.08 K. Meanwhile, the MWIR detector is balanced at the temperature of 73 K, with a temperature uniformity of 0.36 K. The misalignment between the detector and the lenses is less than ±10 μm, and the misalignment between two detector-lens modules is less than ±15 μm. The Dewar integrating cryogenic optics has been testified by relevant environment reliability, and has been successfully applied to Geostationary Interferometric Infrared Sounder of the Fengyun-4 meteorological satellite.
Dec. 10, 2023Vol. 50 Issue 23 2310003 (2023)
Ruifeng Liu, Meng Chen, Yingxin Wang, and Ziran Zhao
SignificanceFlexible photothermoelectric (PTE) detectors have considerable research significance owing to their unique characteristics, including flexibility and PTE properties.Flexible PTE detectors have the characteristics of lightness, flexibility, and softness, allowing them to be attached directly to irregular surfaces for continuous measurement of spatial information. They have considerable potential in the development and fabrication of miniaturized energy equipment, virtual-reality interactive systems, and implantable medical devices, which have application prospects in new energy, microelectronics, artificial intelligence, medical care, and other fields. They are also attractive for use in wearable devices, as they offer several advantages over traditional rigid sensors. These detectors can be easily bent or shaped to fit the contours of the human body, which allows comfortable and unobtrusive monitoring of physiological parameters.Furthermore, the PTE properties of these detectors allow them to have ultra-broadband responses. In contrast to other types of detectors, which are typically limited to a specific wavelength range, PTE detectors can detect light across a wide range of wavelengths, from ultraviolet to terahertz. This makes them highly versatile and useful for various applications, including spectroscopy, imaging, and sensing. Another advantage of PTE detectors is their high speed. The PTE response breaks the limit of the low response speed of traditional thermal detectors by introducing hot carrier-assisted heat conduction. This fast response makes PTE detectors well-suited for applications that require rapid detection, such as high-speed imaging and sensing. Additionally, they can operate under zero-bias and room-temperature conditions, which makes them convenient and cost-effective to use. In contrast, other types of broadband detectors, such as bolometers, typically require a bias voltage to operate and may require cooling to achieve optimal performance.Overall, the research into flexible PTE detectors has significant implications for the development and applications of novel electronic devices. In the past 20 years, the field has continued to advance, and there has been a large amount of research on new types of flexible PTE detectors. However, they face a series of challenges related to detection performance and manufacturing process improvement. Therefore, it is necessary to provide an overview of flexible PTE detectors to lay the foundation for the development of flexible optoelectronic technology.ProgressIn this review, we first describe the key parameters of flexible PTE detectors, including the responsivity, response time, cutoff frequency, noise equivalent power, and specific detectivity. Then, we summarize the research progress of flexible PTE detectors with detection wavelengths ranging from visible to terahertz and introduce the exploration, application, and optimization mechanism of carbon materials and inorganic and organic compounds with flexible properties in the field of PTE detection. Suzuki’s research group made significant contributions to the application of CNTs in flexible PTE detectors (Fig.4). They developed a variety of flexible CNT-based PTE detectors for different use scenarios (Fig.5) and applied them to detect terahertz light (Fig.7). In addition to CNTs, many other new materials, such as reduced graphene oxide (Fig.10), topological insulators (Fig.11), transition-metal halide (Fig.12), quasi-one-dimensional materials (Fig.13), MXenes (Fig.14), and PEDOT (Fig.15) have been studied and applied to flexible PTE detectors and have exhibited good performance. Combinations of conducting polymers and carbon materials for flexible PTE detectors have been widely studied in recent years. Studies on graphene/PANI, graphene/PEI (Fig.20), and PBI/MWCNTs (Fig.21) indicated that it is easier to prepare high-performance flexible PTE detectors by combining these materials than by using them alone. Finally, the problems faced and the ongoing research trends in this field are discussed, including methods for improving the detector performance, the evaluation criteria for flexibility, and the manufacturing and human compatibility problems in practical applications.Conclusions and ProspectsFlexible PTE detectors can revolutionize the field of photodetectors. We expect that they will become increasingly important—particularly in the development of wearable devices and other flexible electronics. We expect to see further advancements in these detectors, including improvements in sensitivity, response time, and reliability. To achieve these goals and promote the practical application of flexible PTE detectors, it is necessary to explore new materials, design the detector structure, and formulate unified evaluation standards.
Dec. 10, 2023Vol. 50 Issue 23 2300001 (2023)
Tong Yang, Xinyu Li, Zhengxin Wang, and Cheng Gong
ObjectiveTerahertz imaging technology has broad application prospects in several fields, such as biological detection, medical treatment, data communication, and non-destructive security. However, the long wavelength of terahertz wave, limited by diffraction limitations, only allows the resolution of traditional terahertz imaging technology to be of the wavelength order, which cannot accurately image material details such as biological cell tissues and chip internal circuits. Therefore, the development of terahertz super-resolution imaging technology is particularly important. However, the probes prepared based on traditional micro/nano processing technology present drawbacks such as complex processing and high transmission losses. Based on this, this study proposes a design method for a tapered opening near-field probe based on a hollow circular waveguide. This conical probe can surpass the cut-off wavelength limit to achieve sub-wavelength focusing. In addition, the designed probe is processed using 3D printing technology. Subsequently, a 0.1 THz near-field scanning imaging system is built based on a high-precision 3D scanning platform, and the imaging effect of the processed probe is experimentally tested. The experimental results show that the probe can achieve sub-wavelength super-resolution focusing and has high power transmittance, which verifies the feasibility of 3D-printed terahertz near-field probes.MethodsFirst, the structure and size parameters of the tapered probe with a gradient opening are designed. The probe structure is simulated and optimized using CST Studio2019 software. The power density distribution map is examined (Fig. 2). To accurately study the focusing effect of the tapered probe with gradient opening on terahertz waves, we numerically characterize the focused terahertz spot: plotting a linear power density distribution curve in the x-direction at the exit port of the probe tip, and considering the x-width at 2/2 of the peak value as the focusing width of the terahertz spot (Fig. 3). After optimizing the optimal structural parameters of the probe through simulation, a digital 3D model diagram of the probe is exported. After slicing it in the software, the slicing file is input to a 3D printer for printing. After printing, the surface of the printed product is coated with metal. After the sample production is completed, we build a two-dimensional near-field scanning imaging system to experimentally verify the imaging ability of the prepared probe sample (Fig. 6) and evaluate its imaging resolution.Results and DiscussionsThe simulation results of the probe reveal that the designed probe structure bypasses the influence of the cut-off wavelength. The incident terahertz frequency is 0.1 THz, and terahertz focusing can be achieved when the probe tip radius is 0.2 mm. The x-direction focusing width is 0.779 mm, and the y-direction focusing width is 0.4 mm, according to the physical aperture size. In theory, the conical probe structure can achieve a close resolution of 1/4 wavelength, which is super-resolution imaging. Simultaneously, we simulate the focusing spot size of probes with the same size at 0.1 THz and 0.2 THz (Fig. 6). The linear power density of the focusing spot at 0.2 THz is roughly 6 times that of the focusing spot at 0.1 THz; the diameter of the focusing spot at 0.1 THz is approximately 0.779 mm; and the one at 0.2 THz is approximately 0.706 mm, with a difference of approximately 0.073 mm. The higher the frequency, the smaller the diameter of the focusing spot, and the higher the resolution. To demonstrate that this probe structure can achieve higher precision terahertz focusing, a proportional reduction is made on the basis of the original design model, and the cone tip aperture of the probe is set to 1 μm. This can also form a focused spot at the exit port of the probe. To ensure the printing quality of the near-field probe, we expand the tip radius of the probe to 0.4 mm, and the focusing width of the terahertz spot in the x direction is 1.186 mm, with an power transmittance of 3.16%. In experiments, the imaging resolution of the probe with a tip radius of 0.4 mm is 1.5 mm, and the imaging resolution reaches 1/2 wavelength. The experimental results are consistent with the simulation results.ConclusionsThis study proposes a design method for a tapered opening near-field probe based on a hollow circular waveguide. Through simulation analysis, this probe inherits the advantages of a high signal-to-noise ratio, a wide band, and no cut-off frequency of gap probes and can achieve sub-wavelength super-resolution focusing. Theoretically, it can achieve micron-level high-resolution imaging. To verify the feasibility of this method, we prepare a terahertz near-field probe structure with a tip radius of 0.4 mm based on 3D printing technology and built a terahertz near-field scanning imaging system for experiments. The experimental results demonstrate that the probe can achieve sub-wavelength super-resolution focusing, achieving an imaging resolution of 1.5 mm at 0.1 THz, reaching 1/2 wavelength, and achieving terahertz super-resolution imaging. The experimental results are consistent with the simulation results, proving the feasibility of a tapered near-field probe based on a hollow circular waveguide.
Dec. 10, 2023Vol. 50 Issue 23 2314001 (2023)
Wei Sun, Ruijin Hong, Chunxian Tao, and Dawei Zhang
ObjectiveCurrently, there are various technologies for controlling the electric field using the micro-nano structure of noble metal films, including electron beam lithography (EBL) and focused ion beam (FIB) etching. Most of these processing methods are complicated, with limited processing areas and high costs. These limitations significantly restrict the development of photoelectric functional films with electric field enhancement characteristics. According to current theories, the enhancement mechanism of surface-enhanced Raman scattering (SERS) technology can be divided into electromagnetic enhancement mechanism (EM) and chemical enhancement mechanism (CM). Compared to CM, EM generally exhibits stronger increases in the Raman scattering signals. Therefore, it is important to develop EM-based SERS substrates. The enhancement of the electromagnetic field mainly originates from the local surface plasmon resonance (LSPR) of the metal nanoparticles, which is independent of the adsorbed molecules and is an inherent property of metal nanoparticles. Therefore, classical electronic dynamics methods such as the finite difference time domain (FDTD) method can be used to describe the electromagnetic field. The purpose of this study is to develop a large-area, low-cost, and reproducible SERS substrate using FDTD simulations combined with mechanical grating ruling and electron beam evaporation deposition.MethodsIn this study, Silver (Ag) films with different blazed grating structures are simulated using FDTD method. The LSPR of the Ag films with blazed grating structures is significantly enhanced by adjusting the period. Under excitation at 633 nm, we find that Ag films with a grating period of 1/1200 mm generate a significant LSPR effect. Large-area electric-field-enhanced Ag grating films that can be produced in batches are realized using a mechanical grating ruling process and electron beam evaporation deposition. We successfully apply this electric field-enhanced Ag film to SERS to detect methylene blue dye. The Ag grating films significantly enhance the SERS intensity, and the test results show good uniformity and reproducibility of the substrate, consistent with the FDTD simulation results.Results and DiscussionsAs shown in Fig. 1, FDTD software is used to design and simulate two types of blazed grating film structures, and the electric field intensity and absorption spectra of the Ag films are compared. The results of the FDTD simulation (Fig. 2) show that compared to the Ag film with a grating structure, the pure Ag film exhibits lower electric field intensity and light absorption. Compared with other two types of structures, the Ag films on Grating 1 exhibit the strongest electric field intensity and absorbance in the local area, indicating that the Ag films with a grating structure exhibit a stronger LSPR effect at 633 nm. Blazed Grating 1 and Grating 2 structures are prepared using a mechanical scribing process and the required diffraction gratings are produced in batches through grating replication. Finally, the processed gratings are coated with Ag films through electron beam evaporation deposition to obtain Ag grating films with the required electric field enhancement effect. The prepared Ag films with grating structures are characterized using X-ray diffraction (XRD) (Fig. 4), atomic force microscopy, and optical microscopy (Fig. 5). The microscopic images and XRD results illustrate that the large-area Ag films with a grating structure are successfully prepared. The surface uniformity of the prepared gratings is good with equal spacing between the lines. A Raman spectrometer is used to verify the electric-field enhancement ability of films on Grating 1. As shown in Fig. 6(a), the Ag thin films with a grating structure produce more 'hot spots,' which significantly enhances the local electromagnetic field on the surfaces of the grating samples, thus substantially improving the Raman scattering signal of methylene blue. Figures. 6(b)‒(d) show that the corresponding relative standard deviation (RSD) values of the characteristic peaks at 1623 cm-1 and 1394 cm-1 for methylene blue in different sites of the Grating 1 sample are less than 17%, confirming the good reproducibility of the SERS substrate.ConclusionsIn this study, a simple and low-cost technology for fabricating large-area patterned electric-field-enhanced Ag films is proposed. First, Ag films with a blazed grating structure is simulated using the FDTD method, and a film structure with strong electric field enhancement at 633 nm wavelength is obtained by adjusting the period, which effectively tunes the LSPR effect on the film surface. Ag thin films with corresponding structures are prepared using mechanical grating ruling and electron-beam evaporation deposition. Through verification by a Raman spectrometer, the Ag films with a blazed grating structure improve the SERS intensity, consistent with the simulation results. This electric-field-enhanced film provides an efficient substrate for the enhancement of Raman scattering signals and an idea for the actual detection of trace molecules.
Dec. 10, 2023Vol. 50 Issue 23 2303101 (2023)
© Copyright 2018-2021 | Chinese Laser Press.
All Rights Reserved 沪ICP备15018463号-20