


Please enter the answer below before you can view the full text.

Zhihua Feng, Shuo Yuan, Yishu Chen, Haipeng Liu, Qunyu Bi, Fuling Zhang, and Jijun Feng
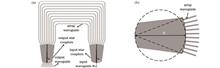
ObjectiveWith the rapid development of large traffic network, the demand for data exchange rates is increasing daily. Wavelength-division multiplexing (WDM) has garnered considerable attention in optical communication networks owing to its high communication speed, transparent signal transmission, efficient expansion of transmission capacity, and low cost. Dense wavelength division multiplexing (DWDM) is a crucial component of the optical communication field because it increases the capacity of communication systems and satisfies the public demand for greater communication bandwidth. Arrayed waveguide gratings (AWG) have low crosstalk, low insertion loss, high uniformity, high reliability, and a compact structure. Therefore, they have become the most commonly employed technical solution for DWDM. AWGs have been demonstrated in low-refractive-index-contrast materials, such as InP, silica, and polymers. The refractive-index contrast of the core and cladding of these materials is low; therefore, the device size and bending loss are large, which is unfavorable for the development of highly integrated DWDM systems. Owing to the high refractive-index contrast, a silicon waveguide arrayed waveguide grating can be made extremely compact, allowing for low-cost and high-volume manufacturing owing to its complementary metal-oxide semiconductor (CMOS)-compatible processing. Many arrayed waveguide gratings using silicon waveguides have been proposed. However, they still need to be further reduced in size to increase integration, and the uniformity of each output channel needs to be improved.MethodsA compact, highly uniform silicon-arrayed waveguide grating is studied. First, the arrayed waveguide grating is theoretically analyzed to understand its design scheme and performance parameters. Subsequently, the waveguide bending loss and effective index versus the silicon waveguide bending radius are simulated (Fig. 3). With a gradual decrease in the bending radius, the bending loss and effective index first decrease and then stabilize. When the bending radius is between 2.5 μm and 5.0 μm, the bending loss exceeds 1.29 dB, and the effective index of the silicon waveguide is greatly affected by the bending radius. When the bending radius exceeds 15 μm, the bending loss is less than 0.028 dB. The silicon waveguide's bending loss is negligible, and the effective index of the waveguide is stable at 2.449. According to the comprehensive consideration of device performance, the bending radius is 15 μm. Finally, according to the basic principles of arrayed waveguide gratings and the related parameters of silicon waveguides, the main structural parameters of the compact and highly uniform silicon waveguide arrayed waveguide gratings are determined (Table 1). Subsequently, a compact silicon-arrayed waveguide grating is fabricated on a silicon on insulator (SOI) platform. Finally, a test system is built to obtain the spectral characteristics of the silicon-arrayed waveguide grating chip, and each parameter is presented.Results and DiscussionsIn this study, a silicon-arrayed waveguide grating chip is prepared and tested. The chip realizes 8-channel 200-GHz WDM, and its structure size is only 294 μm×190 μm. The performance of each parameter is calculated according to the relevant definitions. The minimum insertion loss value is 19.6 dB, crosstalk is -15 dB, nonuniformity of the channel is 0.87 dB, and 3 dB bandwidth is 1.06 nm. The insertion loss during the testing process mainly originates from the coupling loss of the test system and the on-chip loss of the arrayed waveguide grating. The coupling loss is approximately 10 dB, and the on-chip loss of the arrayed waveguide grating is 9.6 dB. The device adopts silicon-on-insulator technology compatible with the CMOS process; therefore, its mass and low-cost production can be realized. In addition, the device has a compact structure and high uniformity.ConclusionsBased on a silicon-on-insulator material platform, a compact highly uniform silicon waveguide-arrayed grating with eight output channels and a channel spacing of 200 GHz is designed and fabricated. The effects of the bending radius of the silicon waveguide on the bending loss and effective refractive index of the silicon-on-insulator platform are analyzed. The test results show that the insertion loss of the device is 19.6 dB, the crosstalk is -15 dB, the nonuniformity is 0.87 dB, the 3 dB bandwidth is 1.06 nm, and the structure size is only 294 μm×190 μm. The chip can be produced using a CMOS process, which enables the production of arrayed waveguide gratings in large quantities at low cost. This is crucial for the development of integrated WDM networks.
Nov. 25, 2023Vol. 50 Issue 22 2219001 (2023)
Xiaowei Chen, Wenyue Zhu, Xianmei Qian, Pengfei Wu, Chun Qing, Gang Sun, Heli Wei, Ningquan Weng, and Xun Cui
ObjectiveLaser beams propagating in the atmosphere suffer from adverse effects due to the atmospheric optical characteristics and laser system features, which broaden the beam radius and weaken the encircled mean intensity. The wave-optics-based four-dimensional codes work with redundant inputs and slow speed, failing to meet the requirements of rapid assessment for practical applications. Researchers have made efforts to develop new methods, holding reasonable accuracy, calculating quickly and easily, without consideration of the mesh size and computational stability as wave optics programs. Integrated with characteristic parameters of laser system and atmosphere, the scale law has received much attention and is widely used in system design and applications with lots of computation.Current laser beam propagation scale law is based on radius-square-sum (RSS) assumption, meaning that the resulting far-field radius is the root of the sum of radii squared of the individual effect contributions. The RSS assumption lacks scientific foundation and may bring some errors in use. Besides, though the accuracy of scale law is crucial for reliable analysis, few reports on the accuracy of scale models have been released. Furthermore, previous attention was focused mainly on flat-top source, thus the effect of new features of Gaussian source, such as truncating extent, on far-field spot has not been well studied.MethodsTheoretical analysis and numerical simulations are used to build the scale model. Analytical expression of 63.2% encircled power radius in the far-field of infinite Gaussian source is deduced on the basis of Huygens-Fresnel principle, showing that the radius is a function of wavelength, distance and aperture. When the Gaussian source is truncated, split-step wave optics simulations are used to obtain the far-field radii corresponding to 63.2% and 86.5% encircled power. Referring to the analytical expression of infinite Gaussian source, a radius scale function for truncated Gaussian source is built, and the scale exponents are given for different truncating factors. On the basis of established turbulent spread radius expression of infinite Gaussian beam, a radius scale model is given for truncated Gaussian source propagating through turbulence, showing that the scale exponent varies with the value of truncating factor.When the mutual interaction among diffraction, beam quality, jitter of platform and optical turbulence is considered, the generally used RSS assumption is improved to a modified version which is named MRSS method. This new method introduces three scale exponents and an exponent term which consists of the ratio of two different characteristic radii in order to promote the model's applicability. For Gaussian source with truncating factor of 22 propagating in vacuum, the split-step wave optics simulations are operated in a wide range of parameter space shown in Table 2, with Fresnel number changing from 1.0 to 6003.4. The far-field radius scale models based on RSS assumption and MRSS method are built respectively, and the exponents are fixed with the help of genetic algorithm. Comparison with numerical simulations shows that the mean relative errors of the results from the model based on MRSS method are smaller than those based on RSS assumption.A similar process is conducted to build the scale model of far-field radius and encircled mean intensity for the Gaussian source with truncating factor of 22 propagating in turbulent atmosphere. The numerical simulations are conducted with the Hufnagel-Valley optical turbulence profile, and with the propagating distance and other parameters varying in a wide range shown in Table 3. Comparison with numerical simulations shows that the accuracy of the model based on MRSS method is higher than that based on RSS assumption.Results and DiscussionsWhen the Gaussian source is truncated, the far-field radius of free diffraction in vacuum and turbulent spread in atmosphere is affected by the truncating factor, as the scale exponents vary with Fa, as shown in Fig. 1 and Fig. 2(b), respectively. For the scale models based on RSS assumption, aVR gives a mean relative error of 3.12%, as shown in Fig. 4(c), while aLR gives a mean relative error of 4.15%, as shown in Fig. 6(c). For the scale models based on MRSS method, aV gives a mean relative error of 1.55%, as shown in Fig. 4(c), while aL gives a mean relative error of 1.92%, as shown in Fig. 7(c). The mean relative error of mean intensity is 8.33% based on RSS assumption, and 3.80% based on MRSS method. In summary, the accuracy of the models based on MRSS method is higher than those based on RSS assumption.The expression of aL based on MRSS method is equivalent to ad for ideal Gaussian beam propagating in vacuum, and to aV when the interaction among diffraction, beam quality and jitter of platform is considered. When only turbulence spread is considered, the optical quality of aL works well with the optical quality of turbulence spread radius, as shown in Fig. 8.ConclusionsThe scale models of far-field radius and encircled mean intensity for truncated Gaussian source are built in vacuum and turbulent atmosphere. Comparison with split-step wave optics simulations shows that the proposed MRSS method is able to improve the accuracy and applicability of scale models. The results are discussed for Gaussian source with truncating factor of 22 and far-field radius of 63.2% encircled power ratio. However, scale exponents and accuracy for other conditions need more research.
Nov. 25, 2023Vol. 50 Issue 22 2205001 (2023)
Qianqian Du, Hongyan Wei, Chenyin Shi, Xiaolei Xue, and Peng Jia
ObjectiveAtmospheric turbulence (AT) severely affects the transmission of vortex beams (VBs) transmitted in the atmosphere. Wavefront distortion, coherence destruction, and orthogonality destruction of multiplexed VBs are the main effects of AT, which directly increase crosstalk among channels and reduce communication performance. To improve the robustness of optical orbital angular momentum (OAM) communications, considerable efforts have been made to effectively compensate for the phase distortion of VBs. The adaptive optical method is widely used but requires multiple iterations and complicated hardware that is not affordable or easily operated by most researchers, causing tremendous difficulties for further study. Recently, taking advantage of powerful signal processing techniques, deep learning has been widely used in many fields such as image classification and optical communication, providing researchers with a new approach for addressing these problems. In this study, we propose a novel method of AT compensation based on a deep learning method to effectively correct the distorted composite Bessel-Gaussian (BG) vortex beam and improve the robustness of OAM multiplexing communication.MethodsUsing a deep learning method, we designed a new model called the phase extraction network (PhaNet), which combines a residual network with a feature pyramid for AT phase extraction (Fig. 2). The PhaNet model can automatically learn the mapping relationship between the intensity distribution of the distorted beam and the turbulence phase under different orbital angular momenta. It contains seven convolutional layers, four residual layers, six deconvolution layers, and three feature fusion layers. A total of 96000 images of BG vortex beam intensity with a specified turbulence range were randomly generated, 80000 of which were used as training data, with the remaining 16000 serving as test data. Following training with the loads of the studied samples, the PhaNet model was used to directly predict AT phase screens based on the intensity distribution of the distorted composite BG vortex beam. The turbulence phase can be compensated by loading a reverse-predicted phase into the received composite BG vortex beam. We then used the AT compensation system as a physical model (Fig. 5) to study the AT effect compensation of a composite BG vortex beam by mode purity and intensity correlation coefficient under different conditions of turbulence intensities and distances.Results and DiscussionsTo predict the entire turbulence phase, we successfully constructed the PhaNet model, which requires the intensity distribution of the distorted beam as input. Comparison results (Fig. 3) show that in the 21-layer structure, the mean loss significantly decreases, whereas the iterations show an inverse trend. When the number of iterations is 4000, the training loss reaches a plateau at 0.00957521. Therefore, to ensure the effectiveness of the predicted results in the PhaNet model, we chose 80000 training data and 4000 iterations as the training conditions. If better prediction performance is required, the amount of training data or number of iterations must be further increased. However, increasing the number of input samples increases the computational cost and lengthens the prediction time. To verify the generalization ability of the PhaNet model, we used the previously trained model to perform turbulence compensation for the composite BG beam propagating under different conditions by changing the parameters of turbulence (Fig. 6) and distances (Fig. 7), and we then analyzed the mode purity and intensity correlation coefficient. Under the conditions in which the topological charges l1=4 and l2=10 propagate from strong to weak turbulence and the composite BG beam has a 1000 m transmitting distance, the mode purity of l1=4 increases by approximately tenfold, from 3.41%, 3.54%, and 4.61% to 30.70%, 31.21%, and 31.35%, respectively, after compensation. Simultaneously, the mode purity of l2=10 shows a similar trend, increasing remarkably from 6.09%, 6.23%, and 6.30% to 64.68%, 65.45%, and 66.53%, respectively, after compensation. In addition, the beam intensity correlation coefficient of l2=10 combined with different topological charges l1 increases from 0.4199, 0.4596, and 0.5281 to 0.97 and greater. The mode purity of the composite BG beam (l1=4 and l2=10) at a propagation distance of 1500 m in strong turbulence are 3.50% and 2.43% respectively, which can be improved to 30.55% and 64.07%, respectively, after compensation. The beam intensity correlation coefficient of l2=10 combined with different topological charges l1 increases from 0.6477 and 0.3495 to 0.9794 and 0.9268, respectively.ConclusionsWe propose an AT compensation scheme for a composite BG vortex beam based on a phase extraction network. The compensation effect of the phase extraction network on a distorted composite BG vortex beam under different turbulence intensities and propagation distances is numerically analyzed. The results show that after phase compensation, when the composite BG vortex beam propagates 1000 m under different turbulence intensities, the intensity correlation coefficient can be increased to greater than 0.97, whereas the intensity correlation coefficient is improved to 0.9268 when the transmission distance increases to 1500 m under strong turbulence. These results show that the PhaNet model possesses a good generalization ability for quickly and accurately predicting the equivalent turbulent phase screen, even in unknown turbulence environments, and thus has great potential for improving the performance of OAM communication.
Nov. 25, 2023Vol. 50 Issue 22 2206002 (2023)
Liping Tang, Yao Wang, Genbai Chu, Fengxiao Li, Liang Wang, Rifeng Zhou, and Bi He
ObjectiveSingle-shot X-ray radiograph technology via ultrafast laser can be used to image the internal structure of ultra-high velocity objects with high spatial and temporal resolution, providing a new technical means to observe the internal structure, planarity and other morphological parameters of flyers. However, the wide energy spectrum of high-energy X-rays produced by laser bombardment of the target is accompanied by strong disturbances such as high-energy electrons and scattered rays, which causes great interference to X-ray imaging signal-to-noise ratio and image quality. Besides, the laser pulse width is extremely narrow (picosecond or femtosecond levels) and the data acquisition time of the radiation detector is extremely short, resulting in a low photon count, high quantum statistical noise, and low image signal-to-noise ratio. In addition, the plasma around the flyer makes it more difficult to observe the structure of the flyer, and the image quality is difficult to satisfy the application requirements of accurate observation. Finally, general image enhancement algorithms introduce unnecessary artifacts. In order to better observe and analyze the morphological structure of flyers, a special image enhancement algorithm is needed to improve the image quality.MethodsAiming at the problems of single-shot X-ray radiograph via ultrafast laser with high background noise interference, low contrast, and difficulties in morphology identification and measurement, an improved histogram equalization image enhancement algorithm based on multi-scale fusion (IHEMF) is proposed in this paper. The conventional CLAHE algorithm uses a fixed clipping threshold, which leads to excessive enhancement of the background region. The IHEMF algorithm modifies the fixed clipping threshold of the CLAHE algorithm to a gradient-dependent parameter. By calculating the horizontal gradient and vertical gradient of each block sub-region in the original image and bringing them into the constructed Gaussian function, adaptive clipping thresholds that can better fit different regional features are obtained. At the same time, in order to avoid the halo phenomenon in the light-dark boundary region, the brightness weight and gradient weight of the original image and the enhanced image by the improved CLAHE algorithm are first calculated, and then the fused images are obtained by pyramid decomposition and reconstruction. When the contrast and shape of the flyer are enhanced, the noise is also amplified. To reduce the effects of plasma and quantum noise in the fused image, block matching 3D (BM3D) denoising algorithm is employed. A three-channel flyer image is obtained by adding pseudo-color to the denoised image in order to obtain better visual effects. In order to verify the effectiveness of the IHEMF algorithm, the enhancement experiments of the static, dynamic and final state images are carried out and the results are compared with those of the commonly used algorithms such as HE, CLAHE, MSR, cl-BHE, ROPE and FCCE.Results and DiscussionsWe tested the performance of the IHEMF algorithm using static, dynamic and final state images [Figs. 4(a), 5(a) and 6(a)]. The results for three typical images show that the morphology processed by IHEMF algorithm [e.g., Fig. 4(h)] is clearly visible, while other algorithms such as HE, CLAHE, MSR, cl-BHE, ROPE and FCCE [e.g., Figs. 4(b)?4(g)] have little enhancement effect (the material inside the metal cavity cannot be seen). In addition, the images processed by other algorithms have disadvantages such as excessive enhancement in the background area, halo phenomenon at the image edges and strong plasma interference, which are not suitable for observation. IHEMF algorithm reduces the influence of plasma and halos, and the shape of the flyer in the processed image [Figs. 4(h), 5(h) and 6(h)] is clearly visible. The contrast noise ratio (CNR) indicates the ability to distinguish the region of interest (ROI) from the background region, which is used to evaluate the image enhancement effect of the algorithm. The CNR of the images processed by the IHEMF algorithm is significantly improved over the CNR of the original images and the increasing rate is much higher than those of the other algorithms (Table 1), such as HE, CLAHE, MSR, cl-BHE, ROPE and FCCE. Experimental results for three typical images show that the IHEMF algorithm improves the contrast of the ROI and has better enhancement performance compared with other classical image enhancement algorithms.ConclusionsIn this paper, we describe an improved histogram equalization image enhancement algorithm combined with multi-scale fusion. The algorithm combines the enhancement characteristics of the improved CLAHE algorithm and the structural retention characteristics of the pyramid fusion algorithm, and the BM3D algorithm is used in order to reduce plasma effects. The research shows that the proposed method can effectively suppress image artifacts and noise (halos and plasma), enhance the contrast of X-ray images, and significantly improve the visual effect. Compared with the original image, the CNR of the image processed by the IHEMF algorithm is significantly improved, and the increasing rate is much higher than those of the other algorithms. The IHEMF algorithm greatly improves the contrast and image quality of the ROI and lays the foundation for accurately obtaining characterization parameters such as internal structure and planarity of the flyer from single-shot X-ray radiograph via ultrafast laser.
Nov. 25, 2023Vol. 50 Issue 22 2209001 (2023)
Fei Xu, Qikun Pan, Yueru Zhang, Yi Chen, Deyang Yu, Kuo Zhang, Ranran Zhang, Junjie Sun, and Fei Chen
ObjectiveMid-infrared (4?5 μm) radiation lies in the atmospheric transmission window and has broad application prospects in fields such as atmospheric remote sensing, environmental monitoring, and space communications. Compared with chemical lasers, nonlinear frequency conversion lasers, and other means of obtaining mid-infrared lasers, solid Fe: ZnSe lasers have the advantages of compact volume and high energy, offering a new way to achieve high-energy mid-infrared laser output. This study presents a high energy mid-infrared solid Fe∶ZnSe laser. We use the Er∶YAG laser as the pump laser and design an Fe∶ZnSe laser system whose crystal temperature can be controlled. The work performance of the Fe∶ZnSe laser is studied at different temperatures. In addition, Fe∶ZnSe laser spectra are obtained at different temperatures.MethodsThe Fe2+∶ZnSe crystal is sensitive to temperature, which causes a temperature quenching effect at higher temperatures and affects the laser efficiency. When the temperature is above 100 K, the lifetime of the laser upper level decreases rapidly with an increase in temperature, from 60 μs at 77 K to 360 ns at 294 K. To improve the lifetime of the laser upper-level, we use a liquid nitrogen Dewar temperature controller. The Fe∶ZnSe crystals are placed in a low-temperature vacuum chamber. A 2.94-μm Er∶YAG laser with axial pumping is incident on the crystal surface. The maximum output energy of the Er∶YAG laser is 3 J, and its pulse width is 50?300 μs, which comprises multiple spike pulses with a duration of several hundred nanoseconds. The resonant cavity is formed by a flat input mirror M1 and flat output coupler M2 with a cavity length of 50 mm. The input mirror M1 exhibits >98% transmittance for the pump laser and >99.5% reflectivity for the Fe2+∶ZnSe laser, whereas the output coupler M2 exhibits >99.9% reflectivity for the pump laser and 70% reflectivity for the Fe∶ZnSe laser. The energy density of the pump light incident on the cavity can be adjusted by changing the optical interval of the telescope. An iris is used to adjust the size of the pump spot incident on the Fe∶ZnSe crystal; in addition, it is used to suppress transverse parasitic oscillations. Previous research has shown that smaller pump spots can suppress transverse parasitic oscillations and improve laser efficiency. In this study, three Fe∶ZnSe crystals are grown via the vertical Bridgman method and simultaneously doped during growth with a higher doping uniformity. The crystal size of crystal #1 is 20 mm×20 mm×4 mm, with a doping concentration of 5×1018 cm-3. Crystals #2 and #3 have the same size, and their doping concentrations are 0.9×1018 cm-3 and 4.5×1018 cm-3, respectively.Results and DiscussionsAt 79 K, the maximum output energy of the Fe∶ZnSe laser is 1.04 J with the slope efficiency of 36.4% and optical-to-optical conversion efficiency of 37.8% at a pump energy of 2.75 J [Figs. 2(a) and(b)]. Figure 2(a) shows the output energy and slope efficiency of different Fe∶ZnSe crystals. Because of the difference in the doping concentration and gain length, the absorption and slope efficiencies of the crystals are different. The total absorptivities of crystals #1 and #3 are similar; therefore, the slope efficiency of the Fe∶ZnSe laser is also similar. Owing to the low doping concentration of crystal #2, the total absorption of the pump light is only 69%; therefore, the laser slope efficiency is lower than those of the other two crystals. The temporal profiles of the Fe∶ZnSe laser are shown in Figs. 2(c)?(f) and Figs. 3(a) and (b); it can be observed that the Fe∶ZnSe laser waveform remains strongly correlated with the pump laser waveform, and the width of a single spike pulse shortens with the increase in temperature. The output spectrum of the Fe∶ZnSe laser is shown in Fig. 3(d). The output spectrum redshifts with increasing temperature, and the tunable range widens.ConclusionsIn this study, a low-temperature Fe∶ZnSe laser is fabricated using an Er∶YAG laser as the pump energy source. The Fe∶ZnSe laser has the potential to produce large amounts of energy in the mid-infrared region. At 79 K, the output energy of the Fe∶ZnSe laser is 1.04 J with a slope efficiency of 36.4% and an optical-to-optical conversion efficiency of 37.8% at a pump energy of 2.75 J; the wavelength of the Fe∶ZnSe laser is 4.1 μm. At the thermoelectric cooling temperature of 240 K, the energy of the Fe∶ZnSe laser is 50 mJ with a wavelength of 4.4 μm and pump energy of 500 mJ. The Fe∶ZnSe laser introduced in this study has many potential applications in mid-infrared fields, such as environmental monitoring and laser communication, which provides a basis for further miniaturization and fabrication of wavelength-tunable Fe∶ZnSe lasers.
Nov. 25, 2023Vol. 50 Issue 22 2201001 (2023)
Zirun Liu, Xingjin Chen, and Nan Wang
ObjectiveIn order to obtain a good light-matter interaction effect, it is usually required laser has the characteristics of high power and short pulse duration to obtain a strong peak power and improved time resolution. The ultrawide gain bandwidth and high thermal conductivity of the Ti∶sapphire crystal make it a good gain medium. However, because of the power limitations of the pump source, the thermal lens effect, and the mode-locked pulse stability, it is difficult to increase the average output power of the Ti∶sapphire femtosecond laser. Therefore, Ti∶Sapphire femtosecond lasers with high average power, short pulse width, and high repetition rate have always been a research hotspot in ultrafast lasers and their applications.MethodsThe experimental setup is shown in Fig. 1. A continuous-wave green laser with a maximum output power of 16 W at 532 nm is used as a laser pump. The 150 mm plano-convex lens is used to concentrate the pump light onto the Ti∶sapphire crystal. The crystal is mounted on a water-cooled copper crystal frame and wrapped in an indium foil. The water temperature is regulated at 14 ℃±0.1 ℃ using a water cooler with a cooling capacity of 600 W. Concave mirrors C1 and C2 have a curvature radius of 150 mm, a folding angle of 24°, and exhibit strong reflection in the spectral region of 750?850 nm. Flat mirrors M1?M4 exhibit strong spectral reflections in the 750?850 nm range. The output coupling mirrors (OC) have a transparency of 20%. P1 and P2 are a pair of prisms used to compensate for intracavity dispersion, and their separation is fixed at 340 mm. The total length of the resonator is 2.02 m. Unlike commercial laser oscillators in which a slit is placed at the end mirror to suppress high-order transverse modes, we position an adjustable slit in the optical path between the prism pair, which suppresses the high-order transverse mode in the cavity and selectively suppresses the continuous wave (CW) component at a specific spectrum when the high-power laser in the cavity is running. A lens with an extended focal length and a concave mirror with an extended radius of curvature are used to focus the pump light, and the beam waist radius of the spot (23 μm) matches the intracavity laser waist spot radius (26 μm). The laser beam waist is enlarged to prevent damage to the crystal owing to high laser power density, and the laser mode volume is increased to increase the output power. Because of the long gain crystal, the calculated spacing needs to be at least 1700 mm if a pair of fused silica prisms with a low refractive index is selected to compensate for second-order dispersion. Therefore, the prism with a high refractive index is selected, which can provide sufficient negative dispersion within a short distance and reduce the space occupied by the resonant cavity.Results and DiscussionsThe resonator parameters are described using an ABCD matrix [Figs. 2(a)?(c)]. The mode-locking starting area and the astigmatism compensation angle are determined, and the distribution of the beam waist in the resonator is calculated to guide the experiment. The ray-tracing method is used to compute the dispersion generated by the prism pair [Fig. 2(d)], providing a basis for dispersion compensation in the cavity. With an increase in pump power, a slope efficiency of 37% is obtained without the pump saturation effect. Self-phase modulation decreases the pulse width with increasing power. At a pump power of 16 W, a femtosecond pulse output with an average power of 4.1 W is obtained [Fig. 3]. A spectrum with a central wavelength of 795 nm and full width at half-maximum of 17 nm is measured [Fig. 4(a)], and an intensity autocorrelation curve with a pulse duration of 48 fs is obtained [Fig. 4(b)]. Additionally, adjusting the slit width reduces the CW component [Fig. 5]. In the laboratory environment, we record the pulse train using an oscilloscope, and neither Q-switched mode-locking nor multipulse are observed [Fig. (6)]. The root-mean-square (RMS) value of the power fluctuation within 1 h is lower than 0.1% [Fig. 7(c)]. The signal-to-noise ratio of the 74.15 MHz fundamental frequency signal in the radio frequency spectrum is 52 dB [Fig. 7(a)].ConclusionsUsing the Kerr lens mode-locking technique, we demonstrate a Ti∶sapphire femtosecond oscillator with high average power and short pulse duration. The laser generates 48 fs pulses with an average power of 4.1 W at a repetition rate of 74 MHz by employing a 532 nm continuous-wave pump source with a power of 16 W, a high-refractive-index prism pair for dispersion compensation, and a slit to facilitate mode locking. The average output power increases by 2.5%, the pulse duration decreases by 63%, the optical-to-optical efficiency increases by 63%, and the peak output power increases by 2.8 times compared to those of the existing model of the same laser type (pump power of 20 W, average output power of 4 W, pulse duration of 130 fs, and repetition rate of 76 MHz).
Nov. 25, 2023Vol. 50 Issue 22 2201002 (2023)
Yihang Yu, Hailin Hu, Dijun Chen, Fang Wei, and Fei Yang
ObjectiveNarrow-linewidth single-frequency lasers play an important role in coherent optical communication, coherent laser radar, microwave photonics, and fiber-optic sensing. The intensity noise of a single-frequency laser is an important indicator of its performance. Accurate evaluation of the intensity noise is of great significance, as it is necessary for optimizing laser performance, as well as for promoting and improving the design of application systems. However, current intensity noise measurement systems have insufficient performance in frequency bands and background noise and cannot meet the measurement requirements of advanced single-frequency lasers. Therefore, it is necessary to develop a relative intensity noise (RIN) measurement system with an ultralow broadband measurement background to satisfy the measurement requirements of more advanced single-frequency lasers and application systems.MethodsIn this study, the noise mechanism and RIN measurement methods are analyzed. Measurement errors in the system are calculated, including shot-noise from photodetectors, thermal noise generated by components, thermal noise in spectrum analysis, and calibration error. Numerical simulations of the main noise sources in the measurement system (see Fig.2) are conducted. A relationship that shows an increase in the photoelectric current can simultaneously reduce the shot-noise limit and the thermal noise limit of the measurement system is observed. A method is proposed for reducing the shot-noise and thermal noise limits of the system by generating a high photocurrent from a photodetector and combining it with a low-noise spectrum analyzer. On this basis, a measurement system of 40 kHz to 40 GHz is built with a background noise of -171 dBc/Hz.Results and DiscussionsThe above measurement principles and methods are experimentally verified using an ultralow background noise measurement system (see Fig.3). An Emcore 1782 distributed-feedback semiconductor laser diode (DFB LD) is used to generate a photocurrent of 1 to 40 mA through an attenuator to measure the RIN. When the photocurrent is less than 10 mA, the measured noise power spectral density remains unchanged, and the measurement results are limited by the system background noise. When the photocurrent is 40 mA, the measured noise power spectral density is significantly higher than the background noise power spectral density, clearly reflecting the noise characteristics of the laser. Under a 40 mA photocurrent, the measurement results in the 100 MHz to 1 GHz frequency band reached a shot-noise limit of -171 dBc/Hz, which is consistent with the theoretical analysis. Subsequently, the feasibility of using an erbium-doped fiber amplifier (EDFA)-amplifying photocurrent to measure the RIN is analyzed (see Fig.4). The results show that when the photocurrent is insufficient, the EDFA can amplify the optical power, increase the photocurrent, and reduce the background noise, thereby making the measurement value closer to the true noise level of the laser. However, this process introduces additional noise that makes the measured value larger than the actual noise value. Ultralow RIN lasers are then measured and characterized using this process. The PLANEX series planar-waveguide external cavity diode laser (PWECL) produced by RIO Lasers, the 1782 DFB LD produced by Emcore, and the self-developed nonplanar ring oscillator solid-state laser (NPRO) display better performance parameters compared with the manufacturer’s data under ultralow background RIN measurements (see Fig.5). The three measured lasers reached the corresponding shot-noise limits at 100 MHz?1 GHz. The results clearly demonstrate noise rollover, multiple relaxation oscillation peaks, intensity modulation harmonic distortion (see Fig.7), and other rich experimental phenomena. Thus, the effectiveness of the ultralow background noise measurement method is confirmed by experiments.ConclusionsThis study aimed to accurately measure the RIN of single-frequency laser sources in high-speed communication and microwave photonic systems. A method for achieving ultralow background RIN measurements of single-frequency laser sources is proposed, using a high-current photodetector to improve the photocurrentand a low-noise spectrum analyzer to reduce the thermal noise. An ultralow background RIN measurement system is built with a spectrum analysis frequency band of 40 GHz and a measurement background noise of -171 dBc/Hz. Subsequently, the RIN characteristics of common optical communication processes are characterized, clearly demonstrating noise rollover, multiple relaxation oscillation peaks, intensity-modulated harmonic distortion, and other characteristics of typical laser sources at extremely low frequencies. The research results have important application prospects for laser performance design optimization and evaluation.
Nov. 25, 2023Vol. 50 Issue 22 2201003 (2023)
Weijie Zhou, Quanxin Na, Yu Wang, Changwen Xu, and Dianyuan Fan
ObjectiveLaser sources possessing sub-nanosecond pulse widths, such as mode-locked lasers, have garnered significant attention owing to their wide-ranging applications in fields such as medical cosmetology, lidar, archaeological bone cleaning, engine ignition, and pumping optical parametric oscillators (OPOs) for mid-infrared lasers. The generation of laser pulses possessing sub-nanosecond widths is generally achieved through passively Q-switched microchip lasers or actively mode-locked lasers. However, in the case of the latter, a repetition rate of approximately 100 MHz-level is attained, necessitating the use of an acousto-optic or electro-optic modulator, which renders the system complicated. On the other hand, the former method achieves high peak power but only offers a repetition rate at the kilohertz level. Thus, there exists a need to explore the use of passively mode-locked lasers possessing narrow laser spectrums, which can generate laser pulses possessing sub-nanosecond widths and high repetition rates.MethodsThe experimental setup is shown in Fig.1. The pump source is a fiber-coupled laser diode (LD) at 793 nm, with the maximum output power of 30 W, the numerical aperture of 0.22, and the core diameter of 105 μm. The pump spot diameter is approximately 168 μm in the center of the Tm∶GdVO4 crystal, which is transformed by lens f1 (focal length f =50 mm) and f2 (f =80 mm). A Tm3+∶GdVO4 crystal with size of 3 mm×3 mm×4 mm is used as the gain medium, and both surfaces of this crystal are antireflection (AR) for the pump and laser wavelengths. The crystal is enclosed with indium foil and fixed onto a copper heat sink, which is kept at a temperature of 18 ℃ using a water chiller. To achieve mode-locking, a semiconductor saturable absorption mirror (SESAM), three plane mirrors, and three curved mirrors are employed to construct a resonator with a cavity length of 2487 mm, corresponding to a repetition rate of 60.3 MHz. M1 and M2 are coated with high reflectivity (HR) films at 1.8?2.0 μm and high transmission films at 793 nm pump light, respectively. M3, M4, and M5 are coated with the HR films at the laser wavelength. The radii of curvature (ROC) of M2, M4, and M5 are 500, 200, and 500 mm, respectively. Three output couplers (OCs) (ROC is ∞) with transmission of 10%, 20%, and 30% at 1850?1890 nm are separately used in the experiment. The bandwidth of the high-speed detector and the high-speed digital oscilloscope is 12.5 GHz, which is enough to diagnose an ultrafast pulse with a pulse width of approximately 100 ps or beyond. An optical spectrum analyzer with a resolution of 0.05 nm is used to record the laser spectrum.Results and DiscussionsFor the continues-wave (CW) operation, three different OCs with transmissions of 10%, 20% and 30% are used, and the maximum output power exceeds 1 W. The wavelengths of the CW lasers are 1844, 1850, 1851, 1861, and 1865 nm, respectively (Fig.3). For the continuous-wave mode-locking (CWML) operation, a commercial SESAM is used. A maximum average output power of 320 mW is achieved using the OC with 30% transmission (Fig.4). When the absorbed pump power is 5.3 W, the signal-noise ratio (SNR) of the fundamental frequency signal is approximately 59 dBm in the radio frequency (RF) spectrum of the pulse trains at the OC with 30% transmission( Fig.5). Stable outputs are achieved for all the three different OCs. The operating wavelengths of the mode-locked lasers are around 1851.6 nm and their full width at half-maximum (FWHM) values are always below the resolution of 0.05 nm (Fig.6). The pulse durations for the three different OCs are 474, 752, and 651 ps (Fig.7).ConclusionsThis study presents the demonstration of a sub-nanosecond pulse width mode-locked Tm∶GdVO4 laser at 1.85 μm. To narrow the spectral widths of the laser pulses, we employ output couplers with high transmission. By using different OCs with transmission of 10%, 20%, and 30%, pulse durations of 474, 752, and 651 ps are obtained, corresponding to maximum pulse energies of 1.0, 3.5, and 5.3 nJ, respectively. The repetition rate of the laser pulses is approximately 60.3 MHz.
Nov. 25, 2023Vol. 50 Issue 22 2201004 (2023)
Yilan Chen, Jiqiao Liu, Mingjian Wang, and Xiaolei Zhu
The pump source is a home-made 1064 nm Nd∶YAG amplifier. A half-wave plate is inserted behind the 1064 nm pump laser to align the pump beam laser polarization direction to match the <111> direction of the diamond crystal to maximize the Raman gain. A focus lens with a focal length f of 200 mm is used to focus the pump beam onto the diamond. The waist radius of the pump beam in the diamond is ~200 μm.Compared to other Raman laser materials, high-quality diamonds have high Raman gain, high thermal conductivity, high damage threshold, and wide spectral transmission. A low-nitrogen, low-birefringence diamond crystal with a size of 2 mm×2 mm×7 mm is used as the Raman gain medium. The propagation direction in the diamond crystal is along the <110> direction.The intracavity nonlinear crystal is a LiB3O5 (LBO) crystal with a size of 4 mm×4 mm×10 mm. It is coated with antireflection films at wavelengths of 1064, 1240, and 620 nm. The LBO crystal is wrapped in indium foil and mounted on a copped heat sink using a temperature controller. The temperature is maintained at 37.1 ℃ by thermoelectric cooler (TEC) for type I noncritical phase matching. M1 and M2 mirrors are used to separate the residual 1064 nm pump laser, 1240 nm Raman laser, and 620 nm red laser.An extracavity frequency-doubled 310 nm ultraviolet laser is demonstrated using a BaB2O4 (BBO) crystal with a size of 4 mm×4 mm×7 mm. A half-wave plate is used to align the fundamental-frequency laser polarization. A focal lens with a focal length of 200 mm is used to focus the 620 nm laser onto the BBO crystal. A prism is used to separate the 620 nm laser and 310 nm ultraviolet laser.An output power of 48 mW at 310 nm is achieved when the fundamental-frequency laser power is 550 mW at 620 nm (Fig.5). The frequency-doubling efficiency is 8.7%. The central wavelength is 309.8 nm (Fig.6). The pulse width is 762 ps, with an output power of 48 mW at 310 nm (Fig.7).ObjectiveOzone is one of the most important gaseous components in the Earth’s atmosphere. Atmospheric ozone includes stratospheric and tropospheric ozone. Stratospheric ozone absorbs most of the ultraviolet rays from the sun to prevent damage to life. Differential absorption Lidar (DIAL) has been widely used to measure ozone concentrations. As transmitters are key components of a DIAL system, several groups have demonstrated their work on transmitters. However, compared to transmitters with wavelengths below 300 nm, ultraviolet transmitters with wavelengths of 300?320 nm can transmit laser through a high ozone concentration in the atmosphere. Compared to optical parameter oscillators (OPO) and second harmonic generation (SHG) from 1.3 μm laser, Raman lasers do not require phase matching management. Solid-state Raman lasers offer the advantages of compactness and high beam quality. In this study, we investigate a pulsed ultraviolet 310 nm laser with stimulated Raman scattering and frequency doubling, aiming at the demand for transmitters for ozone DIAL.MethodsThe 310 nm ultraviolet solid-state Raman laser includes three parts: a pump source for the diamond Raman laser, a 620 nm intracavity frequency-doubled diamond Raman laser, and a 310 nm ultraviolet laser based on extracavity doubling. The experimental setup of the 310 nm ultraviolet laser is shown in Fig. 1.Results and DiscussionsThe output power of the 620 nm laser versus that of the 1064 nm laser is shown in Fig.2. An output power of 550 mW is achieved with a 1064 nm pump power of 4 W. The conversion efficiency is 13.7%. The central wavelength is 620.1 nm (Fig.3). Because of the beam clean-up effect in solid-state Raman lasers, the beam quality of the 620 nm laser is apparently better than that of the pump laser (Fig.4).ConclusionsA high-repetition-frequency pulsed ultraviolet laser is designed using a frequency-doubled diamond Raman laser pumped using a 1064 nm laser. An intravacity-frequency-doubled diamond Raman laser with a 620 nm output laser is demonstrated. A laser output power of 550 mW is achieved using a 1064 nm pump power of 4.0 W. The conversion efficiency is 13.7%. With extracavity doubling, an average output power of 48 mW is achieved at 310 nm using a BBO crystal. The repetition frequency is 2 kHz, and the pulse width is 762 ps. The conversion efficiency is approximately 8.7%. By improving the power of the 620 nm laser, the power of the 310 nm ultraviolet laser can be further improved to satisfy the requirements for ozone DIAL transmitters.
Nov. 25, 2023Vol. 50 Issue 22 2201005 (2023)
Jingyi Liu, Rong Wang, Xu Li, Jiapan Zheng, Honghao Xu, Wenjuan Han, Yuxia Zhang, and Junhai Liu
ObjectiveYellow lasers have applications in industrial, medical, and scientific fields. In addition, the demand for yellow lasers has gradually increased in astronomy, spectroscopy, and similar fields. Common methods for generating yellow lasers include using semiconductor lasers, nonlinear frequency conversion, and direct pump laser gain media doped with appropriate ions. These methods have yielded relatively high yellow lasers and Q-switched-pulse yellow lasers. However, the principle and process of nonlinear frequency conversion are complex. With the development of blue laser diode (LD) pumping technology, visible lasers can be obtained by directly pumping a gain medium doped with rare-earth ions. The Dy3+ ion has an energy-level emission of 4F9/2 to 6H13/2 corresponding to the yellow emission at 574 nm, and an energy-level absorption of 6H15/2 to 4I15/2 corresponding to the absorption peak at 450 nm. Thus, Dy3+ ion-doped crystals are potential yellow laser gain materials for being directly pumped by blue LDs. Co-doping with Tb3+ ions has also been reported as an effective method for quenching the lower level 6H13/2 of Dy3+, which can lead to fast depopulation of the population in the lower laser level and reduce the pumping threshold. Therefore, a yellow laser performance with the output power of 55 mW was obtained in Dy-Tb∶LuLiF4 crystal in 2014. The results can be further optimized through the development of pumping technologies. Black phosphorus (BP), a two-dimensional (2D) material, has a direct bandgap of 0.3?2 eV. The direct bandgap theoretically indicates that BP is a potential broadband saturable absorber in the visible to mid-infrared regions. Therefore, with BP as a suitable saturable absorber, a pulsed yellow laser can be realized using Q-switching technology. Hence, in this study, with a Dy-Tb∶LuLiF4 crystal as the gain material, continuous wave (CW) and passively Q-switched yellow lasers are generated with single-emitter and double-emitter blue LDs as the pump sources, respectively.MethodsThe pump sources used in the experiment were single-emitter and double-emitter blue LDs, under the same conditions [Fig.1(a) and Fig.2(a)]. The laser resonator consisted of two concave mirrors (M1 and M2) with a radius of curvature of 50 mm each. Two mirrors were coated to generate a yellow laser. The distance between M1 and M2 was optimized to approximately 50 mm. Finally, the pump beam was focused onto the Dy-Tb∶LuLiF4 crystal using a planoconvex lens. The laser crystal was polished and mounted onto a copper holder equipped with circulating cool water. The BP sample was fabricated via chemical vapor deposition (CVD) using sapphire as the substrate. The transmission spectra in the visible range and the Raman spectrum of the sample were measured (Fig.3). To investigate the saturable absorption of the BP sample, a self-administered Z-scan test system was employed with a pump source at 532 nm. The variation in the normalized transmittance with incident intensity was presented and fitted using the saturable absorption equation (Fig. 4 and equation 1). To generate a Q-switched yellow laser, the BP sample was inserted into the cavity and placed at the minimum possible distance from the Dy-Tb∶LuLiF4 crystal.Results and DiscussionsWith the laser setup of the single-emitter blue LD, a CW laser was generated at a threshold absorbed pump power of 0.74 W. When the absorbed pump power increases to 2.12 W, the maximum output power of the yellow laser is obtained with a corresponding slope efficiency of 11.3% [Fig.1(b)]. With the double-emitter-blue-LD setup, a maximum output power of 297 mW is generated under the absorbed pump power of 3.0 W with a corresponding slope efficiency of 12.3% [Fig.2(b)]. To verify the Q-switching performance, variations in the pulse width and repetition rate as functions of the absorbed pump power were obtained (Fig.5). As the pump power increases, the pulse width decreases to 766.8 ns, and the repetition rate increases from 9.4 to 26.2 kHz with the increase in the absorbed pump power. Thus, the pulse energy and peak power can be estimated. When the absorbed pump power is 3 W, the maximum pulse energy is 2.1 μJ, and the maximum peak power is 2.7 W. The temporal waveform of the pulse is also provided, which verifies the stable Q-switching behavior.ConclusionsIn this paper, we report a yellow laser pumped by single- and double-tubed blue LDs. Combined with a temperature control system to deal with the heat generated by the crystal, a 573.9 nm yellow laser is generated. The maximum output power is 297 mW at an absorbed pump power of 3.0 W, and the corresponding slope efficiency is 12.3%. A multilayer BP sample is used as a saturable absorber to generate a Q-switched pulsed yellow laser. When the absorption pump power is 2.8 W, the average output power of the pulsed yellow laser is 54 mW, with the corresponding pulse width of 766.8 ns and the corresponding pulse energy of 2.1 μJ.
Nov. 25, 2023Vol. 50 Issue 22 2201006 (2023)
Yaqi Wang, Xiaolei Zhu, Tingting Lu, Jian Ma, Haoda Ma, and Junxuan Zhang
A homemade 532 nm pulse laser with 1 kHz repetition rate and 9.2 ns pulse duration, which is provided by an intra-cavity frequency-doubling electro-optical Q-switched Nd∶YAG laser, is used as the pump source for the optical parametric oscillator. To improve the peak power density of the 532 nm pump laser, a shrink-beam system is placed before the optical parametric oscillator cavity. Then, the 532 nm laser is used as the pump source of the singly resonant optical parametric oscillator. The optical parametric oscillator cavity is a 33 mm-long linear plane-concave resonator consisting of a plane mirror and a concave output coupler with a transmission of 35% at a signal wavelength of 972 nm.The plane mirror has an antireflection coating at 532 nm and 1175 nm, and a high-reflection coating at 972 nm. A concave output coupler with a curvature radius of 2000 mm has an anti-reflection coating at 532 nm and 1175 nm and a local reflection coating at 972 nm. Thus, the optical parametric oscillator is singly resonant at 972 nm. Two type- Ⅰ LiB3O5 (LBO) crystals with a size of 4 mm×4 mm×12 mm and phase matching cut angles of θ=90° and φ=11.4° are used as the parametric crystals. The frequency-doubling unit is placed behind the optical parametric oscillator. A type- Ⅰ LBO crystal with a size of 4 mm×4 mm×12 mm and phase matching cut angles of θ=90° and φ=17.6° is used for the second harmonic generation from the 972 nm fundamental laser of the singly resonant optical parametric oscillator to the 486 nm blue laser.ObjectiveBlue-green lasers have been widely used in ocean lidar systems owing to the optical transmission window of seawater. Researchers have found that green lasers in the 520?580 nm region penetrate deeper into coastal seawater, whereas blue lasers in the 420?510 nm region are more suitable for deep clean seawater. Comprehensively considering the lidar detection range and signal-to-noise ratio, a blue laser at approximately 488 nm has significant advantages for global ocean exploration. If the working wavelength of a laser detection system is located at 486.1 nm, which is also at the Fraunhofer dark line of the solar spectrum, the signal-to-noise ratio can be further improved, and the working hours can be extended. Generally, there are two methods to obtain a blue laser with a wavelength of more than 480 nm: one is based on a frequency-quadrupling Tm-doped fiber laser, and the other is based on an optical parametric oscillator pumped using a 355 nm laser. This study presents a novel method for obtaining a 486 nm blue laser using an optical parametric oscillator based on frequency-doubling technology. The optical parametric oscillator is pumped using a homemade 532 nm laser to avoid damage caused by an ultraviolet laser. We hope that this novel method will provide a reliable laser source for ocean laser detection systems.Methods The laser system consists of three componentsa homemade 532 nm pump laser, a 972 nm singly resonant optical parametric oscillator, and a frequency-doubling unit from 972 nm to 486 nm.Results and DiscussionsUnder a repetition of 1 kHz, when the pump energy is 3.87 mJ, a 972 nm output laser with a single pulse energy of 0.96 mJ is obtained in the optical parametric oscillator (Fig.5), and the optical to optical conversion efficiency of the optical parametric oscillator is 24.8%, which is close to the theoretical calculation value of 22.3%. The 972 nm pulse energy instability within 60 min is approximately 1.64% (Fig.6), and the pulse width is 7.5 ns with a smooth pulse temporal profile (Fig.7). The laser beam is slightly elliptical, approximately 1.7 mm in diameter, with beam quality factors of Mx2=1.30 and My2=1.22 in two directions (Fig.8). The 486 nm laser with single pulse energy of 49 μJ is obtained by frequency-doubling the 972 nm output laser with a corresponding frequency-doubling efficiency of 5.3%. The pulse duration of the blue laser is 6.9 ns, which is slightly narrower than that of the fundamental laser (Fig.10). The beam quality factors of the blue laser in the two directions are Mx2=1.26 and My2=1.15 (Fig.11).ConclusionsA 486 nm blue laser frequency doubled by a 972 nm singly resonant optical parametric oscillator pumped using a 532 nm laser is demonstrated. At a repetition rate of 1 kHz, the 972 nm signal laser energy of the singly resonant optical parametric oscillator reaches 0.96 mJ when the 532 nm pump laser energy is 3.87 mJ, with a corresponding conversion efficiency of 24.8%. The maximum energy of the frequency-doubled 486 nm laser is 49 μJ with a pulse width of 6.9 ns, and the corresponding frequency-doubling efficiency is 5.3%. The results show that high-repetition-rate blue laser pulses can be obtained using an optical parametric oscillator pumped by a 532 nm pulsed laser, which can avoid ultraviolet damage caused by the 355 nm laser. It can be used as a laser source for ocean laser LiDAR systems to achieve stable detection.
Nov. 25, 2023Vol. 50 Issue 22 2201007 (2023)
Mingjun Wu, Rongqing Tan, Hui Li, Fangjin Ning, Yijun Zheng, Ziren Zhu, and Jinzhou Bai
ObjectiveHigh-repetition-rate, short-pulse CO2 lasers have broad application prospects in non-metal processing, laser medicine, extreme ultraviolet (EUV) lithography, photoelectric countermeasures, and other fields. Radiofrequency (RF)-excited waveguide CO2 lasers are small, have high efficiency and long life, and are maintenance-free; thus, continuous-wave output CO2 lasers have been widely used. The main technical means for RF-excited waveguide CO2 lasers to achieve high peak power pulse outputs include electro-optical Q-switching, mechanical Q-switching, and acousto-optic Q-switching. Electro-optical Q-switching can achieve pulsed laser output with repetition rates of more than 100 kHz and pulse widths of tens of nanoseconds; however, electro-optical crystals, such as CdTe, are difficult to grow, easy to damage, and expensive, and the driving voltage required by the crystals is more than 1 kV; thus, the technology is relatively complex. The structure of mechanical Q-switching is simple and the cost is low; however, it is limited by the speed of the motor and the stability of the chopper at high speed. It is difficult to obtain a stable pulse output with a high repetition rate, and it is difficult to accurately control and encode the pulse. Acousto-optic Q-switching is normally realized by placing an acousto-optic modulator in the resonant cavity, and the loss in the cavity is modulated by acousto-optic diffraction to achieve a Q-switched pulse output, which has a low device cost and a high damage threshold. Acousto-optic Q-switched RF waveguide CO2 lasers can achieve pulse output with high repetition rate and short pulse width. They have a compact structure and are easy to carry, thus providing high-quality laser sources for photoelectric countermeasures and other fields.MethodsThe laser designed in this study adopts a semi-external cavity structure. An acousto-optic modulator is placed between the total reflection mirror and the window, and intracavity loss modulation is realized by the acousto-optic diffraction effect. Using rectangular waveguide coupling theory, the relationship between the coupling efficiency at the waveguide port and the curvature radius of the total reflection mirror, the distance from the total reflection mirror to the waveguide port, and the optimal total reflection mirror parameters are obtained. The position of the acousto-optic modulator in the cavity is determined using acousto-optic diffraction theory. Using an experimental method, the pulse output with high repetition rate and short pulse width is realized by optimizing the working pressure and opening time of the Q-switch. The beam quality is measured using the knife-edge method.Results and DiscussionsThe relationship between the waveguide coupling efficiency and the distance from the total reflection mirror to the waveguide port (Fig.2) and the curvature radius of the total reflection mirror are determined (Fig.3). It is found that a higher coupling efficiency can be obtained when the total reflection mirror is 60 mm away from the waveguide port with a curvature radius of 8 m. Through experiments, the relationship between the laser output and working pressure is determined. With an increase in the working pressure, the peak power first increases and then decreases (Fig.5), and the pulse width decreases slightly and then increases (Fig.6). The highest peak power and shortest pulse width are achieved at a working pressure of 6.5 kPa. This is because an appropriate increase in the working pressure shortens the lifetime of the upper energy level, and thus, the pulse width is compressed. However, when the working pressure is further increased, the ratio of electric field strength to gas particle number density (E/N) deviates from the optimal range, resulting in unstable discharge, a decrease in peak power, and an increase in pulse width. In addition, the results show that the pulse tail length decreases nearly linearly with a decrease in the opening time of the Q-switch (Fig.8). Therefore, the tail can be effectively removed by optimizing the opening time of the Q-switch. A near-Gaussian tail-free waveform is obtained at the opening time of 0.6 μs. Finally, the influence of repetition rate on the output is determined when the working pressure is 6.5 kPa and the opening time is 0.6 μs. The pulse width increases slightly with an increase in the repetition rate (Fig.10). The peak power gradually decreases, whereas the average power gradually increases with an increase in the repetition rate. Both tend to stabilize when the repetition rate is greater than 70 kHz (Fig.11). The laser can achieve repetition rates of 1 Hz?100 kHz. A maximum peak power of 2809.6 W and pulse width of 108.2 ns are obtained at 1 kHz. At the repetition rate of 100 kHz, the pulse width is 135.1 ns and the peak power is 257 W. At the repetition rate of 70 kHz, the beam quality factors in the x and y directions Mx2 and My2 are 1.51 and 1.20, respectively (Fig.12).ConclusionsAn RF waveguide CO2 laser with a high repetition rate and short-pulse laser output is achieved using acousto-optic Q-switching. In this study, the waveguide coupling loss theory is used to determine the optimal resonant cavity parameters through simulation analysis. The effect of the working pressure on the laser output is analyzed, and the optimal pressure is determined to be 6.5 kPa under the experimental conditions. The main factor affecting the pulse tail, which is caused by the long Q-switch opening time, is determined or investigated. A tail-free pulse waveform with high repetition rate and short pulse width is obtained by optimizing the Q-switch opening time. A laser output with the pulse width of 108.2 ns and peak power of 2809.6 W is obtained at the Q-switch opening time of 0.6 μs and repetition rate of 1 kHz. The peak power with Q-switch is 345 times that without Q-switch. The beam quality factors in the x and y directions Mx2 and My2 are 1.50 and 1.21, respectively, and the good beam quality is obtained. The study provides a reference for a subsequent realization of high peak power, high repetition rate, and short pulse-width laser output using a large-gain-volume waveguide cavity.
Nov. 25, 2023Vol. 50 Issue 22 2201008 (2023)
Cong Zhang, Cong Xia, Shihui Ma, Yonggui Yu, Zhanggui Hu, Ning Ye, Jiyang Wang, and Yicheng Wu
ObjectiveNd3+ ions have received considerable attention for laser applications owing to their unique energy-level structures. Calcium niobium gallium silicate (CNGS) crystals, members of the gallium lanthanum silicate system, exhibit superior mechanical and thermal properties. In this study, Nd3+-doped CNGS crystals with the diameter of 30 mm and isometric section length of 45 mm are grown using the pull-down method, and their optical properties, including refractive index, absorption spectra, and emission spectra, are characterized. The laser output of 1065 nm is obtained along the b-direction using 880 nm pumping, and the laser output power is 1.88 W with the conversion efficiency of 28.1% at the pumping power of 6.69 W.MethodsPure CNGS and neodymium-doped CNGS crystals with the diameter of 30 mm and isometric part length of 45 mm are prepared via the Czochralski method, using 99.99% high-purity (mass fraction) CaCO3, Nb2O5, Ga2O3, and SiO2 raw materials, as shown in Fig. 1. Single-crystal X-ray diffraction (XRD) is performed using a diffractometer. The corresponding data are collected using a diffractometer, processed with the SHELEX software, and then all the atoms in the structure are refined using full matrix least square method. The grown CNGS and Nd∶CNGS crystal samples are processed into prisms along the c-direction and adapt for refractive-index measurements using a spectrometer at room temperature. The absorption spectra of crystals with size of 6 mm×6 mm×2 mm are recorded in the wavelength range of 400?950 nm along the a and b directions by an ultraviolet-visible-near-infrared (UV-Vis-NIR) spectrophotometer. The excitation spectra, fluorescence lifetimes, and photoluminescence spectra are determined using a fluorescence spectrum analyzer. Laser experiments are performed using a lens combination with numerical aperture (NA) of 0.22, laser spot radius of 200 μm, and focal length of 7.5 cm. As shown in Fig. 2, the input mirror is concave with curvature radius R=50 mm, the output mirror is calm, and the transmission rates (T) are 1%, 8%, 10%, and 15%. The crystal processing size is 3 mm×3 mm×13 mm, the resonant cavity length is 2 cm, and the cooling system temperature remains constant at 12 ℃.Results and DiscussionsFigure 3 presents the single-crystal XRD data. Because of the similar radii of Nd3+ ions and Ca3+ ions, the analysis of the diffraction results reveals no difference in the structural test results between the pure-phase CNGS crystals and Nd∶CNGS crystals. All hexahedra and tetrahedra are distorted to some extent, causing an increase in the disorder of the crystal structure, which in turn increases the absorption and emission cross-sections of the crystal. The refractive indices of the Nd∶CNGS crystals at 1064 nm are calculated from the fitted Sellmeier equation as no=1.7721 and ne=1.8534, where no represents the refractive index of unusual light and ne represents the refractive index of non-unusual light. Comparing the absorption spectra in the two directions, the absorption is stronger along the c-axis at 586, 741, and 808 nm, and therefore the c-direction can be considered as the most effective laser pumping direction. The full width at half maximum (FWHM) of the fluorescence emission spectra of the Nd∶CNGS crystals is approximately 22.58 nm, suggesting that the Nd∶CNGS crystals can be incorporated to generate ultrafast pulses. Figure 6 shows that the fluorescent lifetimes of the Nd∶CNGS crystals are 0.223 ms (b-direction) and 0.219 ms (c-direction). The excited emission cross section of the Nd∶CNGS crystal is calculated using the Fuchtbauer-Ladenburge (F-L) equation, as 9.89×10⁻²⁰ cm2. Laser experiments are conducted using the Nd∶CNGS crystals in various directions. When the output mirror with 8% transmittance is employed, the highest output power is 1.88 W for the pump power of 6.69 W, slope efficiency of 28.1%, and output wavelength of 1065 nm with the corresponding full width at half-maximum of 1.5 nm. Additionally, laser experiments are conducted on the c-cut Nd∶CNGS crystal using output mirrors with transmittance values of 8%, 10%, and 15%, and the results are provided in Figs. 8(c) and (d). The laser performance of the Nd∶CNGS crystal along the b-direction is significantly better than that along the c-direction. For the b-directional crystal, the laser threshold is 0.28 W at T=1%, 0.35 W at T=8%, 0.45 W at T=10%, and 0.5 W at T=15%, while for the c-cut crystal, the laser threshold is 0.45 W at T=8%, 0.6 W at T=10%, and approximately 0.69 W at T=15%. The laser threshold increases with an increase in output transmittance T, mainly because the intracavity loss increases with an increase in T, which leads to an increase in the laser threshold.ConclusionsNd∶CNGS crystals are successfully grown via the Czochralski method, and their optical properties are examined in the b- and c-directions with the emission cross section of 9.89×10⁻²⁰ cm2 at 1064 nm. The continuous laser performance of the Nd∶CNGS crystals is evaluated using a pump light source at 880 nm, and the laser output power and conversion efficiency along the b-direction of the crystal are better than those in the c-direction, with the output power of 1.88 W at 1065 nm and slope efficiency of 28.1%. Moreover, the output power and conversion efficiency of the crystal along the b-direction are better than those in the c-direction, with the output optical power of 1.88 W at 1065 nm and slope efficiency of 28.1% at the output mirror with 8% transmittance. The results obtained demonstrate that the Nd∶CNGS crystal is a promising laser gain medium; combined with its emission cross-section and spectral full width at half-maximum, it is well suited for Q-modulation and ultrafast laser applications.
Nov. 25, 2023Vol. 50 Issue 22 2201009 (2023)
Ruixian Li, Chongwei Wang, Jun Ye, Hu Xiao, jiangming Xu, Jinyong Leng, and Pu Zhou
ObjectiveHigh-power superfluorescent fiber light sources have a wide range of applications, including Raman fiber laser pumping, optical coherence imaging, and spectral beam combining. They are favored for their simple structure, low temporal coherence, high temporal stability, absence of relaxation oscillation, and lack of self-locking mode pulses. However, because of the limitation of parasitic lasing, it is challenging to increase the power of a single-stage superfluorescent fiber light source. Currently, its power only reaches a few hundred watts. A master oscillator power amplification (MOPA) structure provides a solution to achieve high power output by amplifying a low-power superfluorescent seed. The highest reported power of 1-μm superfluorescence based on a Yb-doped fiber MOPA structure is 3 kW. Further power scaling is limited by stimulated Raman scattering (SRS) and transverse mode instability (TMI). In this study, we implement backward cascaded pumping to suppress TMI and SRS and boost the superfluorescent output to more than 6 kW.MethodsFirst, the superfluorescent source is filtered out by a bandpass filter and amplified to 40 W by two pre-amplifiers. In the seed stage, it is important to use isolators to reduce the negative impact of backscattering on the superfluorescent seed source. In the amplification stage, the superfluorescent light is launched into the double-clad ytterbium-doped fiber (YDF) through a mode field adapter, a cladding light stripper, and a combiner. A 1018-nm pump laser is injected into YDF through a backward combiner. Finally, the amplified superfluorescent light is emitted through a cladding light stripper and a beam collimator.Results and DiscussionsThe output power increases almost linearly with the injected pump power. At a pump power of 7554 W, the output power reaches 6200 W with a corresponding optical-to-optical conversion efficiency of 81.5%. As the power increases, the spectral width gradually broadens, and the 3-dB linewidth increases from 2.08 nm at 40 W to 7.72 nm at 6200 W. At an output power of 6200 W, the system experiences severe SRS, and the Raman suppression ratio is only approximately 25 dB. Beam quality factor (M2) first increases and then stabilizes as the power is increased. The seed has an M2 value of 1.71, while M2=1.98 at the maximum power of 6200 W. The temporal and spectral superfluorescence characteristics indicate that the system does not exhibit the TMI phenomenon.ConclusionsA practical technical approach to designing high-power superfluorescent light sources is proposed. To the best of our knowledge, the 6.2-kW superfluorescent output achieved is the higher power level reported publicly.
Nov. 25, 2023Vol. 50 Issue 22 2215001 (2023)
Bin Li, Akun Yang, Zhaoxiang Sun, and Nan Chen
ObjectiveA large aperture telescope is needed to achieve long distance observations. The size of a single aperture telescope is limited by processing costs and other factors, and the segmented mirror technology is expected to break through the single aperture telescope limit. The key to the realization of segmented mirror technology is fine co-phasing. Currently, the most widely used technique for co-phasing detection is the broadband and narrowband Shack-Hartmann (S-H) method. The broadband S-H detection range is large, but the accuracy is low (30 nm), whereas the narrowband S-H method has a high detection accuracy of 6 nm; however, there is 2π ambiguity effect and its detection range is λ/2. The conventional cross-correlation algorithm uses two wavelengths to detect the co-phasing error, which effectively solves the 2π ambiguity effect in single wavelength detection and simultaneously improves the detection range. In this study, to address the slow detection speed and low accuracy of the current two-wavelength co-phasing detection method using the cross-correlation algorithm in the detection of large-range co-phasing errors, a two-wavelength co-phasing algorithm based on convolutional neural networks is proposed to achieve fast and accurate co-phasing detection in large-range co-phasing errors. First, the circular diffraction image splicing at the two wavelengths is used as the training data for the convolutional neural network. After training, the circular diffraction splicing image containing the piston error information is input into the trained model, and the piston error value is detected directly. The robustness of the convolutional network based on convolutional networks under different error situations is also analyzed.MethodsBased on the principle of circular diffraction, the circular diffraction pattern with the piston error information is first obtained through software simulation, and the circular diffraction patterns corresponding to the piston error at the two wavelengths are used to splice and obtain the data set for training the network. The convolutional neural network is then constructed, and the model of the circular aperture diffraction pattern and piston error is trained using the established data set. Finally, after the convolutional neural network is trained, the circular diffraction pattern at the corresponding wavelength is collected by inserting a circular aperture mask between the sub-mirrors of the segmented mirror system, and the obtained circular diffraction pattern is used as the input of the neural network. The piston error between the two sub-mirrors is directly obtained using the trained convolutional neural network model. The robustness of the convolutional neural network is also analyzed for different error situations.Results and DiscussionsThe convolutional neural network model is trained with 99.85% accuracy in the validation set and 99.9% accuracy in the test set, with a residual root-mean-square error (RMSE) of 36.7 nm (Fig. 6). The robustness of the convolutional neural network model under multiple error cases is discussed. When only the eccentricity error (R2) is present, the residual RMSE of the convolutional neural network is less than 40 nm at R2≤0.1 (Fig. 7). When only the noisy signal-noise-ratio (SSNR) is present, the residual RMSE of the convolutional neural network is less than 40 nm for SSNR≥40 (Fig. 8). When both errors are present, the residual RMSE of the convolutional neural network is less than 40 nm for SSNR>40 and the eccentricity error R2<0.1 (Fig. 9). It is also demonstrated that the number of prediction data samples has no significant effect on the prediction results of the convolutional neural network model. Finally, comparing the convolutional neural network-based detection method with the traditional cross-correlation algorithm (Fig. 10 and Table 2), the convolutional neural network takes 15.88 s to predict 1500 sets of piston error images successively under the same conditions. Only two images are predicted incorrectly, compared with the lower performance of the traditional cross-correlation algorithm.ConclusionsBased on the principle of circular diffraction, this study proposes the use of a convolutional neural network for the co-phasing detection method to solve the problem of slow operation speed based on the cross-correlation algorithm in the current two-wavelength detection co-phase error method and to achieve faster and more accurate co-phasing detection of the segmented mirror. The robustness of the convolutional neural network under several error situations is also demonstrated. The detection method based on the convolutional neural network is compared with the traditional cross-correlation algorithm. The simulation analysis shows that the two-wavelength detection method based on the convolutional neural network can achieve the requirements of co-phasing detection with a large range, high accuracy, and fast detection speed. The study provides an experimental reference for the future application of the co-phasing detection method in engineering experiments.
Nov. 25, 2023Vol. 50 Issue 22 2204001 (2023)
Jiali Chen, Gaofei Sun, Shi Liu, Guoyu Zhang, Jierui Zhang, and Siwen Chen
ObjectiveSolar simulator is a device for simulating the space solar radiation characteristics and geometric characteristics on the ground, and its irradiation uniformity index directly determines the performance of the solar simulator. Traditional light homogenizing devices include optical integrator and integrating sphere. Optical integrator is constrained by the angle of incident light, and has the disadvantage that the angle is sensitive to the effect of light homogenization. Although the integrating sphere has a wide range of incident light angles, it will result in the large irradiance surface at a long distance, and the irradiance and irradiation uniformity will be reduced by the influence of the divergent light angle of the integrating sphere. In the present study, we propose a method to modulate the angle of the light emitted from the integrating sphere by inverting the compound parabolic concentrator into a compound parabolic reflector. This compound parabolic reflector can utilize the light emitted by the integrating sphere that cannot enter the effective irradiation surface, improve the energy utilization of the light source, and realize the simulation of light spot with large irradiation surface and high irradiation uniformity at a distance.MethodsIn this paper, the design of compound parabolic reflector is carried out. Firstly, the parabolic equation is derived by studying the principle of beam modulation of compound parabolic reflector. Then, the influence of the parameters of the compound parabolic reflector on the irradiation uniformity and irradiance on the irradiation surface is analyzed, and the size parameters such as the divergence angle and intercept ratio of the compound parabolic reflector are determined. Finally, the optical system model of the divergent solar simulator is established and simulated.Results and DiscussionsThe designed compound parabolic reflector modulates the light half angle of the divergent light of the integrating sphere from 82° to 25° (Fig. 8). With the increase of the maximum divergence half angle from 20° to 30°, the irradiance drops sharply, and its value even drops by nearly 40%; the irradiation uniformity shows a trend of rising first and then stabilizing (Fig.6). The irradiance of the effective irradiation surface decreases gradually with the increase of the length intercept ratio of the compound parabolic reflector. The irradiation uniformity is almost stable when the intercept ratio is not greater than 20%, and the decline is steeper when the intercept ratio is greater than 20% (Fig.9). With the diameter of the effective irradiation surface of solar simulator being 1000 mm, when the intercept ratio of the compound parabolic reflector used is 20%, the irradiation uniformity on the effective surface is increased by 0.24 times, to 97.30%, and the irradiance is increased by 5.1 times, to 553.54 W/m2 compared with the system without the composite parabolic reflector (Table 2).ConclusionIn this paper, a compound parabolic reflector is designed for the purpose of modulating the divergence angle of the light hole of the integrating sphere to improve the utilization of the light energy of the xenon lamp and the irradiation uniformity of the large irradiance surface. The compound parabolic reflector can modulate the half angle of the divergent light of the integrating sphere from 82° to 25°. Through the analysis of the length intercept ratio of the compound parabolic reflector, the results show that when the length intercept ratio is 20%, the irradiation uniformity of the intercepted compound parabolic reflector on the effective irradiation surface is still 97.30%, a value comparable to that of the compound parabolic reflector without interception. The overall simulation analysis of the optical system of the solar simulator shows that when the working distance of the solar simulator is 3000 mm and the diameter of the effective irradiation surface is 1000 mm, the irradiation uniformity is 97.30%, and the maximum irradiance is 553.54 W/m2, realizing the simulation of large irradiance with high irradiation uniformity.
Nov. 25, 2023Vol. 50 Issue 22 2204002 (2023)
Quan Deng, Zeyu Zhao, He Lin, Ling Liu, Xiachuqin Li, Gensen Yang, and Xiangang Luo
ObjectiveDefect detection is an essential process for realizing superdiffraction fabrication based on metal film layer excitation surface plasmons. However, the light source of most existing advanced defect detection equipment operates in the deep ultraviolet band (DUV), which is within the light-sensitive range of DUV photoresists such as KrF. The overlap of working wavelengths between the defect detection equipment and the DUV photoresist can result in a loss of photoresist efficacy. Furthermore, to avoid the influence of the detection equipment's working wavelength on the photoresist when DUV equipment is used to detect particles on the surface of the film, it is necessary to tune the equipment's incident intensity several times. Moreover, the equipment parameters after tuning are only effective for a single film structure. It is necessary to retune equipment parameters when changing the thickness, material, and the number of film layers, which is time consuming and labor intensive. Therefore, a defect-detection device with a wide range of applications that avoids photoresist-sensitive bands must be developed to address this challenge.MethodsIn this study, visible laser polarization defect detection equipment consisting of three parts: polarization modulation, dark-field detection, and motion control (Fig. 8), is theoretically and experimentally demonstrated. A more sensitive scientific CMOS (sCMOS) is used to detect particle scattering signals. The equipment utilizes the polarization conversion principle of a silver film on the top layer of the wafer surface. By modulating the polarization state and incident angle of the incident light, the scattered light polarization states on the slightly rough silver film surface and the particles on the film surface are different. On the receiving side, the light scattered from the surface of the silver film is partially filtered using a polarization detection device, which improves the signal-to-noise ratio of the particle signal to achieve defect detection.Based on the aforementioned principles, experimental equipment was developed to verify particle detectability [Fig.8(a)]. Standard polystyrene latex (PSL) spheres with diameters of 100 and 50 nm were used as detection targets. Etching marks on the surface of the silicon wafer were used as the detection area, and subsequent processes such as photoresist spin-coating, magnetron sputtering coating, reactive ion beam etching (AFM surface roughness detection), and particle solution atomization were performed on the wafer [Fig.8(b)]. In this experiment, silver films with different surface roughness were processed by controlling the power and etching time of reactive ion beam etching. After dilution and ultrasonic vibration, the particle solution was sprayed onto the surface of the silver film using an atomizer such that standard PSL particles with diameter 100 and 50 nm were uniformly distributed in the surface labeled area. In addition, the samples were maintained under a vacuum insofar as possible during the experiment to decelerate oxidation of the silver film.Results and DiscussionsThe effect of surface roughness on particle detection was subsequently analyzed. Samples with different surface roughness values were observed using identical camera exposure parameters (Fig.10). Experimental results show that as the silver film surface roughness increases, the background noise obtained from the experiment also increases, which can cover up the signal of small-particle defects and cause misclassification. To reduce the effect of surface roughness on particle detection, a polarization device was introduced into the detection equipment and the effect of the incident light polarization state on the signal-to-noise ratio of particles was analyzed. Based on the results, it can be observed that the signal-to-noise ratio of particles differs with different polarization states of the incident light [Fig. 12(a)?(d)]. In the detection experiment involving 100 nm particles, the single exposure time of this equipment was only 150 μs, which is 4‰ of the DSX1000 dark-field microscope based on white light, and the detection efficiency was significantly improved. Finally, it was confirmed using a scanning electron microscope that the proposed experimental system could detect 61 nm PSL particles [Fig.12(l)].ConclusionsThis study conducted targeted research based on defect detection during the plasmon super-diffraction fabrication of metal film layer surfaces. Background noise was suppressed by the polarization modulation technique, and the PSL particles with diameter of 61 nm on the silver film surface were detected with a 473 nm light source for inspection. The equipment operates in the visible wavelength band, which differs from the sensitive wavelength band of the DUV photoresist, thus, effectively avoiding photoresist failure. The proposed method can be theoretically extended to other wavelengths, which can be flexibly selected according to photoresist sensing characteristics, and can improve particle detectability without loss of photoresist efficacy. The proposed solution has a straightforward structure, high practicality, low cost, and good prospects for application in the field of micro-nano fabrication.
Nov. 25, 2023Vol. 50 Issue 22 2204003 (2023)
Yifei Song, Yetao Shu, peng Tang, ting Wan, and Zhaoming Luo
ObjectiveOptical parity-time (PT) symmetric systems have attracted significant attention since their inception because of the unique properties possessed by them. Degeneracy in the state space of a dynamical system refers to points where two or more physical eigenstates coalesce into one. Recently, there has been a growing interest in the degeneracy of PT symmetric optical systems. Coherent perfect absorption laser point (CPA-LP) and exceptional point (EP) are two types of optical degenerate points, where special degeneracies of PT symmetric optical systems exist. Some unique optical phenomena, such as bidirectional acoustic negative refraction, giant Goos-H?nchen shift, and the spin Hall effect of light have been discovered at these degenerate points. Manipulating two optical degenerate points has significant application potential and relevance in photonics. Photonic crystals are artificial microstructures of media with different refractive indices that are arranged periodically and are often used to modulate photons. In Refs. [23] and [24], optical degenerate points in composite structures comprising photonic crystal and PT symmetry were manipulated, and unusual scattering features were found. Therefore, the combination of traditional photonic crystals and PT symmetry can provide a new method to manipulate optical degenerate points and explore unique optical phenomena. In this study, we propose a one-dimensional quaternary periodic PT-symmetric structure and investigate the effects of structural parameters on two optical degenerate points.MethodsThe proposed one-dimensional quaternary periodic PT symmetric structure can be denoted as ABCDN, where N is the period number (Fig. 1). Gain or loss media A, B, C, and D can be prepared by doping quantum dots into common media. In optics, PT symmetry requires a complex refractive index distributed in the form of n(z)=n*(-z), where * denotes a complex conjugate. Therefore, the refractive indices of media A, B, C, and D are set to nA=1.8+qi, nB=1.6-qi, nC=1.6+qi, and nD=1.8-qi, respectively, where q is the gain-loss coefficient. This coefficient can be modulated by the doping concentration of the quantum dots. The optical thicknesses of A, B, C, and D are given as dj=λ/4Renj with j=A,B,C,D, where Renj are the real parts of their complex refractive indices, and λ is the central wavelength of the incident light. When a beam was incident on the one-dimensional quaternary periodic PT symmetric structure, the transfer matrix method was used to solve specific reflection and transmission coefficients. On this basis, the eigenvalues of the scattering matrix were derived further to explore the optical degeneracy of the structure.Results and DiscussionsWe investigated the effects of the gain-loss coefficient, incident angle, and period number on the CPA-LP and EP in the proposed one-dimensional quaternary periodic PT-symmetric structure by using numerical simulation. First, we fixed the period number to be N=3, and flexibly adjusted two optical degenerate points under different incident angles by changing the gain-loss coefficient (Fig. 3). Then, we focused on the difference of the reflection characteristics between the EP caused by PT symmetry and the Bragg resonance point related with period, and found that the unidirectional reflectionlessness and the bidirectional transparency appear at the EP and the Bragg resonance point, respectively (Fig.4). To explore the influence of period number on the two optical degenerate points in one-dimensional quaternary periodic PT symmetric structure, we also study the CPA-LP and the EP in the structure with period number N=1,6. The results show that the number of CPA-LP increases in the parameter space as the period number increases, while the number of EP remains unchanged (Figs. 3?5). Finally, we achieved the manipulation of optical phenomena, such as the photonic spin Hall Effect based on the controllable properties of the two optical degenerate points (Fig. 6).ConclusionsIn summary, a one-dimensional quaternary periodic PT-symmetric structure is proposed, and the effects of the gain-loss coefficient, incident angle, and period number on two optical degenerate points in the structure are investigated. At a certain period, two optical degenerate points can be flexibly regulated under different incident angles by adjusting the gain-loss coefficient. The difference in reflection characteristics between the EP, which is attributed to the PT symmetry, and Bragg resonance associated to the periodic structure is analyzed. When the beam is incident along the left and right sides, the reflectance to only one side is zero at the EP, resulting in unidirectional reflectionlessness characteristics, whereas both the reflectance were zero at the Bragg resonance point, resulting in bidirectional reflectionlessness characteristics. The effect of the period number on the two optical degenerate points is investigated further, and the results show that the quantity of CPA-LP increases with the period number, while EP is independent of the period. Finally, the manipulation of optical phenomena such as the photonic spin Hall Effect is done by using the controllable properties of optical degenerate points. These studies can provide a method to manipulate photons for the development of new optoelectronic devices.
Nov. 25, 2023Vol. 50 Issue 22 2213001 (2023)
Xinkai Feng, Huaixi Chen, Jiaying Chen, and Wanguo Liang
ObjectivePeriodically poled lithium niobate (PPLN) is an excellent nonlinear crystal for laser wavelength conversion. Conventional nonlinear crystals typically require high peak pulse power input. However, because of its periodic non-critical phase matching characteristics, PPLN has high conversion efficiency. It is extremely suitable for continuous wave (CW) laser wavelength conversion and widely used in CW laser systems. In addition, PPLN can realize full-color laser output by flexibly designing its quasi-phase matching (QPM) period, which has strong practical value. There has recently been a gradual shift from bulk PPLN to PPLN thin-film optical waveguides to improve the nonlinear frequency conversion efficiency of CW lasers. In recent years, many domestic research institutions, such as Nanjing University, East China Normal University, Shandong University, and the Chinese Academy of Sciences, have conducted in-depth detailed research on the preparation and application of PPLN thin film optical waveguide devices. Nonlinear frequency conversion devices based on PPLN waveguides have been used in various applications, such as optical communication, quantum optics, microwave optics, and spectroscopy. As applications continue to grow, new requirements are set for the volume and portability of waveguides. This study briefly introduces the basic structure and principle of a silicon-based PPLN thin film ridge waveguide, and a commercially available compact fiber-in-fiber-out PPLN waveguide package module is designed and fabricated.MethodsThe fabrication process of the silicon-based PPLN thin-film ridge waveguide is as follows. First, a Z-cut lithium niobate wafer (0.5 mm thick) doped with MgO is poled at high voltage. According to the FDTD software analysis results, the poled period is chosen to be 18.7 μm to obtain phase matching of the pump wavelength near 1560 nm. After poling, a silicon dioxide buffer layer with a thickness of approximately 600 nm is deposited on one side of the PPLN wafer, subsequently, a gold layer of approximately 300 nm thickness is sputtered. Then, another 0.5-mm thick precision polished silicon wafer is coated with a layer of gold of approximately 300 nm thickness and bonded to the PPLN wafer. This process is realized at room temperature, avoiding mechanical stress caused by the different thermal expansion coefficients of both wafers. Next,thinning and polishing are conducted to form the PPLN film. Finally, the PPLN ridge waveguide with the desired size is prepared based on a precision cutting mechanism. The waveguide direction is X direction (Fig. 4). The PPLN ridge waveguide prepared herein has a cross section of 10 μm×10 μm and a length of 20 mm. A single-mode polarization-holding fiber with a core diameter of 8.5 μm, numerical aperture (NA) of 0.125, and mode field diameter of 10.1 μm is used for end-face direct coupling, and the packaged device is shown in Fig. 5.Results and DiscussionsA tunable laser source is used to tune the wavelength to 1560 nm. Subsequently it is incident into the PPLN ridge waveguide through a narrow-band erbium-doped fiber amplifier (EDFA). The light at the output of the waveguide passes through a 1560-nm high reflection and 780-nm high transmission filter and enters the optical power meter (Fig. 6). Because the refractive index of PPLN is a function of temperature, it is necessary to control the crystal temperature. Here, a temperature controller (the accuracy is 0.01 ℃, temperature control range is from room temperature to 200 ℃) is used to control the temperature of the PPLN waveguide package module. As shown in Fig. 7(a), when the temperature is 24.8 ℃, the output wavelength of the module is 780 nm (the deviation of the spectrometer used in the experiment is 0.2 nm). When the pump power Ppin (shown in Fig. 6) at the output of EDFA reaches 1.6 W, the input pump power Pp0 is calculated to be 1.2 W after deducting coupling loss between the fiber and waveguide at the input, while the coupling pump power PpL [without second harmonic generation (SHG)] at the output of the waveguide is 0.9 W. The power of SHG is 653 mW [Fig. 7(b)], the optical-optical conversion efficiency is 54.4% (Pp0 to SHG power). The normalized conversion efficiency is 20.2%?W-1?cm-2 (PpL to SHG power). According to the input pump power Pp0, after deducting the coupling loss between the input fiber and the waveguide, the optical-optical conversion efficiency of the waveguide is 72.5%.ConclusionsThis study simulate and analyze the relationship between the QPM period of the PPLN ridge waveguide with a ridge height or width of 10 μm at 25 ℃ and the corresponding ridge width or height. The QPM period of the PPLN waveguide increases with the increase of ridge height or width at the same pump wavelength and ridge height or width and finally tends to a constant, that is, the period of bulk PPLN crystal. The relationship between the QPM period and temperature of the PPLN ridge waveguide with constant ridge height and width at the same pump wavelength is analyzed. The QPM period decreases gradually with the increase in temperature, and the QPM period decreases by approximately 3 nm when the temperature rises by 1 ℃. Here, the fabrication process of the PPLN thin-film ridge waveguide is improved. For example, the thickness of the silicon dioxide buffer layer is 600 nm. The waveguide package module with compact fiber in and out is fabricated, and its performance tested. When the temperature is 24.8 ℃ and the input power of 1560 nm pump light is 1.2 W, the maximum power of SHG is 653 mW, the optical-optical conversion efficiency is 54.4%, and the normalized conversion efficiency is 20.2%?W-1?cm-2.
Nov. 25, 2023Vol. 50 Issue 22 2208001 (2023)
Jianqiu Cao, Aimin Liu, Maoni Chen, Yuan Tian, Zhihe Huang, Zilun Chen, Zhiyong Pan, Zefeng Wang, Xiaojun Xu, and Jinbao Chen
Nov. 25, 2023Vol. 50 Issue 22 2216001 (2023)
Jie Hu, Nan Chen, Wencai Xu, Minjie Chang, Boyuan Xu, Zhanbin Wang, and Qixiang Guo
ObjectiveLane detection plays an important role in automatic driving. It is the premise of lane keeping, lane departure warning and high-level automatic driving. Lidar has become a new direction in this field because it can generate more spatial three-dimensional (3D) information and is less affected by bad lighting, shading and other conditions. Currently, lane detection is mainly based on deep learning. Compared with traditional methods, it has higher detection accuracy and better robustness. The key of 3D lane detection with lidar based on deep learning is how to extract and utilize the feature information of lane point cloud completely and efficiently, otherwise it will not be able to cope with various lighting conditions and challenging scenes, which will have a great impact on the realization of automatic driving function. Therefore, how to fully extract and utilize the feature information of point cloud is the key to improve the accuracy of lane detection.MethodsThe proposed lidar lane detection network, LLDN-AGDP, consists of three parts, i.e., bird’s eye view (BEV) encoder network, backbone network, and detection head. In the BEV encoder part, the original 3D point cloud is projected into a two-dimensional (2D) pseudo-image by a point projector, and the feature is extracted by ResNet34 with global feature pyramid network (GFPN) (Fig.2). By fusing multi-level features of different scales, a feature map with globally relevant multi-level semantic information is constructed. In the backbone network part, firstly, through the efficiency mobile convolution (E-MBCONV) module (Fig.4), the local information between the window pixels is exchanged to generate better downsampling features and enhance the network representation ability. Then, the feature map is input into the dual-pathway module and the fusion module (Fig.5), and the low-level high-resolution texture features are compressed into high-level abstract semantic features, thus reducing the computational complexity. When learning finer low-level texture details, the compressed high-level abstract semantic features can be used as prior information, thus reducing the difficulty of global feature extraction. Moreover, the adaptive multi-order gating (AMOG) module (Fig.6) is embedded in the dual-pathway module and the fusion module, and the multi-order spatial interaction is carried out by using the rich context information between the cross-level feature maps, so that the network can adaptively extract lane lines. Finally, the lane lines are classified and located by the detection head.Results and DiscussionThe proposed LLDN-AGDP network is tested and evaluated on the K-Lane test set (Tables 1 and 2). Compared with the comparison networks, the average confidence F1 score and average classification F1 score of LLDN-AGDP are 84.7% and 83.6%, respectively, and the performance of LLDN-AGDP is greatly ahead of the lidar lane detection network using convolutional neural network for the backbone. Meanwhile, LLDN-AGDP outperforms LLDN-GFC, RLLDN-LC and other lidar lane detection algorithms with advanced global feature extraction network in all kinds of roads and scenes. Under bad lighting and severe occlusion conditions, the average confidence F1 score is increased by 2.7 and 3.5 percentage points, respectively, and the speed is at the same level as that of the benchmark network LLDN-GFC. Through the visualization of attention scores, the robustness of each model under occlusion conditions is compared and analyzed (Fig.10). The comparison between LLDN-AGDP and other network attention visualization shows that LLDN-AGDP can pay more attention to the areas with lane characteristics and show stronger interest in the lane lines in the blocked areas. Then, the effectiveness of the proposed innovation module is further analyzed (Table 3). The results show that after adding GFPN structure to the network, it can effectively fuse the features of shallow strong position information with the features of deep strong semantic information with global correlation, which brings stronger representation ability to the network. After the introduction of the dual-pathway structure, the network can make full use of the differences between different levels of features to further dig deep-seated global information. After the E-MBCONV module is added, it is beneficial to alleviate the attention limitation of local windows in the dual-pathway structure and realize the interaction of information in the windows. After adding the AMOG module, the feature capture ability of the network is stronger by using multi-order spatial interaction of context information.ConclusionsA 3D lane detection algorithm LLDN-AGDP for lidar based on adaptive multi-order gating and dual pathways is proposed. GFPN structure is proposed in BEV encoder to enable the network to effectively fuse texture features and semantic features of different levels, and pay attention to the global information of lane lines at the early stage of the network. In the part of backbone, a dual-pathway global feature extraction network and AMOG module are proposed, which reduce the computational complexity and the difficulty of deep global feature extraction through the interactive and complementary information flow structure of the two pathways. The AMOG module can make use of rich context information and adaptively aggregate the more representative features of lane lines to improve the detection accuracy of lane lines. Moreover, the E-MBCONV module, which can effectively exchange the local information among the pixels in the window, is introduced. The test results on K-Lane test set show that the average F1 score of the proposed algorithm can reach 84.7% under different road conditions and scenes, which is 2.6 percentage points higher than that of state-of-the-art model, and the F1 scores under bad lighting and severe shading conditions are increased by 2.7 and 3.5 percentage points, respectively. Finally, LLDN-AGDP algorithm is deployed on a real vehicle to verify its engineering application value.
Nov. 25, 2023Vol. 50 Issue 22 2210001 (2023)
Huage Hei, Xiaoyan Li, Lufang Li, Ping Cai, Rongjian Xie, and Fansheng Chen
ObjectiveThe complex space camera in geostationary orbit experiences significant changes in external thermal flux, leading to large temperature variations within the camera. The thermal stability and uniformity of optical components directly affect the imaging quality, thus requiring a large amount of high-precision active thermal control to provide the optimal operating temperature conditions for the camera. Geostationary satellites have multiple functions and limited resources, so the design of the active thermal control system for large space cameras must satisfy high-precision temperature control requirements while also being integrated to meet constraints on weight and power consumption. However, the traditional architecture using central processing unit (CPU) and digital signal processor (DSP) as control units is not well-suited for high integration design requirements, and the high thermal control power requires power management to meet the energy requirements of the entire satellite.MethodsThis article analyzes the characteristics, difficulties, and index requirements of thermal design for large geosynchronous orbit cameras, and proposes an integrated electronic active thermal control scheme with field programmable gate array (FPGA) as the core control unit. By utilizing the high-speed parallel processing capability and rich interface resources of FPGA, the scheme achieves high integration and high precision active thermal control for complex space cameras. To meet the requirements of large dynamic range temperature measurement, the measurement error is quantitatively analyzed, and a polynomial correction method based on least squares is proposed to correct the temperature measurement error within a large dynamic range. To address the problem of multiple heating circuits and high temperature control accuracy, a differentiated temperature control strategy is designed, which combines high-speed open-loop temperature control and fuzzy incremental proportion-integration-differentiation (PID) temperature control. This enables the 108 main heating circuits of the camera and the blackbody temperature control to work collaboratively. A comprehensive reliability strategy is also developed to handle possible exceptional situations. To address the problem of high heating power, a thermal control power off-peak strategy is designed. The heating plates are controlled in a time-sharing manner, and the thermal control power is dynamically and continuously monitored to limit it within the set range while ensuring the temperature control accuracy of the key components such as the camera’s motion mechanism, optical system, and compressor.Results and DiscussionsThe thermal control precision, control strategy, and power management function of the active thermal control system for a large space camera in a geosynchronous orbit were tested through ground laboratory experiments and verified in orbit with temperature field changes and temperature control conditions. The ground precision resistance was measured, and the temperature accuracy was found to be -0.186?0.363 K within a temperature range of -120?100 °C (Fig.5), which is better than the required accuracy of ±0.5 K. The in-orbit temperature field and temperature gradient changes (Table 5 and Fig.6) within a year meet the component’s working temperature and temperature gradient requirements, verifying the rationality and correctness of the active thermal control system design. The control precision of the camera during a 7-h heating period in one orbit was measured, and the temperature accuracy was found to be better than ±1 K, with a standard deviation of less than 0.5 (Table 6 and Fig.7). The obtained accuracy is better than the required accuracy of ±1 K. The power management function effectively limits the camera’s thermal control power consumption in the set range (Fig.8).ConclusionsAn active thermal control system for a large space camera in geostationary orbit is designed, with the camera instrument management unit FPGA as the core control unit. To address the large dynamic range of temperature measurement, a polynomial correction method based on least squares is proposed to correct temperature measurement errors in a wide dynamic range. To address the issue of high heating circuit count and precision control requirements, a differentiated temperature control strategy is designed that combines high-speed open-loop temperature control and PID temperature control. This strategy enables the 108 camera body heating circuits and the blackbody temperature control to work together. A comprehensive reliability strategy is designed for possible abnormal situations. To address the problem of high heating power, a thermal control power off-peak strategy is designed to limit the heating power in a set range while ensuring the temperature control accuracy of critical components such as the camera’s motion mechanism, optical system, and compressor. Ground-based tests show that the temperature measurement accuracy in the range of -120?100 ℃ is between -0.186?0.363 K, which is better than the requirement of ±0.5 K. In-orbit temperature field changes have validated the rationality and correctness of the active thermal control system, with a main body temperature control accuracy of better than ±1 K, and the power off-peak function effectively limits the camera power consumption in the set range. The space camera has been operated in orbit for six years, and the in-orbit active thermal control system has been working stably, meeting the needs of long-term, high-performance operation of large cameras in orbit.
Nov. 25, 2023Vol. 50 Issue 22 2210002 (2023)
Yuhan Wu, Pei Wang, Yaxin Li, Zhongnan Liu, Hanlong Li, and Jing Ren
ObjectiveTree point clouds can be used to estimate tree structure information in a nondestructive manner, which is very useful for studying forest ecosystems. Modeling and analysis of tree structures are critical in the investigation of tree topologies and biomass. One popular tree modeling method is a priori hypothesis modeling, which uses tree branches as cylinders and point clouds as input to model the branches by the topological structure of the tree skeleton. Tree quantitative structure modeling (TreeQSM) is an a priori hypothesis modeling method that enhances the regularity of tree models to rapidly obtain tree structures and is currently a mainstream tree modeling method mostly used for tree model reconstruction, biomass estimation, and other aspects. This study analyzed the accuracy estimations of tree height, diameter at breast height (DBH), and volume using TreeQSM based on multi-precision and multi-site scans of two artificial model trees and five real apricot trees.MethodsTo achieve a more effective evaluation of the TreeQSM method, experiments were conducted using both artificial model and real apricot trees. The model trees were constructed from smooth logs without bark or from rough logs with original bark. The real trees were in the leaf-off stage. The DBH, height, branch length, and diameter of each tree were manually measured, and the tree volume was calculated. A RIEGL VZ-400 scanner was used to collect multiscan tree point clouds. Single- and multi-scan tree point clouds with different scanning parameters were used to construct tree structure models using the TreeQSM algorithm. The tree models were then used to evaluate tree parameters such as tree height, DBH, and volume. The estimated and actual values were compared, and the absolute and relative errors were calculated and analyzed.Results and DiscussionsThe estimation accuracies of the tree heights and DBHs of smooth trees reach 98.51% and 100%, with average accuracies of 96.19% and 98.06%, respectively, whereas those of bark trees reach 100%, with average accuracies of 98.67% and 92.90%, respectively. Overall, the TreeQSM method is shown to be relatively accurate in estimation. In terms of volume estimation, the estimation accuracy of the smooth, bark, and apricot trees reach 99.88%, 96.86%, and 82.88%, respectively, and the average accuracies are 94.37%, 89.62%, and 71.32%, respectively. Volume estimation is underestimated, but its accuracy can be improved by fusing multi-station data. First, results show that the configuration and selection of the scanning angular resolution and number of scans have distinct effects on the modeling accuracy of the TreeQSM method. The selection of appropriate parameter configurations when using the TreeQSM method enables accurate estimation of tree height, DBH, and other indicators. Second, more multiview scans with excessive overlap may not improve the accuracy of estimation results and may even cause noise superposition, resulting in reduced estimation accuracy. Third, the TreeQSM algorithm has a certain degree of randomness in classifying and retrieving data, and multiple processing results for the same data are not unique. Averaging multiple results can reduce the error of single estimation.ConclusionsWe use seven artificial and real trees to evaluate and analyze the performance of the TreeQSM method. Using TreeQSM, we analyze a relatively suitable scanning angular resolution and number of scans to estimate tree height, DBH, and volume. Results show that this method can obtain a better tree model by using appropriate scan parameters such as angular resolution and number of scans. Although the TreeQSM method performs well in estimating tree height and DBH, the method should be improved to estimate more accurately the complex topological structures of tree branches and trunks. This study demonstrates that the TreeQSM method still has significant biases in terms of modeling and volume estimation for complex branch structures. In future research, we will continue to study related topics such as tree trunk recognition errors and underestimated branch diameters in volume estimation.
Nov. 25, 2023Vol. 50 Issue 22 2210003 (2023)
Jinmei Wang, Jianshu Lu, Peichao Zheng, Shaojian Liu, Gang Li, and Guanghui Chen
ObjectiveSinter is made from a variety of iron-containing raw materials and is the main raw material for blast-furnace ironmaking in China. Iron-containing raw materials account for nearly 70% of the blast-furnace ironmaking cost, sinter for more than 70% (mass fraction) of the blast-furnace ironmaking materials, and the sintering process for 6%?10% of the total energy consumption of iron and steel enterprises. Therefore, sinter production has a significant impact on blast-furnace ironmaking from the perspectives of cost, burden proportion, and energy savings. Alkalinity is an important parameter of sinter, which is closely related to the quality, output, and energy consumption of blast-furnace smelting. Conventional sinter alkalinity analysis methods have some limitations; therefore, it is necessary to find novel technical methods to measure sinter alkalinity. Laser-induced breakdown spectroscopy (LIBS) is used in many fields, especially in raw material screening and product analysis in the metallurgical industry, owing to its advantages of real-time, rapid, and in-situ detection, simultaneous multi-element analysis without complex sample pretreatment,and remote detection. LIBS is known as the "future chemical analysis superstar" and has attracted the attention of numerous researchers recently.MethodsTen sinter samples with different alkalinity values are obtained by spiking SiO2 and CaO standard samples. The experiment is conducted under atmospheric conditions. Continuous spectrum acquisition is performed at 120 different positions on the surface of each sinter sample. To obtain a better signal-to-background ratio (RSD), each spectrum is averaged from 10 consecutive pulsed laser ablation signals, and 12 spectra are obtained for each sample. Six sinter samples are used to establish the calibration model for alkalinity, and the remaining four are used as error analysis samples. The spectral lines of Fe, Si, and Ca with low interference and good stability are selected as reference spectral lines for the experimental parameter study. The effects of pressure, pulse laser energy, and spectrum acquisition delay time on the spectrum signal are studied, and the best experimental parameters are selected. Employing the optimized experimental parameters, the spectral signal stability of the sinter samples is tested. Si and Ca spectral lines with good signal strength and stability are selected as the spectral lines for quantitative analysis of alkalinity. The Fe spectral line, which has a similar spectral line energy level to those of Si and Ca, is selected as the internal standard spectral line. The ratio of the internal standard values of the spectral intensities of Ca, Si, and their corresponding Fe is calculated and used to establish the calibration model of the alkalinity value.Results and DiscussionsTo verify the stability of LIBS-collected spectral signals, 4 spectral lines are selected for each element, totaling 12 reference spectral lines, and the RSD of their spectral intensities is calculated. The results indicate that the RSDs of the four reference spectral lines of Fe, Si, and Ca are below 6% and mostly distributed around 4% (Fig. 6). The RSD of Fe Ⅰ 438.354 nm is 2.5%?1.23% [Fig. 6(a)], and the spectral stabilities of Si and Ca are approximately 4.5% [Fig. 6(b)] and 3% [Fig. 6(c)], respectively. After optimizing the experimental conditions, the fluctuation of the sinter LIBS spectral signal is small, which is conducive to the quantitative analysis of LIBS technology. Fe Ⅱ 248.266 nm and Fe Ⅰ 438.354 nm are selected as the internal standard spectral lines of Si Ⅰ 288.158 nm and Ca Ⅰ 422.673 nm, respectively. The calibration model for alkalinity is determined based on the ratio of their internal standard ratios, and the determination coefficient (R2) approaches 0.951 (Fig. 8). Using the same experimental method to conduct quantitative analysis on the remaining four samples, the deviation between the predicted value and the actual alkalinity value is small, and the relative error of the prediction result is lower than 1.14% (Table 3). The influence of the measurement error caused by the matrix effect and fluctuation of experimental parameters can be reduced by analyzing the sinter alkalinity via the internal standard method to achieve accurate measurement of the sinter alkalinity.ConclusionsWhen utilizing LIBS to detect and analyze a sample, the spectral signal fluctuates significantly, owing to the influence of the matrix effect, noise signal, and experimental parameters, which further makes the LIBS measurement result deviate substantially from the actual. To reduce the fluctuation of the spectral signal and ensure the accuracy of alkalinity measurement, first the experimental conditions are optimized, the stability of spectral signal is tested, appropriate analytical spectral lines for internal standard processing are selected, and then a quantitative analysis of alkalinity is conducted. The results demonstrate that after optimizing the sample preparation conditions and experimental parameters, the LIBS spectral signal of the sinter sample fluctuates less and is maintained at approximately 4%, which is conducive to the quantitative analysis of alkalinity. Compared with the non-internal standard method, the R2 of the calibration model treated by the internal standard method is increased from 0.468 to 0.951, and the maximum relative error is 1.14%, significantly improving the correlation between the spectral intensity ratios of Ca and Si and alkalinity. This results in the accurate measurement of sinter alkalinity, which has certain reference significance for LIBS detection and analysis of sinter alkalinity.
Nov. 25, 2023Vol. 50 Issue 22 2211001 (2023)
Yuechun Hou, Chen Dai, and Liyan Zhang
ObjectiveNd∶phosphate laser glass has been studied as a gain medium in high-power laser systems at the National Ignition Facility (USA), Laser Mégajoule (France), and SG-Ⅱ and SG-Ⅲ facilities (China). To meet the growing demand for higher gain in high-power laser systems, the performance of Nd∶glass must be improved to a new level (spectroscopic, thermal, chemical, and mechanical properties). The responses of many properties, as well as the network structure, to changes in glass composition are often highly nonlinear. Traditional empirical design methods can no longer satisfy the requirements of new developments in a timely manner. The objective of this study is to establish an accurate glass modeling system that can be used as a platform for the designs and property predictions of Nd∶phosphate laser glass; the modeling system is called glass structure gene modeling (GSgM) or statistical composition-structure-property (C-S-P) modeling.MethodsUsing information of the glass network structure as a “bridge”, C-S-P methodology transforms the need of solving a complex or unknown nonlinear relationship of C-P to solving two linear relationships of C-S and S-P, and the structure component (S) bridges the two linear parts into one. Separate linear C-S and S-P models were established using the Cornell first-order linear mixture formula. In this study, the glass design was based on 60P2O5-24K2O-9MgO-5Al2O3-2R2O3 (R=Y, La, and Sb) with 1% (mole fraction) Nd2O3 by introducing extra Li2O or Na2O, targeting the glass property responses to Li2O and Na2O, covering mole fraction of 2%, 4%, 6%, and 8%. The series of Li2O and Na2O samples were called as PL1?4 and PN1?4, respectively (Table 1). This study focused on the effects of Li2O and Na2O on glass spectroscopic properties (Table 2), including emission cross section (σemi), effective linewidth (Δλeff), fluorescence lifetime (τf), and Judd-Ofelt parameters (Ω2, Ω4, and Ω6). Structural information of the glass network was derived from Fourier transform infrared (FTIR) spectroscopic analysis (Fig.2). Each FTIR spectrum was decomposed into 15 Gaussian bands according to the IR network structural units of the phosphate glass using commercial software from Thermo Scientific (GRAMS Suite) (Table 3). The structural information of the glass, represented by the IR band areas (Ai), composition, and properties, was used to build the S-P and C-S models. Using the commercial software JMP, the glass structural units that significantly affected a given glass property were selected using a stepwise statistical screening method. The S-P model was used independently to simulate glass properties, whereas the C-S model was used to predict the structural responses of the glass network to compositional changes. With the establishment of the modeling database, the glass properties were estimated through the C→S→P route and the design glass composition through the P→S→C route. Model validation was also conducted by comparing the model-predicted properties with the measured properties.Results and DiscussionsFigure 4 shows the original S-P modeling results for the glass spectroscopic properties. Compared with the S-P(Δλeff) model with R2=0.98 and Radj2=0.97, the models for σemi, τf, Ω2, Ω4, and Ω6 exhibit relatively lower accuracies (i.e., higher P-values). It implies that, except for Δλeff, which is derived directly from the fluorescence spectra, Ω2, Ω4, Ω6, and σemi have relatively larger errors from computations. τf also exhibits larger measurement error. One data point of each property apparently deviates from the “95% confidence zone” of each corresponding model, and is subsequently excluded from the model (Fig. 5). Consequently, remarkable improvement is achieved by S-P models for Ω2, Ω4, Ω6, and σemi. Using the modeling parameters listed in Table 5, a structural prediction formula for each property is obtained. It is worth noting that, similar to C-P models, the S-P models can also be used directly for property simulation using glass structural information (such as the FTIR integrated area Ai in this study). The C-S models for Li2O and Na2O are built in the same manner (Fig. 6). The combined model of S-P and C-S models completes the C-S-P platform. By reversing the C→S→P direction, that is, P→S→C, a new glass can be designed. The final C-S-P platform is constructed as shown in Fig.7. A mixed-alkali glass PLN (mole fraction of Li2O is 2.1% and mole fraction of Na2O is 3.2%) is used to validate the C-S-P model. Results show that the measured values (numerators) are in good agreement with the predicted values (denominators) for all the properties: σemi=4.13/4.14 pm2, τf=331/333 μs, Δλeff=24.49/24.5 nm, Ω2=4.62/4.62 pm2, Ω4=4.84/4.83 pm2, and Ω6=5.73/5.72 pm2; the relative errors are within 0.6% (Table 6).ConclusionsThe development of the GSgM platform (C-S-P) enables accurate prediction of a combined property set for the first time, which is often difficult to achieve using the conventional approach, C-P. The spectroscopic properties (Δλeff, σemi, τf, Ω2, Ω4, and Ω6) of an Nd∶phosphate glass series are simulated with satisfactory accuracies. GSgM offers a new dimension in designing the performance of glass through the manipulation of genes of the glass network and simultaneously avoids solving unknown nonlinear responses of the glass properties to composition changes. Finally, the model validation process is successfully demonstrated by C→S→P modeling. Therefore, GSgM is a powerful tool for glass design that moves away from the conventional C-P approach to offer insight into how the glass network structure or structural units (genes) are critical for tailoring the required glass performance.
Nov. 25, 2023Vol. 50 Issue 22 2211002 (2023)
Changming Sun, Qiangshuang Li, Jingyi Wang, and Haiwei Du
ObjectiveTerahertz wave refers to the electromagnetic wave whose frequency is in the range of 0.1?10 THz (1 THz=1012 Hz) and the wavelength range is 30?3000 μm. The terahertz band is located in the transition region between the electronic and optical bands in the entire electromagnetic spectrum, and is also known as the "terahertz gap" because the research on the terahertz band develops more slowly than those on the electronic and optical bands. Because of its special frequency range, terahertz wave has the characteristics of low photon energy, wide band and high penetration. These excellent characteristics make the terahertz wave have huge applications in the fields of nondestructive testing, communication, spectroscopy, and biomedical imaging. High power broadband terahertz radiation source is the important basis of the practical applications of terahertz wave, so it is of great practical significance to improve the power and bandwidth of terahertz radiation source. At present, photoconductor antenna based on the GaAs semiconductor has been a mature terahertz radiation source. Moreover, some materials pumped by ultrashort laser pulses also can generate broadband terahertz radiation from their surface without the biased electric field. The heterojunction of the semiconductor also can generate broadband terahertz radiation from the surface, such as GaAs p-i-n heterojunction structure. In this paper, the mechanism of terahertz generation from the GaAs p-i-n structure pumped by ultrashort laser pulses is studied. The influence of the interference effect in this process on the terahertz yield and its optimization are discussed based on numerical calculations.MethodsBased on the physical model of terahertz radiation generated by the ultrashort laser pumped GaAs p-i-n heterojunction structure, the influence of the interference effect on the terahertz generation is investigated with numerical calculations, and the mechanism of the interference effect is revealed. The influence of the interference effect on terahertz radiation with different thicknesses of i-layer is simulated, and then the correlation between the i-layer thickness and the interference effect is revealed. It is found that this effect is caused by the incoherent oscillations of the plasma which has an uneven distribution of carriers in the i-layer of the GaAs p-i-n structure. The total photocurrent decreases due to the different phase and direction of the photocurrent oscillations in different regions of the i-layer, thus decreasing the intensity of terahertz radiation. By reducing the thickness of i-layer to a certain range, the carrier distribution in the i-layer becomes homogeneous, thus optimizing the influence of interference effect on terahertz generation.Results and DiscussionsThrough numerical calculations, the transient photocurrents generated by the GaAs p-i-n structures with thickness from 0.4 to 4 μm respectively with and without the interference effect are obtained (Fig. 2). The transient photocurrent is a sub-picosecond oscillating current, and its corresponding electromagnetic radiation spectrum is located in the terahertz band. The time-domain waveforms of the terahertz electric field generated from different conditions are calculated, and their frequency spectra are obtained through Fourier transform (Fig. 3). By the numerical experiments, the parameters of terahertz pulse with the thickness of i-layer from 0.4 to 4 μm are given in detail, and an influence factor of the interference effect is defined by the ratio of the terahertz pulse energy loss caused by the interference effect to the terahertz pulse energy without the interference effect (Figs. 4 and 5). By decreasing the thickness of i-layer with the interference effect, the variation trend of the full-width at half-maximum (FWHM) of terahertz pulse is presented (Fig. 6). When the thickness of i-layer decreases in the range of 0.4?4 μm, the influence of interference effect decreases gradually due to the more inhomogeneous distribution of carriers. The FWHM decreases slightly with the decrease of interference effect, and the time-domain peak value and the pulse energy of terahertz pulse increase significantly. Therefore, the influence of interference effect can be optimized by reducing the thickness of i-layer, consequently improving the terahertz intensity.ConclusionsIn summary, this paper reveals the physical mechanism of the interference effect causing the significant reduction of the terahertz radiation of GaAs p-i-n heterojunction structure pumped by ultrashort laser pulses. By comparing the terahertz pulse parameters with and without the interference effect, it is found that the terahertz intensity can be improved by reducing the influence of the interference effect. By comparing the influence of interference effect under different thicknesses of i-layer, the correlation between the thickness of i-layer and the interference effect is revealed. The influence of interference effect can be optimized by reducing the thickness of i-layer, which will increase the terahertz intensity. This work may provide a new way to develop high-power broadband terahertz radiation source with GaAs p-i-n heterojunction structure, and provide a good theoretical reference for the related experiments.
Nov. 25, 2023Vol. 50 Issue 22 2214001 (2023)
Wenni Zhang, Hongchao Cao, Fanyu Kong, Yibing Zhang, Rui Wang, Yunxia Jin, and Jianda Shao
ObjectiveDiode-pumped alkali lasers are a new type of gas lasers that utilize the high energy levels of alkali metal atoms to achieve particle number inversion. However, conventional fused-silica laser windows are easily subjected to corrosion in the alkali metal vapor environment. Therefore, in this study, we select sapphire as a window material, considering its high hardness and thermal conductivity, low expansion coefficient, and high temperature and erosion resistance. Owing to its large refractive index, the sapphire surface presents relevant anti-reflection properties, including high air and interface reflectivity. Anti-reflection surfaces are usually obtained by preparing optical films or microstructures. Anti-reflection films often require coating materials with specific refractive indices that are difficult to source. Moreover, they are susceptible to gaseous corrosion. However, their fabrication technology is relatively mature. Conversely, the production of anti-reflection microstructures requires complex processing. However, using the same substrate material to build the microstructure results in high chemical stability, mechanical properties, and resistance to laser damage. In this study, we implement a diode-pumped alkali metal laser with a 795 nm center wavelength and a working environment temperature of 200 ℃ by combining two different anti-reflection technologies to obtain a double-sided anti-reflection sapphire window. This is characterized by a microstructure on the side of the vapor chamber and a coating film on the side exposed to air, which enhances the temperature and corrosion resistance of the resulting laser window.MethodsBased on vector diffraction theory, the effects of depth, bottom angle, period, and duty cycle on the transmittance of a one-dimensional trapezoidal structure are analyzed using COMSOL software to obtain the process tolerance of the microstructure. We use laser interference exposure to prepare a photoresist mask on a sapphire surface, and then we transfer it using reactive ion beam etching to form microstructures. The ion-beam sputtering is used to prepare an anti-reflection film on the sapphire surface. To ensure that the microstructure satisfies the requirements of the application environment, we test the temperature increase in the sample under the action of a high-power laser. Moreover, we test the changes in the beam quality of the probe light passing through the sample at different temperatures.Results and DiscussionsOur simulation results show that the transmittance can reach above 99.90% with a period of 400 nm, bottom angle of 78°±2°, depth of (190±5)nm, duty cycle of 0.25±0.05, and large margin of error (Figs. 2?6). Morphology test results show that the duty cycle of the experimentally prepared microstructure is in the range of 0.22?0.31, consistently with the designed parameters, whereas the height is in the range of 155?175 nm, thus failing to reach the designed value (Table 1). Transmittance test results show that the transmittances of the single-sided anti-reflection microstructure and film reach 99.23% and 99.91%, respectively. The transmittances of the double-sided anti-reflection sapphire window are 98.01% and 98.90% for the one-sided microstructure and anti-reflection film, respectively. The transmittances of these two samples increase by 12.13% and 13.02% compared to that of a bare sapphire substrate (Fig. 10). The temperature rise test results show that when the laser power is increased from 35 W to 99.6 W, the temperatures of substrates 1 and 2 increase by 4.3 ℃ and 5.9 ℃, respectively, whereas the temperature of the double-sided anti-reflection sample increases only by 3.8 ℃. Near the target wavelength, the temperature increase in the anti-reflection window is smaller than that in the bare substrate, and the temperature increase in the double-sided anti-reflection sample can be appropriately reduced (Fig. 12). The beam quality test results show that the temperature has a greater effect on the beam quality factor in the longitudinal direction of the sapphire samples compared to that in the transverse direction. Moreover, the sapphire batch significantly influences the associated beam quality factor (Fig. 14). When the temperature of the window is kept at 200 ℃ under the action of a high-power laser, the beam quality factor of the samples with the double-sided anti-reflection microstructure varies less than 0.05 and 0.06 in the transverse and longitudinal directions, respectively. Therefore, the anti-reflection window has a limited effect on the beam quality of the incident light (Table 2).ConclusionsBased on our theoretical simulation, in this study, we develop anti-reflection microstructures on the surface of a sapphire substrate by interference exposure and reactive ion beam etching, which can reach a single-sided transmittance of 99.23% at a 795 nm light wavelength. Using this technique, we prepare two sapphire windows: one characterized by a double-sided microstructure, and one presenting a microstructure on one side and a coating film on the opposite side. At a wavelength of 795 nm, the transmittance of these samples improves by 12.13% and 13.02%, respectively, compared with that of the bare sapphire substrate. The temperature rise test under high-power laser irradiation shows that when the laser power increases from 35.0 W to 99.6 W, the temperature of the bare substrate rises by 5.9 ℃, whereas that of both samples obtained using the double-sided antireflective treatment increases only by 3.8 ℃. These results indicate that our treatment can effectively reduce thermal effects by exploiting the higher transmittance rates of the double-sided samples. Moreover, beam quality test results indicate that when the microstructure window temperature is kept below 200 ℃ under high-power laser irradiation, the variation of the beam quality factor for double-sided anti-reflection samples remains below 0.05 and 0.06 along the transverse and longitudinal directions, respectively, indicating that the anti-reflection window has a negligible effect on the beam quality of the incident light. In this study, we successfully fabricate antireflective windows on a sapphire substrate characterized by either a double-sided antireflective microstructure or an antireflective microstructure and antireflective film on the opposite sides, achieving in both cases high temperature and corrosion resistance as well as high transmission performance. Our antireflective fabrication process solves the traditional performance issues of fused-quartz laser windows, which are prone to corrosion in alkali metal vapor environments, and provides a reference framework for fabricating antireflective windows that can be used effectively under harsh conditions.
Nov. 25, 2023Vol. 50 Issue 22 2203101 (2023)
© Copyright 2018-2021 | Chinese Laser Press.
All Rights Reserved 沪ICP备15018463号-20