


Please enter the answer below before you can view the full text.

Jiahui Liu, Yanqing Yang, Rui Ma, and Kebin Shi
Significance Various biological imaging modalities have become essential tools in life science research, preclinical research, and clinical practice. The emergence of enormous in vivo imaging technologies such as computed tomography (CT), magnetic resonance imaging (MRI), positron emission tomography (PET), and single-beam emission computed tomography (SPECT) plays a significant role in disease diagnosis, progression monitoring, and prognosis, bringing the possibility of molecular imaging into medical observation.Although they have unlimited penetration depth, the above techniques suffer from disadvantages such as limited spatial resolution, long operation times, and low sensitivity. Additionally, the equipment is often very expensive and induces radiation. On the other hand, as a radiation-free technique, fluorescence imaging has been widely used for in vivo imaging due to its high spatiotemporal resolution and labeling specificity. However, the performance of FL imaging is deteriorated by the strong absorption, scattering, and autofluorescence of biological tissues in the visible (400?700 nm) or NIR-I (700?900 nm) regions and shows unsatisfactory penetration depth, spatial resolution and signal-to-noise ratio (SNR), limiting its further application in in vivo imaging.FL in the second near-infrared region (NIR-II, 1000?1700 nm), on the contrary, shows appealing advantages due to its deeper penetration depth (>10 mm), improved spatial resolution (about 3 μm), and higher signal-to-noise ratio (about 20), unveiling great clinical translation. Since single-walled carbon nanotubes (SWNTs) were first applied to NIR-II fluorescence imaging in small animals, the development of NIR-II fluorescent probes with high molar absorbance coefficients, high fluorescence quantum yields, good stability, and good biocompatibility has been a research hotspot. In the past decade, NIR-II fluorescent probes were primarily classified into two categories: organic and inorganic probes. The NIR-II inorganic fluorescent probes (e.g., single-walled carbon nanotubes, quantum dots, and rare earth doped conversion materials) have strong heavy metal toxicity, are typically poor in biocompatibility, and have difficulty completing physiological metabolism in vivo, limiting their potential applications in clinical practice. On the other side, organic NIR-II fluorescent probes are free of heavy metal ions and have clear structures as well as better biocompatibility, making them more suitable and promising for clinical translation. Some representative examples are D-A-D small molecules, cyanine dyes, and conjugated polymers. Hence, to guide the future development of this field more rationally, it is important and necessary to summarize the molecular structure design concepts and biomedical imaging applications of organic NIR-II fluorescent probes.ProgressIn this review, we systematically summarize the molecular structure design concepts and biomedical imaging applications of organic NIR-II fluorescent probes reported in the current literatures. The research progress of organic NIR-II fluorescent probes is classified into anatase dyes, D-A-D organic small molecules, and conjugated polymers.First, the molecular design strategies of cyanine dyes with NIR-II emission wavelengths are summarized in terms of red-shifting absorption/emission wavelength, improving fluorescence quantum yield, enhancing biocompatibility, and chemical stability, respectively. Up to now, the reasonable and result-oriented design strategies to achieve cyanine dyes with NIR-II emission wavelengths primarily include: 1) extending the effective conjugation system, 2) modifying the donor and acceptor units, and 3) constructing fluorophore J-polymer. The strategies to enhance the fluorescence brightness primarily include: 1) introducing spatial site resistance, 2) forming complexes with proteins, and 3) enhancing the rigidity of molecular structures. The effective strategies to improve biocompatibility primarily include: 1) encapsulating hydrophobic fluorescent molecules by nanoprecipitation using amphiphilic materials and 2) introducing hydrophilic groups on hydrophobic fluorescent molecules utilizing molecular engineering.Second, the development process of D-A-D small molecules in terms of donor/acceptor unit modulation and fluorescence quantum efficiency enhancement is also presented. In 2016, Dai's team reported for the first time that the water-soluble small molecule CH1055-PEG could be used for NIR-II fluorescence imaging. Since then, a series of small molecules with NIR-II emission have been designed by modulating the electron-giving/absorbing ability of donor/acceptor units. Moreover, strategies have been proposed to enhance fluorescence quantum efficiency, such as by introducing shielding units, suppressing TICT states, constructing hydrophobic nonpolar environments, and building fluorescent small molecules with AIE properties.Subsequently, we summarize the molecular design strategies of organic conjugated polymers with high brightness and further discuss their applications in bioimaging, primarily including tumor imaging, dynamic angiography, and photothermal therapy.Finally, the issues and challenges that need to be addressed to identify the clinical translation of NIR-II fluorescence imaging techniques are discussed.Conclusions and ProspectsNIR-II fluorescence imaging has been widely used in basic scientific research and preclinical practice. Organic NIR-II fluorescent probes are highly amenable to clinical translation due to their excellent biocompatibility, good synthetic reproducibility, and extremely high chemical modifiability. To date, a series of NIR-II fluorescent probes with excellent performance have been developed and applied for in vivo imaging with a high signal-to-noise ratio, deep-tissue penetrating ability, and high spatial and temporal resolution. However, most organic NIR-II fluorescent probes reported in the literatures are not yet well established and have limitations in clinical applications. To expand the biological applications of NIR-II fluorescent probes and to achieve true clinical translation, the following challenges must be overcome: 1) the development of liver/kidney metabolizable probes to address long-term probe safety; 2) the development of endogenous NIR-II fluorescent proteins for long-term biomonitoring; and 3) the development and optimization of NIR-II fluorescent imaging systems.
Nov. 10, 2023Vol. 50 Issue 21 2107101 (2023)
Weixing Li, Jing Lu, Ke Xiao, and Wei Ji
SignificanceEukaryotic cells have numerous cellular structures, including a variety of organelles and macromolecular complexes. These structures have specific physiological functions and work interactively to perform certain cellular activities. Therefore, studying these structures in their native state is essential to understand the real physiological processes in the cells. In situ investigation of cellular structures does not only provide morphology, distribution, and abundance information, but also reveals their interaction mechanisms, thereby providing new insights into the understanding of life.Cryo-electron tomography (cryo-ET) is currently the principal technique to resolve the in situ structures of biological specimens. By collecting tilted series of transmission electron images and performing image reconstruction, cryo-ET determines the 3D structures of bio-specimens with a nanometer-level resolution. A prerequisite for applying cryo-ET is to fix the sample under cryogenic conditions. High-pressure freezing and plunge freezing are well-established cryo-fixation methods that preserve biological specimens in their near-native state in vitreous ice. Benefiting from these techniques, cryo-ET has been widely applied to cells and tissues.One limitation to cryo-ET is its restricted imaging depth, which is typically a few hundred nanometers owing to the confined penetration capabilities of electrons. Therefore, reducing the thickness of the samples to that of lamellae of approximately 200 nm is necessary before applying cryo-ET. Focused ion beam (FIB) milling has been recently employed to prepare lamellae of bio-specimens for cryo-ET. Compared to traditional ultramicrotomy, FIB milling avoids artifacts such as distortions, crevasses, and compression when fabricating the lamella. However, conventional FIB milling does not allow site-specific milling, because in a dual-beam FIB/SEM system, FIB or SEM image only illustrates the surface morphology of the sample and cannot provide more information to recognize and localize the underlying interest targets. When milling cells with FIB, cutting at an arbitrary position can only hit abundant cellular structures such as Golgi apparatus or mitochondria but cannot be used to prepare lamellae containing specific targets. This drawback hinders the application of FIB in cryo-ET.The “blind” milling can be improved by correlative light and electron microscopy (CLEM). In CLEM, the targets of interest are fluorescently labelled and can be identified by fluorescence imaging. After registering the light and FIB images, fluorescence signal can be used to guide the FIB to mill at specific sites. Currently, various light imaging modalities have been adopted to navigate FIB fabrication, including widefield microscopy, confocal microscopy, and Airyscan. Moreover, two major working routines, that is, pipelined and integrated workflows, have been established to perform fluorescence-guided FIB milling. Therefore, it is important and necessary to summarize the existing techniques and discuss the advantages and limitations of different working routines to provide guidelines for researchers to choose the appropriate protocols.ProgressThis study reviews the essential techniques involved in fluorescence-guided cryo-FIB milling. First, plunge freezing is introduced. Plunge freezing is the most commonly used technique to vitrify cells. The key aspects to obtain good plunge-frozen specimens are discussed, including the choice of electron microscope grids and supporting films (Fig. 2), available commercial instruments (Fig. 3), and standard protocols.Second, as a popular method to prepare lamellae of vitrified cells, FIB milling is discussed in several aspects: the working principle is introduced; the relevant instrumentations are summarized, including dual-beam FIB/SEM system (Fig. 4), cryostage and cryotransfer systems (Fig. 5), and Autogrid and sample holder (Fig. 6); and the milling of frozen cells is outlined (Fig. 7).Third, the principle (Fig. 8) and workflow (Fig. 9) of fluorescence-guided FIB milling is introduced. Pipelined and integrated workflows are described, and relevant commercial instruments are overviewed (Figs. 10 and 11). The different workflows and various systems are compared (Table. 1). The most recent developments of integrated solutions are discussed in detail. Sun Fei's research group and Ji Wei's research group from the Institute of Biophysics, Chinese Academy of Sciences have developed novel integrated light, ion, and electron microscopies (Figs. 12 and 13), thereby providing new avenues for performing accurate and efficient FIB milling at specific sites under fluorescence guidance.Conclusions and ProspectsIn situ investigation of cellular structures using cryo-ET has recently become an interesting research topic. Fluorescence-guided FIB milling has been applied to mill vitrified biological samples at specific sites. The recent developments in integrated cryo-FLM-FIB/SEM systems and workflows provide efficient and accurate methods to fabricate cell lamellae containing desired targets. These innovations have the potential to serve as all-in-one solutions for site-specific cryo-lamella preparation for cryo-ET in the future.
Nov. 10, 2023Vol. 50 Issue 21 2107102 (2023)
Xuanye Zhang, and Jiang Zhu
SignificanceOptical coherence tomography (OCT) is a label-free optical imaging technique based on the principle of low-coherence interference, which has the advantages of high resolution and fast imaging speed. OCT can image tissue anatomy and microcirculation without physiological sections and exogenous contrast agents. However, the OCT penetration depth is limited to 2?3 mm owing to the optical scattering of biological tissue. Therefore, most OCT applications focus on ocular imaging and endoscopy. OCT has led to a better understanding of ocular structures and has provided efficient treatment of glaucoma, maculopathy, and other ocular diseases. Endoscopy is another important field of OCT application. Combining OCT imaging with an endoscopic micro-probe, endoscopic OCT can obtain three-dimensional morphological microstructures of in vivo internal organs with depth-resolved information and micron-scale resolution, which is advantageous in detecting small lesions under the surface of tissue. With an optical fiber and a miniaturized lens, an endoscopic OCT probe can be inserted into the body through the working channel of a conventional video endoscope. By overcoming the low resolution of ultrasound imaging and the shallow penetration depth of confocal imaging, endoscopic OCT has become an indispensable imaging tool in clinical diagnosis.ProgressFirst, we summarize the development of endoscopic OCT over recent years. Although ophthalmic OCT still predominates, the research and application of endoscopic OCT techniques are increasing (Fig.1). Three types of OCT systems are described: time-domain OCT, spectral-domain OCT, and swept-source OCT (Fig.2). In contrast to time-domain OCT systems with the mechanical scanning structure in the reference optical path, frequency-domain OCT systems, including spectral-domain OCT and swept-source OCT, record the interference signals as functions of wavelength. The depth information of the sample can be obtained by the Fourier transform of the interference signals at different wavelengths. Frequency-domain OCT improves imaging acquisition speed. Then, various probes are presented, such as the anterior and side-view imaging probes (Figs.2 and 3). An anterior imaging probe with the beam along the optical axis is suitable for guiding surgical procedures. A side-view imaging probe is easily minimalized and is capable of imaging tissue with small inner diameters, such as blood vessels.Second, the various techniques of endoscopic OCT are summarized, including ultrahigh-resolution OCT and dual-modality imaging. Imaging of porcine coronary arteries with ultrahigh-resolution OCT can detect lesions in the endothelial cell layer, providing a new option for the early diagnosis of coronary atherosclerosis (Fig.5). The alveolar structure in human lung tissue can be observed clearly using ultrahigh-resolution OCT imaging (Fig.6). Ultrahigh-resolution OCT may have more applications in clinical practices if the cost can be deduced. Multimodality imaging has become a popular research area in recent years, which can acquire multiple images simultaneously and overcome the limitations of OCT, providing precision clinical diagnosis. Dual-modality imaging combining OCT with fluorescence imaging compensates for the lack of molecular sensitivity in OCT and provides more detailed information about the tissue (Fig.7). Dual-modality imaging with OCT and ultrasound combines the advantages of the high resolution of OCT and the deep penetration of ultrasound imaging to acquire two types of structural information simultaneously (Fig.8).Third, we introduce commercialized endoscopic OCT and compare the performance. Many endoscopic OCT devices have emerged over recent years (Table 2). From the clinical applications of endoscopic OCT technology, we review the current advances in cardiology, respirology, gastroenterology, urology, and gynecology. In cardiology, OCT applications for atherosclerosis assessment (Fig.9) and postoperative evaluation of stent implantation procedures have been introduced (Fig.10). In respirology, OCT endoscopy technology has increasing applications in the early diagnosis of lung cancer, chronic bronchial inflammation, bronchial asthma (Fig.12), etc. In gastroenterology, OCT endoscopy can diagnose Barrett’s esophagus lesions early with the risk of esophageal adenocarcinoma (Fig.13). Although endoscopy imaging is challenging for intestinal tissue owing to the large size of the stomach and the long length of the small intestine, endoscopic OCT has promising applications in areas such as intestinal damage diagnosis (Fig. 14) and small intestine allografts (Fig.15). In addition, endoscopic OCT has been used for cancer screening of various tissues, such as the biliopancreatic duct, cervix, and ureter, providing an accurate diagnosis of neoplastic lesions (Fig.17). In gynecology, endoscopic OCT technology offers new ideas for diagnosing gynecological diseases and monitoring of vaginal health status (Fig. 18).Conclusions and ProspectsEndoscopic OCT technology has progressed from time-domain OCT to frequency-domain OCT in the past few decades and has become an essential diagnostic tool in addition to traditional endoscopic imaging methods. However, endoscopic OCT technology still requires continuous improvement, including the enhancement of imaging quality, the miniaturization of probes, the extension of imaging depth, the improvement of spatial resolution, reduction in manufacturing costs, and combination with other imaging modalities. With an improvement in performance, endoscopic OCT technology will provide a more significant imaging basis for precision medicine.
Nov. 10, 2023Vol. 50 Issue 21 2107103 (2023)
Xiaodong Sun, and Yujiao Shi
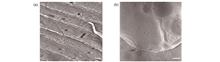
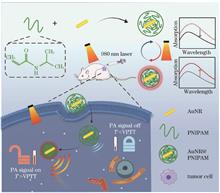
ObjectiveThe considerable potential of temperature-responsive nanomaterials as contrast agents has driven research and development in the field of photoacoustic imaging in recent years. However, the temperature-sensitive nanoprobes currently reported have response temperatures that exceed the tolerable range of humans, and their reversibility is low, which are two serious problems that hinder imaging and long-term monitoring in practical applications. Molecular photoacoustic imaging has emerged as a noninvasive imaging modality for cancer diagnosis, which couples superb optical absorption contrast and an excellent ultrasonic spatial resolution. However, research on molecular photoacoustic imaging has focused on optical wavelengths in the visible and near-infrared (NIR) part of the spectrum between 550 and 900 nm, with a relatively low sensitivity and limited imaging depth. Of note, the characteristic molecules of many major diseases—particularly in the early stage—exhibit no obvious photoacoustic contrast in the optical window of biological tissue (NIR-Ⅰ, 650?950 nm; NIR-Ⅱ, 950?1700 nm). Moreover, most of the current photoacoustic contrast agents are “always-on” probes, which can only provide invariable imaging contrast and struggle to eliminate the inherent background effect of biological tissues. In contrast, activable photoacoustic contrast agents can respond to a given cancer biomarker and emit signals. Therefore, there is an urgent need to develop a stimulus-responsive photoacoustic probe for the second NIR region. In this paper, a reversible temperature-responsive phase-change AuNR@PNIPAM nanoprobe is proposed that can dynamically modulate the temperature field through an external NIR optical switch to obtain contrast-enhanced photoacoustic images.MethodsWhen the temperature-sensitive AuNR@PNIPAM microgel is delivered to tumor tissue under 980 nm laser irradiation, the gold nanorod core absorbs NIR light energy, triggering a phase transition of the PNIPAM shell. As the temperature exceeds the volume phase transition temperature (VPTT) of PNIPAM, the PNIPAM hydrogel undergoes a sol-gel phase transition, which increases the refractive index around the gold nanorod, inducing a redshift of the localized surface plasmon resonance band and an increase in the absorption-peak intensity of the microgel. Therefore, these microgels exhibit enhanced and switchable NIR absorption in the physiological temperature range, allowing high-contrast imaging of tumors.Results and DiscussionsThe authors characterized the morphology and temperature response of the synthesized AuNR@PNIPAM microgel. It was observed that PNIPAM was successfully compounded onto AuNR, and when the temperature exceeded the VPTT of PNIPAM, the volume change of the PNIPAM hydrogel resulted in a change in the refractive index, enhancing the absorption in the second NIR region, as illustrated in Fig. 2. Furthermore, the microgel exhibited a high and stable photothermal conversion efficiency in in vitro and in vivo photothermal experiments, as shown in Fig. 4. The experimental results in Fig. 5 confirmed that the prepared AuNR@PNIPAM microgel could enhance the photoacoustic imaging contrast when an external NIR optical switch was used to trigger the temperature phase transition. Therefore, owing to their excellent photoacoustic imaging contrast ability, AuNR@PNIPAM microgels have considerable potential for early cancer diagnosis and hyperthermia detection.ConclusionsIn this study, the photoacoustic signal of AuNR@PNIPAM microgels was amplified near the physiological temperature, indicating their feasibility for high-contrast photoacoustic imaging of tumors. AuNR@PNIPAM microgels exhibited improved NIR-Ⅱ absorption under 980 nm laser irradiation, because of a redshift of the localized surface plasmon resonance band and an increase in the absorption-peak intensity. Furthermore, the prepared AuNR@PNIPAM microgels exhibited reversible temperature-responsive characteristics and an efficient and stable photothermal conversion effect; hence, they could modulate the temperature field through the NIR optical switch to realize the reversible switching of NIR-II absorption. Thus, these microgels could control the turning on/off of the photoacoustic signal to suppress the unwanted background signals. This work proposes a strategy for achieving high-contrast imaging of tumors by dynamically responding to temperature stimuli, providing guidance for the development of temperature-responsive smart photoacoustic probes for enhancing imaging contrast.
Nov. 10, 2023Vol. 50 Issue 21 2107104 (2023)
Lei Wang, Lin Li, Yongwen Zhao, Dinglong Ma, Ying Gu, and Pu Wang
SignificanceBiomedical ultrasound imaging has been widely used as an imaging technology based on ultrasound signals for viewing the internal structure of the body and finding the source of diseases. In recent decades, owing to the development of ultrasonic transducers, ultrasound imaging has made significant progress in obtaining important diagnostic information using rapid and noninvasive methods. Traditional transducers are excited by electricity and take advantage of the piezoelectric effect to achieve a transformation between electricity and ultrasound. However, considering the demanding requirements of application environments, the primary restriction is the limited bandwidth of traditional transducers.Laser-generated ultrasound, a novel technology based on photoacoustic effect, is excited by a laser instead of electricity. Ultrasound pulses are generated by the absorption of a short-pulse laser, thus leading to elastic thermal expansion caused by the transient temperature increase. In this process, the time-varying laser acts as the only excitation source. The upper limits of the energy and frequency of the ultrasound are restricted by the laser. Compared with piezoelectric transducers, the ultrasound generated by laser-generated ultrasound transducers has the characteristics of high frequency and large bandwidth, which are necessary for sensing and imaging.With the breakthrough of laser-generated ultrasound transducers in the structural simplification and excitation of large-bandwidth ultrasound, laser-generated ultrasound technology has been gradually applied in various fields where traditional piezoelectric ultrasound methods cannot be applied, essentially providing a novel idea for high-precision and high-resolution biomedical applications.ProgressThe amplitude of ultrasound produced by laser-generated ultrasound technology is related to various characteristics, such as laser energy, transducer absorbance, thermal expansion coefficient, and shape. Moderately high-energy laser, highly absorbing nano-scale light absorbers, and expanders with high thermal expansion coefficients positively affect the ultrasound amplitude generated by laser-generated ultrasound transducers. Meanwhile, the ultrasound frequency domain generated by photoconductive ultrasound technology is related to parameters such as the excitation light pulse width, transducer material, and transducer thickness (Figs. 2?4). For example, under test conditions in which the imaging depth is small but the imaging resolution is very high, an ultra-narrow pulse width laser with a nanoscale metal layer can be used as an optical ultrasound transducer (Table 1 and Fig. 2). If the test environment has high requirements for imaging depth and imaging speed but low requirements for imaging resolution, a common nanosecond transducer is suitable. If the test environment has high requirements for imaging depth and speed and low requirements for resolution imaging, a common nanosecond-pulsed laser with the carbon-based polymer material is suitable as a solution for ultrasound.Moreover, the less complicated structure of the laser-generated ultrasound transducer promises a large amplitude of the ultrasound at the focal point, with a self-focusing effect when using a concave transducer (Figs. 1 and 5). Furthermore, the ultrasound generated by a laser-generated ultrasound transducer has a high frequency and large bandwidth, thereby contributing to a smaller sound field at the focal point (Fig. 6).Conclusions and ProspectsThis study summarizes the mechanism of action, transducer system, performance characterization, and application areas of phototransduction ultrasound technology, as well as the applications of concave transducers in neural stimulation, ultrasonic cavitation, and ultrasound imaging, and describes the advantages and disadvantages of piezoelectric-based and photoacoustic effect-based transducers by comparing them with conventional ultrasound transducers. With the continuous development of theoretical systems of laser-generated ultrasound and precision processing technology, the advancement of laser-generated ultrasound technology has led to new opportunities for the development of biomedical ultrasound.
Nov. 10, 2023Vol. 50 Issue 21 2107105 (2023)
Yizhe Liu, Weisong Zhao, Yuzhen Liu, and Haoyu Li
ObjectiveCurrently, various super-resolution imaging technologies can surpass the Abbe diffraction limit, thereby improving imaging resolution to several tens of nanometers. This provides biologists with an effective tool for investigating biological structures and their functions on a novel scale. Among these, single-molecule localization techniques such as photoactivated localization microscopy (PALM) and stochastic optical reconstruction microscopy (STORM) yield the highest resolution. Traditional fitting-based methods, such as single-emitter localization (SE) and multi-emitter localization (ME) algorithms, employ fixed-size sliding windows to select the fitting areas. However, this was found to lead to an inadequate use of the prior emitter recognition information during the emitter localization stage in this study, thereby resulting in diverse advantageous density ranges and different artifact forms of SE and SM. The SE results are distorted by truncates near the emitters, which are generated by the fixed sizes of the fitting areas, whereas the ME suffers from an inappropriate fitting number. In summary, a self-adaptive mixed-emitter single-molecule localization algorithm (SM) that can adaptively determine the fitting area and fitting number is proposed in this study. Consequently, compared with the SE and ME algorithms, the images reconstructed by the SM algorithm exhibit a superior resolution and contrast over the complete density range on both simulated and experimental data.MethodsThe complete SM algorithm comprises several steps. First, an SNR binary map that can shrink and expand with the power of noise was generated based on the original image. Subsequently, the SNR binary map was combined with the local maxima for emitter recognition, and the sliding window and fitting number were generated using the SNR binary map. The center and size of the generated sliding window were then determined based on the center position and size of the connected domain, respectively, whereas the fitting number was obtained from previous emitter recognition results. Subsequently, maximum likelihood estimation (MLE) or least squares (LS) fitting was performed in each fitting area to obtain the subpixel positions. Finally, the performance of the SM algorithm was investigated using simulated and experimental data.Results and DiscussionsUnder a low or high labeling density, the SM algorithm can effectively reduce crosstalk and mismatch errors, which promotes the recovery of super-resolution images closer to the synthesized benchmark images compared to those recovered by the SE and ME algorithms (Fig. 1). For a low labeling density, the SM algorithm exhibits a slightly better precision, recall, Jaccard index, and RMSE than the SE algorithm, and significantly superior results compared to those of the ME algorithm. With an increasing labeling density, the SM algorithm is marginally inferior to the ME algorithm in terms of the precision, recall, and Jaccard index, but is still significantly better than those of the SE algorithm. In terms of the RMSE, the SM and SE algorithms exhibit comparable localization errors, which are both worse than those of the ME algorithm [Figs. 3(a)?(c)]. Quantitative comparisons between the synthesized benchmark images and super-resolution images recovered by the different algorithms are performed using three indicators: PSNR, SSIM, and RMSE. The SM algorithm produces images with a higher similarity to the ground truth, as indicated by all three indicators (Table 1). In addition, it also successfully restores the structure with an interval of 20 nm, which is not achieved using the SE and ME algorithms [Figs. 3(d)?(e)]. On the α-tubulin dataset labeled as Alexa Fluor 647, the SM algorithm outperforms both the SE and ME algorithms in terms of resolution and contrast, as calculated using the FRC metrics (Fig. 4 and Table 2).ConclusionsIn this study, a self-adaptive mixed-emitter single-molecule localization algorithm that enables the adaptive determination of the fitting area and fitting number is proposed. Compared to the SE and ME algorithms, the SM algorithm can significantly reduce the artifacts caused by mismatch and crosstalk errors, resulting in an enhanced resolution and contrast within the full applicable density range of the fitting method. In terms of the speed, the current SM algorithm is faster than ME algorithm by a factor of 3?4, and slower than the SE algorithm by one order of magnitude. However, the number of fitting iterations required by the SM algorithm is the same as that required by the SE algorithm. Therefore, after optimization, the SM algorithm has the potential to achieve a speed comparable to that of the SE algorithm. Although the analysis and experiments in this study were conducted under two-dimensional and single-channel conditions, the inherent mechanism of the SM method allows for its easy integration with more complex single-molecule imaging technologies, such as three-dimensional and multi-channel situations. In future research, the SM algorithm should be further refined and its reliability and stability should be verified, thereby expanding its advantages in the field of biological imaging.
Nov. 10, 2023Vol. 50 Issue 21 2107106 (2023)
Tieni Li, Dongyuan Liu, Pengrui Zhang, Zhiyong Li, and Feng Gao
ObjectiveFunctional near-infrared spectroscopy (fNIRS) is currently widely applied in clinical research on functional brain activity states because of the advantages of fNIRS over conventional in vivo brain function detection techniques. fNIRS is a non-invasive and non-radiative technique that is resistant to electromagnetic interferences, provides a reasonable temporal/spatial resolution, and facilitates direct detection of blood oxygen metabolism. As an emerging reconstruction strategy for fNIRS, diffuse optical tomography (DOT) can complete the 3D reconstruction of optical parameters based on accurate photon transport models and can significantly improve the quantitative accuracy and spatial resolution of typical optical tomography techniques. Owing to the reflection measurement geometry of DOT, the detection data are affected by superficial physiological interferences (cardiac pulsation, respiration, and low-frequency oscillations) and random noises (photon-shot and instrumental noises) that originate from the scalp-skull layer; these interferences and noises affect the accuracy and precision of the reconstruction results. In addition, owing to limited boundary measurements, the inverse problem of the DOT has a non-negligible ill-posedness. Thus, handling the ill-posedness of the DOT inverse problem and suppressing physiological interferences and random noise are critical tasks in fNIRS-DOT neuroimaging. In this study, a model-based reconstruction-informed and deep learning approach, composed of a semi-three-dimensional (S3D) DOT and deep convolutional encoder–decoder neural network (DCNN), is developed to improve the reconstruction accuracy and suppress physiological interferences and random noises.MethodsFirst, an S3D-DOT model is developed based on the properties of near-infrared light activation information distribution in the depth direction and reasonable assumptions about the structural characteristics of the brain. The S3D-DOT model can help in reducing the number of unreconstructed parameters, handle the ill-posedness of the DOT inverse problem, and preliminarily discriminate perturbation maps corresponding to the surface and cerebral-cortex (CC) layer. The preliminary reconstructed image is then used as an input to the subsequent DCNN model, which is composed of two parts, viz. a decoder network and an encoder network. The DCNN model can collect the spatial feature information of the image, effectively separate the activation and interference information, and accurately reconstruct the activation feature in the CC layer map. In general, the proposed model-informed deep-learning architecture is supported by physical models, exploits the spatial-information-extraction capability of convolution and encoding-decoding networks, and can provide highly quantitative and accurate reconstruction results in different application scenarios.Results and DiscussionsThe structural design of the network, parameter selection process, and training process are described in detail. To verify the effectiveness of the proposed method, numerical simulations and phantom experiments are conducted using the fNIRS-DOT system. The final reconstructed images of the proposed method are compared with those obtained using the algebraic reconstruction technique (ART), and appropriate quantitative evaluation indices are selected for the computational analysis. The results of the numerical simulation experiments at specific time points show that the DCNN can effectively suppress the effects of physiological interference and random noise and improve the reconstruction accuracy, with a mean structure similarity index (SSIM) value of >0.998 (Fig.3). DCNN is more advantageous than the ART at a weak excitation time point, and the corresponding time required for reconstruction is significantly less. Subsequently, the performance of the DCNN model is examined under strong noise interferences. The corresponding results demonstrate that the conventional method cannot accurately reconstruct the excitation distribution under these conditions, whereas the proposed algorithm can still guarantee the validity of the reconstruction results (Fig.4). Additionally, the reconstruction capability of the DCNN in complex scenarios is verified through dual-target simulations (Fig.5). Furthermore, practical applicability of the proposed method is preliminarily examined through phantom experiments. The results indicate that the method can accurately filter random noise; however, the reconstructed image is still affected by physiological interferences when its relative intensity is large (Fig.7). Finally, a 3D deep convolutional encoder-decoder neural network (3D-DCNN) model is proposed to enhance the network’s ability to utilize temporal–spatial information and reasonably predict the changes in the excitatory brain regions. The results of the numerical simulation experiments prove that the 3D-DCNN model is more sensitive to small absorption changes and can accurately reconstruct the complete time courses of the average absorption perturbation in the activated region (Fig.9).ConclusionsIn this study, a model-based reconstruction-informed and deep learning approach is developed for enhancing the fNIRS-DOT performance. This proposed approach adopts the S3D-DOT model and DCNN to reduce image artifacts induced by physiological interferences and random noise. This method requires less hardware devices and provides an explicit physical explanation, an excellent accuracy and generalization for different scenes, and a fast reconstruction speed. To assess the effectiveness of the proposed method, a series of preliminary numerical simulations and phantom experiments are conducted, and the results are compared with those of the traditional reconstruction method. The results show that this method can significantly improve the quantification of images, greatly reduce the reconstruction time, and facilitate an excellent generalization, thereby providing an important new reference for dynamic fNIRS-DOT imaging.
Nov. 10, 2023Vol. 50 Issue 21 2107107 (2023)
Xingyu Liu, Yun Xiao, Lin Ji, Yulong Liu, Tongda Wei, and Yunhai Zhang
ObjectiveIn all blind eye diseases, fundus disease remains the primary cause of irreversible visual loss, significantly impacting visual acuity. In severe scenarios, this results in a higher prevalence of blind fundus disease. Many fundus diseases manifest in the eye periphery. If the lesion does not affect the macular area, patients often overlook early lesions since their visual acuity remains largely unchanged, presenting no symptoms. During examinations, standard fundus-imaging equipment fails to visualize the peripheral area of the fundus due to its limited imaging field of view. Once the lesion impacts the central macular area of the fundus, treatments become challenging, and outcomes are generally unfavorable. As such, early examinations play a crucial role in preventing and treating fundus diseases, underscoring the need to innovate instruments that image the retina, encompassing the fundus periphery. Traditional fundus photography has a field of view limited to 30°?50°. Even utilizing multi-region fundus image stitching only marginally expands the fundus imaging area, concentrating the imaging on the posterior pole. Conversely, laser scanning confocal fundus imaging offers superior clarity and contrast, enabling non-mydriatic fundus imaging even in patients with constricted pupils and facilitating real-time dynamic observations of fundus image changes. Ultrawide-angle fundus imaging rooted in laser scanning confocal imaging emerges as a significant advancement in fundus imaging. We anticipate that our alignment method and study findings will inform the design of cutting-edge ophthalmic examination devices.MethodsTo thoroughly image the peripheral area of the fundus, we explore the fundus line-scanning imaging technology and construct an ultra-wide-field confocal laser line-scanning fundus imaging system. Initially, we devise a comprehensive optical pathway for the system. For achieving ultra-wide-angle, high-resolution dual-mode imaging, it is essential to design the geometrical optical parameters of the components within the respective mode, ensuring that the parameters satisfy the dual-mode imaging requirements simultaneously. We commence by establishing the overarching framework of the optical system, which incorporates the parameter design for ultra-wide-field, high-resolution dual-mode imaging. This is followed by Zemax simulations and image quality optimization for the system detection and imaging sections. Components are chosen based on these parameters, leading to the construction of the experimental system. By utilizing the pixel boundaries of the target surface in the area camera, we are able to achieve line scanning dual-mode confocal imaging of fundus through the creation of virtual slits. Once the theoretical design phase concludes, we employ Zemax software to simulate the system detection optical path, optimize this path, and validate the system design metrics and viability. The camera pixel boundary forms a virtual confocal slit, facilitating line scanning dual-mode confocal imaging of the fundus. We then assess the actual field of view of the system, resolution, and imaging capabilities.Results and DiscussionsThe designed laser line-scanning ultrawide-angle confocal fundus imaging system in this study realizes ultrawide-angle, high-resolution dual-mode imaging by simply switching the eyepiece lens (Fig. 1). After parameter design and simulation (Table 1), the commercially available lenses for scanning, lighting, and imaging objectives fully meet the system requirements, reducing the system design cost. In the ultrawide-angle mode, the system actual field of view reaches 136.3°, achieving ultrawide-angle imaging (Table 3). In the high-resolution mode, the system equivalent conversion fundus resolution stands at 8.5 μm, accomplishing high-resolution imaging (Fig. 9). We conduct ultrawide-angle mode imaging, ordinary fundus camera photography, and high-resolution mode imaging on the simulated eye, and the system dual-mode imaging effect proves significant (Fig. 10).ConclusionsThis study offers a method for achieving ultrawide-angle confocal imaging of the fundus based on line scanning. The system employs a Powell prism in conjunction with a cylindrical lens to produce an ultra-long and ultra-fine laser line beam. It utilizes the pixel boundary of the camera target surface to establish virtual slits, achieving confocal fundus imaging. This effectively diminishes the interference of non-focal plane stray light on the fundus image. The system possesses both an ultra-wide-angle fundus imaging mode and a high-resolution imaging mode. Theoretical calculations and experiments indicate that the field of view in the ultrawide-angle mode is 136.3°, and the actual resolution in the high-resolution mode is 8.5 μm. Grounded on the experimental results, the proposed laser line-scanning fundus imaging method proves feasible. It effectively achieves ultrawide-angle fundus imaging and serves as a reference for the development of related instruments.
Nov. 10, 2023Vol. 50 Issue 21 2107108 (2023)
Lei Chen, Jin Xiang, Nian Zhao, and Tongsheng Chen
ObjectiveAs a nonlinear optical imaging technique that offers high spatial resolution and high penetration depth, second harmonic imaging holds great promise for clinical diagnosis and various applications in the biomedical field, because it overcomes photobleaching and saturation absorption owing to energy absorption, which are commonly encountered in fluorescence imaging. Second-harmonic generation (SHG) is a nonlinear optical process in which two identical photons interact with a nonlinear material and are effectively converted into a single photon with precisely twice the frequency of the incident beam. In biologically relevant SHG imaging, the predominant approach has traditionally relied on the use of exogenous dye markers or endogenous proteins with a relatively low SHG efficiency. In fact, numerous studies have demonstrated strong and photostable SHG signals generated by inorganic crystalline materials. However, most of these inorganic crystalline materials contain heavy metals and have relatively large sizes (~100 nm in diameter). Recently, silicon quantum dots (SiQDs) were developed and have attracted growing interest owing to their remarkable properties, such as aqueous solubility, low cytotoxicity, high quantum yield, and exceptional stability against photobleaching. However, only few studies have investigated the generation of SHG signals from SiQDs without structural reconstitution, which has great potential for advanced optical applications, particularly in the field of SHG imaging. In this study, we developed polyethylene glycol (PEG)-coated SiQDs, an asymmetric material with a high nonlinear optical effect, as second-harmonic probes. To enhance the biological affinity and reduce the surface oxidation of the SiQDs, we modified their surface with PEG and investigated the imaging effect of PEG-coated SiQDs as a biological probe for second-harmonic wave imaging in HepG2 cells. Compared to two-photon fluorescence imaging, the second-harmonic imaging technique based on PEG-coated SiQDs provides more reliable and stable results. This finding can promote the future applications of SiQDs in molecular imaging, drug delivery, and stem cell therapy. By combining the advantages of the SHG dye, which has good biocompatibility and extremely low cytotoxicity, and the SHG inorganic crystalline materials with the photostability of the crystal structure, our SiQDs are expected to become the primary choice among many probes. We labeled hepatocellular carcinoma (HepG2) cells with non-functionalized SiQDs for cell imaging using SHG.MethodsFirst, the nonlinear material used in this study, PEG-coated SiQDs, was synthesized by directly reducing the precursor with silicon-oxygen bonds and then modifying with organic ligands. The morphology and chemical composition of the SiQDs were characterized through transmission electron microscopy (TEM) and energy-dispersive X-ray spectroscopy (EDS). Furthermore, the physical mechanism behind the strong SHG of SiQDs was examined using finite-difference time-domain (FDTD) numerical simulations. The second harmonic characteristics of the SiQDs were then evaluated experimentally using a custom-built setup. Finally, to verify the feasibility of using the PEG-coated SiQDs in cell labeling and imaging, SHG imaging studies on HepG2 cells were conducted using confocal microscopy.Results and DiscussionsThe TEM image of the PEG-coated SiQDs [Fig.1(a)] reveals that they are approximately spherical and have an average diameter of (2±0.5) nm. The excellent second-order nonlinear effects of these SiQDs were verified both theoretically and experimentally. By scanning the SHG signals of the SiQDs [see Fig.4(b)], we confirmed that they exhibit strong and stable SHG signals. Furthermore, we used these SiQDs to perform nonlinear optical imaging of HepG2 cells. Confocal microscopic visualization of the HepG2 cells treated with PEG-coated SiQDs confirmed the excellent tracking and imaging ability of the SiQDs (Fig.5). Furthermore, a TPL scan of the cells incubated with SiQDs demonstrated the advantages of SHG imaging over TPL imaging (Fig.6). Overall, the PEG-coated SiQDs serve as stable and reliable biological probes, significantly improving the image contrast compared with that of two-photon fluorescence imaging. The advantages of SHG imaging, including the absence of photobleaching, blinking, and saturation absorption, are highlighted. In addition, the intensity of the SHG signal produced by the PEG-coated SiQDs is 100 times higher than that obtained in two-photon fluorescence imaging [Fig.6(m)]. These results indicate that SHG imaging based on PEG-coated SiQDs has great potential for a wide range of applications in biomedical imaging and other related fields.ConclusionsThis paper presents a method for preparing PEG-coated SiQDs and their application in cell imaging. The PEG-coated SiQDs have a dynamic fluid diameter of only (2±0.5) nm, and the PEG molecules on their surface enhance their biocompatibility and show no apparent toxicity. The main innovation lies in the exceptionally strong and stable SHG signals exhibited by SiQDs. The SiQDs were employed as biological probes for SHG imaging of human liver cancer cells (HepG2). The advantages of SHG imaging, including the absence of photobleaching, blinking, and saturation absorption, were highlighted by comparing the results with those of two-photon fluorescence imaging. Thus, SiQDs can serve as highly biocompatible photosensitizers without causing toxic side effects and thus have promising prospects in biomedical applications.
Nov. 10, 2023Vol. 50 Issue 21 2107109 (2023)
Wenjin Wang, Yuxia Zhang, Yu Sa, Li Min, and Peng Tian
ObjectivePolarized diffraction images (p-DIs) can provide a wealth of information about the morphologies of scatterers, making them a valuable tool for use in a variety of applications, including the characterization of biological cells and tissues. However, most studies on biological cells have chiefly relied on qualitative analysis, which is achieved through the analysis of patterns of p-DIs for cell clustering. Although qualitative analysis can provide major insights into the morphologies and characteristics of cells, it may not always provide accurate quantitative data about the sizes and shapes of cells, which is critical for some applications. Although quantitative studies on the refractive indices and sizes of cells have been conducted, these investigations have typically been based on the assumption that cells are perfectly spherical. Accordingly, this assumption may not hold true for many types of cells that exhibit non-spherical shapes. Based on a texture analysis of p-Dis, this study conducted quantitative analyses on the characteristic parameters of yeast monomers and budding yeast, where the results are shown to be consistent with those obtained using traditional microscopy methods. This approach can provide insights into the quantitative analysis of non-spherical cells based on light-scattering techniques.MethodsA systematic study on p-DIs with scattering angles of 60°?120° and azimuth angles of 150°?210° of 1197 yeast monomers and budding yeast was conducted using optical models established based on the discrete dipole approximation theory (DDA). Excluding the assumption that the two short aixs of yeast cells are equal, all parameters of these optical models were obtained through microscopy. The experimental p-DIs of 25000 Ale and Lager yeasts were obtained using polarization diffraction imaging flow cytometry. The Fourier spectrum and gray-level co-occurrence matrix (GLCM) parameters of all p-Dis, including those derived from a simulation and experiment, and the depolarization coefficient of p-DIs of yeast monomer were calculated. A regression model was used to establish the quantitative relationship between image feature and cellular structural parameters, such as the sizes of the short aixs of yeasts, the aspect ratio of yeast monomer under different short axis sizes, and short axis ratio of bud yeast to mother yeast. In addition, a statistical correlation between characteristic parameters of yeast cells and GLCM parameters was investigated, and a support vector machine (SVM) classifier was trained based on simulated p-DIs to classify the yeast monomers and budding yeasts in the GLCM parameter space.Results and DiscussionsThis study finds a significant statistical correlation between GLCM parameters and short axis ratio of bud yeast to mother yeast (Fig.6). Therefore, for a statistical analysis of budding rates, the SVM model shows an accuracy of as high as 98.1% [Fig.7(a)]. Moreover, the budding rates of yeasts as calculated by the SVM classifier and microscopic count method are found to be highly consistent [Fig.7(b)]. Further analysis shows that the adjusted R2 as determined by the multiple regression equation is 0.86, indicating that the regression model has very high statistical significance and good predictability. In addition, a power law relationship derived from the nonlinear least squares fit between the normalized spatial frequency along the θ direction and short axis of yeasts is obtained with an R2 value of 0.9986 and narrow 95% prediction interval, indicating that the precision and reliability are satisfactory [Fig.9(a)]. With the aid of this power law relationship, the statistics of the short axis size distribution of yeast monomer based on experimental p-DIs are realized with an error of 7.4% [Fig.9(b)]. The correlations between the aspect ratio of yeast monomer under different short axis sizes and the depolarization coefficients were also analyzed. We find that when the short axis sizes vary in the range of 5?8 μm, the changing trends of the depolarization coefficient with the aspect ratio of yeast monomer under different short axis sizes are consistent and assumed to be a Gaussian function (Fig.10). These results indicate that polarized diffraction imaging technology has promise in terms of quantitative analysis of the structural parameters of non-spherical cell models.ConclusionsA comprehensive numerical and experimental study on the polarized diffraction characteristics of yeast cells is conducted. We develop a yeast cell structural parameter prediction model based on texture features extracted from p-DIs. This prediction model can accurately and rapidly predict yeast cell structural parameters such as short axis size, aspect ratio, and bud size based on given p-DIs. The accuracy and reliability of the model were validated through comparison with actual measurement data. The ability to predict yeast cell structural parameters in a fast and accurate manner is of great significance for the study of cellular morphology and may have major implications for the development of new diagnostic and therapeutic tools.
Nov. 10, 2023Vol. 50 Issue 21 2107110 (2023)
Yixin Yuan, Tao Chen, Chengbo Liu, and Jing Meng
ObjectivePhotoacoustic computed tomography (PACT) is an important photoacoustic imaging modality. Compared with photoacoustic microscopy, PACT can detect biological tissues located several centimeters deep without external contrast agents. Equipped with a multi-channel data acquisition card, PACT has the potential for high-speed imaging under a large field of view and is currently used in clinical and preclinical applications, such as whole-body imaging of small animals and human organs. However, skin tissue contains a lot of melanin, and the high-intensity photoacoustic signal from the skin covers the deep subcutaneous tissue information during the imaging process, hindering the en-face display and analysis of the photoacoustic image of the region of interest. Existing works have successfully removed most of the skin signals in photoacoustic images, but there are still some existing problems: (1) most of them are based on photoacoustic microscopic images of shallow tissues or directly extracted vascular structures in the background; the skin removal of deep tissue PACT images has not been reported; (2) the current pixel-level manual labeling takes a lot of time, and there are shortcomings of low extraction accuracy and low efficiency; (3) owing to reconstruction artifacts and changes in light intensity, the signal amplitudes of the skin area are uneven, and there exists many small segments that cannot be distinguished from the background, which increases the difficulty of extracting a complete and continuous skin signal.MethodsConsidering the continuity of the skin tissue and the uniformity of the thickness of the local imaging area, this study proposes a U-shaped deep learning (DL) model that combines multi-scale perception and a residual structure (MD-ResUnet) to automatically remove skin areas in PACT deep tissue photoacoustic images. The introduction of the residual structure in this model can integrate low- and high-level feature information to prevent model degradation, and the multi-scale dilated convolution blocks can increase the continuity and integrity of skin extraction. In the skin segmentation task, a single-type skin region label was proposed as the ground truth, which significantly reduces the complexity of data annotation, compared with the previous pixel-level multi-type annotation. Subsequently, an algorithm of skin integrity fitting and skin mask generation was designed based on the extracted binary image of the skin, to realize the automatic removal of the skin signal in the PACT image. A total of four PACT datasets were used in our experiments, two of which were used for model optimization and two for experimental verification.Results and DiscussionsThe photoacoustic images of the peripheral blood vessels of human legs from PACT verified the correctness and effectiveness of the proposed method on high-precision extraction and removal of skin tissue. In the task of skin segmentation, the comparative experiments with the existing network models of Unet and Res-Unet, show that the DL model MD-ResUnet proposed in this study can fit most of the narrow skin segmentation gaps, effectively shorten the large segmentation gaps, and the extracted skin is overall more accurate, smooth and continuous (Fig. 4). Compared with the existing skin removal works, the deep learning method proposed in this study can thoroughly remove the skin signal and restore a more realistic and clear deep tissue structure (Fig. 5). Quantitative analysis shows that the reconstruction error of the skin-free image has dropped by 50%?70%, and the peak signal-to-noise ratio is averagely increased by 4.5 dB (Table 2), which may provide an effective method for the high-definition display of deep tissue PACT images.ConclusionsThis study proposes a novel skin removal method for PACT deep tissue images with skin region segmentation as the core and designs a new U-shaped DL network MD-ResUnet to achieve the skin segmentation task. The proposed single-class skin-area labeling method significantly reduces the complexity of data processing, and the boundary fitting and mask generation methods realize the complete removal of skin areas, providing an effective method for high-quality deep tissue image generation in PACT. However, the network model proposed in this study cannot yet achieve fully continuous skin-region extraction, and there are still partially disconnected skin gaps. In addition, the experiment in this study is based on the imaging of the peripheral blood vessels of the human leg. The surface of this tissue is relatively regular, and the overall shape of the skin is arc-like, which is convenient for DL to grasp its overall structure features. For imaging tissues with complex surfaces, such as fingers and wrists, the surface shape of the skin is variable, and there will be more significant illumination differences in the same image frame, resulting in increased uneven skin area signals. In the future, we will explore advanced DL network models to implement the extraction of fully continuous skin surfaces in PACT images.
Nov. 10, 2023Vol. 50 Issue 21 2107111 (2023)
Rongyao Dong, Yanhong Ma, Tianqi Song, Mingliang Zhou, Shuai Wang, and Pengfei Zhang
ObjectiveOptical coherence tomography (OCT) is a widely used imaging technique in retina research, with the spectrometer being a crucial component that determines the performance of spectral domain OCT (SD-OCT). While there are commercial spectrometers and systems available with a variety of options, they are often expensive and not customizable for specific light sources and applications. Thus, independently developing spectrometers and OCT systems could provide a better alternative. The calibration of a spectrometer is typically complex because it requires a standard light source, such as a mercury lamp, that must meet the specific requirements for calibration, including accurate spectral characteristics. Additionally, use of such a light source demands certain technical and operational expertise. Therefore, this paper proposes a practical calibration method for an OCT spectrometer based on a common OCT algorithm. As a result, the need for a standard light source is eliminated, and hence OCT spectrometer calibration is simpler and easier.MethodsIn this study, an SD-OCT system was built, incorporating a supercontinuum laser as the laser source. The corresponding wavelength range is 800?950 nm using filters. The low coherent light emitted by the laser is split into two beams through a fiber coupler. Each beam enters the sample arm and the reference arm, respectively. In the sample arm, the light passes through a two-dimensional galvanometer, generating a scanning beam on the mouse retina in this work. The power of the beam at the mouse pupil was approximately 600 μW, with the beam diameter of 0.93 mm. To minimize chromatic aberrations, the lenses used in both the sample arm and reference arm were paired appropriately. The reflected beams from the sample arm and the reference arm combine and interfere on a custom-built spectrometer. The spectrometer includes a transmission grating, a line CCD camera, and other optical devices. For spectrometer calibration, a mirror is placed at the retina plane, reflecting light back to the spectrometer similar to the reference arm setup. To achieve accurate calibration and performance analysis, the optical power from both arms was adjusted using irises to achieve similar intensity. The interference fringes at different imaging depths are then captured by the camera, facilitating subsequent calibration procedures. The calibration process involves synchronously optimizing the peak value and full width at half maximum of specular reflections collected at these depth positions via manual tuning of difference parameters. Finally, OCT imaging experiments on ten mice were conducted to validate the performance of the spectrometer.Results and DiscussionsThe quantitative analysis results of the spectrometer are presented in Fig. 5. Figure 5(a) shows the spectral curve of the light source directly measured by the spectrometer. In Fig. 5(b), the k-value linearization curve is displayed. The spectral data obtained after Fourier transform is shown in Fig. 5(c), with the peak range of 127 dB?104 dB. To determine the corresponding relationship between CCD camera pixels and spatial distance in A-scan, the position of the peak in Fig.5(c) was extracted and correlated with the actual moving distance of the displacement platform. The calculated relationship between pixels and actual spatial distance was determined as 2.65 μm/pixel in the air, as depicted in Fig.5(d). The spectral data in Fig.5(c) was further Gaussian fitted and multiplied by the above obtained relationship to determine the maximum and minimum axial resolutions in the air of the system, which are 4.14 and 2.72 μm, respectively. The axial resolution change curve remains relatively stable within the imaging range, as demonstrated in Fig.5(e). Additionally, the sensitivity change curve [Fig.5(f)] was realized by connecting the data peaks in Fig.5(c) with a polygonal line. To evaluate the practical application of the spectrometer in mouse retina imaging, 1000 B-scan images were collected at the same position using the OCT system. Each B-scan comprised 1083 A-scans, with the A-scan rate of 100 kHz. The acquired image data were then aligned, averaged, and contrast-enhanced using ImageJ. The mouse retina OCT images are presented in Figs.6(b) and 6(c). To analyze the retina’s structure, the profile of each retinal layer was obtained by averaging the image in the horizontal direction, as depicted in Fig.6(d). Based on this profile, the thickness of each layer of tissue was measured. The comparison results for the thickness of each layer of the mouse retina are detailed in Table 2, demonstrating the successful implementation and performance of the spectrometer in mouse retina imaging. As a result, valuable insights are provided regarding the retinal structure, with potential application in further research investigations.ConclusionsTo address the demand for high-resolution imaging of the mouse retina in basic science research, a specific SD-OCT system was designed and constructed. The system is based on a customized broadband spectrometer. Herein, the design process of the spectrometer is introduced comprehensively, and an alternate optimization approach to its calibration is proposed based on a few key performance metrics. A notable advantage of this calibration approach is that accurate calibration of a spectrometer is achieved without relying on a standard light source. This streamlined process significantly simplifies the calibration procedure, making it more efficient and cost-effective. Overall, the method offers a practical and convenient solution for optimizing OCT systems. In conclusion, the SD-OCT system presented in this paper, with the custom broadband spectrometer and novel calibration approach, is a practical and convenient tool for achieving high-resolution imaging of the mouse retina in basic science research.
Nov. 10, 2023Vol. 50 Issue 21 2107112 (2023)
Xinyi Wu, Qi Duan, Fanchun Bin, and Meiling Zheng
SignificanceExtracellular matrix (ECM), which has an important impact on cell morphogenesis, adhesion, proliferation, and differentiation, is a dynamic and complex microenvironment. However, the mechanism by which cells receive and process information through ECM remains unclear. Therefore, investigating the mechanism of interaction between cells and the ECM will be of great significance in cell culture, tissue engineering, and other fields.Research has shown that the microstructure of a material surface can regulate the proliferation, differentiation, and migration of cells. Hydrogels have a certain geometric shape and moisture content similar to soft tissue, and thus can simulate the ECM in vitro as well as locate and deliver therapeutic proteins in a controlled manner as a vehicle for cell transplantation. The patterned surfaces of hydrogels, cell scaffolds, and other microstructures prepared via micro/nano fabrication technology can simulate the growth and development environment of cells in vitro, particularly in a three-dimensional (3D) environment, enabling analysis of the correlation between the shape and function of cells, as well as of the mechanism behind the interaction between cells and the matrix. Traditional methods for preparing hydrogel microstructures have shortcomings including low accuracy and difficulty in regulating the morphology, which limits their application in the future.Two-photon polymerization (TPP) technology, which uses a deep-penetrating near-infrared laser as the light source, is a new micro-nano manufacturing technology with true 3D fabrication capability and high penetration depth. It can be used to fabricate 3D micro-nano structures with arbitrary high resolution and is widely used in micro-nano photonics, micro-electromechanical systems, tissue engineering, and other fields. The 3D hydrogel microstructure prepared using TPP technology has a controllable morphology, high precision, appropriate stiffness, and good biocompatibility. This can better simulate the in vitro microenvironment required in tissue engineering and other fields, demonstrating its great potential for practical applications in the biomedical field. However, most photoinitiators lead to residues in organic solvents, and the generated cytotoxicity has corresponding effects on the biological environment. Therefore, it is necessary to design and prepare biocompatible water-soluble TPP initiators.In summary, the application of hydrogel microstructures prepared using TPP technology in cell culture has made some progress, but there are still a series of challenges in the design of biocompatible TPP photoinitiators as well as in the application of bionics, tissue engineering, and other fields. Therefore, it is essential to summarize the relevant research for a comprehensive understanding of the hurdles in the application of hydrogel microstructures and future development directions.ProgressIn this review, the principle of two-photon polymerization and the research progress on photoinitiators are briefly introduced. Moreover, synthesis methods for water-soluble TPP photoinitiators with high initiation efficiencies have been introduced, including host-guest chemistry, hydrophobic interactions, introduction of non-ionic surfactants, and modification of hydrophilic groups. To enable 3D hydrogel microstructures to be fully applied in the field of biomedicine, TPP photoinitiators must exhibit lower cytotoxicity. Xing et al. efficiently prepared water-soluble TPP photoinitiators with high TPA cross sections and low threshold power through the Witting reaction and host-guest chemical interactions, and fabricated a high-resolution 3D hydrogel microstructure. Gao et al. prepared a new ionic water-soluble carbazole photoinitiator through host-guest interactions (Fig.4) and achieved the low laser threshold of 3.7 mW and high resolution of 180 nm, while the 3D hydrogel microscaffold structure maintained great biocompatibility in an aqueous environment. Introducing a nonionic surfactant or modifying hydrophilic groups is a simple and efficient method for improving water solubility. Li et al. synthesized a series of cyclic benzylketone-based TPP photoinitiators containing sodium carboxylates to enhance the water solubility through an aldol condensation reaction. They were evaluated in the dark using the MG63 cell line and found to have low cytotoxicity. Subsequently, the preparation of a 3D hydrogel microstructure via TPP and its application in biomimetics and biomedicine are introduced. Inspired by the response of the flytrap to external stimuli, Wang et al. used femtosecond laser fabrication technology to obtain intelligent responsive hydrogel microdrivers based on bionic asymmetric structures (Fig.7), achieving and adjusting the grasping and release behavior of microtargets by changing the pH value. Zhang et al. designed and prepared a series of 3D hydrogel microscaffolds with different pore sizes using biocompatible materials, such as PEGDA and PE-3A. The porosity of the scaffold was adjusted from 69.7% to 89.3% by changing the pillars and pillar spacing of the scaffold, and by regulating the cell behavior of the 3D hydrogel microscaffolds with different pore sizes (Fig.12). Finally, problems in the application of 3D hydrogel microstructures and their development prospects are summarized.Conclusions and ProspectsIn recent years, many studies have focused on developing photoinitiators with high initiation efficiencies and low thresholds. To realize photo-crosslinking in an aqueous environment, a series of water-soluble TPP photoinitiators with high initiation efficiencies have been designed and prepared, expanding their applications in biomedical fields such as tissue engineering and drug delivery. Although some progress has been achieved in research on water-soluble TPP photoinitiators, the specific polymerization mechanism in aqueous environments requires further exploration. However, current TPP technology cannot satisfy the requirement for the rapid preparation of a large number of hydrogel microstructures, which hinders the mass culture of cells and tissues in vitro. Therefore, in future, the rapid fabrication of large-area hydrogel microstructures using TPP should be considered.
Nov. 10, 2023Vol. 50 Issue 21 2107401 (2023)
Linzhi Ye, Luwei Zhang, Zhenxi Zhang, and Cuiping Yao
SignificanceWith the development of society, the demand for improved quality of human life is increasing. The threats of cancer, pandemic viruses, declining food safety, and environmental pollution have gradually become the critical issues in human society. Therefore, the early diagnosis and treatment of cancer, development of drugs, rapid and sensitive detection of viruses, monitoring of environmental pollution, and inspection of food safety are vital for human life and health. Early biomarkers of cancer, such as tumor necrosis factor (TNF), exosomes, and circulating tumor DNA, have an extremely low abundance in the human body. Environmental pollution and food inspection have also necessitated the requirements for detecting extremely low concentrations of markers. Therefore, biosensors with high specificity and sensitivity are urgently required to satisfy society’s needs.Many methods have been used to detect various biochemical markers, including polymerase chain reaction (PCR), enzyme-linked immunosorbent assay (ELISA), liquid chromatography, and mass spectrometry. The PCR and enzyme-linked immunosorbent assay (ELISA) are the gold standards for nucleic acid and protein detection, respectively. However, the PCR typically requires a long detection time (3?3.5 h), expensive instruments and equipment, specific laboratory environments, and professional laboratory personnel. In ELISA, most antibodies require enzyme labeling, which often results in false positives and affects the parameters, making them unsuitable for early detection. Liquid chromatography-mass spectrometry often requires large and expensive mass spectrometers for operation and has low repeatability. However, sensors based on surface plasmon resonance (SPR) do not require expensive markers, and optical detection methods can prevent physical and chemical contact between the sensors and analytes. SPR biosensors can also perform a simple, cost-effective, accurate, and timely detection of biochemical markers to support rapid medical decisions and actions. Currently, the detection limit displayed by SPR sensors is not inferior to that of PCR and ELISA detection methods; the detection program is simpler and can be automated, which compensates for the shortcomings of traditional detection methods and has significant application potential.With the continuous development of the SPR technology for biomarker detection, researchers have significantly expanded the detection capabilities of SPR sensors. However, traditional SPR sensors are typically susceptible to temperature, have difficulty distinguishing non-specific adsorption, and have difficulty detecting low concentrations and low relative molecular mass analytes. To solve these problems, several research teams have developed methods based on sensor structures and functionalized materials to improve SPR sensor sensitivity. Therefore, a summary of the existing research will guide the future development of this field.ProgressIn this study, we first divide the detection methods of SPR biosensors into five types based on measurements of different parameters by the sensor. We explain the basic principles of various interrogation methods for detecting biomarkers and present a comparison of the advantages and disadvantages of the different interrogation methods (Table 1). In terms of current research progress, the detection methods for SPR sensors are mainly based on two types: angular interrogation and wavelength interrogation SPR biosensors, which have improved detection accuracy and higher convenience. The phase interrogation and Goos-H?nchen shift interrogation types exhibit higher detection sensitivity and accuracy; however, it is still necessary to continue investigating the optimal structure of chips and instruments. For system complexity, the angular interrogation type and Goos-H?nchen shift interrogation type have simpler structures and broader prospects for portable detection. Next, we summarize the research progress in SPR sensor sensitization from the aspects of nanomaterial sensitization and sensor structure optimization, based on the methods recently used by researchers to enhance SPR sensitivity. In terms of nanomaterials, including precious metal nanoparticles, magnetic nanoparticles, and two-dimensional nanomaterials, the enhancement of detection signals is mainly achieved through large-surface loads or localized surface plasmon resonance (LSPR) coupling to enhance the electric field. The optimization of the sensing structure includes the combination of a SPR sensor with a structure, such as a Fabry-Pérot cavity or nanohole array. The Fabry-Pérot cavity reduces the signal loss caused by the metal damping effect by binding the light beams in the nanocavity. The nanopore array achieves a simple and sensitive detection based on significant optical transmission. Finally, we summarize the main shortcomings of current SPR sensors and propose possible solutions.Conclusions and ProspectsOverall, SPR sensors have the advantages of a low detection limit, wide linear range, low sample requirement, high sensitivity, and high selectivity, with high potential for cancer prevention, virus detection, and environmental pollution monitoring. Researchers can apply appropriate interrogation methods to develop portable, highly sensitive, and high-throughput SPR biosensors. By appropriately selecting and combining various sensitization methods, SPR sensors that can overcome existing detection capabilities are developed. Although SPR sensors still face challenges such as high costs and difficulties in achieving portability, SPR sensor technology will advance with the progress in materials and structural science, maintaining excellent characteristics for biomolecular detection while minimizing costs.
Nov. 10, 2023Vol. 50 Issue 21 2107402 (2023)
Qiankun Li, Meiqi Ding, Lin Gui, Xiaoxuan Lian, and Min Qian
ObjectiveChlorophyll detection and monitoring play crucial roles in plant physiology, water quality, agricultural management, and ecosystem health. Based on their principles and application characteristics, current chlorophyll detection methods can be classified into several categories such as spectroscopic measurements (such as spectrophotometry and fluorescence techniques), compositional analysis (such as high-performance liquid chromatography, HPLC), and morphological observation (such as microscopic counting and high-resolution spectral imaging). However, many of these methods present various drawbacks. Spectrophotometric methods involve cumbersome detection steps and suffer from low sensitivity; the HPLC method takes a long time and is costly; the fluorescence method does not work well with high-concentration solutions; some detection equipment demands on-site measurement, hindering long-distance detection; and real-time capabilities are often lacking, demanding significant manpower and resources. In recent times, microwave photonics (MWP) technology evolves rapidly. Microwave photonic filters (MPF), pivotal technologies within this realm, capitalize on the fiber optic sensor’s resilience to high pressure, high temperature, corrosion, and electromagnetic interference. These sensors process RF signals and manage optical carrier signal processing within the optical domain. This study introduces a chlorophyll detection system rooted in the microwave photonic filter RF intensity. This novel detection method stands out for its compactness, robust anti-interference capabilities, and potential for long-distance detection. The focus here is the application of microwave photonic filters for chlorophyll detection. Our experiment underscores the feasibility of this principle and highlights a pioneering approach to chlorophyll detection with expansive application prospects.MethodsThe system comprised a broad-spectrum light source (ASE), a microwave signal source (RF), an optical fiber amplifier (EDFA), an electro-optical modulator (EOM), an isolator (ISO), an optical coupler (OC), a photodetector (PD), a spectrometer (ESA), and optical fibers. Together, they formed a microwave photonic filter with a Michelson interferometer structure. The upper arm (reference arm) of the system had a fiber-end-face placed in a test tube containing a matching solution with consistent reflectivity. This matching solution was 95% ethanol, and the fiber end face was labeled as PC1. The lower arm (sensing arm) connected with a 2 km fiber optic, enabling detection and monitoring over extended distances. The end fiber face of this arm was placed in a test tube containing a chlorophyll solution, and its fiber-end-face was labeled as PC2. The principle of chlorophyll determination in this study centered on the variation in RF power at a particular frequency due to shifts in chlorophyll concentration. Following the Fresnel reflection principle, when the chlorophyll content at the optical fiber’s end face varied, the solution’s refractive index (n) altered. This change led to a modification in the effective reflectivity (Fresnel reflection coefficient R), influencing the amplitude coefficients of the microwave photonic filters.Results and DiscussionsChlorophyll solutions extracted from various vegetables are tested (Fig.2) to verify the feasibility of detecting plant chlorophyll (Fig.4). Through the time stability experiment, it is concluded that when the chlorophyll sample solution of the experimental stock solution is placed in a shaded room at a temperature of 25 ℃ for 2 h, the relative error of the maximum value of the RF intensity measured by the chlorophyll solution stays within 0.73%, and the relative error of the minimum value of the RF intensity is within 0.72% (Fig.5, Table 3, and Table 4). This indicates that the chlorophyll solution made by the experimental stock solution remains stable, suggesting the properties of the standard substance do not change notably within the experimental time range, ensuring the reliability of the experiment. Temperature effect experiments show that the system remains more stable concerning the chlorophyll concentration of the experimental samples in the measurement range of 25?35 ℃ (Fig.6). Different gradients of chlorophyll solutions, prepared from chlorophyll experimental stock solution and standard solution, are tested, confirming that the RF intensity and chlorophyll mass concentration maintain a strong linear relationship. For the measurements of the chlorophyll experimental stock solution, the linear degree of fitting (R2) at the maximum RF intensity is 0.9583 with a sensitivity of 0.2994 dB/(mg·L-1), and the R2 at the minimum RF intensity is 0.9596 with a sensitivity of 0.3336 dB/(mg·L-1) (Fig.7). For the measurements of the standard chlorophyll solution, the R2 at the maximum RF intensity is 0.9741 with a sensitivity of 0.007881 dB/(μg·L-1), and the R2 at the minimum RF intensity is 0.9841 with a sensitivity of 0.02258 dB/(μg·L-1) (Fig 8). These experimental results demonstrate that the system exhibits high sensing performance at high and low chlorophyll mass concentrations.ConclusionsIn this study, a novel chlorophyll detection system is demonstrated, which utilizes microwave photonic signals to capture the RF spectral lines of the system. This method extracts chlorophyll sensing information from the peaks (RF intensity maxima and RF intensity minima) without the need for expensive optical spectral demodulation instruments. It offers rapid demodulation speed, enabling real-time long-distance detection and monitoring of solutions with varying chlorophyll mass concentrations. The introduced sensing system exhibits outstanding sensing performance and proves versatile for detection in both low- and high-mass concentration of chlorophyll environments. This research paves the way for future applications in areas such as water pollution monitoring and industrial chlorophyll concentration detection. Beyond detecting the chlorophyll content of various vegetables, this system has the potential for diagnosing plant health and growth, with implications for agricultural development. Although promising chlorophyll mass concentration detection results are achieved, there remains potential for further optimization. This includes reducing noise impact, enhancing system sensitivity and fit, and solidifying its foundation for future applications.
Nov. 10, 2023Vol. 50 Issue 21 2107403 (2023)
Jianfeng Yan, Jiayuan Li, Xing Zhang, Jun Tan, Jinyu Fu, Caifeng Ou, Chengyun Zhang, Yunfeng Luo, Zhifeng Chen, and Pusheng Zhang
ObjectiveBreast cancer ranks highest in global incidence among all cancers, posing a significant threat to women's health. During surgical treatment for breast cancer, the absence of swift and precise tissue identification often results in either removal of excessive tissue or extended surgical durations. Recently, autologous tissue spectroscopy has garnered interest as a detection method due to its benefits, including speed, sensitivity, selectivity, and non-invasiveness. Consequently, identifying effective spectral diagnostic features for breast cancer and understanding their mechanisms are critically important.MethodsWhen normal tissue transforms into malignant tumor tissue, there is a qualitative shift in its internal biochemical environment. Hence, when normal glandular tissue undergoes carcinogenesis, the content and distribution of various fluorescent groups within that tissue alters, causing changes in the steady-state fluorescence spectral characteristics. In this study, a custom-built laser-induced steady fluorescence spectroscopy system was employed to conduct autofluorescence spectroscopy experiments on several malignant breast tumors and normal breast tissues (Fig. 1). A 355 nm sub-nanosecond sequence pulse laser served as the excitation light source. This choice was favorable for achieving a favorable signal-to-noise ratio at lower average optical power levels without inflicting irreversible damage to the samples. The constructed spectral system boasted a resolution as precise as 0.1 nm and spanned a spectral measurement range from 200 nm to 900 nm. The integration of a photomultiplier tube with a single-photon counter facilitated the measurement of faint spectral signals.Results and DiscussionsBy comparing the spectral characteristics of the two types of tissue samples (Fig. 2), the spectral curves of tumors exhibit varying degrees of concave features near 430 nm, while all spectral curves of normal breast tissue samples show no concave features around 430 nm. This stands out as the most significant spectral characteristic difference between the two types of samples. We select 400, 430, and 465 nm as the spectral feature peaks and compare three ratio-based methods: I430/I465, I430/I400, and 2I430/(I400+I465). Based on this comparison, we propose that the fluorescence ratio method of 2I430/(I400+I465) serves as a feasible spectral-specific discrimination approach to differentiate between normal glandular tissue and breast tumors (Fig. 3). Using a discrimination threshold of 0.95, it is possible to realize 100% discrimination for all tested sample points.Further spectral fitting analysis with Gaussian models shows that the experimental measurements of tumors and normal glandular tissue consist of four spectral components (Fig. 4). The autofluorescence of the breast tissue observed in the experiment predominantly stems from the contribution of four endogenous fluorescent substances: collagen, elastin, nicotinamide adenine dinucleotide hydrogen (NADH), and flavin adenine (Table 1). It is clear that the primary spectral characteristic difference in the autofluorescence spectra of the two types of tissues, as previously analyzed, namely, the spectral concavity observed near 430 nm in malignant breast tumors, primarily arises from the variation in peak 3. The heightened content of the reduced coenzyme NADH in malignant breast tumors when compared to normal breast tissue primarily explains this discrepancy. Moreover, a reduction in NADH-binding proteins leads to spectral variations in cancerous tissues.ConclusionsIn this study, a 355 nm sub-nanosecond sequential pulsed laser is utilized as the excitation source and autofluorescence spectral experiments are performed on both malignant breast tumor tissue and normal breast tissue with a custom-built laser-induced steady-state fluorescence spectroscopy system. By comparing the spectral characteristics of these tissue types, we propose a specific discrimination method based on the distinct concave features observed near 430 nm. By computing the fluorescence ratio of 2I430/(I400+I465), breast cancer tissues can be precisely identified. Thus, to recognize breast cancer tissue, it is sufficient to measure the fluorescence intensity at these three key wavelengths and compute the corresponding fluorescence ratio. Further analysis using Gaussian models indicates that the breast tissue's autofluorescence predominantly stems from four endogenous fluorescent substances. The spectral shifts in cancerous tissues mainly arise from an increase in the reduced coenzyme NADH and a decrease in NADH-binding proteins. The breast cancer spectral discrimination approach introduced in this study demonstrates notable specificity and is underpinned by a clear biological rationale, presenting a new benchmark for swift clinical detection, especially valuable for margin evaluation during breast-conserving surgeries.
Nov. 10, 2023Vol. 50 Issue 21 2107201 (2023)
Lingqin Kong, Xiaoxi Wu, Liquan Dong, Yuejin Zhao, and Ming Liu
ObjectiveHeart rate serves as a pivotal metric for assessing cardiovascular and cerebrovascular health. Routinely monitoring heart rate is crucial in averting cardiovascular diseases and treating chronic ailments. Image photoplethysmography (IPPG) technology enables non-invasive measurement of physiological parameters by detecting subtle changes in light intensity caused by variations in blood volume on the surface of the skin. Recently, IPPG has witnessed extensive applications in measuring diverse vital signs. However, prevailing investigations on heart rate detection using near-infrared video predominantly occur in controlled environments due to the constrained absorption of blood constituents in the near-infrared spectrum. Studies about moving objects are scant and suffer from high errors and low generalizability. This study proposes a heart rate detection method combining orthogonal projection and singular value decomposition, termed the OP-SVD method. The OP-SVD method adeptly extracts high signal-to-noise ratio IPPG signals from single-channel near-infrared facial videos, surmounting the influence of motion artifacts and achieving accurate heart rate detection. This research holds certain significance for clinical applications requiring continuous monitoring during nighttime in settings like intensive care units (ICUs) and non-contact human health monitoring during the night.MethodsThe proposed OP-SVD method comprises the following steps: First, the near-infrared videos underwent processing to detect and track facial landmarks. Each frame of the facial imagery is divided into N=44 regions of interest (ROI) by leveraging the positions of these facial landmarks and blood perfusion status, effectively preserving the pulse wave information. Second, spatial averaging is applied to mitigate camera quantization noise from pixels within each ROI; the resulting time-series data are concatenated to generate the raw IPPG signal matrix. The orthogonal projection algorithm is employed to eliminate motion artifacts from the raw IPPG signal matrix caused by head movement, yielding a denoised IPPG signal matrix. A fifth-order Butterworth band-pass filter is applied to each time series in the IPPG signal matrix to adapt to a broad range of normal heart rates. Additionally, a detrending filter is used to remove low-frequency drift noise from the time series. Next, the filtered IPPG signal matrix undergoes singular value decomposition for further denoising, and reconstruction is performed based on signal quality indices, yielding a clean IPPG signal matrix. Finally, the reconstructed signals are processed using a 10 s sliding window with a step size of 0.2 s to perform a fast Fourier transform (FFT). Zero-padding is applied to the windowed data to prevent spectral leakage, generating the corresponding power spectra. Heart rate estimation is obtained by identifying the frequency with the highest peak in the power spectrum.Results and DiscussionsThe proposed OP-SVD method can achieve accurate heart rate measurements under motion conditions. Illustrated by a 30 s near-infrared video featuring a moving subject, heart rate estimation values obtained through the OP-SVD method correlate consistently with reference values (Fig.5). Additionally, we conduct a correlation analysis between the heart rate values obtained without denoising and those estimated using the OP-SVD algorithm (Fig.6). The heart rate estimation values from the OP-SVD algorithm show a stronger concordance with the true values. It underscores that the OP-SVD method significantly improves the consistency between heart rate estimation value and true heart rate result, achieving robust heart rate measurement under motion conditions. Finally, the OP-SVD method is compared with traditional single-channel signal processing methods based on IPPG technology [single-channel filtering (SCF), empirical mode decomposition (EEMD), and single-channel independent component analysis (SCICA)]. Empirical findings substantiate that the OP-SVD-based heart rate detection method outperforms its counterparts, with a mean absolute error (MAE) of 3.14 bit/min (Table 1).ConclusionsIn response to the suboptimal accuracy of video-based heart rate detection under infrared light during nighttime conditions and the prevailing challenge of achieving high-precision heart rate measurement amidst subject head movement, this study proposes the OP-SVD heart rate detection method. The proposed method combines orthogonal decomposition projection with singular value decomposition to mitigate noise stemming from head movement, facilitating high-precision and robust heart rate detection under nighttime near-infrared scenarios using video. Comparative analysis with existing classical algorithms underscores the superior performance of the proposed method, with a mean absolute error of 3.14 bit/min.
Nov. 10, 2023Vol. 50 Issue 21 2107202 (2023)
Zhushanying Zhang, Sicong Zhu, Xianwen Zhang, Baorong Fu, Zhi Li, Huimin Cao, and Yi Liu
ObjectiveHemoglobin is a special protein responsible for transporting oxygen in red blood cells. Hemoglobin concentration is an important parameter in routine blood tests and an important index for the diagnosis of anemia and other blood diseases in clinical medicine. Changes in hemoglobin concentration can directly reflect changes in human health; therefore, it is important to detect the hemoglobin concentration in the human body accurately for the diagnosis of many blood diseases. Current clinical medical treatments mainly rely on chemical reagents to detect hemoglobin concentrations, resulting in high detection costs, long analysis time, complicated operations, and trauma to the human body. Infrared spectroscopy can detect hemoglobin concentrations without reagents efficiently and noninvasively. However, the blood composition is complex, and the spectral overlap is serious. This complex background information makes it difficult to construct a high-precision quantitative hemoglobin analysis model. The model developed in this study is based on a backpropagation (BP) neural-network model combined with synergy interval partial least squares (SiPLS). This model uses SiPLS to eliminate most of the interference information, accelerates the modeling speed, and can achieve high-precision quantification of hemoglobin concentration in a complex background. It is believed that the proposed model can be helpful in promoting noninvasive detection of hemoglobin.MethodsIn this study, the near-infrared spectral data of 186 blood samples with different concentrations of hemoglobin and 39 near-infrared spectral data of hemoglobin imitation solution samples with different concentrations under a complex background are used as the research objects. The best dataset division method, best division ratio, and best pretreatment method are selected. Four quantitative analysis models [SiPLS, SiPLS-BP, full-spectrum partial least squares (PLS), and full-spectrum BP] are constructed using SiPLS preferred bands, analyzed, and compared.Results and DiscussionsThe best quantitative model for both samples is SiPLS-BP. The correlation coefficient of the prediction set based on the SiPLS-BP model for blood samples reaches 0.9907, and the root mean square error of the prediction set (RMSEP) is 1.807 (Table 2). The correlation coefficient of the prediction set based on the SiPLS-BP model for the imitation solution sample reaches 0.9975, and the RMSEP is 1.017 (Table 3). The characteristic bands selected by the SiPLS model for the blood samples are 1100?1298 nm, 1600?1798 nm, and 2100?2198 nm (Table 4), and the characteristic bands selected by the SiPLS-BP model are 1100?1310 nm, 1630?1840 nm, and 2054?2370 nm (Table 4). The SiPLS and SiPLS-BP models of the imitation solution samples adopt bands at 1141?1220 nm and 1301?1380 nm. Even when the same characteristic wavelength optimization method is used, the preferred bands of each model are not exactly the same. For the imitation solution and blood with a complex background and large sample difference, the SiPLS-BP model has a better prediction effect (Figs.5 and 6). The predicted value of the model is the closest to the actual value, the degree of dispersion is the smallest, and the quantitative effect is the best.ConclusionsTo quantify hemoglobin concentration accurately in complex backgrounds using infrared spectroscopy, a model using SiPLS-BP is proposed. To verify the effectiveness of the SiPLS-BP model, four models (full-spectrum PLS, SiPLS, full-spectrum BP, and SiPLS-BP) are constructed to predict 39 complex-background hemoglobin imitation solution samples and 186 blood samples. The results show that the SiPLS-BP model has the best quantitative effect on hemoglobin in a complex background. The correlation coefficient of the prediction set under the SiPLS-BP model for the imitation solution sample reaches 0.9975, and the prediction effect of the model is 44.2% higher than that of the SiPLS model. The correlation coefficient of the prediction set under the SiPLS-BP model for blood samples is 0.9907, and the prediction effect of the model is 7.2% higher than that of the SiPLS model. The results show that the nonlinear BP model has a better prediction effect for the solution with a complex background and large sample difference. The SiPLS combined with the BP or PLS model improves the predictive effect of the model significantly for the two samples. This shows that an appropriate characteristic wavelength optimization method can eliminate interference information and simplify the model, greatly improving the prediction effect of the model and increasing the modeling speed. This research provides a new method for the construction of a hemoglobin quantitative analysis model in a complex background by near-infrared spectroscopy and provides a new approach for noninvasive detection of hemoglobin.
Nov. 10, 2023Vol. 50 Issue 21 2107203 (2023)
Jian Dong, Chunyan Wang, Hao Sun, Huan Liu, and Yunjie Teng
ObjectiveAt present, the medical endoscope mainly uses the fixed focus optical system and relies on image processing and other means to scale the image. Due to the large space occupied by traditional mechanical zoom optical system as well as its difficulty in zooming, it has not been applied to medical endoscopes. Based on the concept of bionics, the liquid lens is a small, integrated and self-zooming lens. The electrowetting liquid lens is applied to the design of medical endoscope. Zooming can be realized by adjusting the voltage and the image quality can be guaranteed. Some scholars at home and abroad have studied the optical system of endoscope containing liquid lens, but there are many problems in the existing research contents, such as large distortion and difficulty to guarantee the image quality. In this paper, based on the traditional zoom optical design of medical laparoscope, an autonomous zoom optical system with small distortion and simple structure is designed, which is suitable for medical endoscope.MethodsThe electrowetting liquid lens, which depends on voltage to adjust the curvature of the interface, is selected as the core zoom element. The basic parameters of the optical system are determined according to the main technical indexes, the mechanical zoom optical system is designed by optimizing the initial structure of traditional zoom optics, and the initial optical structure of a zoom laparoscope is obtained. The parameters of liquid lens are determined according to the changing range of focal length and the aperture of optical system, and then the liquid lens is designed and simulated by COMSOL. The simulation diagram of liquid lens interface is given when the voltage is 0, 35 and 60 V. The corresponding relationship between voltage variation and liquid level variation is simulated. When the voltage reaches 60 V, the contact angle of the electrowetting liquid lens reaches saturation, and the liquid lens interface no longer changes. MATLAB software is used to simulate the corresponding relationship between voltage and focal length. In the voltage range of 0?30 V, the focal length is positive and shows a slow growth trend; in the voltage range of 30?35 V, the focal length increases rapidly and finally reaches infinity; when the voltage is in the 35?40 V range, the focal length is negative and rapidly decays from infinity; when the voltage is in the 40?60 V range, the focal length slowly decays, and finally the contact angle of the liquid lens reaches saturation, and the focal length of the liquid lens no longer changes. According to the data, the liquid lens is modeled in ZEMAX. The zoom lens group and compensation lens group in the initial structure are replaced with liquid lenses, and the liquid surface is controlled by voltage to achieve the purpose of zooming. ZEMAX is used to optimize the simulation.Results and DiscussionsAfter optimization, the liquid lens zoom optical system for laparoscopy is obtained (Fig. 7), in which the system structure diagrams under four different states are given: short focus (5 mm), medium focus (7.2 mm), medium focus (10.4 mm), and long focus (15 mm), respectively. The fourth and eleventh mirrors of the optical system are liquid lenses. In the four configurations, the focal lengths of liquid lens 1 and liquid lens 2 are (-17.89 mm, 20.88 mm), (-48.68 mm, 37.43 mm), (180.73 mm, -631.96 mm), (38.78 mm, -23.31 mm), respectively. Through 19.44?44.23 V voltage regulation, the focal length of 5?15 mm is realized, and the total length of the system is 45 mm (Table 3). Each state of the zoom system obtains the maximum root-mean-square (RMS) radius at the maximum field angle (Table 3), and all of them are smaller than the pixel size 7.4 μm. The optical transfer function curves of different configurations are all close to the diffraction limit curve (Fig. 8). At the Nyquist frequency of 68 lp/mm, the modulation transfer function (MTF) of the optical system in the zoom range is greater than 0.5, which meets the high quality requirements of the optical system of laparoscopy. The distortion value of each state of the zoom system is far less than the required value, and the maximum distortion value is 7.047% (Fig. 9). Compared with the fixed-focus laparoscopic system, the distortion value is far less than the common value of 15%, showing excellent system performance.ConclusionsA zoom optical system for laparoscopy is designed with liquid lens as the core component, and the relationship between zoom range and control voltage is designed and simulated. Aberration analysis of the design results shows that the MTF of the four configurations is greater than 0.5 at the Nyquist frequency of 68 lp/mm, and the maximum distortion is 7.047%. The imaging quality can meet the requirements of laparoscopic optical system. In the process of focal length change, the position of the image plane is always unchanged, and the zooming can be realized by adjusting the voltage without mechanical structure. The results show that it is feasible to use liquid lens to realize the design of laparoscopic zoom optical system. It has a broad application prospect in reducing the overall size, realizing convenient operation and improving the image quality of laparoscopy.
Nov. 10, 2023Vol. 50 Issue 21 2107204 (2023)
Peng Wang, Xiaoming Xi, Xiangming Meng, Xiaolin Wang, Hanshuo Wu, Baolai Yang, Hanwei Zhang, Pengfei Ma, Yanxing Ma, Wenguang Liu, Fengjie Xi, Kai Han, Zefeng Wang, Xiaojun Xu, and Jinbao Chen
Nov. 10, 2023Vol. 50 Issue 21 2116001 (2023)
Zefeng Wang, Xin Tian, Binyu Rao, Meng Wang, Xiaoming Xi, Zhixian Li, Zilun Chen, Hu Xiao, Pengfei Ma, Wei Liu, Zhiyong Pan, Liangjin Huang, Baolai Yang, Xiaolin Wang, and Jinbao Chen
Nov. 10, 2023Vol. 50 Issue 21 2116002 (2023)
© Copyright 2018-2021 | Chinese Laser Press.
All Rights Reserved 沪ICP备15018463号-20