


Please enter the answer below before you can view the full text.

Fan Zhang, Jianghua Luo, Jun Li, Tianrui Lin, Chen Gong, and Zhengyuan Xu
ObjectiveTo explore and exploit ocean resources, it is necessary to establish wireless communication networks between underwater and air platforms. In these wireless networks, data should be transmitted efficiently across the water-to-air (W2A) interface; reliable W2A communication links play a significant role in such data transmission. Although acoustic waves are the primary means for communication in water because of their long propagation distance (up to several kilometers), they are mostly reflected off when crossing the water surface. Moreover, the transmission rate of an acoustic communication system is relatively low (on the order of kb/s), which limits its application. Radio frequency waves are suitable for long distances (up to tens of kilometers) and high transmission rates (up to hundreds of Mb/s) of wireless communication in air, but they can only travel a few meters through water because of their high absorption and attenuation in underwater environments. Compared with acoustic and RF waves, optical waves can achieve long-distance wireless transmission in both water and air media; they provide a very high bandwidth, high transmission rate, and low latency and enable the use of advanced transceiver devices. Thus, the use of optical waves is a potential solution for communication across the W2A interface. However, when a light beam passes across the W2A interface, the propagating photons experience an unpredictable path deviation owing to the dynamic nature of the waves. Therefore, it is necessary to obtain the statistical properties of the physical responses of photons passing across different W2A interfaces, which can be used to characterize the correlation between the light beam drift and water wave dynamics.MethodsThis study focused on water-to-air visible light communication (W2A-VLC) through regular and random waves. The physical response of the propagating photons and corresponding link performances were evaluated by combining laboratory experiments with theoretical simulations. First, we built a laser diode (LD) transmission experiment and captured laser spots at the receiving end using a high-speed camera. The physical response of the propagating photons could be visualized by extracting the centroids of the laser spots, and a Monte Carlo simulation of the photon transmission was performed for comparative analysis. Second, by numerically fitting the centroid distribution, we further obtained the statistical properties of the photon responses under regular and random waves conditions. The inner dynamic processes of the statistical properties were also analyzed. Finally, we validated the narrow-beam characteristics from the perspective of wide-beam transmission through both theoretical simulations and experimental measurements. The statistical laws of the LD narrow beam were validated from the perspective of the LED wide beam.Results and DiscussionsThe physical response of the propagating photons was first theoretically predicted based on Monte Carlo simulations. In the case of a calm water surface, the photons are mainly distributed around the coordinate center of the receiving end and present a circular structure. In the case of regular waves, the photons are distributed in a strip shape at the receiving end, whereas in the case of random waves, the received photons diffuse from the center to the periphery, and the distribution range significantly increases [Fig. 3(a)?(c)]. The experimental results of the photon responses are consistent with the Monte Carlo simulation patterns. The corresponding statistical features were analyzed further. For regular waves, the centroid points on the x-axis ( perpendicular to the wind) obey a normal distribution, whereas those on the y-axis (wind direction) obey a negatively skewed distribution with a skewed parameter of λ′=-2.5. For random waves, the distribution of the centroid points presents an approximately normal distribution (Fig. 4). We also justify the LD link characterization based on the simulation and real test of an LED transmitter. A Monte Carlo simulation of the LED wide-beam link was performed to obtain the light spot at the receiving end. The light spot on the calm water surface is a regular circle, and its brightness gradually decreases from the center. In the case of regular waves, the pattern of the light spot is elliptical. Conversely, in the case of random waves, the light spot still exhibits a circular outline, but the bright and dark areas in the light spot are irregularly distributed (Fig. 5). An experimental verification system for the LED link was designed to verify the simulation and extend the general statistical laws of the LD narrow beam (Fig. 6). The experimental results reveal that the photon diffusion and beam drift are mainly along the wind direction, consistent with the conclusion obtained for the LD narrow-beam link. Furthermore, the spatial distribution of the link gain values is consistent with the simulation pattern (Fig. 7).ConclusionsIn this study, narrow-beam light transmission through a wavy water-to-air (W2A) surface was evaluated. The physical response of the propagating photons and corresponding statistical characteristics were determined through a combination of lab experiments and theoretical simulations. We experimentally tested the LD narrow-beam link and obtained the photon-response characteristics. The test experiment reveals that, for regular waves, the photon response presents a negatively skewed distribution in the wind direction, whereas for random waves, the photon response shows a normal distribution. These statistical features imply an intrinsic dynamic correlation of the photon response with the wavy W2A surface and its driving forces. Because the LED transmitter can be treated as the integration of infinite LD lights over space, the narrow-beam link characteristics were validated using a wide-beam transmitter perspective. The simulation and real test of the LED transmitter confirm the characterization of the narrow-beam link under both regular and random waves.
Oct. 10, 2023Vol. 50 Issue 19 1905001 (2023)
Xueqiang Li, Fang Wu, Shuang Gong, and Yang Bu
ObjectiveHigh coherence is one of the characteristics of laser, which brings adverse effects to some applications of laser, so it is necessary to suppress the high coherence of laser. Rotating ground glass is the most commonly used coherence suppression method, but when the laser passes through the ground glass, the beam will be seriously scattered and the spot distribution cannot be controlled, which results in low utilization rate of light energy. Different from ground glass, random microlens array is a kind of diffuser with a structured surface. The laser is concentrated in a certain divergence angle after passing through a random microlens array, so it has high energy utilization rate. Previous studies have demonstrated that rotating random microlens arrays can be used for laser coherence suppression. However, different application scenarios have different requirements for laser divergence angle and coherence, so it is necessary to analyze the influence of rotating random microlens array parameters on laser divergence angle and coherence. In this paper, the problems are analyzed and discussed.MethodsFirstly, this paper applies the region division method of Thiessen polygon to the design of microlens array, which obtains the random microlens array with high filling ratio and random variation of sublens unit apertures. Secondly, we analyze the influence of the mean aperture and curvature radius of the sublens element on the divergence angle of the random microlens array by changing the parameters of the sublens element. Finally, we establish a laser complex coherence regulation model based on random microlens array. The modulus of complex coherence is used as the criterion of coherence intensity. We use the modulus of complex coherence as the criterion to evaluate the intensity of coherence and analyze the influence of rotation speed of rotating random microlens array on the complex coherence modulus of laser field.Results and DiscussionsThe simulation and experimental results show that in terms of divergence angle, the average aperture and curvature radius of the sublens element affect the divergence angle of the random microlens array (Fig. 5). In the simulation, the average aperture range of the sublens element is set to be 50?141.14 μm, and the radius of curvature is set to be 1?5 mm. The divergence angle of the random microlens array is 9.1?148.1 mrad. The divergence angle of the random microlens array decreases with the decrease of the mean aperture and the increase of the curvature radius of the sublens unit. In terms of complex coherence modulus, the interference fringe diagrams (Figs. 7, 8, 12, and 13) at different rotation speeds (speed range 0?4800 r/min) are obtained in simulation and experiment in this paper. The complex coherence moduli at different rotation speeds are obtained by calculating the contrast of interference fringe and measuring the ratio of double-hole aperture light intensity (Fig. 15). The modulus of complex coherence decreases with increasing rotation speed of the random microlens array. When the rotation speed increases from 0 to 4800 r/min, the total modulus reduction of complex coherence is about 96.67%. We further analyze the modulus decline trend of complex coherence by calculating the modulus decline percentage of complex coherence at every 60 r/min increase in different speed ranges (Table 2). The modulus decline percentage of complex coherence decreases from 61.52% to 1.17% when the rotation speed increases by 60 r/min, with the decline trend gradually slowing down.ConclusionsIn this paper, we design a random microlens array based on Thiessen polygon arrangement. We establish a laser complex coherence control model based on rotating random microlens array, and analyze the effects of rotating random microlens array parameters on laser divergence angle and complex coherence modulus of laser field. The simulation and experimental results show that, the average aperture and curvature radius of the sublens element affect the divergence angle of the random microlens array. The divergence angle of the random microlens array decreases with the decrease of the mean aperture and the increase of the curvature radius of the sublens unit. The average aperture of the random microlens array used in the experiment is 50 μm and the curvature radius is 1 mm. The divergence angle obtained by simulation based on these parameters is basically consistent with the measured divergence angle. In terms of complex coherence modulus, the rotation speed of the random microlens array affects the modulus of complex coherence of laser light field: the higher the rotation speed, the lower the modulus of complex coherence of laser light field. In the experiment, when the rotation speed of the random microlens array increases from 0 to 4800 r/min, the modulus of complex coherence of the laser light field decreases continuously and the total amplitude of the decline of the complex coherence modulus is about 96.67%. The modulus decline percentage of complex coherence decreases from 61.52% to 1.17% when the rotation speed increases by 60 r/min in different speed ranges. The decline trend of the complex coherence modulus gradually slows down with the increase of the rotation speed.
Oct. 10, 2023Vol. 50 Issue 19 1905002 (2023)
Xinran Dong, Zian Wang, Li Zeng, and Xiaoyan Sun
The influence of laser energy on the FBG reflection spectrum is as follows. As shown in Fig. 3(a), the higher the laser energy, the greater the red shift of the wavelength at the same exposure time. The corresponding wavelength at the exposure time of 125 s is 1549.61 nm and 1549.75 nm for the laser energy of 700 mW and 800 mW, respectively. The higher the laser energy, the higher is the reflectivity; however, the bandwidth also increases significantly. The corresponding maximum reflectivity values of FBG under the two conditions are 14.3 dB and 15 dB, respectively, as shown in Fig. 3(b). Simultaneously, the corresponding bandwidths of approximately 0.62 nm and 0.74 nm are achieved, as shown in Fig. 3(c). In addition, a higher laser energy leads to more side lobes on both sides of the main resonant peak in the spectrum, as shown in Fig.4.ObjectiveFiber Bragg gratings (FBGs) exhibit the advantages of small size, reflection operation, high sensitivity, and wavelength encoding. Further, the FBGs induced by femtosecond laser pulses have unique advantages, such as high-temperature resistance and high-temperature stability, which are particularly suitable for sensing applications under extreme operating conditions, and thus, these FBGs have been widely used in aerospace and other fields. Fabricating FBGs via phase mask technology has the merits of effective processing and high device consistency and has been demonstrated to be the most promising industrial technology scheme. However, limited research has been conducted on the spectral characteristics of FBGs. We fabricate FBGs via the femtosecond laser phase mask method and extensively study the influence of laser energy and exposure time on the wavelength, reflectivity, and bandwidth of the FBGs. The factors influencing the FBG spectrum are theoretically and experimentally analyzed. This study offers an experimental basis and guidance for the fabrication of high-quality FBG devices using femtosecond laser technology.MethodsIn this study, FBGs fabricated via the femtosecond laser phase mask method are experimentally demonstrated. The light path of the grating processing system comprises a femtosecond laser system, aperture, optical attenuator, cylindrical lens, and phase mask. The spectrum testing system comprises an amplified spontaneous emission (ASE) broadband light source and an optical fiber spectrum analyzer. The laser system outputs 800 nm femtosecond laser pulses. A diaphragm and optical attenuator are used to control the spot diameter and adjust the laser pulse energy, respectively. Meanwhile, a cylindrical lens is used to focus the light beam, and a phase mask to form interference fringes and periodic structures in the fiber, and writing the gratings. In addition, a spectral testing system is used to monitor the spectral changes of the FBG in real time. In the experiment, when the laser energy is set to 600 mW and the longest exposure time is set to 240 s, the influence of exposure time on the FBG reflection spectrum is studied. Moreover, the relationship between the spectral properties and exposure time is analyzed under laser energy values of 700 mW and 800 mW.Results and DiscussionsThe influence of the exposure time on the FBG reflection spectrum is as follows. As shown in Fig. 2(a), when the exposure time increases, the FBG reflectivity gradually increases and then remains unchanged, and the wavelength undergoes a red shift. At the initial exposure time of 20 s, the FBG reflectivity reaches 11.6 dB rapidly, and then, at the exposure time of 75 s, reaches a maximum of approximately 14.03 dB, as shown in Fig. 2(b). Meanwhile, the bandwidth of the FBG increases with the exposure time, which increases from 0.41 nm to 0.73 nm in the exposure timer ange of 5?240 s, as displayed in Fig. 2(c). The FBG wavelength has a red shift as the exposure time increases and the wavelength changes by 0.36 nm, from 1549.33 nm to 1549.69 nm, as the exposure time increases from 5 s to 240 s, as shown in Fig. 2(d).ConclusionsIn this paper, FBGs fabricated using the femtosecond laser phase-mask method are proposed. The effects of laser energy and exposure time on the wavelength, reflectivity, and bandwidth are studied. The experimental results demonstrate that to obtain FBGs with a small bandwidth, high reflectivity, and high spectral quality, appropriate laser energy and exposure time should be selected. In particular, the laser energy should not be considerably large. Considering the writing efficiency and reflection spectral quality, an excellent FBG device can be obtained by selecting the laser energy of approximately 600 mW and exposure time of less than 1 min.
Oct. 10, 2023Vol. 50 Issue 19 1906001 (2023)
Zhi Yang, Zhen Wang, Yongqian Li, and Lü Anqiang
ObjectiveOptical fiber sensing is an essential aspect of sensing technology. An optical fiber can be used as a medium through corresponding technical approaches to detect changes in the wavelength and frequency of optical signals, indirectly monitoring changes in the external environment. Because of its significant anti-electromagnetic interference ability, optical fiber sensing technology can work satisfactorily in strong magnetic environments, and it exhibits high-temperature resistance and good corrosion resistance in diverse areas such as aerospace, medical testing, civil engineering, power monitoring, and military applications. This method has received increasing attention and applications. Distributed fiber-optic sensing utilizes the nonlinear scattering properties of light as it travels through the fiber to monitor changes in the external environment, such as the temperature and pressure along the fiber. The Brillouin optical time-domain reflectometer can detect changes in the external environment by measuring the shift in the center frequency of the spontaneous Brillouin scattering spectrum of the pulsed light in the fiber. Brillouin-distributed fiber-optic sensing enables long-distance temperature and stress measurements. This technology has higher measurement accuracy and spatial resolution, and it can be applied to longer measurement distances than other sensing technologies. This technology plays a critical role in various industrial applications. Currently, extraction of the center frequency of the Brillouin scattering spectrum is typically performed according to the Lorentzian function. The frequency-sampled values ??of the Brillouin scattering spectra were measured using equally spaced frequency sweeps and fitted using a Lorentzian function. The frequency value corresponding to the center point of the Lorentz curve obtained by fitting is the center frequency of the Brillouin scattering spectrum, and the Brillouin frequency shift is obtained by subtracting the value from the frequency of the light source. The Brillouin scattering spectrum of single-frequency continuous light satisfies the Lorentz function distribution, but the Brillouin scattering spectrum of pulsed light does not satisfy the Lorentz function distribution. In other words, the spectrum of the incident signal is broadened when pulse modulation is performed, and the Brillouin scattering spectrum is also broadened. Hence, more accurate model fitting results cannot be obtained by fitting a general Lorentzian parameter model. In this study, the expression of the optical fiber Brillouin scattering spectrum function of the pulsed light signal, which significantly improves the fitting accuracy of the Brillouin scattering spectrum, was derived.MethodsIn this study, a significant fitting error was observed when the pulsed light Brillouin scattering spectrum was fitted using the traditional Lorentzian curve. Stokes light and anti-Stokes light were used as examples, and the functional expression of the fiber Brillouin scattering spectrum of pulsed light was derived via theoretical analysis. The fitting accuracy was improved using this functional expression. A Brillouin optical time-domain reflectometer was used for measurements. When the light source signal flows through the optical coupler, it is divided into two paths: one is used as the sensing branch, and the other is used as the local reference optical path. The optical signal of the sensing branch was modulated into an optical pulse with a specific repetition frequency after passing through the modulator. The optical signal reflected by the sensing branch after passing through the sensing optical fiber was differentially detected with the local reference optical path, and the signal was collected. The Lorentz fitting and pulsed light function derived in this study were used to fit the measurement results, and the fitting accuracy values were compared.Results and DiscussionsFirst, the sampling value of the Brillouin power spectrum of 500 m sensing fiber was selected. The fitting results show a significant error in the fitting of the Lorentz function, which can be significantly reduced using the pulsed light function (Fig. 3). The Brillouin scattering spectrum data were collected every 50 m of the sensing fiber to make the experimental results universal, and the scattering data of the 1000 m constant-temperature zero-strain sensing fiber were collected. The Lorentzian function and pulsed light function derived in this study were used to fit. The functions were compared based on four aspects: the sum of squares of differences, root-mean-square error, mean square error, and goodness of fit (Figs. 4?7). The experimental results show that using the pulsed light function for fitting, the difference sum of squares, root-mean-square error, and mean square error are significantly smaller than those of the Lorentzian function fitting, and the degree of fitting of the pulsed light function is significantly higher than that of the Lorentzian function. Therefore, the fitting performance of the pulse light scattering power spectral density function is higher than that of the Lorentzian function.ConclusionsThe fitting error of the Brillouin scattering spectrum using the Lorentz function is significant, and the central frequency cannot be extracted with high precision, which leads to inaccurate monitoring of external environmental changes. Through theoretical research, the Brillouin scattering power spectral density function of pulsed light was obtained, which improved the fitting accuracy. Through the Brillouin optical time-domain reflectometer sensing experiment, the measured Brillouin scattering spectrum data were fitted using different methods, and the fitting was obtained using the pulsed-light Brillouin scattering power spectral density function. The higher the fitting accuracy, the more accurate would be the parameter estimation and the smaller would be the error. This study can provide valuable information for applying and developing distributed optical fiber sensing.
Oct. 10, 2023Vol. 50 Issue 19 1906002 (2023)
Mengyang Zhao, Ruihong Gao, Qiangtao Zhang, and Ziren Luo
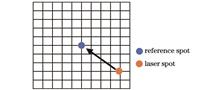
ObjectiveThe space-based gravitational wave detection mission needs to realize the construction of ultra-long distance (3×10⁶ km) laser link between two satellites through the laser acquisition and pointing system, and realize the capture precision of 1 μrad and the pointing jitter control of 10 nrad/Hz at 1 mHz?1 Hz. The laser power becomes very small after being transmitted over millions of kilometers. Ultra-long distance, ultra-low power and high precision requirements make the laser link construction process of Taiji program a great challenge. In order to realize the networking of three satellites, the whole laser link construction process needs to establish three bidirectional laser links in turn. Space-based gravitational wave detection proposes a scheme to gradually build a bidirectional laser link by using three-level detectors of star tracker (STR), complementary metal oxide semiconductor (CMOS) capture camera and quadrant photodiode (QPD), and finally realize the ultra-stable laser pointing jitter control through the high-precision attitude information measured by the differential wavefront sensing (DWS) technology. At present, the scheme is in the stage of theoretical demonstration. In order to test the scheme, we adopt the laboratory’s laser acquisition and pointing integrated optical system and a card based on a ZYNQ chip, and expect to realize autonomous control of the whole laser link construction process.MethodsWe use ground optical experiment to simulate the actual laser link construction progress between two satellites under the laboratory conditions. The whole experiment includes two optical benches which are actually realistic restoration of Taiji program acquisition and pointing light path (Fig. 3), and they are respectively mounted on two hexapod displacement tables to simulate the adjustment of satellite attitude. To fully simulate the whole progress of the actual laser link construction, the ground optical experiment is divided into four stages: initialization, coarse acquisition, fine acquisition and laser pointing. According to the scheme of laser link construction, we design the whole progress flow control, spiral scanning control, spot centroid location and closed-loop control by Verilog, and verify every module separately. And then we use ZYNQ card to control the whole experiment.Results and DiscussionsThe experimental results show that the bidirectional laser link is successfully constructed in the atmospheric environment. Finally, corresponding to the wavefront of the actual system’s telescope, the acquisition precision reaches 0.07 μrad and the control accuracy of the final laser pointing control process reaches 9.7 nrad/Hz in the sensitive frequency band of the Taiji program, which can meet the task requirements. The main influencing factors of the spot centroid control effect in the fine acquisition stage are the calibration error during the DWS calibration and the position error caused by the long-term drift of the manual four-axis displacement table. The internal stress change of the manual four-axis displacement table results in a large difference between the actual displacement table position and the position calibrated before the experiment in the pitch and yaw directions, which causes the position of the spot centroid during the experiment to deviate from the zero point of the hexapod displacement table. And the main factor affecting the control accuracy during the laser pointing stage is the background noise. By collecting the DWS data without controlling the hexapod displacement table when the platforms are aligned, it is found that the laser pointing precision is close to the background noise level (Fig. 13). Therefore, the background noise is the main noise source, which includes atmospheric fluctuation, temperature shift and environmental vibration.ConclusionsThis paper describes the basic composition of the control system in detail for the ground simulation experiment of building the Taiji program inter-satellite laser link, and completes the overall design and board level implementation of the entire acquisition and pointing integrated experimental control system. In this paper, the receiver and scanner are tested at different starting locations, and the data in the final laser pointing control stage are analyzed. It can be found that the experiment can complete the bidirectional laser link construction process for the platforms of receiver and scanner at different starting positions, and the control effect of the final pointing stage meets the requirements of the Taiji program. The experiment successfully verifies the feasibility of the laser link construction scheme, which meets the acquisition accuracy and the pointing jitter control accuracy in front of the telescope. It provides an experimental support for further ground simulation experiments. It also provides a basis for the realization of on-board control system of the laser link construction of Taiji program in the next step, and plays an important role in transferring the scheme from theoretical demonstration to engineering implementation.
Oct. 10, 2023Vol. 50 Issue 19 1906003 (2023)
Qingyu Pan, Chao Wang, Jiawei Ren, Dapeng Wang, and Yijun Zhu
ObjectiveSingle-Photon Avalanche Diode (SPAD) array detectors are commonly used for the ranging and three-dimensional imaging of long-range targets in space. In the application of detection with SPAD devices, the detection system generally selects a high-repetition-frequency detection system to obtain photon data quickly. Currently, random sequence coding is primarily used to suppress the range ambiguity effect caused by a high repetition frequency. To meet the requirements of fast target detection under the conditions of a long distance and large field of view, more complete target information must be obtained through multiple parallel SPAD detection pixels. For an SPAD array with a large array structure, any photon signal reaching the receiver surface can cause an equivalent photocurrent response. The return signal received by a certain element may originate from several different transmission signals, which may affect the array detection results. To effectively distinguish the array pixels at the receiver, the coding waveforms in each period should not interfere with each other, and numerous random coding sequences are required to be orthogonal to each other. Because of factors, such as waveform duration and hardware system accuracy, the coding sequences in the actual system have a certain degree of correlation. In addition, the optical signal is non-negative, and the power is only superimposed but not offset. The cross-correlation responses among the array elements accumulate, which interferes with the identification of correlation peaks, resulting in false detection alarms and result misjudgment. Therefore, identifying a random sequence with a strong anti-interference ability to encode an SPAD array is required for highly accurate detection.MethodsThe basic principle of using random coding to solve the range ambiguity problem in a single-photon detection system is introduced, and the coding structure and correlation characteristics of pseudo-random, true random, and chaotic sequences are compared and analyzed. Owing to the fixed coding length and form, pseudo-random sequences represented by m-sequences cannot generate codes of a given length according to the design requirements, and even longer coding sequences might need to be chosen. A long coding sequence inevitably leads to long encoding processing and receiving times, which has a significant impact on the delay in array detection. Although the true random sequence has a strong anti-crosstalk ability, its unpredictable and unrepeatable characteristics require a high-quality physical entropy source, which is limited in this application scenario. Chaotic sequences exhibit strong random and anti-interference characteristics. Their length is not limited by a fixed format and can be adjusted according to the greatest distance from the target, which can better meet the coding requirements of large-scale SPAD array detection. Through the simulation and analysis of the coding structure and correlation of various chaotic sequences, the application advantages of the improved logistic coding in large-scale spatiotemporal arrays were verified. Given the possible dynamic degradation of single-stage chaotic sequences, a compound logistic sequence is designed as the encoding method for the space-time array according to the range change of the Lyapunov exponent.In array-coded detection, the autocorrelation of sequences is an important index that affects the detection ability of a single array element, and the cross-correlation reflects the interference intensity between different detection elements. The Peak Side Lobe Ratio (PSLR) is typically used as an index to evaluate coding correlations within an array. However, the PSLR cannot be used to quantitatively compare the effect of cross-correlation accumulation on autocorrelation results in arrays. To quantify the effect of cross-correlation accumulation on the recognition of autocorrelation peaks in arrays, we established the concept of Peak Side-Lobe Difference (PSLD) to represent the normalized difference between the correlation peak and the maximum side-lobe value.Results and DiscussionsFor encoding requirements of large-scale arrays, we set up a selection basis function based on PSLD, and use this function to filter the generated chaotic sequences to ensure that they can meet the anti-interference requirements of the desired array size. Because of the tediousness of calculating cross-correlations between arrays, a fast method for selecting available encoding sequences is provided by simulating and testing the changes in the autocorrelation PSLD and cross-correlation PSLD for multiple sets of sequences. Combined with the application requirements for long-range detection, a specific flow of large-scale SPAD array coding is provided.In order to meet the detection requirements of larger arrays, combined with the application requirements of long-range detection, the specific process of large-scale SPAD array encoding using traversal testing method is given. The codes used are filtered by PSLD, and each element can use a relatively fixed coding sequence, which makes the proposed scheme more advantageous in engineering implementation.ConclusionsIn order to meet the encoding requirements of large-scale SPAD arrays, through the comparative analysis of the number of encoding, generation efficiency, format length, correlation properties of various random sequences, this paper points out the advantages of improved Logistic encoding in large-scale SPAD arrays. Based on the variation of Lyapunov index range, a composite Logistic sequence is designed as the encoding method of large-scale SPAD arrays. At the same time, considering the requirement of no interference between the elements, the suitable relationship between the generated sequence and the size of the array and the optimal selection scheme are given. Next, we will focus on the design of appropriate chaos cascade based on the actual detection needs, and continue to explore better random coding schemes.
Oct. 10, 2023Vol. 50 Issue 19 1906004 (2023)
Yaxin Wang, Baojian Wu, Biao Guo, Wei Yan, Yu Tang, Feng Wen, and Kun Qiu
ObjectiveWith the rapid development of modern communication networks, high-order modulation formats such as quadrature phase shift keying (QPSK) and quadrature amplitude modulation (QAM) have been utilized widely for large capacity and high-speed data transmission. However, signals in such modulation formats are easily degraded by channel crosstalk and amplified spontaneous emission (ASE) noise relative to binary signals. In this case, all-optical regeneration technology is helpful to improving optical signal-to-noise ratio (OSNR) directly in the optical domain. All-optical amplitude or phase regeneration can be usually achieved by some optical configurations with nonlinear effects, such as Mach-Zehnder interferometer (MZI), nonlinear optical loop mirror (NOLM), phase sensitive amplifier (PSA) and semiconductor optical amplifier (SOA). In the process of all-optical amplitude regeneration, the conversion of amplitude noise to phase disturbance is always introduced to certain extent. For this reason, phase-preserving amplitude regeneration (PPAR) schemes for QPSK or QAM signals are put forward. Unfortunately, there still exists phase disturbance (larger than 3.8°). The objective of our work is to present a perfect PPAR scheme with very low phase disturbance (close to 0°), especially by silicon-based MZI regeneration chips.MethodsMost of amplitude regeneration schemes are able to be modeled by a MZI configuration. In this paper, we propose a phase-preserving regeneration scheme of MZI cascading optical phase conjugator (OPC-MZI) to preserve the optical phase of input signals with very low phase disturbance. By analyzing the transmission characteristics of the input signals in the whole cascade system, the silicon-based MZI regeneration chip is designed and optimized as a regeneration unit. Then, the power and phase transfer characteristics of three different regeneration schemes based on the same designed silicon-based MZI regeneration chip are compared. Further, the feasibility of OPC-MZI phase-preserving regeneration scheme is verified by simulation on the QPSK modulation signals. Finally, the optical light field output from the OPC-MZI phase-preserving regeneration scheme is derived, and is utilized to explain the phase preserving mechanism from two aspects of amplitude and phase. In addition, we discuss the influence of the loss coefficient of silicon wire waveguides on phase-preserving amplitude regeneration.Results and DiscussionsFor OPC-MZI phase-preserving regeneration scheme (Fig. 1), we optimize the structural parameters of silicon-based MZI chip by the power transfer function (PTF) and amplitude-to-phase conversion curves. The phase preserving performance of OPC-MZI phase-preserving regeneration scheme is analyzed from both amplitude and phase. It is shown that the OPC-MZI phase-preserving regeneration system has a phase disturbance close to 0° at every working point, that is, the so-called perfect phase preserving can be well achieved (Fig. 5). Further, the feasibility of OPC-MZI phase-preserving regeneration scheme is verified by simulation on the QPSK modulation signal. The parameter of noise reduction ratio (NRR) is defined as the ratio of the input to output error vector magnitudes (EVMs). The simulation results show that, in comparison with the single MZI regeneration chip (Figs. 7 and 8), when the input signal-to-noise ratio (SNR) is 16 dB, the OPC-MZI phase-preserving regeneration scheme has a larger NRR by 1 dB and the phase disturbance is also reduced to 0.07°. Finally, we discuss the applicability of the OPC-MZI phase-preserving regeneration scheme when the loss coefficient of silicon wire waveguide increases. It should be pointed out that, when the working points between two MZI regeneration units perfectly match with each other, the perfect phase preserving performance can still be achieved even if the waveguide loss coefficient is increased (Fig. 10).ConclusionsTo further eliminate the residual phase disturbance of PPAR schemes available now, we propose a phase-preserving regeneration scheme of OPC-MZI, capable of perfectly preserving the optical phase of input signals. In order to analyze the phase preserving performance of OPC-MZI regeneration scheme, a silicon-based MZI regeneration chip is designed and optimized as the cascade regeneration unit, and the input power at the first working point is set to 0.564 W. Among three regenerators considered here, the OPC-MZI phase-preserving regeneration scheme has a minimum phase disturbance of 0.1° at the first working point, much better than the single-MZI chip scheme and the MZI cascading optical amplifier (OA) scheme. Then, we simulate the OPC-MZI phase-preserving regeneration scheme for QPSK modulation signals. The simulation results show that, at the input SNR of 16 dB, the OPC-MZI phase-preserving scheme has a larger NRR and the phase disturbance is also reduced to 0.07° compared with the single MZI regeneration chip. At the end of this paper, the phase preserving mechanism of OPC-MZI regeneration scheme is analyzed, and the universality of cascade OPC regeneration scheme is also pointed out.
Oct. 10, 2023Vol. 50 Issue 19 1906005 (2023)
Chengzhen Bian, Chen Wang, Bohan Sang, Kaihui Wang, Junjie Ding, Bowen Zhu, Lei Shen, Lei Zhang, Ruichun Wang, Changkun Yan, Bo Liu, and Jianjun Yu
ObjectiveWith the rapid growth of internet traffic, the demand for large transmission capacities from all walks of life has grown dramatically. The current transmission capacity of a single-mode fiber (SMF) in a fiber optic transmission system is rapidly approaching the Shannon limit. Solving the transmission capacity problem has become a top priority. One method to solve this problem is to apply mode-division multiplexing (MDM). In MDM, multi-mode fibers have severe intermodal dispersion and large nonlinear impairment; this is less effective for long-haul transmission. Few-mode fibers have less intermodal dispersion and more potential for long-haul fiber optic communications. Currently, China is catching up in the field of MDM and mainly adopts the intensity modulation direct detection (IMDD) method for experiments that is not suitable for long-distance transmission. The number of modes used in the studied MDM system is small; this has a limited effect on improving the capacity of the communication system. This study adopts polarization multiplexing and advanced digital signal processing technologies to construct a single-channel mode division multiplexing optical fiber transmission system based on an in-phase quadrature (IQ) modulation heterodyne coherent detection system. We successfully realize a 1000 km transmission of 32 Gbaud 16 quadrature amplitude modulation (QAM) signals in two degenerate modes, LP11a and LP11b. After equalization using the time-domain and frequency-domain multiple-input multiple-output least mean square (MIMO-LMS) algorithms, the bit error rate (BER) is lower than the soft-decision forward error correction (SD-FEC) threshold (5.2×10⁻²).MethodsAt the transmitter side, external cavity lasers (ECL) generate light wave. The generated continuous light wave is modulated by a 16QAM signal through an IQ modulator. The 16QAM signal loaded into an arbitrary waveform generator (AWG) is generated offline using MATLAB. The modulated signal is divided into two paths by a polarization beam splitter (PBS) and transmitted in the polarization-maintaining fiber. One path passes through the delay line and is then combined with the other path by a polarization beam combiner (PBC) to complete polarization multiplexing. The polarization-multiplexed signal is amplified in the erbium-doped fiber amplifier (EDFA) and divided into two paths together through a 1×2 coupler equal. One path is decorrelated through a delay line with a length of 3 m and delay time of 15 ns and then injected into the fiber for transmission. The fiber optic link adopts a loop structure in which the loop switch is controlled by two acousto-optic modulators (AOM). Long-distance transmission is achieved by setting the AOM to control the number of transmission turns of the multiplexed signal in the loop. The signals are modulated into the LP11a and LP11b modes by the mode-multiplexing module, and the signals under the two modes are jointly transmitted in the few-mode fiber (FMF). The signals enter the mode-demultiplexing module through a few-mode fiber and are boosted using an EDFA. Owing to the insertion loss of the AOM switch and coupler, the signals must be amplified by the EDFA after entering the optical fiber loop. We solve the problem of the uneven gain of EDFAs by adopting a wavelength selective switch (WSS). The output of the WSS is sent back to the mode multiplexer to conduct MDM and 50 km FMF transmissions again until the total transmission distance can meet our requirement. On the receiver side, a coherent optical receiver conducts heterodyne detection on the output signal and performs digital signal processing (DSP). In offline DSP, the received electrical signal is first processed by frequency-domain dispersion compensation, and the compensated signal is then downsampled. Quadruple signal rate is preserved for clock recovery during downsampling. After clock recovery, the signal is downsampled again and the original signal is recovered by the MIMO-time domain (TD) LMS, MIMO- frequency domain (FD) LMS, carrier phase recovery, detection-directed LMS (DDLMS) algorithms. Finally, the BER calculation is performed for the signal.Results and DiscussionsFigure 2 shows the BERs of the two modes measured under different OSNR conditions compared with the additive white Gaussian noise (AWGN) channel simulation results. In the case of a low signal to noise ratio (SNR), the BER is close to the theoretical channel result, whereas in the case of a high SNR (about 20.5 dB), the BER is 1×10⁻² that is 2.5 dB away from the theoretical value. Figure 3 shows the BERs of the two modes after 1000 km transmission under different input fiber powers. In the case of different input fiber powers, after 1000 km transmission, the BERs of both the LP11a and LP11b modes can meet the SD-FEC threshold (5.2×10⁻²). Because the indices of refraction of LP11a and LP11b are close, the BERs of the different modes show little difference. As shown in Fig. 4, the two modes exhibit similar performance at all transmission distances and both can meet the SD-FEC threshold (5.2×10⁻²).ConclusionsIn this study, we experimentally build a dual-mode polarization-multiplexed 16QAM signal 1000 km few-mode fiber transmission system based on heterodyne coherent detection. At the receiving end, the MIMO-TDLMS and MIMO-FDLMS algorithms are used for channel equalization, and a single-channel 512 Gbit/s transmission rate is achieved. The BER can meet the SD-FEC threshold (5.2×10⁻²), and the corresponding net data rate is 400 Gbit/s. Although achieving longer transmission distances requires improved mode-dependent losses in the links, the results confirm the potential of few-mode fibers for future high-capacity long-distance transmission systems.
Oct. 10, 2023Vol. 50 Issue 19 1906006 (2023)
Wenjing Zhou, Anqi Li, Zhenkai Chen, Guanghua Li, Liang Qu, and Yingjie Yu
ObjectiveNumerous murals containing abundant historical information have been preserved in the ancient architectural structures in our country. However, these murals have suffered varying degrees of damage after thousands of years, such as the formation of surface and subsurface cracks and voids. Optical inspection techniques, such as spectral analysis and imaging technology, are widely used in the restoration and preservation of cultural relics. However, these methods involve chemical composition analysis or primarily provide two-dimensional images, which cannot fulfill the demands of micro-defect detection. Digital holography enables three-dimensional surface profiling. Digital holography combined with excitation can be utilized for the detection of surface and subsurface defects in murals. Therefore, a portable deformation detection system based on digital holography is designed herein to meet the needs of in-situ defect detection in murals. The developed detector combined with acoustic sweep excitation is applied to the in-situ detection of defects in murals at the Palace Museum, Beijing. Combined with acoustic sweep excitation, this study confirms that digital holography can be used to determine the status of damage of the surface and subsurface of cultural relics through non-destructive methods. This research is conducive to the diagnosis of damage in cultural relics, as well as for analyzing defect formation and predicting defect growth, thereby providing a scientific basis for the restoration and protection of cultural relics.MethodsBased on the principle of holographic interference on diffuse reflection surfaces, a portable deformation detection system was designed. First, an aluminum plate, the surface of which was coated with white particulate paint, was selected as the experimental sample. Holograms of the surface of the aluminum plate were captured after applying force excitation. After applying filtering techniques to the digital hologram and extraction algorithms to the deformation fringe phase, the feasibility of the technique and capability of the system for quantitative analysis were validated. With the combination of acoustic sweep excitation, experiments were conducted on mural samples and interior architectural wall samples to inspect the internal defects. Deformation fringes corresponding to surface and subsurface defects were obtained, confirming the effectiveness of the frequency sweeping excitation method using acoustic waves. The portable deformation detection system based on digital holography combined with acoustic excitation was used to analyze the murals at the Palace Museum in Beijing. In-situ micro-defect detection was performed on the western and southern walls of Ru Ting. Gaussian 1σ criterion and histogram segmentation methods were applied to eliminate the overall background phase from the deformation fringe phase to obtain a three-dimensional distribution of the defects in order to analyze the locations and contour features of the defects.Results and DiscussionsFirstly, theoretical analysis is used to prove that the principle of digital holographic interference on diffuse reflection surfaces is reasonable for extracting out-of-plane deformation data. Feasibility verification using aluminum plate samples reveals that the three-dimensional distribution of deformations could be quantified. The experimental system enables quantification of the out-of-plane deformation (Fig. 5). Combined with acoustic sweep excitation, sub-surface defects in mural samples and interior architectural wall samples are effectively detected. Different defects, such as voids and cracks, show distinct abnormal fringe patterns (Fig. 9, Fig. 13). In-situ micro-defect detection was performed on the murals on the southern and western walls of Ru Ting at the Palace Museum. By using phase extraction and spherical aberration phase elimination algorithms to determine the phase distribution of the deformations, the three-dimensional defect distribution could be determined. Visible cracks, paint peeling, and shallow-level defects such as micro-cracks, fractures, and voids are detected in the mural on the southern wall (Fig. 16). The main defects in the western wall mural are subsurface cracks and hollow spots. These results also prove that conventional sounds such as those made by tourists are still harmful to cultural mural relics (Fig. 17).ConclusionsA deformation detection system is designed herein based on the principle of digital holographic imaging of a diffuse reflection surface, combined with the acoustic excitation method. The system is successfully applied to the detection of defects in real murals at the Palace Museum, providing information about the locations and contours of the defects. The system is capable of detecting real-time micro-defect-induced deformations on the diffuse reflection surface. The acoustic excitation method offers controllable parameters and simple operation, while being a non-contact approach. By processing holograms and applying background phase elimination algorithms, defect characteristics such as positions and contours can be extracted from the overall deformation phase, enabling accurate identification of defects. This study demonstrates that the portable holographic deformation detection system, in combination with acoustic sweep excitation, can effectively detect defects such as voids, cracks, and holes on mural artifacts. This system provides a scientific basis for diagnosing the health of mural artifacts, as well as for restoration and preservation. In future work, we will further investigate the effective range and safety threshold of acoustic wave excitation for detecting defects in cultural relics. We will also consider the spatial and ground conditions of structures like Ru Ting at the Palace Museum to design a high-precision scanning and stitching method for capturing holograms of the entire mural, focusing on detecting defects in the subsurface within a large area.
Oct. 10, 2023Vol. 50 Issue 19 1909001 (2023)
Yichong Zhu, and Yuan Ji
ObjectiveMicro-display is an important interface connecting the real world and the metaverse world. Compared with other types of micro-displays, organic light emitting diode (OLED) on silicon micro-displays have the advantages of high resolution, high integration, low power consumption, small size, and light weight, and they have become the preferred choice of near-eye display devices. Compared with traditional OLEDs-on-silicon driven by analog signal, OLED-on-silicon micro-display driven by digital signal has obvious advantages in ultra-high-definition display. Driven by users’ demand for immersive experience of virtual reality (VR) and other near-eye display devices, near-eye displays are developing towards high resolution and high frame rate. However, this brings the problem of excessive video data transmission to the micro-display system. In order to give users a higher definition and smoother near-eye display experience, it is urgent to propose an image compression algorithm for micro-displays to solve the problem of excessive video data transmission.MethodsSince the lower 4 bit-planes of the 19-bit-plane image reflect the details of the image and are difficult to compress, just-noticeable difference (JND) theory is introduced. In recent years, scientific research has shown that the distribution of visual acuity is asymmetric in the whole fovea range, and the human visual system has horizontal-vertical anisotropy (HVA) and vertical-meridian asymmetry (VMA). To make the JND model more consistent with the characteristics of human vision, this paper carries out psychological experiments on the luminance, contrast and foveated masking characteristics of human vision, and constructs an asymmetric elliptical foveated JND (AE-FJND) model based on the experimental results. Combined with the JND model, a corresponding bit-plane image compression algorithm is proposed. The data of the lower 4 bit-planes are processed within the JND threshold range, and then all-bit-plane images are compressed. The algorithm can compress the image without affecting the subjective perception of the human eyes. The algorithm is compared with the previously proposed compression algorithms in the following aspects: the subjective feeling of the compressed image is evaluated by the definition of the enlarged image in the center of the image, the quality of the compressed image is assessed by peak signal-to-noise ratio (PSNR), fovea PSNR (FPSNR), structural similarity (SSIM) and other evaluation indicators, and the compression performance of the algorithm is rated by compression rate.Results and DiscussionsThe accuracy of the proposed AE-FJND model is verified by experiments. Subjective experiments showed that compared with the other two types of JND models, the AE-FJND model got a higher subjective score. For the same subjective score, the AE-FJND model can calculate more visual redundancy (Table 3). Objective experiments showed that the AE-FJND model had less noise distribution in the foveated area, and the amount of noise injected into the upper part of the image was greater than that in the lower part, which is consistent with the visual characteristics of human HVA and VMA (Fig.9). It can be seen from the enlarged image of the center area after noise pollution that the AE-FJND model has a high definition of the center area after noise pollution, and the result is similar to the original picture (Fig.10). In addition, the compression effect of the proposed image compression algorithm is verified. This algorithm can solve the problem that the lower 4 bit-planes cannot be compressed (Fig.12 and Table 4). The image compressed by this algorithm can maintain the same definition as the original image at the center of the image (Fig.13). Compared with a comparable compression algorithm, this algorithm can calculate more visual redundancy without affecting the subjective perception of vision, and the compressed image quality is better. In addition, the compression rate is lower than that of the comparable algorithm, which can reach 39.573%, indicating that the compression performance is better (Table 5). Compared with another compression algorithm, the proposed algorithm has higher PSNR and SSIM, and lower compression rate, which shows that this algorithm can not only ensure image quality, but also compress the image to a greater extent (Table 6).ConclusionsIn order to solve the problem of excessive video data transmission in high resolution and high frame rate micro-displays, this paper proposes an algorithm to compress the video data by bit-plane according to the scanning mode of digitally driven OLED-on-silicon micro-displays. Since the lower 4 bit-planes of the 19-bit-plane image reflect more details of the image and are difficult to be further compressed, the JND theory is introduced, and the two visual characteristics of the human eye, namely, HVA and VMA, are considered. An AE-FJND model is proposed, which is more consistent with the visual redundancy characteristics of the human eyes. Based on this model, a corresponding bit-plane image compression algorithm is proposed, which performs JND processing on the data of the lower 4 bit-planes, and then performs white-black-block-skip (WBBS) coding compression on different bit-planes respectively. According to the compression algorithm, the corresponding OLED-on-silicon micro-display controller is designed, and the OLED-on-silicon micro-display is successfully driven on the field programmable gate array (FPGA) platform. The bit-plane image compression algorithm based on this model can compress the image to a large extent without affecting the subjective feeling of the human eye. The average image compression rate can reach 39.573%, providing a relatively preferred solution to the problem of excessive data transmission faced by VR devices in the metaverse world.
Oct. 10, 2023Vol. 50 Issue 19 1909002 (2023)
Jinchang You, Lianghong Yu, Yijie Sun, Chao Fan, Xiaobo Zhang, Bo Yao, and Xiaoyan Liang
ObjectiveFocused light field parameters are the core indices for the interaction experiments between ultra-intense ultrashort lasers and matter, and they are also a prerequisite for correcting wavefront distortion and optimizing the focusing performance via adaptive optics. Presently, several studies introduce the parameters of ultra-intense ultrashort laser devices. However, from an application perspective in physical experiments, there are very few reports on the sampling and measurement of the laser wavefront and focal point under vacuum conditions. In this study, a scheme for sampling and measuring the focused light field in a target chamber under vacuum conditions and exposure to a 10 PW laser device is presented. Through the fixing of some elements on the translation table, switching between parameter measurements and physical experiments is realized. Moreover, the measurement system has a high measurement accuracy and provides more accurate laser parameters for physical experiments.MethodsThe optical path of the sampling measurement system was designed and built. First, according to the wide spectrum characteristics of the laser pulse, an achromatic objective lens and a large-aperture achromatic lens were used to reduce the chromatic aberration that may be introduced by the system. Second, to ensure the optimality of adaptive optical wavefront correction, an image transfer system was designed to ensure the occurrence of an object-image conjugate relationship between the deformable mirror and wavefront detector. Subsequently, an ideal light source was used to calibrate the wavefront distortion introduced by the sampling measurement system. Finally, the focused light field in the target chamber was measured and optimized under air and vacuum conditions.Results and DiscussionsAfter completing the optical path, a semiconductor laser output from the optical fiber is used as the ideal light source to calibrate the sampling measurement system. The peak-valley (PV) value of the light source is 0.102 μm, and the RMS value is 0.014 μm, which is close to the measurement limit of the four-wave shear interferometer device. The size of point light source is 5.5 μm±0.5 μm, and the measured far-field focusing size is approximately 60 μm after 10 times magnification, which is close to the diffraction limit (Fig.4). Subsequently, wavefront measurements of the main laser are conducted under air and vacuum conditions before undergoing correction, and the difference in the results shows the necessity of vacuum sampling measurement (Fig.5). The wavefront correction of the 10 PW laser pulse is performed using a sampling optical path system. The deformable mirror (520 mm) reduces the peak-valley (PV) value to 0.5 μm and the root-mean-square (RMS) value to 0.07 μm. Under the same correction voltage, the laser focus point closest to the diffraction limit can be obtained under both air and vacuum conditions (Fig.6).ConclusionsIn this study, a sampling measurement system is designed and built to measure the laser-focused light field in vacuum. The design and calibration results show that the system introduces minimal chromatic aberration and wavefront distortion, and it can accurately measure the wavefront distortion and intensity distribution of the laser focal field. The results of the wavefront measurement in air and in vacuum using the 10 PW main laser show that the wavefront distortion measured by this system in vacuum is essentially consistent with that in air, and the slight difference in the Zernike coefficient indicates the necessity of the system. Using this system, the wavefront of the 10 PW laser pulse focus point is measured and corrected under air and vacuum conditions, and the focus point closest to the diffraction limit is obtained, which proves the effectiveness of the sampling measurement system. In summary, the proposed system can accurately measure the wavefront distortion and intensity distribution of a 10 PW laser focal field under physical experimental conditions and perform wavefront correction through an adaptive optics system to improve the laser focusing performance. It also provides accurate laser parameters and extreme physical conditions for investigating the interactions between strong light and matter.
Oct. 10, 2023Vol. 50 Issue 19 1901001 (2023)
Minghang Xu, Kun Liu, Hong Zhao, Dayong Zhang, Liming Zhang, and Runze Long
ObjectiveA wavelength-tunable 1-μm ultrashort-pulse fiber laser can be used not only in laser spectroscopy, optical measurements, biomedicine, and other fields, but also as a seed source in the field of ultrashort-pulse solid-state lasers to accurately match the emission peaks of different gain media. Currently, ultrashort-pulse fiber lasers mainly rely on mode-locking techniques such as nonlinear polarization evolution (NPE), nonlinear amplifying loop mirrors (NALMs), and semiconductor saturable absorption mirrors (SESAMs). Wavelength-tunable 1-μm ultrashort-pulse lasers can be constructed by adding corresponding wavelength-tunable items such as interference items, gratings, and bandpass tunable filters. However, these add complexity and cost to the system. This study utilizes the characteristics of gain saturation amplification related to chirp pulses to realize a wavelength-tunable 1-μm polarization-maintaining (PM) ultrashort-pulse fiber laser based on a pump beam splitting structure. The wavelength-tunable 1-μm ultrashort-pulse fiber laser is relatively simple in structure and has the ability to adjust the central wavelength continuously and accurately, which can match the emission peaks of gain crystals such as Yb∶YAG, Yb∶CaF2, and Yb∶Lu2O3. The proposed laser is expected to provide a more compact, portable, and stable seed light source for ultrashort-pulse solid-state lasers.MethodsBased on the pump beam splitting structure, an innovative wavelength-tunable ultrashort-pulse fiber laser is realized using the gain saturation amplification effect of chirp pulses. The laser consists of an ultrashort-pulse fiber oscillator, energy controller, and ultrashort-pulse fiber amplifier, which is driven by a semiconductor laser based on a beam-splitting structure. Controlling the chirp pulse energy injected into the amplifier enables the amplifier to operate in a gain-saturation or non-saturation state, and the central wavelength of the laser can be accurately adjusted.Results and DiscussionsWhen the laser diode (LD) power is increased to 364.5 mW, which corresponds to pump power of 72.6 mW and 291.9 mW for the oscillator and amplifier, respectively, stable ultrashort pulses are obtained at a repetition rate of 36.23 MHz for the ultrashort-pulse fiber laser. When the energy controller is adjusted, the center wavelength of the ultrashort-pulse laser can tune from 1030.0 nm to 1034.5 nm with a spectral width of >13.1 nm. The corresponding output power changes from 50 mW to 156 mW, and the Fourier transform limited (FTL) pulse widths over the entire wavelength tuning range are approximately 100 fs (Fig. 3). When the output power is 50 mW, the central wavelength of the output spectrum is exactly 1030 nm, which accurately matches the emission peaks of Yb∶YAG and Yb∶CaF2. When the output power is 100 mW, the central wavelength is exactly 1032 nm, which is consistent with the emission peak of Yb∶Lu2O3. Notably, the signal-to-noise ratio (SNR) of the ultrashort pulses at each wavelength is greater than 55 dB, indicating that the ultrashort-pulse fiber laser has very high stability. In addition, when the output power is 50, 100, and 156 mW, the corresponding pulse width is 7.1, 7.2, and 7.5 ps, respectively (Fig. 4). Because of the stable passive mode-locking and PM fiber structure, the obtained 1-μm ultrashort-pulse laser exhibits good power stability. When the output power is 156 mW, the relative jitter is as low as 0.1% within 5 h (Fig. 5).ConclusionsThis study utilizes the characteristics of gain saturation amplification related to chirp pulses to report a wavelength-tunable 1-μm PM ultrashort-pulse fiber laser based on a pump beam splitting structure. Adjustments to the chirp pulse energy injected into the amplifier enable the amplifier to operate in a gain-saturated or non-saturated state, whereby the laser produces wavelength-tunable pulses from 1030.0 nm to 1034.5 nm at a spectral bandwidth of >13.1 nm. Over the entire tuning range, the SNR of the amplified pulses exceeds 55 dB and the pulse width changes from 7.1 ps to 7.5 ps. In addition, because of the PM architecture, the 1-μm ultrashort-pulse laser source exhibits good long-term power stability of as low as 0.1%. The output wavelength of the laser can accurately match the emission peaks of gain crystals such as Yb∶YAG, Yb∶CaF2, and Yb∶Lu2O3. This laser system can serve as a more compact, portable, and stable seed source for ultrashort-pulse solid-state lasers based on various gain crystals such as Yb∶YAG, Yb∶CaF2, and Yb∶Lu2O3.
Oct. 10, 2023Vol. 50 Issue 19 1901002 (2023)
Hui Tang, Ruidong Li, Yonggang Zou, Kun Tian, Yujun Guo, and Jie Fan
ObjectiveSemiconductor lasers with compact structure, long life, high electro-optical conversion efficiency, and direct modulation are ideal for many traditional applications. The rapid development of intelligent sensing technology and the replacement of core devices have resulted in higher performance requirements of narrower spectral linewidth and higher output power for such lasers. The typical solution for realizing narrow-linewidth semiconductor lasers is the implementation of buried gratings. However, the necessary secondary epitaxial growth in the fabrication is difficult and time-consuming; it also leads to increased fabrication cycle time and cost of the device. The use of surface gratings in the devices has been proposed to address this issue. Prior studies indicate that distributed feedback (DFB) lasers based on surface gratings exhibit excellent operating characteristics [e.g., high power, narrow linewidth, large side-mode suppression ratio (SMSR), and small temperature drift]. In general, increasing the ridge width is a relatively straightforward method of increasing the output power of the device. However, for wide-ridge DFB lasers, additional high-order transverse mode suppression mechanisms must be introduced to ensure single-mode high-power operation of the device. An unstable cavity laser is the combination of unstable resonator and wide stripe semiconductor laser, which renders the device as exhibiting high lateral mode selectivity. Consequently, it can provide good linewidth in broad area lasers. However, the structures of unstable cavity semiconductor lasers are diverse and complex, with most using electron beam lithography, holographic lithography, multi-step etching, secondary epitaxy, and other processes. This results in high manufacturing costs and difficulties; thus, its practical implementation and engineering are challenging. The structural design and characteristic optimization of novel unstable cavity laser are vital and of practical significance for the performance improvement and application expansion of semiconductor lasers. This study examined an unstable cavity semiconductor laser with high-order curved gratings. The use of curved grating with a wide current injection region increases the loss difference between different oscillation modes and improves the mode discrimination such that it can obtain greater gain and power than the conventional narrow-ridge fundamental transverse mode lasers.MethodsThere are four main aspects to the methodology employed. 1) The device adopts a wide ridge structure for high power output of the device. The broad-area ridge structure enables the fundamental mode in the cavity to exhibit a larger mode volume, which facilitates the extraction of increased gain and power than conventional narrow-ridge fundamental transverse mode lasers. Moreover, the broad-area ridge reduces the power density and thermal load of the device and improves the stability of the laser. 2) Through the setting of the gain and non-gain regions on the ridge, the high-order side mode is suppressed. The parameters of current injection/non-injection regions in the ridge are set to suppress high order lateral modes. Further, the energy of the fundamental mode distributed in the gain region is greater than those of the first- and second-order modes distributed in the gain region. Consequently, the fundamental mode obtains a larger gain than the high-order mode, which is beneficial to the stable operation of the device under the fundamental mode. 3) The curved grating and the high reflective rear facet form an unstable cavity, which enhances the mode discrimination of the resonator and realizes the single-mode stable output of the device. The unstable cavity for mode selection is formed owing to the highly reflective rear facet and curved gratings that are defined by standard ultraviolet lithography. The structural design of the curved grating exhibits remarkable flexibility, which considerably reduces the difficulty and complexity of device design and fabrication. In addition, lateral modes regulated by curved gratings in the broad area device strengthen the mode discrimination and enhance the device’s ability to suppress spatial gain hole burning and filamentation. 4) High-order curved gratings are used to achieve selection of wavelengths in the cavity. A high-order grating is used to realize the distributed feedback of light in the cavity. Compared with the low-order grating, the designing and manufacturing are less challenging, and the cost is lower.Results and DiscussionsThe experimental results show that the threshold current, continuous output power, and slope efficiency of the curved grating semiconductor laser device are 220 mA, 1.48 W, and 0.63 W/A, respectively (Fig. 7). The single longitudinal mode lasing spectra of the devices under the injection current of 450, 500, and 550 mA all exhibit good performance. With the increase of the current, the spectral linewidths are obtained as 0.117, 0.145, and 0.132 nm, respectively, and the side mode suppression ratio are 23.5 dB, 28.0 dB, and 28.4 dB, respectively. Further, the laser wavelengths of the device are 979.76, 980.07, and 980.4 nm, respectively. With increase in the injection current, the output wavelength of the device drifts to the long wavelength direction at a drift rate of 6.4 nm/A (Fig. 8). Through comparisons of the spectra of Fabry-Perot, linear grating DFB, and curved grating DFB lasers, the critical role of curved gratings in mode selection of semiconductor lasers is demonstrated. It is therefore beneficial to realize the narrow-linewidth single-mode operation of high-power DFB lasers with a lasing wavelength of 980.55 nm, a spectral linewidth of 0.121 nm, and a side-mode suppression ratio of 32 dB at an injection current of 1 A (Fig. 9).ConclusionsThis study proposes the fabrication of a novel broad-area distributed feedback laser with high order surface curved gratings based on standard ultraviolet lithography. The high-order curved grating is used to form an unstable cavity structure, which increases the loss difference between different oscillation modes, improves the mode discrimination, and obtains uniform gain over a broad area. The DFB laser emitting at wavelength of approximately 980.55 nm achieves a spectral width of 0.121 nm and maximum output power of 1.48 W. The threshold current and sidemode suppression ratio of the device are 220 mA and 32 dB, respectively. Further, through comparisons of the power-current-voltage curves and spectra of Fabry-Perot, linear grating DFB, and curved grating DFB lasers, it is demonstrated that curved gratings play a key role in power output and mode selection in semiconductors lasers; this finding is beneficial for the realization of narrow-linewidth single-mode operation of high-power DFB lasers.
Oct. 10, 2023Vol. 50 Issue 19 1901004 (2023)
Download Type Electro‑Optic Modulator with Reflective Wall Based on Photonic Crystal Nanowire Cavity
Wenling Zhu, Heming Chen, Wenkai Xu, and Yuchen Hu
ObjectiveWith the development of optical interconnection and high-speed optical communication, electro-optic modulators have become a research hotspot. Silicon insulator materials have the advantages of compatibility with the complementary metal oxide semiconductor process, high integration, low power consumption, and high temperature resistance. There are several electro-optic modulators based on silicon materials. Electro-optic modulators with high modulation rate, compact size, and easy integration have been investigated previously, and the study on electro-optic modulators is crucial. Therefore, we design an electro-optic modulator with a reflective wall based on a one-dimensional photonic crystal nanowire cavity (PCNC). The modulator exhibits a high extinction ratio, large modulation bandwidth, and high modulation rate. Furthermore, it has a compact and simple structure and can easily to cascade other silicon photonic devices. With the development of integrated photonics in communication systems, the cascade of silicon photonic devices has a wider application prospect.MethodsThis study proposes a download-type electro-optic modulator with a reflective wall based on a silicon-on-insulator (SOI) one-dimensional PCNC. The main line waveguide, one-dimensional PCNC and download-type waveguide are used to form a download-type structure with a reflective wall. The duty cycle of the nanowire cavity decreases linearly from the center of the waveguide to the two ends, and doping is introduced at both sides of the modulator to form PN junctions. The finite difference time domain (FDTD) model in the optical simulation software Lumerical is used for simulation analysis. According to the free carrier dispersion effect in the silicon material, when the modulation voltage applied at both ends of the electro-optic modulator changes, the dielectric constant of the nanowire cavity material also changes. The refractive index change in the nanowire cavity produces a slight difference; hence, the resonant frequency of the cavity changes, i.e., the central wavelength of the electro-optic modulator shifts. Specifically, corresponding to the wavelength of 1550.01 nm, the addition or non-addition of the modulation voltage is equivalent to the “off” or “on” state of the modulator.Results and DiscussionsAn electro-optic modulator with a reflective wall based on the SOI PCNC is proposed. The incident light is coupled into the one-dimensional PCNC after passing through the main line waveguide, and then coupled again to output through the download-type waveguide. The adjustments of the position and number of reflective circular holes in the main line waveguide and download-type waveguide are beneficial to improve the overall transmittance of the device. The nanowire cavity uses a gradual circular hole to confine the beam in the cavity. PN junction is generated by doping on both sides of the nanowire cavity, and a low bias voltage is applied to adjust the resonant wavelength of the nanowire cavity, to realize the “on” and “off” modulation of the optical signal at the working wavelength. 3D-FDTD is used to analyze the optical characteristics and electrical performance of the modulator. The results indicate that the electro-optic modulator can modulate the optical signal with the wavelength of 1550.01 nm, and the transmittances under the “off” and “on” states are 0.0037 and 96.34%, respectively (Fig.14). The modulation voltage is only 1.2 V, the insertion loss is 0.2 dB, the extinction ratio is 24 dB, and the size is only 54 μm2. The modulation frequency is 8.7 GHz, and the modulation bandwidth can reach 122 GHz, which implies that the proposed device has applications in optical communication and integrated photonics. In addition, after comparing the performances of the photonic crystal electro-optic modulators (Table 1), it is inferred that the proposed device exhibits excellent performance.ConclusionsThis study proposes a download-type electro-optic modulator with a reflective wall based on SOI one-dimensional PCNC. The downloadable structure of the reflection wall comprises a main line waveguide, one-dimensional PCNC, and downloadable waveguide. The doping method is introduced to form PN junctions at both sides of the modulator. Under the action of the modulation voltage, the refractive index of the silicon in the nanowire cavity changes, which triggers the migration of defect modes in the nanowire cavity; in addition, the “on” and “off” state modulations of the electro-optic modulator are realized. The electro-optical modulation is simulated and analyzed via the 3D-FDTD model in the Lumerical commercial simulation software. The simulation results demonstrate that compared with other electro-optical modulators based on nanowire cavity, the proposed electro-optical modulator has a higher extinction ratio, higher modulation bandwidth, higher modulation rate, compact and simple structure, and can easily be cascaded to other silicon photonic devices. The proposed electro-optic modulator exhibits a significant development and application value in the integrated photonics of optical communication.
Oct. 10, 2023Vol. 50 Issue 19 1901005 (2023)
Zhanduo Qiao, Dongdong Meng, Tieliang Zhang, Baoguang Gao, and Tianqi Wang
ObjectiveNanosecond pulse miniaturized lasers are widely used in laser detectors and target designators, among other applications. In most practical applications, lasers must remain insensitive to shock, vibration, and large temperature variations and have a small volume, light weight, and low power consumption. Cross-Porro prism resonators can effectively reduce the misalignment caused by vibration and exhibit high anti-detuning characteristics. Locally and internationally, many methods, such as multiwavelength matching and long-range absorption, are usually used to enable the laser to work in a wide temperature range; this wide range reduces the dependence of the semiconductor-pumped laser on its accurate temperature control. In this study, we used single-wavelength pump sources with a spectral width of 6.8 nm to end pump a segmented doped Nd∶YAG slab and a combined crossed-Porro prism resonator to achieve a compact laser with good beam quality, anti-detuning characteristics, and a wide temperature range. The work presented in this study can provide a new reference for the design of lasers operating over a wide temperature range.MethodsFirst, the influence of different spectral widths (2, 4, 6, 8, and 10 nm) on the absorption efficiency of a gain medium with 30 mm length and atomic fraction 1.0% of doping Nd was numerically analyzed. The results show that pump light with a spectral width of 6 nm increases the absorption efficiency of the slad by more than 75% in a continuous and wide temperature range (Fig.2). The polarization coupling output characteristics of the crossed-Porro prism resonator were then calculated theoretically (Fig.3). Next, to prevent end-face heat accumulation caused by the end-pumped slab structure, the distribution characteristics of the absorption flux of 805 nm pump light in the segmented bonding slab were simulated (Fig.6), and the results show that the segmented bonding slab can effectively homogenize the pump light distribution. According to the theoretical analysis, a laser with wide-temperature operation based on a conduction-cooled end-pumped slab (CCEPS) combined with a crossed-Porro prism resonator configuration was designed. The laser can operate over a wide temperature range using a broad-spectrum, single-wavelength pump source to end pump the segmented bonding slab (Fig.4). The central wavelength of the pump source used in the experiment was 805.8 nm at 60 ℃, and the spectral width was 6.8 nm (Fig.11), which is favorable for laser operation in a wide temperature range. The crossed-Porro prism resonator used in the experiment comprises two orthogonal Porro prisms: a half-wave plate and polarization beam splitter (PBS) that can realize a polarization coupling output. The slab size was designed to be 3 mm×3 mm×39.9 mm, which is formed by bonding five segments of crystals with a cutting angle of 45° (Fig.5), which is conducive to improving laser beam quality.Results and DiscussionsThe laser system achieves a maximum output pulse energy of 49.82 mJ (Fig. 8) with a pulse width of 8.11 ns at a repetition rate of 20 Hz (Fig.9). The spot diameter and divergence angle of the output laser are approximately 2.12 mm and 2 mrad, respectively. The peak power reaches 6.14 MW with energy instability within -1.5%?+1.5%. The experimental results show that the laser could operate over a wide temperature range of 15?70 ℃ (Fig.10). The relationship between the pump wavelength and temperature can be obtained from the spectrum of the pump source at different temperatures; hence, the absorption efficiency curve of the slab to the pump light at different temperatures and the curve of the output energy with temperature can be linked. When the wavelength of the pump source changes in the range of 791.6 to 818.1 nm (26.5 nm), the absorption efficiency of the slab can reach more than 78.7%, and the partial absorption efficiency curve of 793.9 to 808.5 nm (14.6 nm) is consistent with the measured change of the output energy in the temperature range of 15 to 70 ℃ (Fig.12). When the design of the pump source is further optimized, the central wavelength of the pump source with a broad spectrum is set to 806 nm at 25 ℃. The temperature-insensitive range of the laser is nearly double that of the experiment’s temperature range.ConclusionsIn this study, a wide-temperature-operating CCEPS laser combined with a crossed-Porro prism resonator is designed. The laser is compact, has good anti-detuning characteristics, and can operate over a wide temperature range using single-wavelength pump sources with a 6.8 nm spectrum width to end pump the segmented bonding slab. This design reduces the complexity of the pump source without complex wavelength matching of the pump light and does not require a crystal length that is too long. Related parameters are analyzed theoretically, including the influence of pump light with a broad spectrum on the absorption efficiency of the gain medium, polarization coupling output characteristics of the crossed-Porro prism resonator, and distribution characteristics of the pump light absorption flux in segmented bonding crystals. The results show that the laser can operate in a wide temperature range of 15?70 ℃. When the design of the pump source is further optimized, the central wavelength of the pump source with a broad spectrum is set to 806 nm at 25 ℃, and the temperature-insensitive range of the laser can nearly be double that of the test temperature range in this experiment. The work presented in this paper provides a valuable reference for the design of thermally insensitive lasers.
Oct. 10, 2023Vol. 50 Issue 19 1901006 (2023)
Jin Peng, Yuanyuan Fan, Zhengji Lin, Yan Qi, Boxia Yan, Mi Zhou, Zhe Han, Qian Wang, and Yu Wang
ObjectiveAn alexandrite crystal is a broadband tunable laser-amplification-and-gain medium that exhibits excellent performance in the near-infrared band. Because of the continuous development and increasing commercial application of high-power red-light laser diode (LD) technology, LD-pumped alexandrite lasers have gradually attracted the interest of many researchers in the field of all-solid-state lasers. When an LD pumps an alexandrite crystal, a considerable amount of energy absorbed by the alexandrite crystal is converted into the thermal energy of the crystal beside the oscillation laser. This part of heat energy causes the thermal lens effect of the crystal and severely affects the output laser efficiency, stability of the resonant cavity, and quality of the output laser beam. To effectively reduce the influence of the thermal effect on laser output performance, three factors causing the thermal effect are analyzed in this study. The thermal focal lengths of an alexandrite crystal are calculated accurately by employing theoretical and experimental methods. The dips on the input-output curve of the F-P cavity are analyzed and explained based on the specific influence of the thermal focal length on the size of the fundamental laser mode. Finally, a method that can effectively reduce the influence of the thermal effect on the laser output performance in a certain range is developed.MethodsThe thermal effect in alexandrite laser is studied theoretically and experimentally by using an alexandrite crystal, 638-nm red-light high-power fiber-coupled LD, and F-P cavity as the laser gain medium, pump source, and research object, respectively. The following steps are performed. First, the three factors causing the thermal effect are analyzed and theoretically studied in detail by establishing the heat conduction model of the crystal, reasonably setting the boundary conditions, and solving the corresponding heat conduction equations, and the theoretical value of the thermal focal length under the corresponding factors is calculated by conducting software simulation. Then, the critical stability condition of the resonator is used to measure the actual thermal focal lengths of the crystal several times by conducting specific experiments, and the average value is taken as the final thermal focal length. The experimental value of the thermal focal length is consistent with the calculated theoretical value. Finally, based on the specific influence of the thermal focal length on the size of the fundamental laser mode, the dips on the input-output curves of the F-P cavity at three different cavity lengths are comprehensively analyzed, and a method that can effectively reduce the influence of the thermal effect on the laser output performance in a certain range is established.Results and DiscussionsIn this study, the thin lens combination formula is applied to calculate the thermal focal length of the crystal and combine the thermal focal lengths generated under three conditions; the combined result, f, is used as the final thermal focal length of the crystal. Then, the calculated value of the thermal focal length becomes closer to the actual value [Fig. 6(a)]. In the actual thermal focal length measurement, an F-P cavity structure is built to measure the thermal focal length of the alexandrite crystal, and the measurement light path is easy to obtain (Fig. 5). Furthermore, the error can be reduced to an acceptable range by averaging multiple measurements. Based on the specific influence of the thermal focal length on the size of the fundamental laser mode(Fig. 9), the dips on the input-output curve of the F-P cavity at three different cavity lengths are explained and analyzed in detail. After the comprehensive thermal focal length, fmin, at the maximum pump power is calculated, the rear cavity length, L2, can be made smaller than fmin by changing the cavity parameters to stabilze the resonant cavity in the entire pump-power range (Fig. 7). This is important for reducing the influence of the thermal lens effect and improving the performance of the laser.ConclusionsIn the F-P cavity with a small anterior cavity length (L1), the thermal focal length, f, should be larger than the rear cavity length, when the resonator is in a stable working state. Furthermore, the thermal focal length, f, equals the rear cavity length, L2, when the resonant cavity is in a critically stable working state. The analysis of the influence of the thermal focal length on the laser output characteristic curve under different pump powers reveals that to stabilize the resonant cavity output in the entire pump-power range, L2 can be changed after calculating the thermal focal length, fmin, at the maximum pump power.
Oct. 10, 2023Vol. 50 Issue 19 1901007 (2023)
Xing Zhang, Jianwei Zhang, Yongqiang Ning, and Lijun Wang
ObjectiveLidar is a low-cost active detection tool for detecting a target's distance and 3D physical information. The vertical-cavity-surface-emitting laser (VCSEL)array is a light source that can improve the stability and compactness of lidar systems. However, the emission wavelength of a high-power VCSEL array is below 1000 nm, which can induce severe eye damage. Thus, the imaging range of the VCSEL lidar is limited. In this study, we report a high-power VCSEL array emitting at 1550 nm, an eye-safe wavelength.MethodsThe severe self-heating is the main problem of the 1550 nm VCSEL. To alleviate the thermal accumulation within the VCSEL emitters, we optimize the distribution of emitters within the VCSEL array. To characterize the thermal distribution accurately, the changes in thermal resistance with temperature and operation current are measured. A thermal model based on the VCSEL hexagonal cellular array units is built, and the temperature distributions within the units are analyzed. Thus, the unit spacing can be optimized.Results and DiscussionsThe 1550-nm VCSEL array with an output power of more than 1 W under continuous-wave operation and more than 10 W under pulsed operation is reported (Figs. 6 and 8). Based on the characterization of the thermal resistance of single emitters under different operating currents, a thermal model of the VCSEL array is built, and the temperature distributions within different emitters of the array are simulated. As the distance between the edges of the VCSEL emitters exceeds 30 μm, the uniform temperature distribution within different emitters can be realized (Fig. 5). The output characteristics of the VCSEL array under continuous-wave and pulsed operations are characterized. The maximum output power of the VCSEL array can reach approximately 1.05 W in continuous-wave mode when the operating temperature is 15 ℃ (Fig. 6). The output power can reach 0.42 W even when the operating temperature of the VCSEL is increased to 65 ℃ (Fig. 6). The maximum output peak power of 10.5 W is obtained under pulsed operation with a pulse width of 5 μs and a repetition frequency of 1 kHz (Fig. 8). The profile of the far-field spot is still circularly symmetric, and the divergence angles are 26.69° and 26.98° in the orthogonal directions (Fig. 9).ConclusionsA high-power VCSEL array emitting at 1550 nm is reported. The internal thermal resistance is obtained by characterizing the thermal characteristics of the single emitters. The temperature distributions within the VCSEL array are simulated, and the distance between the emitters in the VCSEL array is optimized. The maximum continuous-wave output power of 1.08 W and pulsed output power of 10.5 W are achieved. The 1550-nm VCSELs have excellent eye safety performance and great advantages in terms of cost, volume, and integration in future technologies. We believe that the 1550-nm VCSEL array will have broad application prospects in 3D sensing, such as under-screen recognition, laser radar, and other fields in the future.
Oct. 10, 2023Vol. 50 Issue 19 1901008 (2023)
Zhenghao Zhang, Fang Wei, Huimin Wu, Qingshuai Su, Chen Chen, Qing Ye, and Haiwen Cai
ObjectiveA silicon-based optoelectronic chip provides a good solution for integrated space laser communication and LiDAR applications owing to its small size, low power consumption, low cost, high integration, high modulation bandwidth, and CMOS preparation process compatibility. During hybrid integration of Ⅲ-Ⅴ lasers with silicon-based optoelectronic chips, the coupling loss between the light source and the silicon-based optoelectronic chip is large. Therefore, the power requirement of the laser light source is higher than that of discrete devices, and the output power of the laser which was realized with single-chip integration or hybrid integration to achieve high side mode suppression ratio and narrow linewidth is generally a few tens of milliwatts. Erbium-doped fiber amplifiers are typically required to amplify the optical power of on-chip light sources, but this in turn limits the integration of optoelectronic chips; therefore, high-power on-chip light sources are a pressing problem for current on-chip laser applications. Coherent beam combining can be used to break the output power limit of a single laser. Coherent beam combining typically consists of two methods: one using a master oscillator and power amplifier (MOPA), and the other using an injection-locking technique. However, the spontaneous radiation of the optical amplifier increases the beam noise and makes the laser application system less effective; therefore, the coherent beam combining technique using injection-locking technology is more suitable for coherent detection systems that are more sensitive to laser noise. In 2001, Musha et al. used two injection-locked Nd∶YAG lasers to achieve coherent beam combining of spatial light with a beam combining efficiency of 94%; however, the scheme used discrete devices, and the arm length difference between the coupler arms had to be compensated in real time by an electronic feedback loop. In this study, to overcome the large coupling loss in hybrid integration and meet the requirements of laser light source power for space laser communication, an array of lasers containing four DFB lasers was injected and locked using a seed source, followed by coherent beam combining using a planar optical waveguide coupler to achieve on-chip optical power multiplication.MethodsTo achieve on-chip optical power amplification, a laser array containing four DFB lasers was injection-locked to a seed light source, and a planar optical waveguide coupler was used for coherent beam combining. To study the coherent beam combining effect of the injection-locked laser array, an experimental setup was built to measure the optical power, phase noise, and relative intensity noise of different numbers of injection-locked lasers before and after coherent beam combining, and the beam combining efficiency was calculated. First, the beam combining efficiency of the laser array was measured. The number of injected-locked DFB lasers in the laser array was varied by adjusting the magnitude of the operating current of the DFB lasers. Second, we measured the phase noise and intrinsic linewidth of different numbers of lasers after coherent beam combining. The relationship between phase noise and the number of lasers was investigated by theoretical analysis. Finally, the relative intensity noise after the coherent beam combining was measured.Results and DiscussionsThe beam combining efficiencies for the two, three, and four DFB lasers were calculated to reach 91.6%, 87.8%, and 78.3%, respectively. According to the theoretical analysis in this study, the phase noise after the coherent beam combining contains the noise introduced by the master laser and that introduced by the slave laser. The phase noise introduced by the master laser is proportional to the square of the number of DFB lasers, whereas that introduced by the slave laser is proportional to the number of DFB lasers. The intrinsic linewidth after the coherent beam combining is dependent on the power of the master laser and the number of slave lasers; this tends to increase as the number of slave lasers increases, and decreases as the injected optical power increases. The relative intensity noise is demonstrated to increase as the number of slave lasers increase.ConclusionsThe coherent beam combining laser source based on injection-locking technology using a planar waveguide and a DFB laser array has the advantage of miniaturization, and the branches of the coupler do not introduce significant phase differences during the beam combining process owing to thermal noise. Therefore, compared with spatial light and fiber coherent beam combining, the planar waveguide coherent beam combining does not require the feedback control loop of electronics, greatly simplifying the system complexity. In this study, the effect of coherent beam combining on the phase noise and relative intensity noise is investigated through theoretical analysis and experiments. However, both the phase noise and relative intensity noise of the combined beam increase with an increase in the number of DFB lasers contained in the laser array. The present results provide a simple and effective technical means for coherent beam combining of DFB laser arrays; this is expected to be applied to laser applications such as chip-based space laser communication and LiDAR.
Oct. 10, 2023Vol. 50 Issue 19 1901009 (2023)
Zhiyuan Wang, Huanlong Liu, and Wei Liu
ObjectiveDamping springs and bolster springs (hereinafter referred to as bolster springs) are important components of a railway freight car bogie, which carry the main load when the vehicle is running. According to the relevant regulations, bolster springs need to be repaired and replaced regularly. Moreover, the driving safety of the vehicle is directly affected by the dimensions of each group of bolster springs. Thus, it is necessary to disassemble the bolster spring and perform maintenance on each part separately, and the qualified and unqualified products need to be distinguished and classified based on their dimensions. Under the traditional operation mode, the model and type of bolster spring are determined by measuring the height of the bolster spring using a free height ruler, measuring the diameter of the round steel of the bolster spring using a spring diameter gauge, and through manual visual inspection. Typically, several bolster springs of different types are used in railway freight cars . Thus, the use of the manual detection method is inefficient, labor intensive, and vulnerable to human interference, making it difficult to meet the current maintenance needs of bolster springs. To develop an intelligent maintenance system for bolster springs that can replace manual operation, a key technical problem, namely, the design of a stable and efficient detection algorithm for bolster springs, needs to be urgently solved. Through investigations and analyses, researchers have made certain advancements in the field of bolster spring detection; however, most of them include patents and very few are related to detection algorithms. Therefore, a point cloud detection method for the bolster spring size is proposed in this paper based on 3D laser point cloud technology to achieve the stable, high-precision, and efficient detection of the bolster spring size.MethodsIn this study, the bolster spring point cloud data were collected using a line laser sensor and the size of the bolster spring was measured using point cloud processing technology. First, the bolster spring measurement test platform was set up, and the three-dimensional point cloud data of the bolster spring were obtained via linear laser sensor scanning and uploaded into an industrial computer for processing. For the bolster spring point cloud data, the point cloud density was reduced and the noise was removed using the point cloud down sampling algorithm and k-means clustering algorithm. Subsequently, the free height of the bolster spring was measured using the plane fitting algorithm and point projection height calculation method based on the processed point cloud. Finally, the inner diameter and outer diameter of a group of internal and external bolster springs were calculated using the point cloud dimension reduction algorithm combined with the edge extraction, circle segmentation, and circle fitting. Through experimental research, the accuracy and efficiency of the bolster spring measurement algorithm based on point cloud technology were discussed, and the reliability and stability of the method were verified.Results and DiscussionsThe manual measurement results and bolster spring point cloud data were obtained via manual measurement and the linear laser sensor scanning for 10 groups of bolster springs, respectively (Fig. 9), and the sparse point cloud data with reserved features were obtained by processing the bolster spring data using a point cloud preprocessing algorithm (Fig. 10). Furthermore, the reliability test for the height and diameter measurement was conducted on 10 groups of bolster spring data. The results show that the maximum measurement error of the point cloud measurement method is in the range of ±0.35 mm compared with that of the manual measurement, and the average measurement time is 2.7 s, which is much shorter than the manual measurement time. Additionally, the measurement accuracy and measurement efficiency are both reliable and meet the measurement requirements (Table 2 and Fig. 11). The four groups of bolster springs were measured 10 times. The results show that compared with that of the manual measurement, the maximum average error value of the proposed algorithm is in the range of ±0.35 mm, and the measurement repeatability is less than 3%, which proves that the proposed algorithm has good stability (Tables 3?5). Thus, the obtained reliability and repeatability test results are acceptable and meet the requirements stipulated in existing maintenance regulations.ConclusionsIn this study, a method for measuring the size of the bolster spring based on 3D point cloud technology was proposed. The point cloud data were obtained by controlling the driving line laser sensor of a six-axis robot when scanning the bolster spring. To reduce noise interference, the bolster spring point cloud data were preprocessed via sampling using the point cloud sampling algorithm and k-means clustering algorithm. After preprocessing, the point cloud data were used to solve the end and bottom plane equations of the bolster spring using the least square plane fitting algorithm. Based on the plane equation and point projection height calculation method, the free height measurements of the bolster spring were obtained. Subsequently, the bolster spring point cloud height information was removed using the dimension reduction algorithm. The reduced dimension point cloud was then circular-segmented using the maximum included angle edge extraction algorithm and threshold segmentation algorithm. Subsequently, the noise points of the segmented point cloud were filtered using the RANSAC method, and the diameter of the bolster spring was calculated using the circle fitting algorithm. To improve the diameter measurement accuracy, the gradient descent iterative algorithm was used to iterate the optimal diameter solution using the circle fitting results as the initial values, marking the end of the calculation of the inner and outer spring diameters of the bolster spring. The bolster spring measurement test platform was then set up for data collection, conducting reliability and repeatability tests on the industrial computer, and conducting reliability tests on 10 groups of bolster springs. The results show that the maximum measurement error of the point cloud measurement method is in the range of ±0.35 mm compared with that of the manual measurement, and the average measurement time is 2.7 s. Moreover, the measurement accuracy and measurement efficiency were reliable and met the measurement requirements. The measurement tests on the 4 groups of bolster springs were repeated 10 times, and the results show that compared with that of manual measurement, the maximum average measurement error value is in the range of ±0.35 mm, and the measurement repeatability is less than 3%, which proves that the point cloud measurement method has good stability. Follow-up work should be conducted to optimize the measurement system and point cloud measurement algorithm, to further improve the measurement accuracy, measurement efficiency, and measurement stability, and to apply the point cloud measurement method to the research on the development of automatic measurement and sorting equipment for bogie bolster springs and wedges.
Oct. 10, 2023Vol. 50 Issue 19 1904001 (2023)
Yuting Chen, Wenrui Xue, Jing Zhang, Haotian Fan, and Changyong Li
ObjectiveMetamaterials are artificial composite materials or composite structures composed of unit structures with a specific spatial arrangement and have extraordinary macroscopic physical properties. They are widely used in energy-harvesting, subwavelength imaging, perfect absorbers, and photovoltaic devices. Once the structure is established, the common metamaterial electromagnetic absorber can only achieve specific absorption in a specific wavelength range, without tunability. Tunable materials are integrated into the metamaterial absorber to realize a tunable metamaterial absorber. Because the tunable material VO2 has the characteristics of fast response and high regulation intensity, most of the reported VO2-based metasurface absorbers are concentrated in the visible and terahertz bands, and relatively few studies have been conducted in the infrared band. Therefore, metamaterial absorbers operating in the infrared band have attracted much attention in research hotspots. Thus far, it has been difficult for existing infrared absorbers to achieve both ultra-broadband absorption and tunability owing to limitations such as material loss and fabrication precision. In this study, an ultra-broadband infrared absorber based on VO2 is designed with a simple structure, wide absorption bandwidth, and wide tunable range.MethodsIn this study, a truncated four-layer infrared tunable broadband absorber based on the phase change materials VO2, titanium dioxide (TiO2), lithium fluoride (LiF), and SiO2 was designed. The finite element method was used for the simulation using the COMSOL Multiphysics simulation software. According to the different material properties, the corresponding mesh division was performed on the domains, boundaries, and edges of the different materials. Simultaneously, the infrared rays are incident along the wave vector direction, the incident angle is α, and the azimuth angle is φ. Periodic boundary conditions were set in the X and Y directions. Periodic port boundary conditions were used in the positive and negative directions of the Z-axis. The two ports were set with one open and one closed. Subsequently, according to the requirements of the absorption curve, the parameters of the research band were scanned, the structural parameters, incident angle, and polarization angle were adjusted, and the parameters were repeatedly optimized. At the end of the simulation, the magnetic field and electric field distribution maps at the corresponding structural positions in the corresponding bands were derived.Results and DiscussionsWhen the conductivity of VO2 is 2×10⁵ S/m, after optimization, a set of optimal parameters are obtained, namely: the period of the cell structure, p=6.3 μm; the thickness of the bottom layer of Au, h1=0.5 μm; the thickness of the SiO2 layer, h2=1.2 μm; the thickness of the VO2 layer, h3=3.0 μm; the thickness values of the TiO2 layer and the nested LiF cross ring, h4=4.5 μm; the width of the bottom composite layer, W1=4.9 μm; the width of the top composite layer, W2=3.5 μm; the length and width of the two LiF rectangular rings in the top composite layer are a=3.2 μm and b=1.6 μm, respectively, and the ring width of the cross ring, c=0.6 μm. From Fig. 3(a), it is observed that when the transverse magnetic (TM) and transverse electric (TE) waves are incident at 0°, the absorptivity of the absorber exceeds 90% in the wavelength range of 16?60 μm, including the wavelengths of 21?26 μm, 28?36 μm, and 42?53 μm. The absorptivity in this range could exceed 98%. The absorption curve consists of four absorption peaks: p1 located near 11 μm, p2 located near 24 μm, p3 located near 30 μm, and p4 located near 50 μm. As shown in Fig. 3(b), when the azimuth angle of the incident wave increases from 0 to 90°, the absorptivity remains stable and basically unaffected. Owing to the symmetry of the structure, the absorber is polarization-insensitive. Figure 4 shows the contour plot of the absorptivity of the absorber as a function of the wavelength and incident angle when the TE and TM waves are incident obliquely. When the incident angle is varied from 0 to 60°, the absorptivity is maintained at approximately 80%. Figure 5 shows that the absorption mechanism of the ultra-broadband absorber is plasmon resonance. Figure 6 shows the graph of the relative impedance of the structure as a function of wavelength, indicating that the relative impedance value of the absorber in the corresponding band matches the relative impedance value in the free space. Figure 7 shows the absorptivity curves for different structural parameters and the corresponding magnetic field distribution diagrams used to determine the optimal parameters. Figure 8 plots the change in the absorptivity of the absorber with wavelength when other structural parameters keep the optimal parameter values constant, and the VO2 conductivity changes. Finally, Fig. 9 shows that the absorber with the LiF cross-ring pattern has a significantly higher absorptivity when the structural parameters are the same and the TE wave is incident vertically.ConclusionsIn this study, a dynamically tunable ultra-broadband angle-insensitive infrared ideal metamaterial absorber based on VO2, LiF, and TiO2 was designed. When the TM and TE waves are vertically incident, the absorptivity is greater than 90% in the 16?60 μm band, and the absorption bandwidth can reach 54 μm. The absorptivity rate can reach more than 98% in the wavelength ranges of 21?26 μm, 28?36 μm, and 42?53 μm. The TM wave and TE wave polarizations have incident and polarization insensitivity, and the absorptivity of the absorber is tuned by adjusting the conductivity of VO2 from 20 S/m to 2×10⁵ S/m. The metamaterial is expected to have a wide range of applications, such as polarization detectors, thermal radiators, and infrared sensors.
Oct. 10, 2023Vol. 50 Issue 19 1913001 (2023)
Tao Wang, Shuai Ren, Hongxiang Chang, Bo Ren, Kun Guo, Can Li, Pengfei Ma, Jinyong Leng, and Pu Zhou
Oct. 10, 2023Vol. 50 Issue 19 1916001 (2023)
Zhengyu Li, Hongdong Wang, Shengzhe Wei, and Jiankun Lou
ObjectiveIn the field of unmanned surface vehicle (USV), the intelligent perception is essential for decision-making process, which provides environmental information for the navigation system. Lidar can effectively address the problem brought by detection blind spots of other sensors with its close-range, high-precision, and all-weather capability, which enables USV to possess all-round and high-precision water surface perception ability. However, in practice, sea clutter often causes serious interference with the detection of lidar, resulting in false alarms in the perception system. In the pre-processing stage of lidar, traditional filtering algorithms are difficult to cope with complex marine environments, which may lead to omitted alarms due to insufficient subdivision. Therefore, a suitable sea clutter filtering algorithm is crucial for applications of lidar on USVs.MethodsTo deal with the interference brought by the sea clutter to the perception system of USV, we propose a intensity-space combined sea clutter filtering method. Noticeably, the sea clutters can be divided into two types. The first type is characterized by a significantly lower intensity than the target point cloud, which corresponds to a dense spatial distribution and a large point cloud, while the second type has an intensity similar to that of the target point cloud, whose spatial distribution is discrete and point cloud is sparse. For the first type of clutter, the dynamic intensity threshold is set for filtering, and for the second type of clutter, the spatial outlier algorithm is used for filtering. In order to make the intensity threshold conform to the changes of real marine environment, the threshold of the intensity filter is corrected according to the filtering results after outlier filtering, so that it can reflect the environmental characteristics and obstacle changes in each region. The main idea of the method is to take the filtered outliers as a sample of the higher intensity part of the sea clutter, which embodies the intensity characteristics of the clutter in the current region. In addition, the correction value of the intensity threshold is obtained by processing the point cloud in this part. The algorithm is tested on a real ship with 196 consecutive frames starting from the time of departure, where there are multiple dynamic targets, including a cruise ship and two sailing ships. Object detection uses Euclidean clustering algorithm for extraction. When there is a loss of targets in a frame, it is marked as an omitted alarm, and targets with clutter are marked as false alarms. The test results are compared with those of the intensity threshold filtering method.Results and DiscussionsThe results of the real ship experiment show that the algorithm has significantly reduced the false alarm rate and the omitted alarm rate. When the filtering rate achieved by the intensity threshold filtering is 80%, our algorithm can reduce the false alarm rate by 5.61% and the omitted alarm rate by 8.68%. When the filtering rate realized by the intensity threshold filtering is 90%, our algorithm can decrease the false alarm rate by 3.06% and the omitted alarm rate by 12.25% (Table 4). This verifies that the algorithm has obvious advantages over the intensity threshold filtering method of different filtering rates. When the target signal is occluded by an obstacle, the intensity of the target point cloud is lower than that of the usual target point cloud, and the intensity threshold filtering is easy to cause omitted alarms. In this case, the proposed algorithm can better adapt to the scene (Fig. 10). When the target passes through the USV at a high speed, there will be high-intensity clutter around, and the intensity threshold filtering is easy to cause false alarms. In this case, our algorithm is also applicable by adaptively increasing the intensity threshold (Fig. 11). Experimental results show that the proposed algorithm can adapt to different maritime environments and effectively reduce the false alarm rate and omitted alarm rate during perception.ConclusionIn this paper, an intensity-space combined filtering method for marine lidar is proposed. For the intensity information that is susceptible to local dynamic obstacles and sea conditions, the dynamic intensity threshold is set after regional segmentation. For the small number of high-intensity clutter points left after the intensity threshold filtering, the spatial outlier filtering method is adopted for processing. At the same time, the intensity characteristics of spatial outliers are extracted as the basis for correcting the dynamic threshold, which makes the changes of dynamic threshold coincide with the changes of environments. The results of the real ship experiments show that compared with the intensity threshold filtering method, the proposed method reduces the false alarm rate and omitted alarm rate in face of dynamic targets by 4.34% and 10.47%, respectively, which verifies the feasibility of the proposed method.
Oct. 10, 2023Vol. 50 Issue 19 1910001 (2023)
Zezheng Liu, Wanqian Chen, Jie Liu, Libin Du, and Lü Jing
ObjectiveThe design of optical path of lidar will directly affect the attenuation of echo signal in the transmission or reflection process, thus affecting the performance of lidar. In order to improve the compactness of the whole structure, reduce the weight and ensure the rigidity and strength, the topology parameter optimization design of the micro-pulse lidar structure is carried out during the design process.MethodsThe variable density topology optimization can be used to optimize and reassemble the structure of optical devices efficiently and conveniently, especially for the complex and discrete connections of optical devices, by defining and calculating the density function. This method has been widely used because it has the advantages of unconstrained design domain and simple design variables, and can better adapt to the situation of large computation and complex function design. In this paper, the pseudo-density value is used to represent the density of each element in the design domain which is the mass of material. Specifically, the density of material in the design domain is represented by the element in the density field β by the finite element meshing method, with a pseudo-density value representing the partition unit, a Y value for β element representing a corresponding material, and an N value for β element representing no material, as illustrated by the solid isotropic material with penalization (SIMP) interpolation schematic in Fig. 3. Structural topology optimization can deal with different types of design objectives and constraints. In continuum topology optimization, the shapes of outer boundary and inner boundary and the number of inner holes can be optimized at the same time according to predefined design goals. The SIMP model is used to optimize the optical support device by restricting the mass, volume and stress of the structure. By defining the design domain, design load, constraints and boundary conditions of the laser transmitting module and the optical receiving module, the structure function and sensitivity of the optical path are analyzed by using the SIMP model. The sequential quadratic programming (SQP) optimization algorithm is used to update the design variables of the optical path iteratively, so as to improve the stability of the whole structure of the optical path and achieve the goal of mass and compactness optimization. According to the optimization process, the SQP gradient optimization algorithm is adopted after the initial topology optimization is completed, and the optimized skeleton is obtained by continuously replacing and iteratively adjusting.Results and DiscussionsThe lightweight structure model can be obtained by topology optimization of the optical device connection support structure. The initial mass of the structure is 68 kg, and the whole structure of the optical path including the primary mirror is taken as the topology parameter optimization region. By this topology design, the triangular lightweight rib units near the support hole and the through hole are retained, and some units farther away from the support hole are eliminated, thus the topology parameter optimization of the support structure of ultra-lightweight optical devices is realized. In the preliminarily optimized optical structure, when the gravity direction is parallel to the orientation of the optical axis, the deformation of the primary mirror will be larger, so the constraint is further optimized. After further optimization, the maximum offset generated on the image space orientation of the primary mirror surface node is not greater than 66 nm, and the overall mass of the primary mirror is constrained to 20%?35%, thus minimizing the flexibility of the primary mirror-centered structure. The reinforcement under the primary mirror of the telescope is optimized by the topology method, which can reduce the mass and deformation of the telescope under the premise of ensuring the stability of the structure of the telescope. The optimized double-layer light path structure support is shown in Fig. 7.ConclusionsThe pseudo-density topology parameter optimization method is used to optimize the support structure of lidar optical device. It can realize the effects of mass reduction, volume reduction, proper arrangement of stress conduction path and proper material distribution. The optimized optical device support structure skeleton is suitable for the frequent movement by vehicles or aircraft and other field monitoring activities. The design parameters are analyzed according to the iterative times of topology optimization by changing the constraint conditions such as stress and volume ratio. By adjusting the position and material of the optical path, the results of the optical path topology optimization are verified in the aspects of reducing the mass and flexibility. In the design and reconstruction, the structural characteristics should be adjusted, and the structural mass should be gradually reduced when the strength design requirements are met. The effectiveness of the topology design is verified by the scale optimization design and the comparison of the structural details before and after optimization, which further proves that the new optical path structure has the function of reducing weight and improving rigidity. Furthermore, the additional vibration caused by overload can be reduced, and the stability can be improved by reducing the weight of the optical device supporting structure.
Oct. 10, 2023Vol. 50 Issue 19 1910002 (2023)
Yuan Gao, Lanxiang Sun, Xiangyu Li, Ge Xie, and Yong Xin
ObjectiveThe steel industry is an important economic pillar of China. At present, sinter accounts for more than 70% of blast furnace iron-making charge. Maintaining the stability of each component of sinter is important to ensure smelting efficiency and quality. Presently, sinter composition analysis generally adopts off-line sampling, and then adopts chemical titration or X-ray fluorescence spectrometry to determine the complex samples after preparation. Some use neutron activation technology to perform online measurement, but because of radioactivity, they are not widely used. Laser-induced breakdown spectroscopy (LIBS) has been widely used in many fields owing to its advantages of real-time, online, in situ, no radiation contamination, and total element analysis. In the production process of sinter, the mixture contains a certain amount of moisture, and the level of moisture affects the intensity and stability of the LIBS spectrum. Studies on the influence of the sample moisture mainly focus on soil, coal, rock debris, etc.; however, studies on the influence of the sinter mixture moisture have not been reported. In this study, the influence of moisture on the quantitative analysis accuracy of Fe, Ca, Si and Mg mass fraction in sinter is discussed by configuring sintered mixture samples with different moisture contents, and a correction method to reduce the influence of the moisture content by spectral standardization is proposed. The spectral stability and quantitative analysis accuracy are improved by correcting the spectral differences under different moisture contents.MethodsThe moisture content in sinter has considerable influence on the strength of the LIBS spectrum as well as the accuracy and stability of the prediction of the quantitative analysis model. In the experiment, the spectral features were screened using the wrapping algorithm in combination with the ridge regression model, and the optimal subset selected was placed in the partial least squares (PLS) model to establish a quantitative analysis model. Further, a spectrum standardization method is proposed based on the spectral line intensity correlation matching to calculate the intensity correlation of each dimension spectral line between standard and unstandardized spectrum matrices. The absolute of the correlation was sorted in descending order. The former m-dimensional unstandardized spectral lines corresponding to the sorted absolute were extracted to fit the standard spectral lines. Thus, the spectral difference caused by the different moisture contents is corrected, and the influence of moisture content on the quantitative analysis is corrected.Results and DiscussionsBy evaluating the relationship between the moisture content and mean value of the spectral intensity, the average spectrum with the mean intensity value between 50 and 70 under each sample was finally determined as standard spectrum under the sample, and the spectrum with the mean intensity value out of 50 to 70 was regarded as unstandardized spectrum under the sample. The standard spectrum in the training set was used to establish the quantitative analysis model of the four elements; the standard and unstandardized spectra in the test set were predicted separately. It was deduced that the measurement results of the two were far from each other, and the error bars of the results of the four elements predicted by the model were large (Fig. 4, Fig. 5). The SICMS spectrum standardization model was established under the optimal parameters, and the unstandardized spectrum under each sample in the test set was standardized. The difference in the spectral line intensity between the unstandardized and standard spectra was significantly reduced. After the quantitative analysis of the standardized spectra, it was deduced that relative standard deviation (RSD) of the quantitative analysis results of Fe, Ca, Si, and Mg generally decreased by more than half. For example, the RSD of Fe in sample No. 9 decreased from 6.01% to 2.32%, and the RSD of Si in sample No. 10 decreased from 8.42% to 0.81% (Fig. 10). Additionally, the error bar of the mass fraction prediction value was significantly shortened, and the distance between the square and circular points in the Fig. 11 was significantly reduced.ConclusionsTo overcome the problem that moisture in the sintered mixture will affect the intensity of the LIBS spectrum and the accuracy and stability of the quantitative analysis, the relationship between water content and spectral intensity of the sintered mixture was first studied. It was deduced that the mean spectral intensity had a linear relationship with moisture content, and the mean spectral intensity could be used to indirectly characterize the moisture. A quantitative analysis model was then established, and an SICMS spectral standardization method was proposed to correct the effect of moisture. The results showed that compared with the measurement results before standardization, the RSD of the standardized spectrum was reduced by more than half, and the accuracy was also significantly improved. The SICMS spectral standardization method is not only suitable for the correction of the moisture effect of the sintered mixture, but also has reference significance for the correction of the moisture effect in other types of targets.
Oct. 10, 2023Vol. 50 Issue 19 1911001 (2023)
Zihao Yuan, Yinbo Huang, Qing Zhong, Xingji Lu, Jun Huang, Leilei Zhang, Gang Qi, and Zhensong Cao
ObjectiveOff-axis integrated cavity absorption spectroscopy technology is widely used in atmospheric molecular detection, environmental detection, and industrial production monitoring because of its advantages of high sensitivity, fast response, and strong anti-interference. These characteristics have attracted considerable research attention. Currently, research on off-axis integrated cavity absorption spectroscopy primarily focuses on the performance improvement of lasers, detectors, and other components and signal processing methods; this increases the complexity of the device. The detection sensitivity of the off-axis integrated cavity is primarily determined by the optical path length. Theoretically, the longer the length of the cavity, the longer the total effective optical path. However, the longer the cavity, the larger the volume of the device, and the portability and robustness are weakened. Therefore, by improving the cavity structure, this study designed an off-axis integrated cavity device with a V-shaped structure, which makes the device more compact and highly stable.MethodsLightTools software was used to perform the optical path tracking simulation for the V-shaped cavity structure, and the optimal parameters of the V-shaped cavity were determined by analyzing the spot distribution on the surface of the highly reflective mirrors. When the arm lengths of the two arms were 25 cm, the angle between the two arms and the optimal off-axis incidence angle were confirmed by simulation, and the V-shaped cavity was designed and machined. In the experiment, a set of V-shaped structure off-axis integrated cavity absorption spectroscopy (V-OA-ICOS) measuring devices in the 2 μm band was developed, and the related measurement experiments were performed. The performance of the V-OA-ICOS device was tested with standard CO2 gas, and the effective absorption path length and detection limit of the device were determined. Furthermore, the absorption signal of indoor NH3 was measured at 4986.9955 cm-1.Results and DiscussionsThe simulation results (Figs. 2 and 3) indicate that the spot distribution on the surface of the highly reflective mirrors in the V-shaped cavity exhibits a uniform square distribution (Fig. 4). When the distance between the centers of lenses M1 and M2 exceeds 10 cm, the spot distribution no longer changes significantly. The larger the off-axis incidence angle of the laser, the more uniform the spot distribution on the mirror surface. However, an incidence angle that is excessively large would also result in a larger spot distribution range beyond the mirror surface. Therefore, the V-shaped cavity has two symmetrical arms; one side is 25 cm, and the included angle is 23.06° (Fig. 5). A V-OA-ICOS experimental device was built with this V-shaped cavity (Fig. 6), and a series of experiments was carried out on the device with CO2 standard gas with a volume fraction of 400×10-6. When the pressure in the cavity is 12 kPa, a CO2 absorption signal is obtained at 4991.258 cm-1 (Fig. 8). According to the calculations, the reflectivity of the cavity mirror is 99.947%. The device was measured for a long time of 50 min, and the device exhibits high stability. The Allan variance indicates that the detection limit of the device is 0.35×10⁻⁶ (Fig. 9) when the average time is 375 s. To further verify the weak detection ability of the device, indoor NH3 was measured at 4986.9955 cm-1 (Fig. 10). The Savitzky-Golay algorithm, with a fitting order of 2 and a window width of 60, was selected to smooth the obtained NH3 signal (Fig. 11), and the signal-to-noise ratio increases to 46.06 (Fig. 12).ConclusionsIn this study, a new V-OA-ICOS device was developed. LightTools software was used to simulate and optimize the optical path, and the distribution of spots on the surface of the highly reflective mirrors in the V-shaped cavity is uniform square, which makes the surface utilization of mirrors higher. Moreover, the optimal angle of the cavity is 23.06° when the V-shaped structure is symmetrical, the length of one arm is 25 cm, and the V-OA-ICOS experimental device was developed. The CO2 standard gas with a volume fraction of 400×10-6 was used to test the device, and the reflectivity of the mirrors was calibrated to 99.947%. Subsequently, the stability of the device was tested for 50 min, and the volume fraction fluctuation is within ±10×10-6. The Allan variance results show that the detection limit of the device can reach 0.35×10⁻⁶ when the average detection time is 375 s. The indoor NH3 absorption signal was measured using the fabricated device. The Savitzky-Golay algorithm was used to smoothen it, and the signal-to-noise ratio improves from 23.96 to 46.06. Compared with the traditional OA-ICOS device, the V-OA-ICOS device has higher stability and compactness, exhibiting excellent detection ability, which provides a choice for the development and application of trace gas sensors in different scenarios.
Oct. 10, 2023Vol. 50 Issue 19 1911002 (2023)
Min Zeng, Xiao Wang, Qi Wan, Weiping Xie, Mingyin Yao, Lin Huang, Jianbo Wang, Xiaoying Yao, and Jiang Xu
ObjectiveHeavy metal pollution poses a threat to the ecological environment, economic development, and human health. As a heavy metal pollutant, cadmium (Cd) is difficult to be decomposed by microorganisms, and its excessive intake can lead to cancerous lesions in the kidneys and other organs. Presently, the routine detection methods of Cd element, such as ICP-MS, ICP-OES, and AAS, require the use of chemical reagents to digest the samples, and the detection process is environmentally unfriendly and tedious. Laser-induced breakdown spectroscopy (LIBS) is a typical elemental analysis method with the advantages of a high analysis speed, multi-element measurement, and real-time detection. This has been widely studied in many fields. However, owing to the existence of the matrix effects in the samples, the collected spectral data have high bases and large background noise, and the self-absorption phenomenon is highly severe. Therefore, the stability, accuracy, and sensitivity of the analysis results must be improved. To reduce or eliminate these problems during the LIBS detection process, we constructed a polarization-resolved LIBS (PRLIBS) system to explore methods to improve the analytical ability of LIBS. Stability is promoted, and the baseline drift and background radiation are reduced using PRLIBS. We hope that our study provides a reference for the improvement of the analytical ability of LIBS.MethodsA Cd target was selected as the object in the present study. Combined with the Fresnel equation of light wave propagation in multilayer media, the mechanism of the effect of the incident light wavelength on the light intensity transmittance is analyzed. A light-splitting transmittance model of the plasma radiation intensity in the normal incident direction was established. MATLAB software was used to simulate the model and analyze the changes in the transmitted light intensity. A Cd target was used for the actual measurement verification. The spectral data of the LIBS and PRLIBS with different laser energies and delay time were obtained, and their effects on the spectral signals were analyzed. The relative standard deviation (RSD) of the characteristic spectral line intensity of Cd was calculated to compare the stabilities of LIBS and PRLIBS.Results and DiscussionsPRLIBS has obvious measurement advantages in terms of the low energy density of the laser, and more characteristic peak signals can be collected by PRLIBS (Fig. 8). The plasma temperature increase with an increase in the laser energy, and the overall spectral characteristic signal tends to increase (Fig. 9). The phenomenon of the baseline drift in the LIBS spectrum is evident, whereas the PRLBS spectrum has almost no baseline drift problem, and the background signal is significantly reduced. This phenomenon shows that the continuous radiation and background signal are filtered out after the plasma spectral signal passes through the polarizing system, while the discrete signal is retained. The polarization characteristics of the continuous spectrum are much stronger than those of the discrete spectrum. Additionally, the RSD values of the characteristic spectral line intensity were calculated (Table 1), which in PRLIBS are less than those obtained by the LIBS method at the same detection parameters. This indicates that the light-splitting transmittance model effectively improves the stability of the plasma spectrum. With the increase in pulse energy, the light-splitting transmittance model can effectively reduce the baseline drift and background radiation and enhance the spectral resolution. This model not only retains effective information in the continuous spectrum but also improves the stability of spectral line identification. Moreover, the characteristic Cd peak signals of LIBS and PRLIBS with seven different delay time were collected to analyze their effect on the spectral signal (Fig. 10). The variation trends of the characteristic peak intensity with the delay time under the two methods are consistent.ConclusionsBased on the existing LIBS detection model, the theoretical formula of the transmission ratio for different wavelengths of light directly incident onto the Glan-Thompson prism is deduced, and the PRLIBS detection model of the plasma radiation intensity is established. By collecting and comparing the LIBS and PRLIBS spectra of Cd element under different laser energy densities, it was deduced that PRLIBS can measure more characteristic signals, whereas the spectral transmittance model can reduce the baseline drift and background radiation under low-energy conditions. Moreover, the difference between the maximum and minimum values of the spectral characteristic signal intensity of PRLIBS is smaller than that of LIBS, reflecting the advantages of the PRLIBS method for characteristic spectral line recognition. The RSD values of the LIBS and PRLIBS characteristic spectral lines at laser pulse energies of 23.68 mJ and 42.52 mJ were compared. The average RSD value of the PRLIBS method was less than 10%, and the overall RSD value was smaller than that of the LIBS method, indicating that PRLIBS can effectively improve the stability of the identification of the characteristic spectral lines. The experimental results show that the model can improve the ability to identify the characteristic spectral lines of Cd plasma spectra. Additionally, the characteristic Cd peak signals of LIBS and PRLIBS with seven different delay time were collected. The variation trends of the characteristic peak intensity with the delay time under the two methods were consistent, indicating that PRLIBS does not change the delay time of LIBS.
Oct. 10, 2023Vol. 50 Issue 19 1911003 (2023)
An Huang, Yanhui Zhao, Shunhua Yang, Huihui Xia, Hao Deng, Jun Ruan, Jiayi Hu, Ai Suman, Zhenyu Xu, and Ruifeng Kan
ObjectiveTunable diode laser absorption spectroscopy (TDLAS) is a powerful technology to measure the temperature of burners, such as industrial boilers, scramjet engines, gas turbines, and aero engines. Currently, in TDLAS-based thermometers, two-line thermometry is a common method for calculating the temperature of the target devices based on the monotone variation relation between the ratio of two selected absorption linestrengths and the corresponding temperature. However, the range and accuracy of temperature measurements strongly depend on the absorption linestrengths and the corresponding low-energy levels. Thus, improper selection of the two absorption lines may limit the temperature-measurement range and induce a significant measurement error. In addition, the error is influenced by the uncertainty of the line parameters. Recently, a multiline temperature-measurement method has been developed to improve the tolerance of the measurement error induced by the uncertainty of the line parameters, which can be achieved by scanning with an external cavity laser (ECL) with a wide wavelength region to cover several more absorption lines. However, using ECL may result in problems, such as the difficult baseline retrieval caused by the irregular variation of the emission intensity in the wavelength scanning region and the low temporal resolution limited by the response speed of the ECL internal mechanical motor.MethodsConsidering the above ECL limitations, a multiple distributed feedback (DFB) laser-based TDLAS system was developed to measure water vapor (H2O) absorption lines near 1339, 1343, 1392, 1393, and 1469 nm. The wavelengths of the lasers can be tuned to match the absorption region of interest by adjusting the lasers’ temperatures and injection currents with homemade laser temperature and current controllers. Five time-division multiplexing ramp signals were generated using an FPGA-based function generator to control the injection currents of the laser. The laser beams were collimated and passed through the gas medium in tube furnaces and scramjet engines. The transmitted beams were collected on photodetectors, and the corresponding H2O absorptions were recorded using an FPGA-based data acquisition circuit. In this study, we applied a typical multiline temperature-measurement method using Boltzmann diagrams to calculate the temperature of the target species. Temperatures ranging from 1000 K to 1600 K were measured in the high-temperature tube furnace (Fig. 2) to assess the performance of this system. Subsequently, the cross-sectional temperatures of the expansion section of the scramjet engine were measured (Fig. 8), where 16 optical paths were arranged in the wall openings of the expansion section. Two experiments were performed under the same conditions to verify the repeatability of the experiment.Results and DiscussionsThe high-temperature tube furnace measurements show that the temperature-measurement accuracy, as expected, presents a strong dependency on the number of the selected absorption lines (Fig. 5) and is enhanced by increasing the absorption lines. A relative measurement error of less than 1% for the temperature range of 1000?1600 K can be achieved by using five H2O absorption lines; this error is lower than that induced by using a smaller number of absorption lines, indicating that the five wavelengths have good adaptability to the measurement over a wide temperature range (Fig. 6). For the scramjet, the measured hydrogen combustion time and fuel combustion time are approximately 0.2 and 0.5 s, respectively. Moreover, the experimental results show that hydrogen combustion is distributed in the upper layer of the expansion section before and after fuel ignition, and the combustion state remains stable owing to the small temperature difference between the set optical paths when the fuel is burned. To test the repeatability of the hydrogen combustion state, we repeated the same experiment twice for the preset conditions A and B. The final results indicate that the two experiments for the same condition have good repeatability, where the average deviation of the temperature measurement is approximately 16 K for the two experiments under condition A, whereas the average temperature is approximately 7 K for the two experiments under condition B.ConclusionsIn this study, we have developed a miniaturized TDLAS system using multiple DFB lasers as light sources to measure the temperatures of H2O in a high-temperature tube furnace and scramjet. A Boltzmann diagram-based multiline temperature-measurement approach is used to improve temperature-measurement precision. The temperature-measurement performance of the furnace using different numbers of H2O absorption lines is assessed in terms of the measurement error, and the optimized number of H2O absorption lines is determined to be five. A temperature measurement error of 1% is obtained by using five H2O absorption lines to calculate the temperature, which also illustrates that the method used in this study is suitable for temperature measurement with a wide temperature range and high accuracy for complex combustion environments. In addition, the linear average temperature is measured in the expansion section of the scramjet engine at different positions of the cross-section, and the experimental results show that the hydrogen combustion state remains highly consistent according to the average deviations of the two experiments of temperature measurement for different preset conditions A and B. All the above results indicate that the current method based on the Boltzmann diagram shows a high potential for high-precision temperature measurements in the combustion flow field, such as in engines with intense combustion.This method will be further developed to provide more wavelength information for the field distribution reconstruction of combustion and improve accuracy.
Oct. 10, 2023Vol. 50 Issue 19 1911004 (2023)
Keyang Cheng, and Qi Li
ObjectiveThe research of terahertz in-line digital holographic reconstruction mainly focuses on reducing the influence of the twin-image. However, these methods generally require the acquisition of multiple holograms or multiple iterations, which are easy to introduce noise interference and fall into local optimal solutions. Deep learning, with the rapid development, has been widely used in the field of imaging. In terms of visible light two-dimensional (2D) digital holographic reconstruction, a fully trained end-to-end neural network can directly obtain the corresponding reconstructed image through the input hologram. Continuous terahertz holograms have more obvious diffraction effects than visible light holograms in general, and the number of detector pixels and target pixels are both less. There is an obvious difference between the hologram and the reconstructed image. It is difficult for neural networks to directly match the features in the terahertz hologram accurately. At present, the work of applying deep learning to 2D terahertz in-line digital holography is mainly for image processing. Therefore, it is necessary to study how to make better use of deep learning in continuous terahertz digital holography.MethodsIn this study, two deep learning methods for amplitude reconstruction of 2D continuous terahertz in-line digital holography are studied, and compared with the traditional angular spectrum method (ASM) and the amplitude constrained phase retrieval algorithm with apodization (APRA). The first is the end-to-end U-net network reconstruction method (H-UnetM), that is, the network input images are holograms. The second is the angular spectrum method with U-net network reconstruction method (AS-UnetM). The reconstructed images of targets with different lateral resolutions are obtained by different reconstruction methods using a terahertz double-exposure digital holographic imaging system with a wavelength of 118.83 μm, a detector pixel size of 0.1 mm and a pixel number of 124×124.Results and DiscussionsSimulation results show that the results obtained using AS-UnetM are the best of the 4 methods for 0.3?0.5 mm resolution targets with recording distances of 15?20 mm. H-UnetM is better than ASM but not as good as APRA, and AS-UnetM generally outperforms both traditional methods (Figs. 4 and 5). Finally, real experiments are used to verify the simulation results. H-UnetM is able to reconstruct a part of the object, but some background noise is also highlighted. Reconstruction results near the target are the best using AS-UnetM (Fig. 7). In addition, the experimental results also show that AS-UnetM can reduce the influence of noise caused by the multi-frame stacking to obtain the hologram in the real experiment (Fig. 8). For more complex targets, H-UnetM cannot be used for reconstruction, while the reconstruction effect of AS-UnetM is better (Fig. 9).ConclusionsThis paper studies how to improve the applicability of deep learning in amplitude reconstruction of continuous terahertz in-line digital holography based on U-net neural network. Simulation results show that H-UnetM is better than ASM but not as good as APRA. AS-UnetM overcomes the difficulty of neural network to directly match the hologram features accurately to a certain extent, and its reconstruction quality is improved overall compared with the two traditional methods. In simulation at a recording distance of 20 mm, the peak signal-to-noise ratio (PSNR) of AS-UnetM reconstruction results is at least 7.9 dB higher than those of ASM results; most of its results outperform APRA, especially with a 4.3 dB improvement in the case of a “G” target with a resolution of 0.5 mm. In addition, it is verified that the quality of reconstructed images of AS-UnetM is less affected by distance than H-UnetM.The overall trend of the PSNR value calculated by the real experiment is consistent with the simulation results. The PSNR of the entire image reconstructed by AS-UnetM at 20 mm is 64.02 dB, which shows the improvement of 5.5 dB and 0.1 dB, compared with the results of ASM and APRA, respectively. The PSNR of the area near the target is 67.21 dB, which is 0.8 dB higher than the result of APRA. In addition, the experimental results also show that AS-UnetM can reduce the influence of noise caused by the multi-frame stacking to obtain the hologram in the real experiment to a certain extent. When the number of holograms collected reaches about 4 frame, the amplitude of the area near the target can be effectively reconstructed by AS-UnetM method, which improves the imaging efficiency.AS-UnetM can be directly used for image reconstruction of terahertz digital holographic imaging system similar to this paper. In addition, it has reference value for digital holographic reconstruction with obvious diffraction effect at other wavelengths. At present, the structure of the targets in the training set is relatively simple, and the scenes are all ideal. In the future, measures such as improving the training set and adjusting the network structure are expected to realize the reconstruction of more complex target scenes. And it is necessary to perform the resolution plate experiment to fully evaluate the imaging effect. In order to take full advantage of holographic imaging that can directly realize three-dimensional (3D) imaging, it is also necessary to carry out further research on the applicability of AS-UnetM in 3D reconstruction.
Oct. 10, 2023Vol. 50 Issue 19 1914001 (2023)
Jing Zhang, Haicheng Liu, Xiuhua Fu, Shengqi Wang, Yibo Wang, Junqi Liu, Tianxiang Zhang, Fei Yang, and Gang Li
ObjectiveWith the advent of the information age, optical communication has been widely used in the communication field owing to its high transmission rate, significant information capacity, good security performance, and strong anti-interference capability. Narrowband filter films, which are crucial components of multiplexers and demultiplexers, are the key components of optical communication. With the development of optical communication, the demand for narrowband filter films are increasing. Currently, research on narrowband filter films is relatively well-established both domestically and internationally. However, there a scarcity of literature regarding the preparation of fine-wavelength division multiplexing (LWDM) filter films via thermal evaporation. Moreover, the LWDM filter film comprises a substantial number of layers, making it vulnerable to monitoring errors and spectrum distortion. Consequently, the development of narrowband filter films that possess a narrow bandwidth, small passband ripple, low insertion loss, and a large cutoff transmission isolation, and that meet the technical requirements of modern optical communication is of great research significance and has immense application value.MethodsHigh-quality filter films for optical communication were deposited on K9 substrates using electron-beam thermal evaporation and ion-assisted deposition techniques. The film was designed using Ta2O5 and SiO2 selected as high- and low-refractive-index materials, respectively, owing to their stable properties. The factors affecting the half-width of the passband of the F-P film system were theoretically calculated and analyzed, and the film system was adjusted according to Baumeister’s theory. Multiple single-cavity F-P film systems were connected in series to improve the spectral rectangularity, and a matching layer was added to reduce the passband ripple, resulting in the completion of the LWDM narrowband filter film design. The design of the LWDM narrowband filter film was completed. A SPOC-1300TCI vacuum coater was used to prepare the filter film. The effects of deposition rate and ion source energy on the surface roughness of Ta2O5 and SiO2 were investigated. The surface roughness of Ta2O5 was smaller than that of the substrate, while that of SiO2 was larger. The surface roughness of both materials gradually decreased and leveled off as the deposition rate increased. The effect of the ion source energy on the surface morphology of the film layer was minimal. Through the above single-layer experiments, the deposition rates of Ta2O5 and SiO2 were chosen to be 0.4 and 0.8 nm/s, respectively. These rates were chosen while considering the influence of the deposition rate on the surface roughness of the film layer and challenges in monitoring the thickness of the film layer.Results and DiscussionsOwing to the numerous film layers and long coating time required for the narrow-band filter film, mechanical structures such as the vacuum degree of the vacuum chamber, material evaporation characteristics, correction plate alterations under long-term high-temperature environments, and the actual thickness of the film layer are inconsistent with the design. Moreover, there can be spectral distortions due to the unbalanced optical thickness ratio of Ta2O5. To address this issue, we propose a debugging method for achieving high-precision film thickness uniformity and spectral consistency (Fig. 9). According to the equivalent layer theory of the membrane system, the F-P membrane system with two cavities is equivalent to a single-cavity F-P membrane system; that is, the first and second cavity layers are equivalent to the reflection layer on both sides of the single-cavity F-P membrane system, and the original coupling layer is equivalent to the spacer layer on both sides of the single-cavity F-P membrane system. When the coupling layer in the 44 L double-cavity membrane system is changed from L to 2 L, it increases the thickness of the spacer layer and the interference order of the membrane system. As a result, transmission peaks appeared at the central wavelength. The wavelength spacing between adjacent transmittance peaks is not equal and changes with the material type and film thickness. The error of the optical thickness of Ta2O5 and SiO2 can be quickly analyzed by inverse analysis of the coating results of special film systems (Figs. 10 and 11). The correction plate is adjusted according to the analysis results to adjust the ratio of the optical thickness of Ta2O5 and SiO2 to improve the narrow-band filter film spectra. The film thickness monitoring method is studied, and a new monitoring method is proposed to monitor the accuracy of photoelectric polarization method. The optical direct monitoring method is used to monitor the film thickness during the plating process (Fig. 5); the substrate real-time measurement curve is fitted, and the film thickness is monitored according to the fitting results. Moreover, the coupling layer and non-regular film layer are monitored by the crystal-controlled average thickness method, which improves the monitoring accuracy.ConclusionsBased on the above debugging, the resulting filter film has bandwidths of 4.1 and 6.0 nm at -0.2 dB and -27 dB, respectively, a maximum insertion loss of 0.14 dB in the passband, and a passband ripple of 0.04 dB, and a bandwidth of 6.0 nm at -27 dB, thereby satisfying the technical requirements of narrowband filter film for LWDM.
Oct. 10, 2023Vol. 50 Issue 19 1903101 (2023)
© Copyright 2018-2021 | Chinese Laser Press.
All Rights Reserved 沪ICP备15018463号-20