


Please enter the answer below before you can view the full text.

Yanmei Liang, Zihan Yang, Jianwei Shang, Chenlu Liu, and Jun Zhang
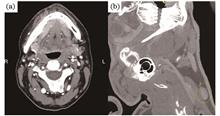
SignificanceOral cancer is among the most common cancers of the head and neck. Despite advancements in targeted cancer therapy, the survival rates of oral cancer patients have plateaued over the last 50 years. Common screening methods for oral lesions, such as visual inspection and palpation of tissue surfaces, are highly dependent on the experience of clinicians. Even if the biopsy or histopathological examination is performed for highly suspicious tissue regions, the limitations of time-consuming, invasive, and label-intensive are still inevitable. In clinical practice, intraoperative frozen section biopsies for surgical margins are routine procedures performed after en bloc resections of oral cancers. However, surgical margins are usually selected according to surgeon estimates of sites that may be suspicious of inadequate resection, resulting in the omission of positive margins. In addition, early detection of oral cancer plays a critical role in improving the prognosis and survival rate, but, accurate identification is difficult based on conventional screening methods.To improve the clinical diagnosis of oral diseases, researchers have conducted numerous studies on auxiliary diagnostic techniques, including X-ray computed tomography (X-CT), magnetic resonance imaging (MRI), ultrasound imaging (UI), fluorescence imaging (FI), photoacoustic imaging (PAI), and optical coherence tomography (OCT). Based on the associated imaging theories, different imaging technologies have unique advantages in terms of detecting oral diseases, resulting in different application scenarios. In this paper, we review the research on the foregoing auxiliary imaging technologies, summarize their advantages and disadvantages, and discuss the challenges and future developments in oral clinical applications.ProgressDifferent technologies demonstrate different features in terms of improving diagnostic sensitivity, specificity, resolution, and so on. Notably, X-CT and MRI are the earliest techniques used in oral clinics. They are exceptional in terms of their imaging depth and can evaluate bone invasion and the thicknesses of oral cancers.In recent years, with improvements in ultrasonic technology, the imaging resolution of UI using ultra-high-frequency ultrasound (30-100 MHz) has considerably improved. Such improved resolutions facilitate the observations of smaller microstructures (approximately 30 μm in size) of oral tissues. One recent study demonstrated that diagnostic sensitivity, specificity, and negative predictivity with values of over 90% were achieved in 150 patients with oral soft tissue lesions using an ultra-high UI system. In addition, Doppler ultrasound plays a major role in evaluating the neovascularization of oral neoplasms and metastatic lymph nodes by obtaining blood flow information (Fig. 3).Advancements in FI, including both auto- and extrinsic fluorescence, have enabled the exploitation of molecular information. Interestingly, autofluorescence of the oral epithelium and submucosa can be generated by laser excitation at 400-460 nm, which can then be used to identify oral lesions derived from changes in the concentration and properties of fluorophores. In contrast to benign oral mucosal lesions, malignant lesions are associated with autofluorescence loss. However, several benign lesions also exhibit fluorescence decay, resulting in low specificity. Through the continual exploration of fluorescent dyes and targeted tumor biomarkers, FI can achieve higher specificity in the detection of oral tumors.PAI is an imaging technology that has undergone developments in recent years and is based on the photoacoustic effect. Combining the advantages of optics and ultrasound, this technique has technical advantages in detecting oral tumor neovascularization (Fig. 5).OCT, which is a high-resolution, non-destruction, and label-free method, has been successfully used in ophthalmology, cardiology, and gastroenterology. Moreover, the feasibility of OCT in distinguishing different oral tumors has been verified (Fig. 6). In addition, for the early detection of oral cancer, OCT has been used to detect different types of oral mucosal leukoplakia (Fig. 7).To facilitate oral clinical studies, PAI and OCT are also undergoing rapid developments in terms of system miniaturization. In recent years, researchers have developed various miniaturized probes for oral imaging (Fig. 9).To compensate for the shortcomings of single-imaging techniques, multi-modal systems combining multiple diagnostic techniques have also been developed.With visual observations or qualitative analysis, misdiagnosis is inevitable. To improve the accuracy of image recognition and reduce the time cost associated with image reading, quantitative analysis and artificial intelligence approaches based on oral tissue images have been widely studied with the aim of extracting rich information from images (Fig. 10).Conclusions and ProspectsImaging technologies with non-destruction, high resolution, high sensitivity, high specificity, and real-time will play a critical role in assisting clinicians in screening and diagnosing oral cancers. Owing to the unique characteristics of different imaging techniques, their clinical application scenarios are different. Single-imaging techniques cannot completely satisfy all the requirements of oral disease diagnoses. Therefore, combining multiple imaging techniques to construct a multi-modal system can provide more abundant diagnostic information. In addition, quantitative and AI-based computer-aided methods that can provide objective screening and diagnostic results are expected to be developed.
Aug. 10, 2023Vol. 50 Issue 15 1507101 (2023)
Nannan Wang, Yufeng Gao, Wei Zheng, Hui Li, and Zhanyi Lin
ObjectiveAging is a major independent risk factor for aortic stiffness and cardiovascular diseases. The strength of the aorta is imparted by collagen fibers, which are the dominant fibrins within the aortic wall. Therefore, a three-dimensional (3D) quantitative assessment of age-related changes in the collagen fibers within the aortic wall is expected to provide important clues for research on cardiovascular diseases. Second harmonic generation (SHG) microscopy is an ideal tool for observing collagen fibers in biological tissues. Compared to the traditional histological analysis method, which requires tissue sectioning and staining, SHG microscopy has an intrinsic optical sectioning ability for the 3D imaging of intact tissues and allows label-free and high-specificity imaging of collagen fibers owing to its inversion-asymmetric and spatially ordered structure. Moreover, the high resolution, large depth penetration, low photobleaching and phototoxicity of SHG microscopy have significantly benefited the detailed imaging of thick tissues such as the aortic wall. However, the SHG-based 3D quantitative assessment of aortic collagen fibers has not yet been extensively demonstrated in aging-related research. In this study, we proposed combining SHG imaging with a representative spatial texture analysis algorithm, a 3D gray-level co-occurrence matrix (GLCM), to investigate age-related changes in the aorta from the perspective of collagen fiber microstructures. We hope that the proposed method and our findings can provide novel strategies and potential indicators for aortic aging assessment, and further benefit studies on age-related cardiovascular diseases.MethodsWistar-Kyoto (WKY) rats at 3 weeks (3 w), 12 weeks (12 w), and 44 weeks (44 w) were used in this study. First, the abdominal aortas were removed, cleaned, and cut open along the longitudinal axis. Subsequently, en-face 3D SHG imaging of the inner and outer surfaces of the aortic wall was performed using a commercial multiphoton microscope (A1R-MP; Nikon). Then, 11 texture feature parameters, including the correlation, contrast, entropy, energy, sum mean, variance, homogeneity, cluster shade, cluster prominence, max probability, and inverse variance, of the aortic collagen fibers were extracted from the 3D SHG image stacks using the 3D GLCM algorithm (Fig. 1). Finally, statistical analysis based on one-way ANOVA and Tukey's multiple comparison test was performed using GraphPad Prism software to sift out aging-associated features.Results and DiscussionsBy comparing the SHG images of the WKY rats of different ages, we found that the aortic collagen fibers gradually became thicker, less dense, and more evenly distributed from 3 w to 12 w and 44 w (Figs. 2 and 3), regardless of the intima, media, or adventitia. However, the general morphology of the collagen fibers in the aortic intima and media was remarkably different from that in the aortic adventitia. The intima and media collagen fibers were relatively straight (Fig. 2), whereas the adventitial collagen fibers were arranged in curved bundles and had stronger SHG signals (Fig. 3). The 3D GLCM analysis and statistics of the aforementioned SHG images further showed that in the aortic intima and media, six texture features of the collagen fibers, including the correlation, contrast, entropy, sum mean, variance, and homogeneity, were significantly different among the three age groups. These features characterized the consistency, clarity, strength heterogeneity, overall strength, strength concentration, and structural isotropy of the fiber textures (Fig. 4). Similarly, for the adventitial layers, three aging-associated textural features-the sum mean, variance, and homogeneity-were sifted out (Fig. 5). The age-related changes revealed by these preferential texture features were generally consistent with those observed in the 3D SHG image stacks. These results demonstrated that combining SHG imaging with the 3D GLCM algorithm is a practical strategy for assessing aging-related changes in the collagen fibers in the aortic wall, and that 3D GLCM texture features such as the correlation, contrast, entropy, sum mean, variance, and homogeneity are promising quantitative indicators of aorta aging.ConclusionsThis study proposed a novel strategy that combined SHG imaging with 3D GLCM for aortic-aging assessment from the fresh perspective of the collagen fiber microstructure. The collagen fibers within the aortic intima-media and adventitia of WKY rats with different weeks of age were imaged using SHG microscopy. The 3D GLCM was then used to quantify the stere omicrostructural characteristics of the collagen fibers based on the 3D SHG image stacks, and a variety of aging-related texture features, including the correlation, contrast, entropy, sum mean, variance, and homogeneity, were sifted out. The proposed method and derived texture features are expected to provide a powerful tool and important reference indicators for assessing the degree of vascular aging. Moreover, this method may benefit the research on age-related cardiovascular diseases. Nevertheless, it should be noted that the SHG intensity was highly dependent on the overlap of the laser polarization with the fiber alignment. The excitation light used in this study was linearly polarized. The intensity of the SHG signal appeared to be at a maximum when the laser polarization direction was parallel to the orientation of the collagen fibers, whereas it appeared at a minimum when the two directions were perpendicular. We hope to consider laser polarization in our future studies, despite a variety of measures taken to minimize the effects of polarization on the quantitative analysis results of the SHG images in the present study. In addition, we found that the three age groups considered in this study could not be completely distinguished from each other by relying merely on a single 3D GLCM texture feature, although the 3D GLCM algorithm is considered highly sensitive to fiber microstructures. Therefore, more sensitive and valuable quantitative analytical methods merit further investigation.
Aug. 10, 2023Vol. 50 Issue 15 1507102 (2023)
Xiaojuan Quan, Chenshuang Zhang, Danying Lin, Bin Yu, and Junle Qu
ObjectiveThe multifocal structure light microscope (MSIM) can achieve an imaging depth of 50 μm and a diffraction limited resolution that is two times that of the traditional wide-field structure light technique. However, factors such as fluorescence noise, scattering, and aberration limit its chromatographic capability and imaging depth when conducting super-resolution imaging of thick samples. To overcome these limitations, the MSIM technique combined with two-photon excitation, is implemented to obtain a two-photon multifocus structured light illumination microscope (2P-MSIM), and the imaging depth and resolution of MSIM are thus improved. The MSIM has great application potential in the field of fast super-resolution microscopic imaging of deep tissues in vivo. However, owing to the diffraction limit, the enhancement of the existing 2P-MSIM spatial resolution is limited. To further improve the spatial resolution of 2P-MSIM, a two-photon sub-diffraction multifocal structure illumination microscopy (2P-sMSIM) is proposed in this paper.MethodsUsing the improved Gerchberg-Saxton (GS) phase recovery algorithm, the conditions restricting the amplitude and the phase were enhanced in specific locations on the spectrum plane (the input plane reached the output plane after Fourier transform); subsequently, the amplitude and phase were constrained. After several iterations, the phase diagram of the sub-diffraction spot arrays (SSAs) was calculated, and the initial SSAs were obtained. The sidelobe intensity was controlled at approximately one-tenth of the center intensity (the sidelobe effect can be eliminated by the subsequent image-processing algorithm), and the algorithm parameter optimization was completed to obtain an SSA suitable for system imaging. Raw data for SSA and normal diffraction limited spot arrays were obtained. Next, Gaussian pinhole filtering, pixel relocation, and deconvolution algorithms were used to obtain the SSA and normal diffraction limited spot array images. The resolution of 2P-MSIM imaging was improved under the excitation of the SSA.Results and DiscussionsThe simulation results for the SSA and normal diffraction limited spot arrays are shown in Fig. 4. The average value of the full width at half maximum (FWHM) of the normal diffraction limited spot arrays is approximately 10.60 pixel; the average FWHM for a single focal point in the SSA is approximately 7.64 pixel. As a result, the SSA is 72% of the size of the normal diffraction limited spot arrays, achieving its design purpose. The phase diagram designed above is loaded onto a liquid-crystal spatial light modulator, and the SSA generated by the 2P-sMSIM system is used to excite the uniform eosin solution. Normal diffraction limited spot arrays and SSAs are obtained, and the experimental results are shown in Fig. 6. The normal diffraction limited spot arrays have an average FWHM of 0.71 μm±0.07 μm for a single point, while the SSA has an average FWHM of 0.57 μm±0.07 μm. The SSAs are 80% the size of the normal diffraction limited spot arrays. SSAs can effectively reduce the size of the point diffusion function of the system to further improve the resolution of the 2P-MSIM system. To test the 2P-sMSIM spatial resolution, cell microtubules were used as samples for the experiments, and the results are shown in Fig. 7. the normal diffraction limited spot arrays have a resolution of 151 nm±5 nm after scanning and 135 nm±5 nm after SSA scanning. The image resolution improved by approximately 16 nm after the sub-diffraction-focusing lattice scanning. The experiments prove that the SSA designed using this algorithm can effectively improve the resolution of 2P-MSIM imaging. To further demonstrate the imaging effects of the 2P-sMSIM, commercial mitochondrial sections obtained from Invitrogen were used for fluorescence imaging. The results are presented in Fig. 8. The images after the SSA scan processing are clearer, and the image quality is better. A ring structure that cannot be distinguished in the normal diffraction limited spot array scanned images is clearly observed in Fig. 8(f). The experiments further prove that SSA can effectively improve the resolution and imaging quality of the 2P-MSIM system.ConclusionsA design method for SSAs is developed in this study and applied to a 2P-MSIM for experimental verification in bioimaging. In the simulation experiment, normal diffraction limited spot arrays are compared with the SSA. By calculating their standard deviations, the SSA can shrink the spots to 72% of the normal diffraction limited spot arrays. The SSA is reduced to 80% of that of the normal diffraction limited spot arrays, proving that the SSA can improve the spatial resolution. Compared with the normal diffraction limited spot arrays, microtubule imaging experiments further verify the effectiveness of the algorithm, and its resolution is improved by approximately 16-135 nm. Mitochondrial imaging experiments also demonstrate the effectiveness and practicability of this algorithm, which lays the foundation for further applications of this algorithm in super-resolution imaging of living cells and tissues.
Aug. 10, 2023Vol. 50 Issue 15 1507103 (2023)
Jianyu Yang, Fen Hu, Mengdi Hou, Hao Dong, Jing Chen, and Leiting Pan
ObjectiveA human mature erythrocyte membrane skeleton is a triangular lattice network composed of various proteins under the membrane, which is essential for the maintenance of cell morphology, deformation, movement, and metabolism. The unique ultrastructural arrangement of the erythrocyte membrane skeleton is fascinating and has attracted many scientists to develop new technologies for imaging and analysis. Emerging single-molecule localization super-resolution microscopy (SMLM) has demonstrated significant capability in resolving the nanoscale ultrastructure of the erythrocyte membrane skeleton; however, the improvement of resolution has put forward high requirements for imaging analysis methods. A Vorono? diagram is a geometric analysis method that divides points in space into different regions to describe their spatial distribution. It is widely used in space exploration, materials science, machine learning, and other research fields. In recent years, this method has been prominently utilized in SMLM data extraction and analysis, mainly in the clustering and colocalization analysis of “point cluster”-shaped images. Taking advantage of the Vorono? method particularly in SMLM image analysis, we aim to apply this method to extract the distribution information of erythrocyte membrane skeleton protein SMLM images, to more quantitatively and accurately reveal skeletal organization characteristics.MethodsSMLM super-resolution images of erythrocyte membranes and skeletal proteins were obtained using a self-built SMLM imaging system. Actin was stained with fluorescently labeled phalloidin (Alexa 647-phalloidin). CD59, N terminus of β-spectrin, tropomodulin (TMOD), and ankyrin were labeled with specific antibodies. After SMLM imaging, regions of interest in the SMLM images were selected for analysis, and the corresponding point-cloud image was drawn according to the positioning coordinates. The centroid of each point cluster was subsequently acquired using DBCAN clustering analysis, and the image boundary was determined based on the maximum and minimum values of all centroid coordinates. The obtained centroids were used as seed points for Vorono? tessellation, and the vertex coordinates of the Vorono? polygon generated by each seed point were obtained using the voronoin function in MATLAB. Area A of the Vorono? polygon was calculated using the polyarea function in MATLAB. All areas A were divided by the average area〈A〉to obtain a histogram of the area distribution (Fig. 1). Finally, the area distribution of the Vorono? polygon was fitted with the γ function, which could be used to describe the spatial distribution characteristics of the “point cluster”-shaped SMLM images of erythrocyte membrane and skeleton proteins.Results and DiscussionsFirst, Vorono? analysis was performed for CD59, an erythrocyte membrane protein with high lateral mobility. The x-axis corresponding to the peak of the γ distribution profile (xpeak) of CD59 was 0.78 (Fig. 2), which was slightly larger than the xpeak of the simulated points with a random distribution (Fig. 3). Considering the radius of the point-spread function in the SMLM imaging system, each simulated point was adjusted to a disk with a certain radius (set to 15 nm) for analysis. It was identified that the xpeak derived from the γ distribution of the normalized area increased with point density, while fluctuating between 0.78 and 0.8 in the density range of 60~100 μm-2, which was consistent with the CD59 Vorono? analysis result, indicating a random distribution of CD59 (Fig. 3). Furthermore, the xpeak values of the membrane skeleton proteins localized at the nodes of the skeleton triangular lattice network of the erythrocyte membrane, including actin, the N terminus of β-spectrin, and tropomyosin, were all 0.86, while the xpeak value of ankyrin was 0.84, indicating that these skeleton membrane proteins were distributed relatively uniformly, whereas the distribution of ankyrin was more random than that of other skeleton proteins (Fig. 4). To investigate the effects of deletion and disturbance of an erythrocyte triangular lattice skeleton on Vorono? analysis results, a Vorono? tessellation of simulated points was conducted with a density considerable to that of actin (approximately 80 μm-2 measured by SMLM imaging) using a custom-written MATLAB routine. After generating simulated points with an 80 nm interval periodic triangular lattice distribution, random disturbances of varying degrees (0-0.5) relative to the lattice length were applied to the locations of all points, and some points were randomly removed such that the density was identical to that of actin (Fig. 6). The variation trend of xpeak was explored under different disturbance rates, and the results showed that xpeak was 0.86 when the disturbance rate was 0.15 (i.e., the skeleton disturbance was approximately 15%), which was consistent with experimental results, indicating that there was a disturbance of approximately 15% relative to the lattice length in the human erythrocyte triangle lattice skeleton (Fig. 6).ConclusionsIn this study, a solution based on a Vorono? diagram was proposed for the analysis of SMLM super-resolution images of the erythrocyte membrane skeleton. According to the SMLM images “point cluster” feature of membrane and skeleton proteins, we extracted the centroids of point clusters for Vorono? polygon tessellation, and introduced parameters including the x-axis coordinate xpeak corresponding to the peak value of Vorono? polygon area γ distribution curve, the variation coefficient Cv of the Vorono? polygon, and the peak value of the nearest distance for quantitative analysis and characterization of the spatial distribution of erythrocyte membrane and skeleton proteins. The results demonstrated that the accepted mobile membrane protein CD59 was randomly distributed on the cell membrane. Skeleton proteins that were considered to be localized at the triangular lattice nodes, such as actin, the N terminus of β-spectrin, and TMOD, showed a relatively uniform distribution with a disturbance rate of approximately 0.15, whereas the distribution of ankyrins on the spectrin skeleton was slightly less uniform than that on the lattice node. These results demonstrated the validity of the Vorono? method in evaluating the distribution characteristics of erythrocyte membrane skeleton proteins, and the method can be extended to extract and analyze information for other “point cluster”-shaped SMLM images. Finally, the Vorono? analysis strategy is beneficial for understanding accurate spatial distribution characteristics of membrane skeleton proteins and provides novel insights and methods for in-depth information extraction from SMLM super-resolution data.
Aug. 10, 2023Vol. 50 Issue 15 1507104 (2023)
Tong Sun, Guojia Huang, and Zhenhui Zhang
ObjectiveHepatocellular carcinoma (HCC) is the most common primary liver malignancy and the second leading cause of cancer death worldwide. The development of HCC leads to abnormalities in the structure and function of blood vessels, which further lead to high pressure and hypoxia in the tumor microenvironment (TME). The most common clinical methods for identifying HCC nowadays are magnetic resonance imaging (MRI), computed tomography (CT), and ultrasound. MRI can measure multifunctional parameters of the liver; however, it has significant limitations in imaging resolution and is costly. CT can image the blood vessels in the liver; however, it uses X-ray, thus increases the risk of cancer. Ultrasound imaging is widely used to evaluate HCC; however, its sensitivity and specificity are low. Therefore, a more complete and reliable technique to analyze the micro-vascular morphology of HCC and TME is urgently needed. Photoacoustic imaging is a rapidly developing imaging technology in recent years. It offers a wide range of potential applications in the field of medical imaging and can visualize the structure and function information of biological tissues without labeling of contrast agents or invasion. Photoacoustic imaging has high specificity and sensitivity in the diagnosis of HCC and can visualize functional imaging of tumors and morphological examination of blood vessels.MethodsA mouse model of in situ liver cancer was established, and the bioluminescence signal was activated by an in vivo fluorescence imaging system to locate the tumor. The microvascular structure characteristics and oxygen saturation of normal liver lobules, tumor centers, and adjacent tumors were accurately observed using photoacoustic microscopy. The concentrations of oxygenated and deoxygenated hemoglobins were quantified using the spectroscopic separation method to calculate blood oxygen saturation. The photoacoustic images were converted into binary images, and the vascular signals were extracted for density and diameter analysis.Results and DiscussionsThe results obtained using photoacoustic microscopy via two wavelengths (532 nm/559 nm) show that the blood vessels in the normal liver are evenly spaced and well differentiated, whereas large irregular vessels appear at the edges of the tumors, and the vascular joints are curved and dilated. The blood vessels inside the tumors are unevenly distributed and the branch diameter increases. The oxygen concentration in the blood around the tumors decreases, resulting in a hypoxic and high-pressure TME.ConclusionsIn microvascular monitoring of hepatocellular carcinoma, the photoacoustic imaging can provide high-resolution images, which can more accurately detect the morphology of tiny and abnormal blood vessels, improving the accuracy of early cancer detection. Through image analysis, indicators such as the density and diameter of microvessels and other information such as oxygenation level and metabolic activity of tumor tissues can be evaluated to assess the growth state of tumors and predict the degree of malignancy. Photoacoustic imaging demonstrates a high application potential for studying the development of HCC. It can provide further insights into the antiangiogenic therapy of tumors and the diagnosis of numerous liver-related diseases.
Aug. 10, 2023Vol. 50 Issue 15 1507105 (2023)
Mengfan Geng, Hu Zhang, Zhe Li, Ting Hu, Kebin Jia, Zhonghua Sun, and Jinchao Feng
ObjectiveCherenkov-excited luminescence scanning imaging (CELSI) is an emerging optical imaging technology that provides a new tool for tumor diagnosis and treatment. However, CELSI image reconstruction is ill-posed and underdetermined because of light scattering in biological tissues and limited boundary measurements. Regularization techniques have been widely adopted to alleviate the ill-posedness of the CELSI reconstruction. However, these methods typically exhibit poor image quality. To date, deep-learning-based reconstruction algorithms have attracted significant attention in optical tomography. To enhance the image quality of CELSI, we develop a reliable and effective deep learning reconstruction algorithm based on unrolled iterative optimization.MethodsIn this paper, a deep learning reconstruction algorithm is introduced based on unrolled iterative optimization, which takes the acquired sinogram image as network input and directly outputs the high-quality reconstructed images through end-to-end training. First, the image reconstruction of CELSI is reformulated as a l1 norm optimization problem based on sparse regularization technique. Second, the alternating direction method of multipliers (ADMM) based neural network algorithm (ADMM-Net) is adopted to minimize the optimization problem, which converts each iteration into convolution neural network (CNN) processing layer and deploys multiple processing layers cascaded into a deep network. Each processing layer consists of a reconstruction layer, a nonlinear layer, and a multiplier update layer. We linearize the reconstruction layer to avoid matrix inversion. The nonlinear transformation function in the nonlinear layer consists of five convolutional operators with three rectified linear unit (ReLU). The first convolution operator comprises 32 filters with the size of 3×3, and the other convolution operators consist of 32 filters with the size of 3×3×32. Note that all the parameters in the ADMM-Net are end-to-end updated through gradient backpropagation, including the step size and regularization parameter in the reconstruction layer, the shrinkage threshold in the nonlinear layer, as well as the nonlinear transformation function. To evaluate the effectiveness of ADMM-Net, numerical simulation experiments were performed, and the performance was compared with the traditional FBP algorithm, two deep learning algorithms (FBPConvNet and ISTA-Net+). Root mean square error (RMSE), peak signal-to-noise ratio (PSNR), and structural similarity (SSIM) are used as quantitative metrics.Results and DiscussionsFirst, the influence of the number of layers on the reconstruction performance is evaluated. Our results show that a better image quality can be obtained when the number of layers increases (Table 1). However, a large number of layers increases the computational cost. To balance the quality of the reconstructed images and computational cost, the number of layers is chosen empirically as five. Furthermore, experiments are performed using a single fluorescent target. Compared with the other three algorithms, reconstructed images with fewer artifacts are obtained for the proposed ADMM-Net (Fig.5). The quantitative results show that the average values of PSNR and SSIM yielded by our algorithm are 33.75 dB and 0.86, respectively, and compared with the other three algorithms, ADMM-Net achieves the average reduction of 81.5%, 16.3%, and 25.2% in RMSE, improvement of 77.8%, 5.1%, and 8.6% in PSNR, and increases of 47.2%, 4.5%, and 2.7% in SSIM (Table 2). The ability of ADMM-Net to distinguish between two targets is also tested. When the edge-to-edge distance between the two fluorescent targets is 2 mm, the FBP, FBPConvNet, and ISTA-Net+ algorithms fail to separate the two fluorescent targets, whereas ADMM-Net successfully distinguishes the two fluorescent targets (Fig.8). The plot of the profiles again confirmed that ADMM-Net can achieve satisfactory results in terms of the reconstructed positions, sizes, and quantum yields of the fluorescent targets (Fig.9). Finally, the generalizability of ADMM-Net is verified by reconstructing three and four fluorescent targets with different ratios of fluorescence quantum yields. Our results reveal that the FBP, FBPConvNet, and ISTA-Net+ algorithms cannot accurately recover the distribution of fluorescent targets. In contrast, the proposed algorithm exhibits a good generalization performance and can accurately recover the distributions of three and four targets (Fig.11).ConclusionsThis paper proposes a deep learning reconstruction algorithm for CELSI based on unrolled iterative optimization (ADMM-Net), which combines the structure of the iterative update steps of the ADMM algorithm with a CNN. The performance is evaluated through numerical simulation experiments. As a result, compared with the FBP, FBPConvNet, and ISTA-Net+ algorithms, the proposed algorithm can yield better results with fewer artifacts and higher quantitative accuracy when reconstructing single fluorescent targets with different contrasts. Moreover, the proposed algorithm can distinguish between two fluorescent targets with high image quality, even when the edge-to-edge distance is 2 mm. Our results also demonstrate that our algorithm has a good generalization performance and can reconstruct three and four fluorescent targets accurately, even when the model is trained on a dataset with only one or two targets.
Aug. 10, 2023Vol. 50 Issue 15 1507106 (2023)
Yanqi Lu, Minghui Chen, Kaibo Qin, Yuquan Wu, Zhijie Yin, and Zhengqi Yang
ObjectiveOptical coherence tomography (OCT) is widely employed for ophthalmic imaging and diagnosis because of its low latency, noncontact nature, noninvasiveness, high resolution, and high sensitivity. However, two major issues have hindered the development of OCT diagnostics for ophthalmology. First, OCT images are inevitably corrupted by scattering noise owing to the low-coherence interferometric imaging modality, which severely degrades the quality of OCT images. Second, low sampling rates are often used to accelerate the acquisition process and reduce the impact of unconscious motion in clinical practice. This practice leads to a reduction in the resolution of OCT images. With the development of deep learning, the use of neural networks to achieve super-resolution reconstruction of OCT images has compensated for the shortcomings of traditional methods and has gradually become mainstream. Most current mainstream super-resolution OCT image reconstruction networks adopt convolutional neural networks, which mainly use local feature extraction to recover low-resolution OCT images. However, traditional models based on convolutional neural networks typically encounter two fundamental problems that originate from the underlying convolutional layers. First, the interaction between the image and convolutional kernel is content-independent, and second, using the same convolutional kernel to recover different image regions may not be the best choice. This often leads to problems, such as excessive image smoothing, missing edge structures, and failure to reliably reconstruct pathological structures. In addition, acquiring real OCT images affects the training effectiveness of previous models. First, deep learning models usually require a large amount of training data to avoid overfitting; however, it is difficult to obtain a large number of real OCT images. Second, even if the results are excellent, it is meaningless to train the model without using images acquired from OCT devices commonly used in today’s clinics. To address the above problems, this study proposes a new OCT image super-resolution model that has the advantages of a convolutional neural network and incorporates a transformer to compensate for its disadvantages, while simultaneously solving the data aspect problem considering recent real clinical images and data enhancement methods during training to increase the generalizability of the model.MethodsIn this study, a transformer-based TESR for OCT image super-resolution network was constructed. It constituting three parts: a shallow feature extraction module, a deep feature extraction module, and an image reconstruction module. First, the input image is fused with the extracted edge details using the edge enhancement module, and then shallow feature extraction is performed using a basic 3×3 convolution block. The deep feature extraction module comprises six feature fusion modules, FIB, and a convolution block to extract more abstract semantic information. The FIB module comprises six newly proposed pyramidal long-range transformer layers, PLT, and a convolutional block. The PLT module fuses two mechanisms of local and global information acquisition, where the shifted convolutional extraction module is used to expand the perceptual field and effectively extract local features of the image, and the pyramidal pooling self-attention module is used to strengthen the attentional relationships between different parts of the image and capture feature dependencies over long distances. Finally, image reconstruction was completed using a pixel-blending module.Results and DiscussionsWe compare our model with four classical super-resolution reconstruction models for 2× and 4× reconstruction, namely, SRGAN, RCAN, IPT, and SwinIR. Quantitative evaluation metrics include the peak signal-to-noise ratio (PSNR), structural similarity (SSIM), and learning perceptual image patch similarity (LPIPS). For qualitative evaluation, we provide 4× reconstructed images sampled from both datasets for comparison. The experimental results show that TESR outperformed the other methods on both datasets. Objectively, the PSNR results of TESR improved by 7.1%, 6.5%, 3.2%, and 1.9%, the SSIM results improved by 5.9%, 5.3%, 3.5%, and 2.2% (Table 1), and the LPIPS results decreased by 0.1, 0.13, 0.06, and 0.01 (Table 2) for the 4× image reconstruction. Similar results are obtained for 2× image reconstruction. Zooming in on the key reconstructed areas, it is clear that the TESR-reconstructed images can better restore the hierarchical information of the retina using the edge enhancement module and image feature extraction (Fig. 9). The retinal edge structure is sharp, the texture details are clear, and there are no obvious noise or artifact problems (Fig. 10). The overall image is clean with high realism and is close to the HR reference image. The experiment verifies the effectiveness and superiority of TESR for super-resolution reconstruction of OCT images.ConclusionsTo address the problems that OCT image super-resolution reconstruction algorithms focus too much on local features and ignore the internal knowledge of the overall image, while lacking the extraction of retinal edge details, we proposes a transformer-based edge enhancement OCT image super-resolution network TESR. TESR restores the edge detail information of OCT images with high quality through the new edge enhancement module, while suppressing the noise problem of the images. The PLT module used in deep feature extraction further fuses the local and global information of the image to model the overall internal information of the image over a long range. This approach eliminates the artifact problem that tended to occur in previous algorithms and improves the realism of the reconstructed images. The experiment shows that the TESR model proposed in this study is better than other classical methods in terms of PSNR and SSIM, respectively. It is excellent in terms of LPIPS, and has a significant improvement in subjective visual quality. Additionally, the model has a strong generalization ability. In the future, more effective self-attentive implementations will be explored to reduce the computational complexity of the transformer and improve the convenience of the super-resolution reconstruction technique for clinical practice.
Aug. 10, 2023Vol. 50 Issue 15 1507107 (2023)
Sile Deng, and Haobin Chen
SignificanceIn recent years, there has been significant progress in the development and application of nanomaterials in the field of bio-optics. These advancements have led to benefits for medical diagnosis and treatment, such as biosensing, bioimaging, cell tracking, and phototherapy. Nanomaterials possess unique properties that allow for advances in targeting, precision, resolution, real-time and non-invasive detection for bio-optical applications. Among a large number of luminescent nanomaterials, organic semiconducting polymer dots (Pdots) have attracted extensive attention due to their large absorption cross sections, high brightness, stable photostability, excellent biocompatibility, and tunable spectra. Compared to traditional luminescent dyes, which have weak photostability, low brightness, and short lifetime, Pdots have smaller sizes and higher photophysical properties, which contribute to better conversion efficiency and detection results.Pdots have been widely used in the bio-optical field, including in biosensing, bioimaging, and phototherapy applications, which are of great significance for point-of-care testing, in vivo imaging, and tumor therapy. Point-of-care testing based on biosensing technology enables the specific and rapid detection of analytes, which contain significant physiological information. This promotes patient self-management of health. The outstanding sensitivity, response time, selectivity, and reversibility of Pdots make it possible to ensure the convenience and speed of detection while maintaining the same accuracy as laboratory testing. Apart from biosensing, bioimaging technology realizes the visualization of internal structure of organisms and achieves functional imaging for significant medical signals, offering accurate and reliable information for disease diagnosis and treatment. Pdots used as optical probes usually provide near-infrared imaging, which has deeper penetration and lower background interference compared to conventional contrast agents. More importantly, the excellent specificity and tumor targeting capabilities of Pdots enable more effective medical images for in vivo tumor imaging. With their multimodal imaging ability, Pdots have been applied in the field of multimodal imaging, serving as fluorescent probes while giving other imaging signals such as photoacoustic imaging (PAI), magnetic resonance imaging, or computed tomography, which simultaneously provide location and physiological signals of the detection region. In addition, cancer phototherapy depends on energy transfer to damage or kill the tumor cells while avoiding damage to normal tissue, including photothermal therapy (PTT), photodynamic therapy (PDT), and photoimmunotherapy. Traditional therapeutic agents have limited therapeutic efficacy and are prone to cause damage to normal tissue. In contrast, Pdots possess the ability to be easily modified and have high conversion efficiency, resulting in enhanced tumor targeting and smoother drug delivery to the tumor area, which can improve treatment results.The numerous advantages of Pdots make them suitable for bio-optical applications in complex physiological environments, which are highly valuable in biomedical research. Pdots have become one of the crucial materials for biosensing, bioimaging, and optical therapy, aiding in the diagnosis and treatment of diseases, especially in cancer treatment.Progresshe luminescence mechanisms of Pdots are summarized, including fluorescence, phosphorescence, and thermally activated delayed fluorescence (Fig.2). Moreover, this section presents the properties and methods of preparation, modification, and functionalization of Pdots, which are fundamental to their bio-optical applications as specific functional groups enhance the performance of Pdots and extend their range of applications (Fig.3). Firstly, the biosensing applications of Pdots are introduced to demonstrate their potential in the field of point-of-care testing. NADH-sensitive Pdots bound to specific enzymes were used to detect the concentration of metabolites oxidized by NAD+ or reduced by NADH, including phenylalanine (Fig.4), lactate, and glutamate. Similarly, oxygen-sensitive Pdots were coupled with glucose oxidase to achieve blood glucose concentration detection for diabetic self-management (Fig.5). Different modification and functionalization strategies of Pdots enable diverse biosensing applications, including nucleic acids (Fig.6), tumor markers (Fig.7) and enzyme activity (Fig.8). Subsequently, the bioimaging applications of Pdots are presented to show the advantages of Pdots-based probes compared to traditional dyes. Pdots as fluorescence probes ensured in vivo tumor imaging and vascular imaging of mice with a higher signal-to-background ratio and penetration depth (Fig.9). Pdots-based contrast agents have been successfully applied in PAI for brain tumor imaging, thanks to their efficient metabolizable capacity and excellent biocompatibility (Fig.10). Furthermore, Pdots that emitted fluorescent and photoacoustic signals have combined fluorescence imaging with PAI to yield dual-modal imaging. Similar principles were extended to other multimodal imaging (Fig.11). Finally, phototherapy applications demonstrate the capability of Pdots in cancer treatment. Pdots-based PTT agents provided high photothermal conversion efficiency and biosafety to accomplish accurate and effective treatment (Fig.12). The extraordinary energy transfer efficiency and tumor targeting capability of Pdots compensated for the shortcomings of conventional photosensitizers, resulting in inhibited tumor growth in mice (Fig.13). In addition, the use of photoimmunotherapy agents in combination with Pdots enhanced the immune response in the tumor area which suppressed tumor growth and metastasis (Fig.14).Conclusions and ProspectsPdots have been widely used in bio-optical applications such as biosensing, bioimaging, and optical therapeutics. The excellent properties of Pdots allow them to be applied to a wide range of subjects and environments with good results in detection and treatment. In the future, Pdots can be further enhanced in terms of preparation and functionalization, and combined with emerging technologies to achieve intelligent detection and treatment.
Aug. 10, 2023Vol. 50 Issue 15 1507401 (2023)
Fan Gong, and Yuxuan Ren
SignificanceOptical tweezers are a high-resolution force measuring technique invented by A. Ashkin and colleagues in 1986. Optical tweezers, in brief, use a highly focused laser beam that can form a stable three-dimensional trap to manipulate micron-sized particles. Optical tweezers have sub-piconewton force resolution and sub-millisecond time response, which can be widely used in single-molecule biophysics. In single-molecule optical tweezers experiment, traditional optical tweezers geometries include single-trap and dual-trap geometries. Compared with the single-trap geometries, the dual-trap “dumbbell” assay has better stability and noise resistance, resulting in higher resolution and playing an important role in the study of DNA-protein interactions, protein folding and the mechanochemical properties of molecular motors. In this review, we provide an overview on the basic principles of optical tweezers and the experimental setup of the dual-beam optical tweezers in the National Facility for Protein Science in Shanghai. The application and progress of dual-beam optical tweezers in single-molecule biology are summarized, and we focus on investigating some perspectives for future applications.ProgressWhen a photon is absorbed by an absorptive particle, the partial momentum of the photons is transferred to the particle, which in turn generates an optical trapping force that stabilizes the particle. Quantitative calculation of the optical trapping force depends on the wavelength of the trapping light and the size of the trapped particle. When the particle radius is close to or greater than the light wavelength, the optical trapping forces can be calculated from “ray-optics” model. When the particle size is smaller than the wavelength, the electromagnetic scattering theory is often chosen as the calculation model (Fig. 1).Optical tweezers are mainly used in the study of single biomolecules such as proteins and nucleic acids. The systems commonly used in single-molecule optical tweezers experiments include single-trap optical tweezers, dual-trap optical tweezers and angular optical tweezers. These experimental systems involve a variety of geometries, which can be used to directly manipulate single molecules and measure mechanical relevant parameters (Fig. 2). Among them, the “dumbbell” geometry of the tweezers has better stability and noise immunity and higher resolution than other optical tweezers configurations, and these advantages make the tweezers widely applied in single-molecule mechanical properties. The National Facility for Protein Science in Shanghai developed high-precision dual-trap optical tweezers and successfully used them to study the folding dynamics of protein complexes (Fig. 3). In this system, in order to accurately obtain the important parameter of optical trapping force, we chose to use the power spectral density method to calibrate the optical trap stiffness (Fig. 4), and realized base-pair resolution on the measurement of tether extension on the dual-trap optical tweezers (Fig. 5).Optical tweezers provide powerful single-molecule evidence to study the mechanical behavior of nucleic acid and proteins that constitute the major roles in the interpretation of the central dogma in molecular biology (Fig. 6). Stretching dsDNA with dual-trap optical tweezers helps us understand the elastic model of DNA and lays a foundation for exploring protein folding, DNA-protein complex interactions and mechanochemical properties of molecular motors. Dual-trap optical tweezers can reveal the protein folding process at the single-molecule level, detect subtle protein misfolding information, and measure the translation, folding and molecular regulation processes of multi-domain proteins in real time. All those studies offer single-molecule information for understanding and treating neurodegenerative diseases (Fig. 7). DNA-protein binding is closely related to the molecular mechanisms of DNA replication, repair and transcription. The ability of dual-trap optical tweezers to monitor DNA-protein interactions in real time at the single-molecule level has advanced the development of related molecular mechanisms and molecular dynamics (Fig. 8). In addition, dual-trap optical tweezers can be used to study the motion characteristics of molecular motors. Mechanochemical properties of molecular motors are understood by measuring parameters such as step size, velocity, and run length (Fig. 9). Dual-trap optical tweezers can also be used to reveal how molecular chaperones regulate the folding and assembly process of protein complexes to clarify the folding mechanism, and provide the single-molecule basis for physiological processes (Fig. 10).In recent years, dual-trap optical tweezers have been developing continuously. Laser Raman spectroscopy tweezers (LRST) have enabled the simultaneous combination of single-molecule manipulation and Raman spectroscopy measurements without direct contact with the sample. Dual-trap Raman tweezers built on this basis can detect the interaction between cells or stretch a single cell to study the changes caused by deformation (Fig. 11). The combination of optical tweezers and single-molecule fluorescence detection breaks the limitation that optical tweezers can only measure in one-dimensional direction, which enables the study of complex conformational changes at three-dimensional level (Fig. 12). Building on this, the combination of ultra-high resolution imaging technology with dual-trap optical tweezers makes it possible to capture the dynamics of a single protein at high protein concentrations (Fig. 13). Besides, nano-optical tweezers are capable of ultra-precise localization of single nano-objects and can track the changing state of biological macromolecules at high resolution over long periods (Fig. 14).Conclusions and ProspectsAfter more than three decades of development, dual-trap optical tweezers have gradually formed a well-established experimental system in biological research, and the increased temporal and spatial resolution has further extended the application range of dual-trap optical tweezers. At the same time, dual-trap optical tweezers face many challenges in the development and biological application, for example, low throughput or low trap depth and efficiency of living cells. In recent years, although several commercial optical tweezers instruments have been launched for single-molecule studies to promote the single-molecule science, the use of optical tweezers to study single molecules is still developing in China. The National Facility for Protein Science in Shanghai is among the few labs to develop high-precision dual-trap optical tweezers for single-molecule studies. The instrument has high stability and a high signal-to-noise ratio, which has been used in biological single-molecule researches. It is expected that single-molecule experiment using optical tweezers would enter a new phase in China in the coming decade.
Aug. 10, 2023Vol. 50 Issue 15 1507402 (2023)
Mingliang Xu, Fangyuan Li, Yueqi Liu, Jinhui Zhang, Yazhou Shi, and Fei He
SignificanceThe nervous system is composed of different types of neurons connected in a network. Neurons communicate with each other through electrochemical signals, and this dynamic interaction of neurons is the internal driving force of human perception, cognition, and behavior. Deciphering and understanding the meaning of various complex neural activities is of great significance in the frontiers of neurological disease diagnosis and treatment, neurological rehabilitation, fundamental brain science, and several brain-computer interface applications. To achieve this, it is critical to develop advanced neural interfaces capable of interacting with the dynamic neural activities and nervous system. Fundamental research in this field has rapidly increased over the past few decades as a result of advancements in neuroscience and neurotechnology. This research includes the development of innovative neural recording and modulation tools that have provided researchers with an early glimpse into previously unanswerable questions, such as determining how the mind works, or which have been recognized and funded by a host of initiatives. In recent years, the United States, European countries, Japan, and China have launched their own brain initiatives to support this emerging field. In the future, in order to completely understand the complex structural and functional nervous system, more powerful tools must be developed to record, transmit, and modulate signals using multiple approaches. These tools must have the ability to manipulate neuron cell types specifically while minimizing side effects such as “the observer effect.”Neurological disorders affect more than one billion people worldwide, accounting for 7% of the total global disease burden, and this number is expected to increase substantially as human life expectancy increases and with increased population aging. This is largely due to neuropsychiatric diseases (including Alzheimer's disease, Parkinson's disease, epilepsy, and so on) and cerebrovascular diseases, which impose a heavy burden on society and individuals, while also promoting advances and developments in neuroengineering, biomedical science, and technology. Currently, the treatment of these diseases relies primarily on drug therapy or implantable electrical stimulation devices, such as injecting current into the target tissue through metal electrodes to activate or suppress the action potential of neurons, as well as to achieve therapeutic purposes, including using cochlear implants, deep brain stimulators, spinal cord electrical stimulation, and visual prostheses to reduce symptoms or restore nerve functions.ProgressWith the enrichment of multiple neural modalities, neural technologies and tools have been increasingly augmented, and have been widely used to collect neuron activities in vivo from individual neurons to neuron populations in different brain areas, with a variety of signal recording and modulation manners (Fig. 1). In addition, advances in genetic engineering, especially optogenetics, allow us to continuously control specific types of neurons with high accuracy and fidelity over a short period. The rapid development of genetically encoded neural probes provides new avenues for real-time and high-speed neural recording. Various optical, electrical, and chemical tools have been developed to record and modulate neural activities. Currently, the monolithic integration of multiple functional features has become a pressing demand and challenge in neural engineering, while flexible neural implants are expected to establish seamless integration with the soft biological tissue and achieve a high-bandwidth close-loop interaction with the nervous system. It will provide a powerful tool for identifying complex neural circuits, as well as diagnosing and treating neurological diseases. In order to more accurately understand the brain neural network and its working mechanism, and to treat neurological diseases with high selectivity, it is necessary to simultaneously monitor neural activities with high spatial and temporal resolution. The combination of electrophysiological and optical methods (for example, two-photon imaging and electrophysiological recording) can maximize the synergistic effect of the two methods, making up for the shortcomings of each method.Implantable multimodal neural interfaces integrate these approaches by maximizing their benefits and efficacy, providing neuroscientists with new access to the brain and revolutionizing applications such as the treatment and rehabilitation of neurological diseases. In order to achieve this, we need to understand the various neurotechnologies individually, how they function, as well as how they work together. Implantable neural interfaces have already been successfully employed in the long-term stable interrogation of large-scale neural activities and clinically restoring sensorimotor function in disabilities. However, they are limited in the long run by poor biocompatibility, mechanical mismatches between the device and neural tissue, and the risk of chronic inflammatory reactions after implantation. In addition, traditional neural probes are limited by spatial and temporal resolution and scalabilities, and still face challenges in the study of large-scale neural networks in situ (Fig. 1). To this end, long-term stability is achieved by matching the mechanical properties of the implanted device with those of the internal biological tissue. High spatial and temporal resolution and even specificity can be obtained by reducing the feature size of implants and mimicking the structural morphology of neurons. Multimodal neural interfaces are currently emerging, in particular, a variety of clinical multimodal implantable devices have been developed to treat neurodegenerative diseases such as Parkinson's disease, epilepsy, and depression. However, traditional device designs, such as electrophysiological readout, fluorescence cell imaging, and the structural dynamics of the brain, may conflict with each other during different data acquisition processes. Severe electrophysiological signal contamination caused by photoelectric (magnetic) artifacts can also occur. Over the past decade, there have been efforts to address these challenges, and many excellent results have emerged regarding the latest advances in neural technologies and applications.Conclusions and ProspectsWith the development of neural probe structures and materials, as well as the innovation of synthetic technologies for nanoparticles, dye molecules, and genetically encoded proteins, it is expected that neural technology will continue to be developed toward the limits of the lifetime, localization and specificity of neural recording and stimulation, and will eventually blur the boundary between living biological tissue and physical equipment and tools. These cutting-edge neural technologies, which combine advanced optical and nanoelectronic technologies, optogenetics, genetically encoded indicators, and acoustic and magnetic tools, provide us with unprecedented opportunities for new multimodal neural information interactions, with which powerful paradigms for multimodal inquiry of brain activity will be foreseen, and will even fundamentally alter how brain activity maps to the physical world.
Aug. 10, 2023Vol. 50 Issue 15 1507301 (2023)
Yuqing Xiao, Yang Shi, Baojun Li, and Hongbao Xin
SignificanceOptical trapping is widely used in various fields ranging from biomedical applications to physics and material sciences. Recently, tapered optical fiber tweezers (TOFTs) have attracted significant attention in the optical trapping field owing to their flexible manipulation, compact structure, and ease of fabrication. As a non-invasive technique, TOFTs can be used to directly manipulate cells in multiple dimensions in different bio-microenvironments. In addition, infrared light waves penetrate biological tissues well, which enhances the performance of TOFTs technology in the biology and medicine fields. Here, we review TOFT-based trapping and manipulation at the single-, multi-, and sub-cellular levels, as well as the latest developments in neuron regulation.ProgressSince Arthur Ashkin used two focused and counter-propagating beams to trap particles in 1970, optical forces have been widely used to manipulate and trap particles using laser beams. In 1986, Ashkin et al. discovered that a single tightly focused laser beam could achieve stable particle trapping. Subsequently, they named the optical-trapping technique as “optical tweezers,” which we now refer to as conventional optical tweezers (COTs). Over the years that followed, Ashkin et al. conducted numerous studies using a single focused laser beam for capturing particles ranging from tens of nanometers to tens of microns, including viruses and bacteria. Optical trapping and manipulation using COTs has undergone substantial progress regarding its methodologies and applications over the span of nearly 50 years. These techniques involve manipulating various samples, including dielectric particles, biological cells, and biomolecules. Nonetheless, focusing light via COTs requires a high-numerical-aperture (NA) objective along with diverse optical components for beam steering and expansion. Owing to its bulky structure, this framework remains deficient in control and manipulation flexibility.Alternatively, holographic optical tweezers (HOTs) were created in 1998 to allow the manipulation of multiple particles using complex-structured light fields. This technology uses computer-generated holograms through spatial light modulators to achieve multiple traps, thereby providing enhanced control and manipulation capabilities. However, trapping particles at the nanometer scale using HOTs remains challenging because of the diffraction limit. Surface-plasmon-based optical tweezers (SPOTs) were developed in the late 2000s to trap and manipulate nanoscale particles, including single molecules that are only a few nanometers in size. However, owing to their ability to trap nanoscale particles, the carefully designed and elaborated nanostructures necessary for SPOTs limit their flexibility. Techniques, such as COTs, HOTs, and SPOT, involve complex devices and components with inflexible control. Therefore, it is critical to develop simple and flexible manipulation tools. The advancements in optical fiber tweezers (OFTs) has made them versatile candidates for the optical trapping and manipulation of different samples. The simple structure of OFTs, consisting solely of optical fibers, provides them with exceptional advantages in terms of manipulation flexibility. OFTs can be easily inserted into thick samples and turbid media, significantly extending sample applicability. In addition, OFTs offer a low-cost solution because of their simple fabrication procedures. They can be integrated into small devices, such as optofluidic channels and chips, paving the way for a scaled-down approach. OFTs were first demonstrated in 1993 by employing two aligned single-mode fibers for optical trapping. Although tiny particles and cells can be directly captured and manipulated using the optical scattering force generated by two fibers, they also result in limited manipulation flexibility. A single optical fiber can also be used for particle trapping and manipulation. Single tapered optical fiber tweezers (TOFTs) were introduced in 1997 and have significantly improved the flexibility of optical manipulation. The end of a single fiber used for focusing the light beam is similar to that used in COTs after being drawn into a lenticular shape, which creates a stronger gradient force on the particle and facilitates optical trapping.Conclusions and ProspectsIn conclusion, this review highlights recent advancements in tapered optical fiber based tweezers for optical trapping and manipulation. Despite the significant progress, TOFTs still face numerous challenges. One of the major issues is the direct contact of the fiber end surface with the sample, which leads to mechanical damage. Thus, it is necessary to develop of non-contact and damage-free trapping techniques. Another critical area of concern is the stable trapping and manipulation of nanometer-sized samples that surpass the diffraction limits. TOFTs encounter difficulties in trapping individual biomolecules, which is of great importance for single-molecule analysis. Furthermore, optical trapping of cells and biological structures for biosensing in vivo is an upcoming trend; however, inserting fibers into living samples may cause mechanical damage. Hence, the construction of biocompatible TOFTs is crucial to maintain their application potential. Biophotonic waveguides composed of living cells enable the manufacturing of biocompatible optical fibers, making trapping, manipulation, sensing, and diagnostics feasible in vivo. On the other hand, TOFTs technology is constantly experiencing new breakthroughs owing to its combination with new technologies like artificial intelligence (AI) and spectral analysis, as well as new applications like neuromodulation and precision medicine.
Aug. 10, 2023Vol. 50 Issue 15 1507302 (2023)
Min Guo, Xiangyang Liu, Xianzi Dong, Jie Liu, Feng Jin, and Meiling Zheng
ObjectiveThe fields of tissue engineering and regenerative medicine have seen significant advancements, prompting extensive research into interactions between biomaterials and cells. Factors, such as surface chemical composition, stiffness, and topography, can influence cell adhesion, proliferation, migration, and differentiation. Advanced micro-nanofabrication technologies have made it possible to study cell-responsive topographical structures. Many cell types exhibit contact guidance behavior on groove structures, which in turn affects cell function. However, in vivo, normal tissues often exhibit curved and wavy extracellular matrix (ECM) structures, which differ significantly from previously fabricated regular topographies. Hence, in this study, maskless optical projection lithography (MOPL) was utilized to fabricate broken lines and wavy structures with varying curvatures. Groove structures were also created as controls. We examined cell migration behavior and morphological changes on the fabricated structures, proposing a cell migration mechanism specific to curved structures. This research aims to enhance our understanding of cell-surface topography interactions and provide valuable insights for designing implant materials.MethodsA series of micro-nano topography structures were successfully created using maskless optical projection lithography. The surface morphologies of these structures were characterized via scanning electron microscopy (SEM) and atomic force microscopy (AFM). To promote cell adhesion, the fabricated structures were treated with O2 plasma and coated with poly-D-lysine (PDL). Cells were then cultured on the topography structures, and their migration behavior was monitored using a live cell station. After cell culture on the topography structures for 24 h, the cells were fixed and labeled with DAPI and phalloidin fluorescent probes for nuclei and actin, respectively. Quantitative analysis of cell roundness, cell perimeter, and cell spreading area was conducted to determine changes in cell morphology. The fabricated topography structures were found to induce cell patterning, and their biocompatibility was confirmed via cell co-culture experiments.Results and DiscussionsWe successfully fabricated grooves, broken lines, and wavy structures using the MOPL technique. SEM images revealed the integrity and uniformity of the topography structures, while AFM images displayed 3D morphology of these structures. According to the AFM cross-sectional profiles, ridge heights within individual topography structures are consistent. Moreover, we subjected the surfaces of these structures to the same chemical treatment, thus isolating the impact of structural topography on cell behavior. Cell migration tracking experiments demonstrated that cells form straight, broken, and curved migration paths in accordance with the underlying topography. This finding suggests that topography structures significantly influence cell migration. Interestingly, cells on wavy structures with high curvature alter their original migration direction from along the ridge to along the curve. High curvature wavy structures prompt cell migration in the curved direction. Confocal fluorescence imaging revealed cell morphology on various topography structures. We observed that cells elongate and migrate along ridges in line regions, whereas they display reduced elongation and adopt curved morphologies in corner regions. In the corner regions of broken-line structures, cells exhibit right-angled morphologies. Actin stress fibers in cells align with the curved direction in high-curvature wavy structure corners whereas these fibers align with ridge direction in wavy structure line regions. We propose that this alignment represents an intrinsic mechanism driving cell migration in curved directions. Furthermore, we cultured cells on annular and hexagonal structures, resulting in cell patterns influenced by the induction effect of curved structures on cell migration. Live/dead fluorescence staining revealed that cells grown with the Mito-Tracker Green channel thrive, with almost no dead cells detected in PI channels. This finding suggests that the fabricated topography structures exhibit excellent biocompatibility.ConclusionsWe fabricated custom-designed topography structures using the MOPL technique, which presents a flexible and efficient method for creating micro/nanostructures. The cells exhibit migration trajectories that strictly adhere to the topography of grooves, broken lines, and wavy structures. In line regions, cells adopt an elongated morphology, while they assume a polygonal shape and increased roundness in corner regions of the topography structures. We posit that the high curvature of wavy structures generates an induction effect on cells, causing cytoskeletal rearrangement and cell migration along the curved direction. This observation suggests that topography plays a role in directing cell migration. By designing patterned structures based on cells' responsiveness to wavy structures, cell patterning can be realized. This study demonstrates that topography can significantly alter cell morphology and migration, enhancing our understanding of cell response mechanisms to topography. Additionally, our findings serve as a reference for designing implant materials.
Aug. 10, 2023Vol. 50 Issue 15 1507303 (2023)
Libin Liang, Liang Li, Tingting Gao, Guangzhi Wang, Hui Ding, Mingxi Wan, and Zhenxi Zhang
SignificanceMinimally invasive intervention techniques have become increasingly important in clinical practice, with the advantages of minimal trauma, reduced bleeding, and quick postoperative recovery. However, these techniques have limited visual fields or operating spaces due to the small incision size and the need to minimize damage to normal tissue. Consequently, preoperative planning and operation under image guidance are necessary. Commonly used image guidance in clinical practice includes computed tomography (CT), magnetic resonance imaging (MRI), ultrasound imaging and X-ray fluoroscopy, etc. Nevertheless, these guidance methods have limitations in terms of visualizing and perceiving surgical information. Firstly, the two-dimensional screen used in the image guidance lacks stereoscopic vision, making it difficult to observe complex three-dimensional anatomical structures. Secondly, the operator's attention needs to be switched repeatedly between the screen and the surgical position, which poses a problem for hand-eye coordination. Thirdly, the above image guidance methods are difficult to track or perceive the relative positions of the patient's lesions and surgical tools in real-time, continuous, and accurate manner. Therefore, the success of a surgical procedure heavily relies on the doctor's experience and spatial imagination, which carries the risk of imprecise treatment and potential complications. Moreover, current minimally invasive interventions face challenges in achieving precise control over the treatment range due to limitations in the surgical treatment form (mechanical resection, heat, or radiation-based forms) or a lack of intraoperative treatment status monitoring.In recent years, optical technology has rapidly developed and been widely applied in the diagnosis and treatment in biomedical field. In the field of minimally invasive intervention, optical assistance and laser ablation technologies play a crucial role in improving surgical precision and safety. Among them, augmented reality (AR) can provide new intraoperative information visualization schemes; optical tracking and sensing technology can provide quantitative spatial information and lay the foundation for precise surgical operations. Laser energy, with its excellent spatial directionality and flexibility, can be delivered to lesions through slender optical fibers and, when combined with intraoperative MRI temperature monitoring, can achieve more precise therapeutic effects. At the same time, the rapid development of artificial intelligence and its fusion with optical technology are promoting the development of minimally invasive interventions towards intelligent, precise, and personalized directions. Therefore, summarizing the optical assistance and laser ablation techniques is necessary to guide future development of this field.ProgressIn this paper, the research progress of optical assistance and laser ablation technologies is reviewed based on three aspects: (1) augmented reality; (2) optical tracking and sensing; (3) laser ablation.The existing research on AR devices mainly includes three forms (Fig. 2): monitor-based, projection-based, and optical see-through. Among these, optical see-through head-mounted AR is currently the leading trend in development. Although numerous AR research studies have been conducted on minimally invasive interventions for different types of diseases (Fig. 3), actual clinical applications are still relatively scarce. This is largely due to the insufficient accuracy, discomfort, and inconvenience of current AR devices. Future research will primarily focus on the core technology of AR, specifically display, tracking, and registration. Artificial intelligence methods will play a crucial role in advancing these areas.Optical tracking and sensing provide valuable quantitative information, including the position and shape of surgical tools and multi-dimensional tissue information. Current research primarily focuses on optical tracking, fiber Bragg grating (FBG), and optical imaging. Optical tracking is currently used in many minimally invasive procedures (Fig. 5), but it still has some limitations, such as the problem of occlusion of optical tracking equipment and image registration efficiency. With the increasing amount of information in modern surgery, the fusion of multiple information sources has become a new research trend, offering new solutions for markerless localization and tracking. In the future, intelligent localization, registration, and understanding of surgical scenes will be the focus of research. Additionally, perceiving multi-dimensional information of tissues is also an important development direction for surgical navigation. Researchers are increasingly paying attention to the application of FBG-based multi-dimensional information sensing in minimally invasive surgery (Fig. 6). Optical surface reconstruction and imaging, as important means of perceiving multi-dimensional tissue information, will be further integrated with artificial intelligence algorithms to make information processing more intelligent.Laser ablation is an important form of minimally invasive intervention therapy and has been applied to the treatment of tumors and vascular diseases. Currently, MRI-guided laser ablation has shown unique advantages in precise treatment (Fig. 8). However, improving the precision of ablation therapy is still the focus of current research. Achieving this goal depends on intelligent processing of imaging information, such as deep learning-based anatomical structure segmentation and personalized precise ablation simulation prediction, as well as the development of assisted robots and intraoperative temperature monitoring technology. In addition, the use of lasers for thrombus treatment is still a relatively new field, and many studies are exploring the combination of laser thrombolysis with intraoperative imaging (such as optical CT) from the perspective of precise treatment, which will be the focus of future development.Conclusions and ProspectsWith the rapid development of artificial intelligence, optical assistance and treatment technologies have seen new advancements in minimally invasive therapy by integrating with multidisciplinary fields such as computer vision, information science, and material science. AR technology provides a new visualization method and enhances doctors' confidence in their operations. Optical tracking and sensing make surgery more precise, while laser ablation has demonstrated advantages in precise treatment. Currently, there are numerous related studies, and we have reason to believe that intelligent optical assistance and treatment technology will continue to advance, leading to more intelligent, precise, and personalized minimally invasive interventions in the future.
Aug. 10, 2023Vol. 50 Issue 15 1507201 (2023)
Zufang Huang, Yuling Li, Shengrong Du, Yan Sun, Jiarui Wang, Qun Zhang, and Rong Chen
SignificanceThe quality of sperm in fertile men worldwide is deteriorating. Although sperm quality is not directly related to male infertility, it is strongly linked to subfertility. Assisted reproductive technology addresses common male infertility issues, such as low sperm count, abnormal morphology, and motility, and it is the primary technological solution to male infertility through the evaluation and screening of high-quality sperm. However, current clinical research is limited to screening sperm morphology and motility, and there is a lack of non-destructive screening methods for evaluating sperm DNA damage. This review article first introduces the demand for non-destructive sperm screening technology in assisted reproduction and the basic principle of micro-Raman spectroscopy, and then summarizes current Raman-based research progress on sperm. Next, a comprehensive analysis and discussion of Raman detection and Raman spectral characteristics of sperm cells are conducted, emphasizing the Raman response to sperm DNA damage. Finally, the potential for applied research in non-destructive sperm evaluation and screening is discussed and explored.ProgressRaman-based sperm analysis is still in the initial stage of development, but the unique advantages of Raman spectroscopy have opened up new routes for sperm characterization. In 2009, Huser et al. used micro-Raman spectroscopy to correlate the spectral response of chromatin differences with sperm morphology. Meister et al. achieved Raman imaging characterization of sperm nucleus, neck, and mitochondria in sperm cells. By simulating the damaging effect of UV radiation on different sperm organelles, it was verified that micro-Raman spectroscopy is expected to provide a new method for rapid assessment of sperm mitochondrial status. Subsequently, Mallidis et al. reported that the damage to sperm DNA due to UV radiation is mainly reflected in the intensity change of the PO4 skeleton peak (1042 cm-1) attributed to DNA. Additionally, the spectral response of sperm DNA damage due to UV light was only observed in dry conditions, not in solution media. A comparison of Raman results of sperm DNA and flow cytometry revealed different responses of sperm DNA damage to the characteristic peak intensities. Given the challenges of labor-intensive sperm sample processing in earlier research and the potential impact on Raman test outcomes, Huang et al. collected microscopic Raman spectrum data of normal and various abnormal morphology (pear-shaped, cone-shaped, small-headed) based on a new Raman test substrate. They achieved rapid sample preparation (tens of seconds) and effective classification using principal component analysis and linear discriminant methods (PCA-LDA) on the new substrates. Additionally, combined with the extended multiplicative signal correction (EMSC) method, Raman detection of DNA-intact and DNA-damaged sperm cells on glass slides was attempted, effectively “filtering” glass signal interference and obtaining the intrinsic Raman signal of sperm. Huang et al. also achieved rapid preparation of sperm samples, automatic segmentation of sperm head and acrosome regions, and quantification of morphology parameters using a hydrophobic substrate and image analysis. In 2016, Ferrara et al. combined holographic microscopic imaging with microscopic Raman spectroscopy not only to highlight the differences in sperm quality and morphology’s spatial distribution but also to show a novel method for sperm quality assessment in conjunction with sperm morphology assessment and Raman spectroscopy analysis.Regarding the Raman assessment of motile sperm, in 2012, Feng Liu et al. studied the interaction of sperm and the zona pellucida (ZP), the acrosome reaction induced by the zona pellucida, and the Raman spectral response of different regions of sperm. Hence, the acrosome region (800-900 and 3200-4000 cm-1) of zona-bound sperm shifted from mild hypointensity to hyperintensity compared to the Raman spectra of zona-bound sperm. In 2015, Edengeiser et al. achieved the “fixed” adsorption of motile sperm on the pretreated CaF2 substrate. Combined with the automatic measurement in the micro-Raman system, they detected a single motile sperm under physiological conditions. Raman spectroscopic detection allows the assessment of physicochemical parameters of sperm-induced oxidative damage under near-physiological conditions. Conversely, in 2020, Huang et al. realized the fixed “adsorption” of motile sperm on the smooth surface of a conventional substrate. For the first time, they obtained a Raman spectrum with a high signal-to-noise ratio from a single motile sperm using a water immersion objective and qualitatively compared motile and non-motile sperm. Additionally, the influencing factors of the stable “fixation” of sperm and Raman signal under different focusing conditions were discussed.Raman-based motile sperm study is still in its early stages, requiring more development and improvement in terms of experimental techniques and statistical data processing.Conclusions and ProspectsTraditionally, high-quality sperm evaluation and screening have focused on the relationship between sperm DNA integrity and sperm morphology and motility. However, a lack of non-destructive and objective evaluation research directly reflects the integrity of active sperm DNA. The current research on sperm microscopic Raman detection is still in its early stages and is mainly limited to detecting and characterizing spermatozoa or immotile sperm in non-physiological environments. The combination of microfluidic devices and micro-Raman spectroscopy can achieve non-destructive “capture” and “manipulation” of motile sperm. Based on this, research on DNA damage assessment of motile sperm using micro-Raman spectroscopy is being conducted. The integration of data comprehensive analysis based on information technology, such as deep learning and Raman spectroscopy technology, can effectively extract the Raman spectral information of motile sperm DNA, establish the Raman spectral dataset of motile sperm with intact DNA, and thus provide high-quality data for clinical assisted reproduction needs. The multi-technology integration is expected to provide an objective and non-destructive new method for DNA-intact high-quality sperm screening in the field of assisted reproduction, improve the success rate of male-factor assisted reproductive technology, and promote new developments and opportunities in the study of male infertility in the field of assisted reproduction.
Aug. 10, 2023Vol. 50 Issue 15 1507202 (2023)
Runkun Liu, Shijie Dang, Hongyuan Zhang, Yinyin Niu, Guanxun Mi, Sanhua Li, Zhenxin Chen, Lingxiao Zhao, and Peng Li
ObjectiveWith the development of digital pathology and artificial intelligence technology, research on the automatic detection of abnormal cervical cells has made great progress. Of the different technologies, object detection technology based on deep learning can simultaneously locate and classify an object, making it a promising application in the field of abnormal cervical cell detection. However, the detection accuracy of abnormal cervical cells still has room for improvement because of the subtle features of abnormal cells that are difficult to extract, small targets that are easily missed, and inaccurate boundary regression. Therefore, in this study, a full-scale feature fusion RetinaNet algorithm combined with attention (AFF-RetinaNet) is proposed for abnormal cervical cell detection to improve the detection accuracy of abnormal cervical cells. In addition, for practical application scenarios, a whole slide image (WSI) inference process based on the AFF-RetinaNet algorithm was implemented for detecting abnormal cells in WSI, which can help pathologists quickly locate abnormal cervical cells in high-resolution WSI and reduce the burden of having to read cervical cytology images.MethodsTo improve the accuracy of abnormal cervical cell detection, AFF-RetinaNet is proposed. First, ResNeSt-50 was used as the feature extraction network to extract the fine features of abnormal cervical cells. The structure of balanced feature pyramid (BFP) was then applied to integrate all feature layers at full scale and obtain the global information of the image, which can enhance the semantic information of small targets. Finally, CIoU loss was used as the loss function of the regression branch to improve the accuracy of abnormal cell boundary regression. In the WSI inference process based on AFF-RetinaNet, the WSI was first divided into several patches, and AFF-RetinaNet was then used to obtain the detection results of each patch. Finally, all detection results of patches were integrated, and the non-maximum suppression (NMS) algorithm was used as a post-process to obtain the final WSI detection results.Results and DiscussionsFigure 1 shows the proposed AFF-RetinaNet for abnormal cervical cell detection. The ResNeSt-50 network was used as the feature extraction network (Fig. 2). Results show that the overall mean average precision (mAP) of the AFF-ResNest-50 increases by 0.8 percentage points compared with the RetinaNet, whereas the mAP of small objects (mAP-s) increases by 1.4 percentage points (Table 3), indicating that the ResNeSt-50 network can improve the ability to identify the features of abnormal cells. BFP was added to integrate all feature layers at full scale and introduce the global information of the image. However, due to the defects of SmoothL1 Loss, the mAP and mAP-s increase by only 0.3 and 0.9 percentage points, respectively (Table 3). Finally, the CIoU loss was used as the loss function of the regression branch to obtain a more accurate boundary regression. Accordingly, the mAP and mAP-s increase by 2.1 and 8.5 percentage points, respectively (Table 3). In a comparison experiment with other mainstream target detection algorithms, AFF-RetinaNet exhibits optimal detection performance (Table 4), further verifying the superiority of AFF-RetinaNet. The WSI inference process based on the AFF-RetinaNet algorithm (Fig. 6) can automatically detect abnormal cells in a high-resolution WSI (Fig. 10) with an mAP of 70.8% in the regions of interest (Table 5).ConclusionsIn this study, a detection algorithm called AFF-RetinaNet was proposed for detecting abnormal cervical cells. ResNeSt-50 was used as the feature extraction network to improve the ability to identify the features of abnormal cells. BFP realizes full-scale feature fusion and introduces the global information of an image to retain more semantic information about small objects. CIoU loss considers additional factors, such as the central distance and shape relationship, which improve the accuracy of abnormal cell boundary regression. In addition, the WSI inference process based on the AFF-RetinaNet can automatically detect abnormal cells in a high-resolution WSI. Experimental results show that the mAP of AFF-RetinaNet on the abnormal cervical cell dataset is 83.4%, and the mAP-s reaches 24.4%, which are 3.2 and 10.8 percentage points higher, respectively, than those of the baseline RetinaNet and better than those of the other mainstream object detection algorithms. The detection results of the cervical WSI inference process based on AFF-RetinaNet reveal an mAP of 70.8% in the regions of interest. Our study shows that AFF-RetinaNet can improve the detection accuracy of abnormal cervical cells and that the WSI inference process based on AFF-RetinaNet can assist pathologists in cervical cancer screening, giving the proposed algorithm significant clinical application value.
Aug. 10, 2023Vol. 50 Issue 15 1507203 (2023)
Jianwen Ding, Wenjing Zhou, and Yingjie Yu
ObjectiveEar is an important hearing organ of the human body. While hearing, the eardrum vibrates to transmit the incoming sound to the middle ear, and the characteristics of these vibrations have a direct impact on hearing. Studying the vibration parameters of the eardrum is extremely significant and valuable for the medical diagnosis of hearing disorders. In previous studies, researchers have used digital holographic technology to detect the amplitude and phase of the vibrating eardrum surface. However, because of the intricate location of the eardrum in the ear canal, the optical path structure is limited. Currently, the detection of key eardrum parameters relies primarily on dissected samples. The correlation between the eardrum defects and vibration modes obtained through experimental and simulation analyses remains unclear. Therefore, digital holographic endoscopy is proposed to study the vibration mode of a defective eardrum, and an algorithm for spatial carrier phase extraction is implemented to detect the vibration mode. Compared with the fringe pattern of the amplitude distribution obtained using the traditional image subtraction mode, the light and dark contrast of the fringes obtained by phase subtraction is significantly improved. In this study, the effects of different defects in an eardrum on the first-order vibration mode were verified, thereby providing a method and theoretical basis for the in?situ detection of defective eardrums.MethodsIn this study, the relationship between eardrum defects and vibration modes was analyzed using finite element simulation and experimental analysis. Owing to the difficulty in obtaining an eardrum, a silicone rubber film, which is commonly used in the medical eardrum repair, was used as a substitute. In the finite element analysis, we studied the changes in the first-order vibration mode of the artificial eardrum based on perforation, scratch and calcification. In the vibration mode detection experiment, we built an optical path of the Mach-Zehnder interferometer for digital holographic endoscopy and used a sinusoidal signal excited by a speaker to stimulate the resonance of the sample surface. Spatial carrier phase extraction based on the time-averaged method was used to detect the amplitude distribution of the film surface in the vibration mode. Based on the changes observed in the amplitude distribution in the first-order vibration mode for the artificial eardrums with different defects, the location and severity of the defect and their influence on the vibration were analyzed.Results and DiscussionsFirst, the theoretical analysis proves that using the spatial carrier phase extraction method to detect the amplitude distribution in eardrum samples in the vibration mode is reasonable. In the finite element simulation and experimental analysis, the vibration modes of the artificial eardrums with defects were analyzed, and the results showed that different defects affect the amplitude distribution in the first-order vibration mode for the eardrums differently. For the perforated eardrum samples, the amplitude distribution was analyzed by varying the size and location of the perforation. The results show that the amplitude near the perforation increases significantly with the increase in perforation size (Figs. 3 and 4), and an increase in the number of fringes is observed in the experimental results (Fig. 11). By changing the location of the perforation, the maximum amplitude shifts off-center with the perforation, and the larger the perforation, the more evident the deviation. The amplitude distribution for the scratched eardrum samples was analyzed by varying the size and location of the scratch. The results show that at the same location, the larger the scratch length, the larger the surface amplitude of the film (Fig. 5), and the amplitude changes more significantly near the scratch location (Fig. 6). The experimental results show an increase in the number of fringes, and the shape of the fringe near the central scratch is flat (Fig. 12). When the scratch is off-center, the effect on the amplitude near the scratch is significantly greater than that at the center. The amplitude distribution for the calcified eardrum samples was analyzed by varying the thickness of the calcified layer (Fig. 7). The amplitude of the film decreases with an increase in the thickness of the calcified layer but is more evident at the location of the calcified layer (Figs. 8 and 13).ConclusionsIn this study, a finite element simulation method was used to evaluate the influence of different defects of an eardrum on the first-order vibration mode. Digital holographic endoscopy was used to detect the vibration mode of the eardrum, and experimental verification of the simulation results was performed. The simulations and experimental results show that variations in the defects of the eardrum affect the first-order vibration mode, and the effects differ based on the size and location of the defect. From a mechanical perspective, an eardrum defect leads to a change in the local stiffness of the structure. Perforation and scratches reduce the stiffness, and calcification increases the stiffness; this leads to increased vibration of the eardrum near the perforated and scratched regions and a weakened vibration near the calcification layer. This study shows the influence of defects on the vibration of the eardrums by analyzing the distribution of the amplitude at the eardrum and the location and severity of the defect. This study provides an optical detection technique for evaluating eardrum defects, which can help in preventing and detecting hearing disorders.
Aug. 10, 2023Vol. 50 Issue 15 1507204 (2023)
Songqi Yang, Jianghui Guo, and Ting Li
ObjectiveLung disease is a local or systemic disease characterized by pulmonary manifestations. The importance of this organ, the lung, to the human body cannot be overstated, and a diseased or damaged lung can seriously affect human health. According to the World Health Organization, global cancer incidence and mortality rates have shown a continuous increase in recent years, with lung cancer topping the list. With increasing air pollution, a growing smoking and aging population, and the emergence of drug-resistant pathogens, tuberculosis and pneumoconiosis have become the top two infectious diseases in China, accounting for 90% of occupational disease cases. The diagnosis and treatment of lung diseases are becoming increasingly important, and many patients with lung diseases such as lung cancer, severe pneumonia, emphysema, and pulmonary embolism in intensive care units require noninvasive, continuous, and immediate monitoring. Thus, noninvasive real-time lung monitoring methods are important for the prevention and treatment of lung diseases.MethodsThe VCH slice specimens used in this study were from an adult male that was sliced horizontally at regular intervals in a standing position. Each slice was a digital color photograph with distinguishable tissues. The lung was divided into five lobe regions for simulations. Two hundred such images were combined with image processing methods to construct a three-dimensional matrix to present the entire lung tissue structure. According to the location of the lung lobes, five lung lobe models of 420 voxel×436 voxel×200 voxel were segmented. The simulation results showed the specific situation of the five lung lobes. Each voxel was a 0.04 cm×0.04 cm×0.04 cmcube. The Monte Carlo method was used to simulate the migration of light in the lungs. This study used the MCVM software, which targets 3D voxelized media. In the simulation, the light source was set to an 800 nm point light source, and the optical properties of 10 tissues were in the near-infrared band at 800 nm. The light source was initially located near the fourth right rib near the sternum body. Additionally, in a preliminary experiment, light intensity signals were measured in the lungs of 13 young healthy volunteers. The 13 volunteers included 4 women and 9 men (25-35 years old). During the experiment, the light sources were placed at the corresponding positions of the five lung lobes in turn. The volunteers’ prothorax detected light intensity at three locations. The back of the volunteer detected light intensity at two locations. All subjects were asked to lie down quietly and rest for 2-3 min before the measurements to allow their breathing to stabilize. The parameters for the experiment were set based on near-infrared device applications. The main parameters are the wavelength of the light source and the collection frequency. These parameters were transmitted to the near-infrared device using bluetooth. Then, the light intensity signals at each position were collected by the near-infrared device. The parameters collection time was 2 min.Results and DiscussionsBased on the VCH lung model (Fig. 1), this study used the Monte Carlo simulation method to quantitatively analyze the photon migration characteristics in the human lung. The light fluence distribution in the lungs and the changes in the light fluence intensity indicated that photons could reach the lungs from the light source (Fig. 3). The photon penetration depth from the skin to the lung was 32-36 mm, while the photon penetration depth in the lung was 6-8.4 mm. The SSD for the five lobes was 0.0235%-0.0368%. The average photon absorption of five lung lobes was approximately 9% (Fig. 4). The differences in photon migration in the five lung lobes could be reflected. Additionally, we proposed an optimization plan for the source-detector distance (LSD). According to the two path length factors, PPF and DPF, combined with the PPF/DPF index, the LSD in the lungs could be the optimal topological location between 2.8 and 3.6 cm; however, the distance from the superior lobe of the right lung was 3.3-3.5 cm. Using VCH-based Monte Carlo simulations of human lungs, the optical migration characteristics of the lungs were quantitatively visualized, the feasibility of noninvasive optical detection of the lungs was proven, and the optimal LSD for the optical detection of the lungs was found. This study performed optimization to determine the important parameter LSD for optical noninvasive testing of the lungs. The optimal lung LSD was 2.8-3.6 cm, but the optimal spacing of the superior lobe of the right lung was 3.3-3.5 cm. Compared to previous studies on the detection of other parts of the human body in the biomedical optics community, the optimal distance between the lungs was significantly smaller than the optimal distance in other body parts. The optimal spacing for these different body parts has been reported to be approximately 3 cm. In this case, a greater separation distance did not a better result. On the contrary, with an increase in the spacing of the source-detector, the energy density of the transmitted photon rapidly decreased, which seriously affected the quality of the detection signal. The optimal separation preference depended on the detection of light density and the path length factors, PPF and DPF. In a preliminary lung light intensity experiment, the LSD spacing was 2.8 cm, which was within the optimal LSD range for the lung. A better light intensity signal could be obtained by performing detection in the optimal LSD range. The experimental data showed that the light intensity values calculated from the detection were much smaller than the simulated light intensity values [Fig.7(a) and Fig.7(c)]. The overall light intensity trend of the five locations indicated a correlation between the experimental and simulated values with P<0.05 [Fig. 7(b) and Fig. 7(d)]. This implied that the detected light intensity signals at the five locations may come from five lung lobes. This further proves the feasibility of the noninvasive optical detection of human lungs.ConclusionsIn summary, this study used Monte Carlo simulations to visualize the propagation of near-infrared light in a VCH lung model. Photon migration in the lungs was studied. Photon absorption of each lobe was shown to be approximately 9%. The optimal source-detector distance in the superior lobe of the right lung was found to be 2.8-2.9 cm, while the optimal distance for the other lung lobes was 3.0-3.6 cm. A preliminary experiment demonstrated the feasibility of optical detection of the lungs. This study also provided theoretical support for using functional near-infrared spectroscopy for lung detection and a reference for the optimal LSD. It is hoped that the results of this study will promote research on lung diseases in the biomedical optics community.
Aug. 10, 2023Vol. 50 Issue 15 1507205 (2023)
Jinkui Chu, Benda Xin, Yongtai Chen, Bo Huang, and Xiaohan Ding
ObjectiveIn recent years, the cases of cancer have increased making it one of the most deadly diseases with breast cancer being the most prevalent in women. An early and effective diagnosis of breast cancer is crucial to the recovery of patients. Compared with traditional optical techniques using unpolarized light, polarization imaging can bring to light the rich microstructure of biological tissues and has the advantages of easy operation, fast detection, and no need for sample staining. Polarization imaging has shown great potential for application in biological tissue analysis and has been applied to the study of pathological diagnosis of cancer. However, during cancerous tissue testing, the mechanical action such as sectioning is required for pathological section preparation. The optical properties of cancerous tissues are affected by mechanical interactions, which generate strains that alter the interrelationship of the cancerous tissue microstructure, leading to changes in the scattering microenvironment and ultimately affecting the inversion of the polarization parameters. Therefore, it is important to investigate the effect of mechanical action such as stretching on the optical properties of cancerous tissues using polarization imaging as a tool in the pathological diagnosis of cancer.MethodsThe tissue section is elongated to a certain extent in the vertical feed direction because of the compression of the blade on the tissue in the feed direction during the preparation of the tissue section. Based on this concept, this study is conducted to investigate the effect of mechanical stretching on the Mueller matrix characterization of intraductal cancerous breast tissue. As the magnitude of these mechanical actions is small, a system is developed that enables achieving mild mechanical stretches. The method uses the Mueller matrix polar decomposition method to determine two characterization parameters that can characterize the fundamental polarization properties of a medium: dichroism (D) and scattering depolarization (Δ). The mean differences of the characterization parameters between different tissue structures and their change rates under mechanical stretching are analyzed using intraductal cancerous breast tissue and normal breast tissue as the study objects.Results and DiscussionsIn this study, digital staining of sections of intraductal cancerous breast tissue is performed using the D and Δ parameters. It is observed that the cancerous region within the duct and the fibrous region surrounding the duct are represented by different colors in the digitally stained images for the two parameters based on their values. As mechanical stretching progresses, there is no significant change in these parameters for the cancerous region within the ducts, while values of D for the fibrous region surrounding the ducts gradually decrease and a gradual increase in the Δ values is observed (Fig. 5). The parameter values for the two different tissue regions are then extracted, averaged and statistically plotted for determining the variation of the mean value with the stretching process and rate-of-change of the difference in the mean value between the different regions. As mechanical stretching progresses, the mean value of D in the cancerous tissue region remains essentially constant, while the mean value of D in the fibrous tissue region shows a monotonically decreasing trend. The difference between the parameters of the two tissues shows a decreasing trend, with the rate of change reaching a maximum value of 7.9% at the maximum stretching. This is probably because the fibers whose directions are different from the direction of stretching show different orientation change. Thus, the overall orientation consistency and anisotropy of fibers decrease, which leads to a decrease in the D value (Fig. 6). As mechanical stretching progresses, the mean value of Δ in the cancerous tissue region remains more or less constant, while the mean value of Δ in the fibrous tissue region shows a monotonic increase. The difference between the parameters of the two tissues shows a decreasing trend, and the rate of change reaches a maximum of 12.7% at the maximum stretching. This may be because fibers with a different orientation from the stretching direction become looser as they are mechanically stretched, which in turn leads to an increase in their overall scattering depolarization values (Fig. 7).ConclusionsThe precise differentiation of cancerous and normal tissues is of great importance in clinical applications. In this study, a full-polarization Mueller matrix imaging system with mechanical stretching and detection modules for biological tissues is built. The changes in the polarization representation parameters of intraductal cancerous and normal breast tissues under mechanical stretching are investigated using this system, and the differences between the same polarization representation parameters of different tissue structures under mechanical stretching and their change rates are studied. The results show that the difference between D values and the difference between Δ values for both the cancerous and normal regions tend to decrease with mechanical stretching, with a maximum rate-of-change of 7.9% for D and 12.7% for Δ. The analysis of the experimental data shows that the greater the magnitude of mechanical stretching, the greater the difference in the change trend of parameter between cancerous and normal tissues, and the closer the values of parameters between cancerous and normal tissues, i.e., the difference between cancerous and normal tissues becomes less evident. This has implications for polarimetric imaging-based probing using D and Δ parameters as the diagnostic basis, where large deformations are avoided as much as possible during mechanical handling of tissues, i.e., while biological tissue sectioning, using sharper tools and controlling tool angles. In this study, only the D and Δ parameters have been investigated. The work will be extended to focus on other polarization characterization parameters in future research.
Aug. 10, 2023Vol. 50 Issue 15 1507206 (2023)
Xiaoke Wei, Xu Wu, Xiaosen Lu, Junjie Wang, Jingnan Li, Yansi Yang, Xinbo Chu, Qiliang Wang, Zuanming Jin, and Yan Peng
ObjectiveDeep venous thrombosis (DVT) is an orthopedic complication with an incidence rate ranging from 66% to 84%. When a thrombus dislodges, it can circulate through the bloodstream and obstruct blood vessels. In severe cases, this can lead to disability or even death in patients. Consequently, preventing thrombosis is a critical aspect of orthopedic treatment and is essential for patient recovery after surgery. Xarelto is currently the most widely used new oral anticoagulant in clinical practice. It achieves anticoagulation by inhibiting factor Xa in a combined state, reducing the risk of thrombosis by 30%. However, due to varying physiological conditions among patients, quantitative testing is necessary for individualized medication in clinical treatment to realize optimal therapeutic effects. Current quantitative measurement methods can be classified into direct and indirect measurement techniques. However, these methods have certain limitations, including high cost, accuracy issues, and controversy to a certain extent. They are also influenced by patients’ physiological characteristics, instruments, and reagents. Consequently, researchers are seeking a novel testing method to enable rapid and quantitative analysis of Xarelto contents. Far-infrared radiation, with a wavelength of 25 μm to 1000 μm, is highly sensitive to related low-frequency vibrations or rotational information, such as changes in configuration, crystal structure, and molecular agglomeration. The far-infrared spectrum detection boasts low photon energy, high resolution, and broad spectral bandwidth, making it widely used in molecular qualitative identification and quantitative analysis. In this study, we examined the far-infrared spectral characteristics of Xarelto using theoretical simulation and experimental testing methods and performed quantitative analysis based on these characteristics. We analyzed the absorption frequency of Xarelto in the wavenumber range of 0-100 cm-1 and related molecular motion modes to predict its far-infrared absorption characteristics using density theory. By collecting Xarelto experimental absorption spectrum and employing Fourier far-infrared precision spectrometer, we compared the results with theoretical analyses. This revealed Xarelto characteristic peaks in the far-infrared band. By examining multiple characteristic peaks, we studied the absorption spectrum changes of Xarelto samples with different contents in the far-infrared band. We then analyzed the correlation between Xarelto content and peak intensity, ultimately achieving quantitative testing of Xarelto.MethodsThis study utilized the PubChem Structure database to construct a molecular simulation model for Xarelto. We employed quantum chemical software Gaussian 09 and density functional theory to calculate and simulate Xarelto theoretical far-infrared spectral characteristics. Specifically, we selected the DFT/B3LYP/3-21G basis set to optimize and calculate the Xarelto molecular model, predicting its properties in the 0-100 cm-1 range and applying the Gaussian broadening of Xarelto spectral lines (with a full width at half-maximum of 4 cm-1). We then used a far-infrared spectrometer to conduct qualitative experimental tests on pure polyethylene (PE) and 25 mg and 60 mg Xarelto samples. We also collected the far-infrared absorption maps of Xarelto/PE hybrid chips with Xarelto masses ranging from 2.5 mg to 25 mg for quantitative experiments.Results and DiscussionsIn this study, we obtained Xarelto theoretical spectrum through the theoretical simulation method (Fig. 1), which identified the peaks of Xarelto theoretical characteristics at 24.00, 40.22, 72.63, 81.38, and 100.60 cm-1. Through qualitative experimental tests of pure PE and 25 mg and 60 mg Xarelto samples, we obtained the drug experimental far-infrared absorption diagram (Fig. 3), revealing absorption peaks at 49.03, 80.54, and 96.29 cm-1, as well as two weak absorption shoulder peaks at 38.87 cm-1 and 72.66 cm-1. The relative peaks are consistent, and peak deviation is minimal. Based on Xarelto far-infrared absorption characteristics, we selected 49.03, 80.54, and 96.29 cm-1 as quantitative indicators to examine the far infrared spectrum rules of different samples with different Xarelto masses (Fig. 5) and conducted a quantitative analysis. There is a linear relationship between Xarelto mass and the three feature absorption peak heights, which aligns with Beer-Lambert’s law (Fig. 6). The specific expressions of the linear fitting functions are y49.03 cm-1=0.16067+0.13444x with a correlation coefficient of 0.99258 and a standard deviation of 0.07253, y96.29 cm-1=0.09964+0.05559x with a correlation coefficient of 0.99319 and standard deviation of 0.02587, and y80.54 cm-1=0.03228+0.0559x with a correlation coefficient of 0.99656 and standard deviation of 0.008888. These results indicate that the linear fitting estimation values and measured data are highly consistent, and the reliability of the linear fitting trend line is substantial. In conducting proper quantitative tests for Xarelto, we can further improve the quantitative accuracy via multi-peak and quantitative analysis.ConclusionsBased on density functional theory, in this study, far-infrared detection technology was employed to analyze the novel oral anticoagulant Xarelto, examining its far-infrared spectral characteristics and conducting quantitative analysis using its characteristic absorption peaks. Through theoretical simulation, it was predicted that Xarelto exhibits five characteristic peaks within the wavenumber range below 100 cm-1. Subsequently, we used far-infrared detection technology to collect experimental spectra consistent with the theoretical prediction results, determining the drug characteristic frequencies at 38.87, 49.03, 72.66, 80.54, and 96.29 cm-1. Theoretical simulation results were combined to analyze the corresponding molecular vibration modes for these characteristic absorption peaks. Building on this foundation, different samples with different Xarelto masses were detected and analyzed. Furthermore, it was discovered that the characteristic absorption peak height increases linearly with the Xarelto mass (correlation coefficients are greater than 0.993, and standard deviations are less than 0.026). The correlation between multiple characteristic peaks and Xarelto masses enables rapid and quantitative testing of Xarelto contens. The findings of this study will contribute to the development of rapid detection methods for antithrombotic drugs like Xarelto in the future.
Aug. 10, 2023Vol. 50 Issue 15 1507207 (2023)
Yafei Wang, Yinggang Chen, Shikai Wang, Qiubai Yang, Yan Sun, Meng Wang, Lei Zhang, Xin Wang, Lei Wen, Suya Feng, Chunlei Yu, Lili Hu, and Emenovsergey Lvovich S
Aug. 10, 2023Vol. 50 Issue 15 1516001 (2023)
© Copyright 2018-2021 | Chinese Laser Press.
All Rights Reserved 沪ICP备15018463号-20