


Please enter the answer below before you can view the full text.

Lingxi Kong, Tao Cheng, Chunxuan Su, Kangjian Yang, Mengmeng Zhao, Shuai Wang, and Ping Yang
ObjectiveTo provide precise tip-tilt correction, the tip-tilt mirror (TTM) control with high bandwidth and high dynamic response is crucial for adaptive optics (AO) systems. The time delay of the system, which is a significant factor restricting the error attenuation bandwidth of the system, is 2-3 times the sampling period. Additionally, the dynamic response performance of TTM will be decreased by the vibration of the experimental device, the unstable operating environment, and other factors brought on by external system disturbances, as well as the time-delay parameters of the system model brought on by internal troubles. While strategies such as the linear quadratic Gaussian (LQG) control method and hybrid control can suppress the high frequency jitter of the beam, and the Smith predictor control method can compensate for the time delay in the system. Nevertheless, the common problem with these methods is that the control effectiveness depends on the accuracy of the model, which results in the inability to suppress disturbances. In order to achieve high bandwidth and high dynamic response TTM control in AO systems, a control method utilizing the Smith predictor and filter-based linear active disturbance rejection (FLADRC-Smith) is proposed to synchronously compensate for the effects of time delay and internal and external disturbances on the tip-tilt correction performance.MethodsIn order to increase error attenuation bandwidth, the FLADRC-Smith control method employs a Smith predictor to modify the linear active disturbance rejection control (LADRC) method. The AO system is considered a pure time-delay system. Therefore, a filter is designed to modify the control amount of TTM in order to achieve LADRC that is resistant to high frequency disturbance. In this paper, characteristics of the error attenuation transfer function of the control system are analyzed from a frequency domain perspective, and the control system is optimized and made simpler. Meanwhile, the stability of the control system when the time-delay parameters of the system model are varied is ensured by parameter constraints, and the connection between the error attenuation bandwidth and the system performance in suppressing internal and external disturbances is analyzed. The formula for the error attenuation bandwidth is supplied in the analysis, along with a straightforward method for tuning the parameters.Results and DiscussionsMATLAB/Simulink is used to establish the simulation model of AO tip-tilt correction to verify the effectiveness of the FLADRC-Smith control method. Firstly, it is confirmed that FLADRC-Smith can increase the error attenuation bandwidth of the system. The error attenuation bandwidth is 25 Hz with proportional-integral (PI) control and 114 Hz with FLADRC-Smith control, showing a 4.56 times improvement with FLADRC-Smith control, according to simulation results after properly setting the controller parameters (Fig. 6). Then, to verify the disturbance rejection ability of FLADRC-Smith control method, it is compared with the PI-Smith control method. The controller parameters are set properly so that both control methods result in the same system error attenuation bandwidth. When the Smith parameter and time-delay parameter of the system model are both set to 0.0025 s, both control strategies can quickly and stably track a constant value signal. However, when the time-delay parameter of the system model is mismatched to 0.008 s, the dynamic performance index is the transient time required to achieve and maintain the response of TTM at ±5% of the input signal amplitude. FLADRC-Smith control, compared with PI-Smith control, improves the dynamic response of TTM by 23.9% (Fig. 8). Finally, the FLADRC-Smith control method is compared with the PI-Smith control method in a second-order oscillatory time-delay system. The controller parameters are reasonably tuned so that the system error attenuation bandwidth is the same for both control methods (Fig. 9). Both control methods can track the constant value signal quickly and steadily when the Smith parameter and time-delay parameter of the system model are set to 0.0025 s. But when the time-delay parameter of the system model is mismatched to 0.008 s, the response transient time of TTM with PI-Smith control is 0.0564 s, while the FLADRC-Smith overshoot does not exceed ±5% of the input signal amplitude. It indicates that the required transient time is 0 when using the FLADRC-Smith control method, which significantly improves the dynamic response performance of TTM (Fig. 10).ConclusionsThe FLADRC-Smith control method can improve the bandwidth and the dynamic response performance of TTM effectively. In a pure time-delay system, this method improves the error attenuation bandwidth by 4.56 times compared with PI control. Under the same error attenuation bandwidth condition, the method improves the dynamic response performance of TTM by more than 20% with stronger suppression of internal and external disturbances compared with the PI-Smith control method in a pure time-delay system and a second-order oscillatory time-delay system.
Jul. 10, 2023Vol. 50 Issue 13 1305001 (2023)
Yu Gong, Juan Wu, Junlan Yang, Zhongxiang Luo, and Yuan Li
ObjectiveWhen laser propagates in gas medium, the gas absorbs the laser energy and causes the refractive index to change, forming the gas thermal effect and reducing the beam quality. The laser has a high power density in the inner channel of the system, so the attenuation of Gaussian beam transmitted in the inner channel is far greater than that transmitted in the outer atmosphere. In addition, the thermal blooming effect of high-energy laser is not only closely related to the beam shape, but also very complex due to the interaction between the air flow and the absorption of laser energy. We hope to establish a more comprehensive thermal coupling effect model of laser transmission, which will provide strong support for the design and performance evaluation of the high-energy laser system. In this paper, the theory of optical-fluid-thermal coupling effect is introduced, and the simulation model of the thermal coupling effect of combined transmission of the elliptical Gaussian laser beams is established.MethodsTo solve the thermal effect of laser transmission in gas medium, flow field calculation, optical transmission calculation and optical-thermal coupling calculation are required. The optical transmission satisfies Maxwell equations. When simulating the electromagnetic field propagation of optical structures with long distance in a large size space, ray tracing is performed by solving the ray position and wave vector. Fluid flow and heat transfer follow the three conservation laws of mass, momentum and energy. The energy attenuation of laser transmission can be calculated according to Beer’s law, while the refractive index change of gas medium due to temperature and density changes satisfies Gladstone-Dale relationship. The wavefront aberration of the laser propagating in the enclosed space of the system is obtained by solving the above theoretical model with the finite element method, and the beam quality is calculated by comparing the results with those of the ideal Gaussian beam. The established model of laser thermal coupling effect is in good agreement with the experimental law, and can predict the degradation of beam quality caused by the thermal effect of gas medium.Results and DiscussionsThrough numerical simulation, the natural convection phenomenon induced by laser heating in a cuboid enclosed space and the change process of the influence of the flow field on the beam propagation are analyzed, and the influential factors of the thermal effect are studied. After the light comes out, the surface temperature of the optical elements will continue to rise, while the air temperature will not change within a few seconds (Figs. 4 and 5). The optical path difference (OPD) distribution is elliptical Gaussian type at first, with obvious defocusing aberration, and its peak-to-valley (PV) value and beam quality show a trend of first increasing, then decreasing, and then stabilizing (Figs. 7 and 9). With the increase of the absorption coefficient, the OPD PV value caused by the thermal effect of gas increases (Fig. 12), but the absorption of the element surface has a low contribution to the thermal effect of gas medium (Fig. 13). The gas thermal effect can be suppressed and the beam quality can be improved by certain gas replacement methods (Fig. 15). The flow field distribution of each region in the spectral beam combining system is different, and the path of each sub-beam is different, so the aberration is also different. The number and power of sub-beams, the shape and distribution, the combining method, the transmission distance and the system layout will all affect the thermal aberration difference of the medium in the process of combined beam transmission.ConclusionsIn this paper, the theory of optical-fluid-thermal coupling effect is introduced, and the thermal coupling effect model of laser beam combining transmission in an enclosed space is established. The absorption of laser energy by the gas medium will affect the laser transmission, resulting in optical axis deflection, beam quality degradation, and changes in the shape of far-field spot. In this study, the influences of medium absorption, optical element absorption and gas replacement on the thermal effect of internal transport gas are analyzed. In the spectral beam combining system, all sub-beams will interfere with each other, the wavefront distribution will be different, and every sub-beam will have a dispersion trend. The model can analyze the thermal effects of different systems according to the actual situation, and the influence of structural parts and electronic devices on the flow field and laser transmission can also be considered, providing an effective reference for the design and performance evaluation of high-energy laser systems.
Jul. 10, 2023Vol. 50 Issue 13 1305002 (2023)
Gang Wang, Zhongliang Li, Chunxiao Yuan, and Fang Zhang
ObjectiveLithography is currently an essential tool in the production of integrated circuits (ICs) and other micro- and nano-scale elements used widely in the electronics industry. The resolutions of deep-ultraviolet step-and-scan dry lithography machines in the international market range from 57 nm to 350 nm. The illumination system is an important component of the lithography exposure system. The illumination mode is typically adjustable according to the mask pattern, including a full circle, annular rings, or poles, to improve resolution, imaging contrast, and focal depth. During the IC manufacturing process, the exposure field is scanned using a narrower illumination field. Therefore, illumination-integrated nonuniformity is a key factor in determining the resolution and critical dimension uniformity (CDU), which are crucial to the performance of advanced lithography systems. To obtain higher resolutions and better CDU, the exposure dose must be maintained as uniformly as possible in the scanning direction. The illumination uniformity unit is the primary component for obtaining a uniform illumination field. Currently, the homogenizer elements used in lithography illumination systems include diffractive optical elements (DOEs), microlens arrays (MLAs), and integrator rods. The adoption of DOEs is limited to small angles and reduces transmission efficiency owing to typical diffraction losses. MLAs are refractive optical elements (ROEs) suitable for large numerical apertures (NAs) with minimal energy loss and no effect on laser beam polarization. However, MLAs remain expensive and difficult to process, install, and adjust. Although integrator glass rods are simple in structure, easy to process, and inexpensive, their length-to-width ratio becomes extremely large when small NA and sufficient reflections are required, making them unsuitable for space conservation.This research intends to be beneficial in terms of reducing structural complexity and production costs, as well as improving the effectiveness of the illumination uniformity unit's automatic optimization design.MethodsConsidering the advantages and disadvantages of the aforementioned homogenizer elements, an illumination uniformity unit comprising a plano-convex microcylindrical lens array (PCMCLA), condenser lens group, and a rectangular integrator rod is proposed in this study to obtain the uniform rectangular illumination field required in dry lithography. Compared with the current common uniformity unit structure based on double MLAs, the proposed structure reduces the MLA and the number of lens pieces in the condenser lens group. An MLA is typically made up of multiple microlenses of the same size arranged side by side. The aperture of each microlens divides incident light into different channels, indicating differentiation. The beam in each channel is refracted by a lens called an integrator or condenser lens. Subsequently, all channels are superimposed on the rear focal plane of the condenser lens, which is equivalent to integration. The operating principle of an integrator glass rod is based on multiple reflections that mix the incident light distribution and produce a homogenizing effect. Hence, the combination of these two elements can achieve illumination uniformity in the X and Y directions, respectively, which can be suitable for the small NA case triggered by a small partial coherence factor σ. Then, via geometric analysis, we inferred that in the X-direction, the spatial distribution of the incident beam of the integrator is linear with the direction cosine distribution of the outgoing light from the microlens. Accordingly, to obtain the optical optimization design of the plano-convex microcylindrical lens and condenser lens group in the CODE V software, the weighted square sum of the difference between the cosine value of each relative pupil ray's exit direction and its ideal value was adopted as an evaluation function. Taking the KrF lithography exposure system as an example, an illumination uniformity unit was designed via automatic optimization based on the evaluation function and conventional evaluation function of the diffusion spot root-mean-square (RMS). Subsequently, the obtained structural model of the uniformity unit was simulated using the LightTools software.Results and DiscussionsThe simulation results (Table 3) indicate that the non-uniformity of all types of output illumination in the simulation [illumination-integrated nonuniformity (IINU) of scheme A in Table 3] is less than 0.60% under different coherence factors, which is better than the contrasted optimization results [IINU of scheme B in Table 3] based on the conventional evaluation function of the diffusion spot RMS. For conventional illumination, IINU increases with the decrease in σ because this decrease implies a decrease in the light source area and NA. This decrease triggers a decrease in the number of microlenses involved and the reflection times of the extreme ray in the rod, which affects the homogenizing effect to some extent. When the outer ring diameter remains constant in annular illumination, IINU is getting smaller with increasing ring width. This is because the larger the ring width, the more similar the illumination pattern is to that of conventional illumination. In addition, when the ring width is constant, IINU is worse when the outer ring is larger than that when the outer ring is smaller. This is because the performance of the condenser lens with a large relative pupil is inferior to that with a small relative pupil. To further improve the performance of the proposed structure, different grey filters with specific transmittance distributions are added at the output end of the integrator rod to correct the illuminance distribution of the illumination fields with poor uniformity. Subsequently, the simulation results [corrected IINU of scheme A in Table 3] reach the IINU target of less than 0.43%. The corresponding normalized integrated irradiance profiles derived from the proposed design are presented.ConclusionsThe proposed structure of the illumination uniformity unit in lithography exposure systems comprises a PCMCLA, three-piece condenser lens group, and a rectangular integrator rod. To obtain the automatic optimization design of the microlens and condenser lens groups, an evaluation function based on the angle cosine distribution of light rays is proposed to characterize illumination uniformity. The simulation results indicate that the designed structure achieves the requirement of IINU (≤0.46%), and verify that the proposed evaluation function is more effective than the conventional evaluation function of diffusion spot RMS, thereby providing a simply constructed and economical reference for related engineering.
Jul. 10, 2023Vol. 50 Issue 13 1305003 (2023)
Fengtao He, Jie Yu, Jianlei Zhang, Yi Yang, Yayi Yang, Yunzhou Zhu, and Xiaobo Wang
ObjectiveVisible light communication (VLC) technology is crucial in high-speed positioning, sensing, internet of things (IoT), and other fields because of its characteristics of high transmission rate, no band limit, safety, and eco-friendliness. With the development of VLC technology, indoor VLC technology has also received increased attention. The LED array is used as the transmitting unit in an indoor VLC system. However, the layout and parameters of a LED array affect the received illumination and optical power, thus changing the communication quality of receiving plane and affecting the fairness of user communication. Therefore, to solve the problem of uneven communication performance caused by conventional array layout, we propose a partial-nonuniform symmetrical layout by using a modified genetic algorithm. Considering the primary reflection of the wall, the number of light beads on the chips, the half power angles, and array layouts that can further improve the received optical power uniformity are designed to synchronously optimize the position of LED chips.MethodsIn this study, by studying and summarizing the common LED array layouts used in indoor VLC systems worldwide, a partial-nonuniform symmetrical array layout scheme was developed. The scheme was used to optimize the position of LED chips, number of light beads on the chip, and half power angles of the partial array. Thus, the entire surface of emission was obtained by folding the optimized nonuniform part before the optical power uniformity of the receiving surface was calculated based on the optimized array layout scheme. Thereafter, the VLC model with either non-line of sight link (NLOS) or line of sight (LOS) link was constructed. In addition, the crossover and variation operators in a genetic algorithm (GA) were modified via combination with the simulated annealing algorithm and self-adaption. Based on the LOS link and NLOS link models, an objective function that can synchronously optimize the position of LED chips, the number of light beads on the chip, and the half power angles was constructed. Finally, using the room model as the research object, the array layout was optimized by a modified genetic algorithm. Different side lengths of the room model, with a step length of 0.5 m, were considered. The LED array layouts in the room models of sizes 3 m×3 m×3 m, 5 m×5 m×5 m, and 7 m×7 m×7 m were examined, and the according parameters were determined; this demonstrated the versatility of the proposed scheme.Results and DiscussionsThe proposed scheme was used to optimize the LED array. In the room model of size 5 m×5 m×3 m, considering the primary reflection, the optimized LED array layout (Fig. 3) was obtained. The position of LED chips, number of light beads on the chip, and half power angles of the LED chip are shown in Table 3. The received optical power uniformity reaches 97.7%, the maximum received illuminance is 1341 lx, the minimum received illuminance is 1089.9 lx, and the illumination uniformity is 0.84 [Fig.4 (a)]. The illuminance conforms to the specified international standardization range (300-1500 lx). The maximum received optical power is 1062 μw, and the minimum received optical power is 876.6 μw [Fig. 4 (b)], thus ensuring a high received optical power of the communication system. In the room models of sizes 3 m×3 m×3 m and 7 m×7 m×3 m, the optimized LED array layouts (Fig. 6) have four different LED chips. Their parameters are listed in Tables 4 and 5. In the 3 m×3 m×3 m room model, the illumination uniformity of is 0.88 [Fig.7 (a)] and the received optical power uniformity is 97.22% [Fig.7 (b)]. In the room model of size 7 m×7 m×3 m, the received illumination uniformity of is 0.9 [Fig.7 (c)], and the received optical power uniformity is 95.54% [Fig.7 (d)]. The received illuminance values of the two aforementioned layouts also meet the lighting standards. Moreover, the received optical power and illumination uniformity after the optimization of the room model were noted with a step length of 0.5 m (Fig.8). The results indicate that even if the room size varies, the received optical power uniformity maintains more than 95%, and the received illumination uniformity is always greater than 0.7, indicating that the proposed optimization method has strong versatility.
Jul. 10, 2023Vol. 50 Issue 13 1306001 (2023)
Rongli Xiao, Runzhou Qiu, Guowei Wu, Bin Zhang, Weiping Liu, and Shecheng Gao
ObjectiveIn a previous work, the transmission spectrum of long-period fiber gratings (LPFGs) was simulated and analyzed based on traditional coupled mode theory. However, for a strongly modulated few-mode LPFG, traditional coupled mode theory cannot be used to accurately analyze the coupling process between the core guide modes in the strong modulation region. This is because of its strong angular refractive index modulation and the obvious correction of the mode field distribution. In addition, the problem of change in the angular refractive index in the fiber core was not considered in the previous strongly modulated model, which is inconsistent with the change in actual gratings. This can easily result in the simulation spectrum not matching the actual spectrum. Therefore, based on local coupled mode theory, this study analyzed the coupling process between the fiber core fundamental mode and the high-order angular mode in an LPFG grating. This study also established a model for a strongly modulated few-mode LPFG, introduced asymmetric and angular modulation parameters into the model, realized a transmission spectrum simulation of the grating, and matched the existing experimental results. A method was thus realized for analyzing the coupling process between the guide modes of the fiber core in a strongly modulated few-mode LPFG, which provides a reference for preparing gratings with different experimental requirements.MethodsBased on local coupling mode theory, a model of a strongly modulated LPFG written by a CO2 laser was constructed to analyze the coupling process between the core guided modes in the modulated region of a few-mode grating. With asymmetric and angular refractive index modulations introduced into the model, the strong angular refractive index variation in grating modulation was characterized, and a more accurate mode coupling coefficient and propagation constant were derived. These were substituted into the coupling equation between the fundamental and third-order azimuthal modes to solve, and a simulation of the grating transmission spectrum was realized. The simulation and experimental results were then matched. In addition, based on changes to the grating model parameters (grating period, the number of periods, and modulation depth), the change in the corresponding transmission spectrum was studied, thereby providing a reference for designing and fabricating higher-order-mode strongly modulated LPFGs.Results and DiscussionsWe first established a model for a strongly modulated few-mode LPFG by adding asymmetric and angular refractive index modulations. Figure 4 shows a comparison of the unmodulated and modulated mode fields, which reflects the necessity of angular modulation and enhancement of coupling between modes. Figure 5 shows a comparison between the simulation and experimental data. The simulation parameters of the grating were consistent with the experimental parameters. It can be seen that the shape, depth, and resonant wavelength of the experimental resonant peak are basically consistent with those of the simulation. Based on changes to the parameters of the established model (grating period, the number of periods, and modulation depth), the change rule of the grating transmission spectrum characteristics was analyzed, as shown in Figs. 6, 8, and 9. Thus, the simulation model can be applied to different optical fibers to guide the design and preparation of gratings with different requirements.ConclusionsIn this study, a simulation model of an LPFG is established, with emphasis given to analysis of the LPFG. Based on local coupled mode theory, the refractive index and coupling coefficient changes in the modulation region of the grating are calculated, and asymmetric and angular refractive index modulations are introduced. The spectral characteristics of a strongly modulated few-mode LPFG are obtained by numerically solving the local coupled-mode equations. The spectra of strongly modulated LPFG fabricated by using CO2 laser in the experiment and the simulation results are in agreement. These results and the effects of grating period, the number of periods, and modulation depth on the transmission spectrum of the grating were analyzed. This simulation method is more suitable for analyzing LPFGs prepared by high-power local laser (such as CO2 laser) irradiation methods and more accurately characterizes the coupling process between the fundamental and high-order angular modes in the fiber core area of a few-mode grating. This method has a reference value for realizing higher-order angular mode conversion and preparing LPFGs with different requirements. Compared with other methods, this method can more accurately analyze a series of LPFGs based on local high-intensity laser irradiation and heat treatment.
Jul. 10, 2023Vol. 50 Issue 13 1306002 (2023)
Ziqi Zhang, Xiaonan Yu, and Shoufeng Tong
ObjectiveGravitational waves are ripples of the curvature of space and time in the universe. They dominate the evolution and operation of the universe in the form of waves. Gravitational wave detection has been widely used by many scholars at home and abroad and has achieved breakthrough results. Gravitational wave detection is one of the most concerned frontiers of scientific research in the history of contemporary physics. Space laser heterodyne interferometer is a key component of gravitational wave detection system. The four-quadrant detector is an important part of the laser interference gravitational wave detector, which can be used for spot position detection, laser angle measurement, data transmission and reception, etc. The performance of the four-quadrant detector will directly affect the accuracy of the gravitational wave detector. Influenced by noise factors, the system signal-to-noise ratio (SNR) of laser interference gravitational wave detector and other parameters will be affected, thus affecting the detection accuracy and performance of the system. Therefore, it is necessary to establish a complete mathematical model for the position detection process of the four-quadrant detector and verify it through the simulation system, so as to analyze the factors affecting the position detection accuracy and improve the detection method.MethodsIn order to analyze the factors that affect the position detection accuracy of the four-quadrant detector, in this paper, firstly, the noise factors in the laser heterodyne interferometer and the relationship between the local oscillator power and the system SNR are analyzed. The mathematical theoretical model of the four-quadrant detector position detection is established, and the main factors affecting the position detection accuracy are theoretically derived. Then the position detection simulation system is established by using Monte Carlo random simulation method, and the Monte Carlo random points are used to characterize the receiving and solving process of the four-quadrant detector spot. Finally, the simulation results are compared with the theoretical results of the mathematical model, and the correctness and accuracy of the simulation results are verified.Results and DiscussionsThe simulation system of four-quadrant detector position detection model based on Monte Carlo method is established. The simulation system is based on the Monte Carlo idea and consists of three parts: the Gaussian spot generation process, the spot center position calculation process, and the error evaluation process (Fig. 4). The estimated spot center position is compared with the true value to judge the accuracy of the Monte Carlo simulation method (Fig. 5). The simulation results show that due to the correlation of beat frequency signal noise among the four quadrants, the position detection accuracy is not affected by beat frequency signal noise (Fig. 6). Due to the independence of detector noise in the four quadrants, when the system SNR caused by detector noise rises from 30 dB to 44 dB, the position detection accuracy is improved (Fig. 7). The smaller the Gaussian spot radius is, the more concentrated the spot energy is, and the higher the position detection accuracy is (Fig. 8). The closer the spot center position is to the center of the four-quadrant detector photosensitive surface, the higher the position detection accuracy is (Fig. 9).ConclusionsIn this paper, the mathematical model of the position detection accuracy of the four-quadrant detector is studied theoretically and verified by the Monte Carlo simulation system. The key parameters that affect the position detection accuracy are obtained: system SNR, Gaussian spot radius and spot center position. The simulation system data show that the position detection accuracy can be improved by improving the system SNR, selecting small light spot for detection and using light spot incident near the origin of the detector photosensitive surface. In addition, the estimated value of the Monte Carlo simulation system is in good agreement with the solution of the mathematical model, which proves that the precision of the Monte Carlo method is high. This research has certain guiding significance for engineering applications.
Jul. 10, 2023Vol. 50 Issue 13 1306004 (2023)
Yuekai Jiang, Yuangang Lu, Yuguo Yao, Wujun Zhang, Chongjun He, and Lulu Liang
ObjectiveOptical fiber sensors have a wide range of applications in aerospace, energy, electric power, transportation, and communications because of their advantage such as anti-electromagnetic interference, small size, and low weight. Traditional temperature sensing technologies based on fiber gratings, optical microcavities, Fabry-Perot interferometers, and Mach-Zehnder interferometers cannot achieve distributed measurements. Distributed fiber optic sensing technologies based on Raman scattering are incapable of achieving long-distance sensing. Therefore, a large amount of research has focused on Brillouin-scattering-based fiber sensing. Brillouin optical correlation-domain reflectometry (BOCDR) based on external modulation, can achieve distributed sensing with high spatial resolution and solve the problems of measuring spatial resolution fluctuations and laser sources that require high-frequency and large-amplitude modulation in BOCDR based on internal modulation. However, a spectrum aliasing problem in BOCDR based on external modulation affects the sensing system’s spatial resolution. In this study, we report an external modulation BOCDR system with a large modulation center frequency to overcome signal noise aliasing and achieve temperature sensing with a high spatial resolution.MethodsIn this study, we first constructed a light source system for BOCDR based on external modulation, which consists of a function generator, a voltage-controlled oscillator, an electro-optic modulator, a laser source, an erbium-doped fiber amplifier, and an optical bandpass filter. During the measurement process, the Brillouin gain spectrum was obtained by continuously changing the modulation frequency, and the temperature information was demodulated from the measurement results. The different frequency components of the reference and Stokes light in the BOCDR system based on external modulation were compared (Fig. 2), and the impact of beat spectrum noise was analyzed. The modulation center frequency influences the sensing system’s spatial resolution and dynamic measurement range. Subsequently, a novel external modulation BOCDR based on a large modulation center frequency was proposed (Fig. 3). For example, the modulation center frequency was set higher than 14.3 GHz to eliminate the impact of beat spectrum noise and obtain a spatial resolution of 15 cm.Results and DiscussionsAt a room temperature of approximately 22 ℃, a 0.6 m length heating section in 17.2 m sensing fiber was heated to 25, 30, 40, 50, and 60 ℃, and the Brillouin frequency shifts (BFSs) of the heated section corresponding to five different temperatures were measured. By linear fitting, the BFS temperature coefficient of the fiber under test is 1.15 MHz/°C (Fig. 5). In a verification experiment of temperature measurement, the temperature of the 0.6 m-length fiber was heated to 46.8 ℃ by using a water bath, and the distribution of the Brillouin gain spectrum was measured (Fig. 6). Lorentz fitting was performed to extract the BFS (Fig. 7) after subtracting the lowest noise and normalizing the results. From the BFS distribution of the sensing fiber, the spatial resolution of the system is calculated as 11.6 cm, and the measured result of the heated fiber is (46.64±0.17) ℃. When the 0.6 m length fiber is heated to 57.7 ℃, the measured result is (57.57±0.26) ℃. Compared with the sensing performances of four reported typical BOCDR systems, the proposed BOCDR system has a high spatial resolution and low measurement uncertainty. The measurement uncertainty of the proposed system is one order of magnitude lower than that in the other four reported BOCDR systems (Table 1). Therefore, the proposed BOCDR system with a significant modulation center frequency can achieve temperature-distributed sensing with high spatial resolution and measurement accuracy.ConclusionsThis study proposes a new BOCDR based on external modulation with a large modulation center frequency, which can suppress the spectrum aliasing of signals and achieve distributed temperature sensing with a high spatial resolution. The proposed method has a high spatial resolution, and its measurement uncertainty is one order of magnitude lower than similar methods. The causes of beat noise in BOCDR based on external modulation and its impact on the Brillouin scattering signal were analyzed. According to the measurement range and spatial resolution requirements in the BOCDR system based on external modulation, the magnitude of the modulation center frequency is calculated and determined. A larger modulation center frequency can suppress the aliasing effect of beat spectrum noise on the Brillouin scattering signal, resulting in a higher spatial resolution and larger temperature measurement range. In a verification experiment, we successfully implemented temperature-distributed sensing with a spatial resolution of 11.6 cm on a 17.2 m long G657 optical fiber, with an uncertainty of 0.26 ℃ for temperature measurement.
Jul. 10, 2023Vol. 50 Issue 13 1306005 (2023)
Yusong Sun, Jian Huang, Dongfeng Shi, Ke e Yuan, Shunxing Hu, and Yingjian Wang
ObjectiveMultispectral ghost imaging is a perfect combination of spectral and ghost imaging. Compared to single-band ghost imaging, multispectral ghost imaging provides richer information, which may improve the accuracy and reliability of object recognition, material analysis, and medical diagnosis. Traditional multispectral ghost imaging is accomplished by employing multiple detectors or time-divided detection via filter wheeling to capture images of various spectral channels and combine them into a color image. These strategies have limitations, such as complex structures, and require a large amount of data. Alternatively, by encoding and decoding in the projection and recovery stages, respectively, multispectral multiplexed ghost imaging can obtain the multispectral information of objects in one projection cycle. However, there are still some problems in existing multispectral multiplexed ghost imaging, such as requiring a compressed sensing algorithm in the restoration phase, significantly increasing time consumption. In this study, we propose cosinusoidal encoding multiplexed multispectral ghost imaging, which can effectively improve the imaging efficiency of multispectral ghost imaging while ensuring high-quality imaging through a simple and flexible encoding strategy.MethodsThe process of cosinusoidal encoding multiplexed multispectral ghost imaging is divided into three steps. First, Hadamard basis patterns and cosinusoidal encoding matrices are combined to generate colored illumination patterns. The second step is similar to traditional ghost imaging; the constructed colored patterns are used to illuminate the target object, and a single-pixel detector is used to collect the reflection signal of the object. Subsequently, the conventional linear algorithm was used to obtain a composite grayscale image. The third step involved reconstructing the multispectral image. During this phase, a composite grayscale image of the object is converted to Fourier space for recombining the information of each channel. Further, the spectral information of the different channels is acquired separately and combined to generate a multispectral image. The influence of the ideal, Gaussian, and Butterworth low-pass filters on the restoration quality of multispectral images was simulated, and the approach was compared with the traditional method.Results and DiscussionsThe effectiveness of the proposed approach was verified by the numerical simulations of colored objects. In the restoration phase, different filtering parameters were used to extract the reconstructed spectral component information, and the PSNR (peak signal to noise ratio) and SSIM (structural similarity) were used to evaluate the reconstructed image quality (Fig. 2). The simulation results of the resolution test image show that multispectral images reconstructed with an ideal low-pass filter exhibit a ringing phenomenon. In addition, the Gaussian low-pass filter and Butterworth low-pass filter can improve image quality. When the filter radius is small, the reconstructed image becomes blurred. With an increased filter radius, the quality of the reconstructed images improves and gradually reaches a maximum value. As the filter radius increases, the image restoration quality rapidly decreases owing to the influence of other spectral component information (Fig. 3). Simulations indicate that for the images of natural scenery with higher gray levels, the Gaussian low-pass filter has the best restoration performance for a small filter radius, followed by the Butterworth low-order filter, the Butterworth high-order filter, and then ideal filters. The inflection point of the image quality-change curve corresponding to the filter with a better restoration effect appears earlier (Fig. 4, Fig. 5). The simulation results show that the Gaussian low-pass filter has certain advantages over the ideal and Butterworth filters. Preliminary experimental results demonstrate that the proposed method can achieve better imaging results when a Gaussian filter with a smaller filter radius is used. Through comparative experiments with traditional methods, the effectiveness of the proposed method and rationality of the filtering strategy are verified.ConclusionsThis paper demonstrates an approach for combining cosinusoidal encoding and multispectral ghost imaging. It can flexibly construct cosine coding matrices to meet specific needs and then combine them with the Hadamard basis patterns to project the imaging object with color illumination light. Each channel is encoded independently by the cosine coding matrices, and the information of the component images can be decoded in the frequency domain using the Fourier frequency shift in the cosine structure coding matrices. This approach requires only a single-pixel detector to obtain a multispectral image of the target object, simplifying the multispectral imaging system. Simultaneously, using the compressed sensing optimization algorithm is not required in the restoration process, which reduces the computational time of image reconstruction and improves the imaging efficiency. Numerical simulations and experimental results show that the new approach can effectively improve the efficiency of multispectral information acquisition and shorten the image reconstruction time. In frequency-domain filtering, the Gaussian low-pass filter is more advantageous than the ideal and Butterworth filters.
Jul. 10, 2023Vol. 50 Issue 13 1317001 (2023)
Jia Zhang, Changming Zhao, Zitao Cai, and Ziyin Zhao
ObjectiveSolar-pumped laser is a device that directly converts sunlight into laser. It has the advantages of reliable system structure, few energy conversion links, and efficient energy transmission from sunlight to laser. Improving the sunlight convergence system, designing an effective pump cavity and finding suitable laser materials are useful to improving the collection efficiency and conversion efficiency of the solar-pumped laser system for sunlight. Sunlight is a wide-spectrum light source, while the bandwidth of the absorption band of the laser material is limited, and the laser materials with different doping ions and ion concentrations have different absorption capacities for sunlight, so the utilization and conversion of sunlight by solar-pumped lasers are limited. Studying the matching of different laser materials with the solar spectrum and the influence of the length of the laser material on the spectral matching is helpful to analyzing the potential of different materials in the solar-pumped laser, and providing a reference for the parameter design of the length of the laser material. In this paper, Nd∶YAG, Cr∶Nd∶YAG and Ce∶Nd∶YAG laser materials widely used in solar-pumped lasers are taken as the research objects. Based on the analysis of their energy level structures, the spectral matching of three laser materials under solar pumping is analyzed by establishing a refined solar spectral model, and their application potential in solar-pumped lasers is discussed.MethodsBased on the theory of solar-pumped laser materials, the energy level structures of Nd∶YAG, Cr∶Nd∶YAG and Ce∶Nd∶YAG are analyzed, and the absorption bands of the three laser materials are determined. Then, the solar spectral data models are established by using the space-application-oriented solar spectral irradiance standard AM0 and the ground-application-oriented solar spectral irradiance standard AM1.5 provided by ASTM International. The overlapping efficiency between the solar radiation spectrum and the laser material absorption spectrum is calculated under the two models. On this basis, the absorption coefficient of the laser material is introduced into the overlapping efficiency. The variation of solar spectral matching efficiency of laser materials with absorption length after absorption coefficient correction is analyzed. Finally, the advantages of Nd∶YAG, Cr∶Nd∶YAG and Ce∶Nd∶YAG under solar pumping are compared by analyzing the absorption length required by the three materials when approaching the solar spectrum matching limit.Results and DiscussionsUnder the AM1.5 ground solar spectrum model, the overlapping efficiencies between the solar radiation spectrum and the laser material absorption spectrum for Nd∶YAG, Cr∶Nd∶YAG, and Ce∶Nd∶YAG are 17.34%, 35.55%, and 33.41%, respectively. Under the AM0 space solar spectrum model, the overlapping efficiencies are 15.4%, 33.13%, and 32.92%, respectively (Table 3). The overlapping efficiency under the AM1.5 solar spectrum model is slightly higher that under the AM0 solar spectrum model, indicating that the useful irradiation amount absorbed by laser materials in the AM1.5 model accounts for a larger proportion of the total solar spectrum irradiation. After the absorption efficiency is introduced, the spectral matching efficiency changes exponentially with the absorption length for the three laser materials. The solar spectral matching efficiencies of Cr∶Nd∶YAG and Ce∶Nd∶YAG are significantly higher than that of Nd∶YAG, about doubled. When approaching the solar spectral matching limit, the absorption lengths required for Nd∶YAG, Cr∶Nd∶YAG, and Ce∶Nd∶YAG under the AM1.5 model are 6.5 cm, 4.4 cm, and 3.7 cm, respectively (Fig. 4). Under the AM0 model, the corresponding required absorption lengths are 7.3 cm, 4.3 cm, and 3.8 cm, respectively (Fig. 5). Considering the solar spectral matching efficiency of the laser material and the scattering loss of the pump light inside the material, the actual length of the laser material should not exceed the absorption length studied. This analysis provides a maximum value for the design of the length of the laser material.ConclusionsIn this paper, three kinds of laser materials, Nd∶YAG, Cr∶Nd∶YAG and Ce∶Nd∶YAG, are taken as the research objects. Two solar spectral models oriented to space application and ground application are adopted to calculate the overlapping efficiency between solar radiation spectrum and material absorption spectrum. The absorption coefficient of laser material is then introduced into the overlapping efficiency, and the relationship between the solar spectral matching efficiency of laser material and the absorption length is analyzed after the absorption coefficient is corrected. When approaching the spectral matching efficiency limit, the absorption lengths of Nd∶YAG, Cr∶Nd∶YAG and Ce∶Nd∶YAG in the ground solar spectrum model are 6.5 cm, 4.4 cm and 3.7 cm, respectively, and the absorption lengths in the space solar spectrum model are 7.3 cm, 4.3 cm and 3.8 cm, respectively. The absorption length studied provides a maximum value for the length parameter design of laser materials. At the same time, the calculated length of Ce∶Nd∶YAG crystal is the shortest, and it is expected that the scattering loss introduced in this material will be the smallest. Therefore, using Ce∶Nd∶YAG crystal as the laser material is expected to further improve the output performance of solar-pumped lasers.
Jul. 10, 2023Vol. 50 Issue 13 1301002 (2023)
Lizhen Wu, Xiaojie Zhu, Shuanghui Jiang, Yuan Tian, Yi Zhang, Jiehua Chen, and Sihong Gu
ObjectiveMiniature optical atomic magnetometers are small, low-power, and highly sensitive. They have broad application prospects in geological exploration, geomagnetic navigation, and underwater target detection. To realize a miniature optical atomic magnetometer, it is necessary to accurately measure the temperature of the cell and achieve high-precision temperature control of the cell. In various existing temperature measurement methods, such as infrared, grating, and optical refractive index temperature measurements, the temperature measurement structure is complex and difficult to miniaturize. Therefore, in this study, a spectral absorption method is proposed to measure the internal temperature of the cell. After stabilizing the power and frequency of the incident light, the cell temperature is controlled by projecting the light from the cell. This method provides an alternative scheme for the temperature control of the cell of a miniature optical atomic magnetometer.MethodsIn this study, the atomic absorption spectrum was used to measure the temperature of the cells. First, the feasibility of using the absorption spectrum to control temperature was theoretically analyzed. The theoretical analysis shows that when the incident laser intensity is locked and the laser frequency is locked at the center frequency of the spectral line, the light intensity transmitting the cell is only related to the temperature. Subsequently, an experimental platform was developed (Fig. 1). In the experimental setup, a laser was produced using a vertical-cavity surface-emitting laser (VCSEL). First, the laser output power was detected by a photodetector, and a laser power servo was applied to control the VCSEL-injection current, thus locking the optical power. Subsequently, the atomic absorption spectrum line was detected and converted to a laser frequency-discriminating signal by synchronous modulation and demodulation technology. A laser frequency servo was applied to control the laser temperature, consequently locking the laser frequency at the center of the absorption spectrum line. Finally, the signal amplitude at the center of the atomic absorption spectrum was used to measure the cell temperature and realize cell temperature control. We achieved cell-temperature control using this scheme. The temperature control scheme proposed in this paper and the temperature control realized using the thermistor 1 measurement were used, and thermistor 2 was used to evaluate the control effect.Results and DiscussionsIt was observed that when the laser intensity and frequency were locked, the laser noise power spectral density decreased in the low-frequency area (Fig. 2), and after locking, the light intensity before and after the cell decreased with the increase in cell temperature (Fig. 3). For our experimental parameters, the optimal working temperature of the cell for our scheme is 65-70 ℃. A fitting curve was created using the theory, and the error of the cell temperature calculated by the fitting curve was not more than ±0.3 ℃ within the range of 61-75 ℃. The variation in temperature with time in the two control modes was recorded, as shown in Fig. 4(a). The Allan variance calculated according to Fig. 4(a) is shown in Fig. 4(b). It can be observed that the Allan variances for the two temperature control methods are almost equivalent, indicating that the temperature control effect is equivalent.Because the laser intensity and frequency are locked, the produced laser can be easily employed to polarize the atoms. The assembly in the scheme is easily miniaturized, and this scheme is suitable for fabricating miniature atomic magnetometers. When applied to a miniature atomic magnetometer, the temperature sensitivity of the magnetometer can be reduced, and the performance of the magnetometer deteriorates slightly after long-term operation.ConclusionsIn this study, we proposed a scheme to measure and control the temperature of a cell using the atomic absorption spectrum. We used this scheme to achieve laser power and frequency locking, as well as temperature control of the cell. After the laser power and frequency locking were realized, the laser intensity noise was reduced compared to the free-running state. We also used a thermistor to measure the temperature of the cell to realize the temperature control of the cell. The temperature control effect of the scheme proposed in this study is nearly equivalent to that achieved using a thermistor. This study provides a feasible scheme for realizing laser frequency locking, power locking, and cell temperature control of miniature optical atomic magnetometers.
Jul. 10, 2023Vol. 50 Issue 13 1301003 (2023)
Yang Zhao, Yuying Zhong, Xiaoyan Gao, Chengxu Tu, and Fubing Bao
ObjectiveCavitation near a liquid-liquid interface is a well-known and an important phenomenon owing to the wide application of cavitation bubbles in emulsion preparation, wastewater treatment, petroleum refining, and other processes. However, very few studies have been conducted to observe bubble dynamics near a liquid‐liquid interface, and the interaction between a bubble and the liquid-liquid interface of oil films and water has not been considered in the literature. To gain a better understanding of bubble dynamics and offer an effective way to improve cavitation techniques, this study investigates the dynamics of a cavitation bubble near an oil film‐water interface.MethodsDimethyl silicone oil and deionized water are utilized to produce an oil film-water interface, and the pulsed laser-induced method is applied to generate a single cavitation bubble near the interface. To nucleate a single bubble, a laser pulse with a 532-nm wavelength is expanded and collimated by a beam expander, and then focused into a glass tank. A time delay trigger connected to the pulsed laser and two high-speed cameras is used to realize the synchronized recording of the two cameras after firing the laser pulse. Cavitation bubble dynamics near the oil film-water interface and the evolution of the lower interface (liquid‐liquid interface) are captured using the high-speed camera with a frame rate of 105 frame/s, whereas the evolution of the upper interface (gas-liquid interface) on a much longer time scale is recorded using a high-speed camera with a frame rate of 2000 frame/s.Results and DiscussionsThe effects of the dimensionless distance γ and oil film thickness D on the cavitation bubble collapse characteristics and interface evolutions are explored. Owing to the existence of the oil film-water interface, the cavitation bubble collapses nonspherically, moves away continuously, and produces a high-speed jet away from the interface under different experimental conditions. The displacement of the cavitation bubble centroid increases logarithmically with an increase in the anisotropic parameter ζ (i.e., the decrease in γ), resulting from the enhancement of the interaction between the cavitation bubble and liquid‐liquid interface. As the total collapse shock wave energy decreases with increasing ζ, more energy is needed to drive the bubble rebound to a larger volume in the secondary period of bubble oscillation; therefore, the relative rebound radius also increases logarithmically with the increase in ζ. The lower interface of the oil film evolves during the bubble collapse, which is mainly caused by the inertia of the bubble oscillation. The upper interface evolves on a much longer time scale owing to the competing effects of interfacial tension, gravity, and viscosity. Three typical modes of liquid jet are observed for the upper interface: hump jet (Fig. 6), thin jet (Fig. 7), and two-tier jet (Fig. 8). Three typical modes of motion are also observed for the lower interface: slight disturbance (Fig. 9), inverted hill deformation (Fig. 10), and cone deformation (Fig. 11).ConclusionsIn this study, a single cavitation bubble is generated near the liquid‐liquid interface of the oil film and water using the pulsed laser-induced method. Two high-speed cameras are used to simultaneously record the cavitation bubble collapse and evolutions of the upper and lower interfaces of the oil film. The results show that the cavitation bubble generated near the oil‐water interface continuously moves away from the interface during the process of nonspherical collapse and develops a high-speed jet away from the interface. The relation between the displacement of the cavitation bubble centroid and anisotropic parameter ζ and the relation between the relative rebound radius and ζ are both logarithmic. The lower interface motion of the oil film is observed during the bubble collapse, whereas the upper interface starts to deform after the bubble collapse is over. Three typical liquid jet modes (hump jet, thin jet, and two-tier jet) are observed for the upper interface, and three typical motion modes (slight disturbance, inverted hill deformation, and cone deformation) are observed for the lower interface. In the case of a hump jet, the dimensionless maximum height hm follows the power law, hm ∝ γθ. The observations herein offer a deeper understanding of the cavitation dynamics and provide theoretical guidance for cavitation techniques.
Jul. 10, 2023Vol. 50 Issue 13 1301005 (2023)
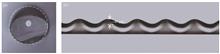
Hangbo Zou, Renbo Xia, Yuansong Zeng, Jibin Zhao, Yueling Chen, Tao Zhang, Tianyu Zhang, and Shengpeng Fu
ObjectiveAviation tubes have been widely used in various systems of aerospace equipment owing to their excellent physical and chemical properties. It is important to ensure the manufacturing quality of aviation tubes for the safety of aircraft. Aviation tubes are manufactured by bending straight tubes. Under the action of the bending moment, the inner side of the tube is wrinkled and deformed owing to compressive instability. Although numerous researchers have investigated various manufacturing methods in the past few decades, wrinkle deformation is still unavoidable. The wrinkle degree of the tube is a key indicator of tube deformation, with the key geometric parameter being the wrinkle depth. Conventional manual inspection methods cannot guarantee the measurement efficiency and reliability of measurement results. Using a digital 3D measurement method can effectively avoid these shortcomings. Such methods quickly capture the surface shape data of the target object and have been widely used in welding seam detection and contour deformation detection.MethodsThe wrinkle degree can be measured using the scanning point cloud of the bent tube. First, combined with the shape characteristics of the bent tube, a tangent-arc-tangent model method is proposed to reconstruct the spine line of the tube and determine its shape parameters. It assumes that the spine line of the bent part is an arc, and the spine lines of the two straight tubes on both sides are the tangent lines of the end points on both sides of the arc. Thus, it ensures G1 smoothness between the straight and bent spine lines. By using the nonlinear least square method to optimize the distance between each spine line point and the corresponding spine line, the parameters of the spine line model are calculated. Subsequently, the contour lines are managed using the pole angle of each surface point under the respective spine line cross-section. Using this method, the contour line of the inner side of the bend can be quickly extracted, and distortion of the contour line in the wrinkle area can be avoided. Finally, a flattening method of the contour line is proposed. The wrinkle identification is not affected by the bent shape of the tube because of the flattened contour, so the peak and valley of each wrinkle can be correctly identified. The maximum wrinkle depth on the tube surface is then used to calculate the wrinkle degree.Results and DiscussionsSpine line reconstruction validation is performed by using two typical bent tubes with radii of 7.5 mm and 26 mm. For all five scans, the spine lines are successfully reconstructed and the contour lines are successfully extracted (Fig. 10). The model parameters before optimization are different from the actual parameters (Figs.11-12). There is a systematic deviation in the error of the spine line points. This is because there may be large deviations in the direction of the straight spine line. After optimization, the average error of the bending radius is -0.073-0.042 mm, and the average error of the bending angle is -0.114-0.195°. The average error of the spine line point is close to zero, and the root mean square error is reduced from 0.297-15.439 mm to 0.171-1.129 mm. The optimized spine line shape parameters reflect the real shape of the spine line well. The spine line error remains stable. The maximum depth of wrinkles can be accurately identified on the bent tube with obvious wrinkles (Fig. 14). Further, the accuracy of the wrinkle analysis is verified using the standard part (Fig. 15). The depth errors of different wrinkles are stable at 0.007 mm, and the wrinkle degree errors are stable at 0.011%. Therefore, the method proposed in this study can stably and reliably analyze wrinkle deformation of the bent tube.ConclusionsTo measure the wrinkle degree of bent tubes quickly and efficiently, a numerical analysis method based on the scanning point cloud of bent tubes is proposed. The effectiveness of the proposed method is verified using several typical tubes and a standard part. The experimental results show that the method proposed in this study can effectively identify the shape parameters of the bent tube and extract the contour lines. The reconstructed tube spine line fits well with the spine line points of each tube part. The contour flattening method proposed in this study can identify the wrinkle without any interference from the bending shape and accurately extract the wrinkle with the largest depth. Additionally, the proposed method can stably identify wrinkles with different depths on the standard part, with the wrinkle degree error stabilizing at 0.011%. Therefore, the proposed method can be used to accurately measure the wrinkle degree of bent tubes.
Jul. 10, 2023Vol. 50 Issue 13 1304001 (2023)
Ke Wang, Ping Yang, and Guangzhen Xing
ObjectiveHigh-intensity focused ultrasound (HIFU) is a non-invasive medical thermal ablation technology that can realize the “non-invasive” treatment of diseases. It is developing into a standard tumor treatment method. The accurate measurement of the HIFU sound pressure is very important for formulating clinical schemes involving HIFU treatment and ensuring the safety and effectiveness of the treatment. Laser interferometry has been adopted by new-generation sound pressure benchmarks because of its high precision, non-contact characteristic, and direct traceability to the length benchmark. The bandwidth of a laser interference system directly affects the upper limit of sound pressure measurements. Current methods of estimating system bandwidth are based on linear sound field conditions; however, with an increase in the measured sound pressure, the HIFU field will become nonlinear, leading to a deviation between the system bandwidth requirements and the model solution results. Aiming to address the problem of bandwidth calculation of interference systems for HIFU sound pressure measurement, this study theoretically analyzes a mathematical model of interference system bandwidth and vibration signal in HIFU sound pressure measurement, refers to the measured sound pressure value, and establishes the relationship between interference system bandwidth and sound pressure by numerical simulation.MethodsAccording to the mathematical relationship between sound particle vibration and interference signal, a bandwidth model of interference signals under the condition of a nonlinear sound field is established. Because the interference signal is expressed as a nonelementary function that cannot be expanded by the Bessel function, the bandwidth of the interference signal under the condition of a nonlinear sound field is analyzed by numerical simulation. The simulation results show that compared with that in a linear sound field, the interference signal spectrum in a nonlinear sound field is not symmetrically distributed centered on the carrier frequency but widened and shifted. In order to obtain the real HIFU sound pressure and ensure that the simulation results are closer to the actual values, the HIFU sound field is measured using the optical fiber hydrophone, and the sound pressure waveforms and frequency domain distributions corresponding to different sound pressures are obtained. According to the waveform parameters of the sound pressure, the simulation conditions of the interference signal bandwidth are set, and the bandwidths of the interference systems required by different sound pressures are obtained.Results and DiscussionsUsing the measured sound pressure data of the HIFU sound field, the relationship between the bandwidth of the heterodyne interference system and HIFU sound pressure is simulated. Under the condition that the relative error of the sound pressure measurement caused by the system bandwidth is less than 2%, the corresponding relationship between the lowest bandwidth of the heterodyne interference system and the peak value of the measured sound pressure is determined. Through curve fitting, it is deduced that quadratic fitting has a smaller fitting error than linear fitting. Therefore, it is inferred that under the condition of a nonlinear sound field, the bandwidth requirement of the heterodyne interferometry system changes via a quadratic law with the peak-to-peak of the measured sound pressure, which means that the bandwidth requirement of the heterodyne interferometry system will increase sharply with a higher intensity sound pressure measurement. When the peak value of the measured HIFU sound pressure reaches 60 MPa, the bandwidth of the heterodyne interferometry system should not be less than 473 MHz; thus, the sound pressure measurement error introduced by the system bandwidth can be less than 2%. Here, if the calculation is carried out according to linear sound field conditions, the system bandwidth in the same case is not less than 130 MHz, which obviously differs considerably from the actual situation and causes a large measurement error.ConclusionsThis study focuses on the problem that the bandwidth solution of the interference system in HIFU sound pressure measurement by laser interferometry depends on the linear sound field conditions, which causes a large difference between the solution results and reality. First, through theoretical analysis, a mathematical model of the interference signal for HIFU sound pressure measurement is established. The frequency domain of the interference signal is analyzed by numerical simulation. It is inferred that the spectrum of the interference signal under the condition of a nonlinear sound field is widened and shifted compared with that under the condition of a linear sound field. It is proved that existing methods for estimating the interference system bandwidth under the condition of a linear sound field are not suitable for HIFU sound pressure measurements. Combined with the HIFU sound pressure measurement data, the relationship between the bandwidth requirements of the heterodyne interference system and the peak value of the sound pressure is simulated and analyzed. The analysis results show that under the condition of a nonlinear sound field, the bandwidth requirements of the heterodyne interference system change via a quadratic law with the peak-to-peak value of the sound pressure.
Jul. 10, 2023Vol. 50 Issue 13 1304002 (2023)
Zhichao Xu, Junpeng Xue, Pengfei Sun, Zeyu Song, Changzhi Yu, and Wenbo Lu
ObjectiveIn many complex environments, intelligent manufacturing technology using robots faces many challenges. There are rapid response to changes in the workspace, false perception, error of noise and control, and even resistance to disturbances of the robot itself. The grasp detection of target in the real working scene is an important step in robot workflow, which involves grasp positioning and attitude estimation (Fig. 1). Due to the complexity of robot grasp detection, in recent years extensive research has committed to using deep learning method to achieve grasp detection. The objective is to improve the accuracy, timeliness and stability of robot grasp detection. Deep learning methods for real-time robot detection and grasp are divided into three main categories. They are sliding window-based, bounding box-based, and pixel-level methods. The sliding window-based method is effective for grasp detection. But the large number of iterations and the slow response speed make it difficult to meet the real-time requirements. Bounding box-based methods have a positive effect on target detection. But the structure of the model is complex and a large quantity of parameters should be learnt. In the present study, we report a robot grasp detection method based on a stable pixel-level lightweight network to reduce the number of parameters. We hope that our method can save more computation and memory during robot grasp detection. And it can ensure the high accuracy, timeliness and stability under complex conditions.MethodsFirstly, an enhanced dataset is created by using random cropping, scaling, and rotation on the Cornell dataset (Fig. 2). Then, we build a lightweight network based on U-net (Fig. 5). Residual blocks are added to increase the number of extracted feature layers in the network. They can suppress the gradient vanishing and dimensional error (Fig. 6). At the same time, instance normalization (IN) is used to design the normalization layer of the residual block and each convolutional block in the network (Fig. 3). It will increase the stability of the detected image instance and accelerates the model convergence (Fig. 6). In addition, the network integrates the idea from the feature pyramid network (FPN) structure (Fig. 4). We connect the top-down feature map with the bottom-up feature map through the horizontal connection layer. The former has strong semantics, low resolution and easy target recognition. The latter has weak semantics, high resolution and easy target localization. Meanwhile, the multi-dimensional information is integrated to improve the localization ability and semantic information of the output feature map (Fig. 5). Finally, in order to avoid the problem of gradient explosion and outlier interference, our study uses the Huber loss function to analyze the calculation results.Results and DiscussionsIn this study, all comparison methods uniformly use the Cornell dataset. And we use different intersection-over-union (IOU) standards to evaluate the network performance (Table 1). As the IOU standard becomes more strict, our network changes smoothly (Fig. 7). When the IOU is 0.5, the accuracy of our network can still reach 80.9%. Therefore, our network performance is more stable and competitive in robustness to complex environments. When the IOU is 0.25, the network model designed in this study has 94.4% accuracy, 40.8 frame/s speed and 478900 total parameter quantity (Table 2). The results show that our method can achieve high accuracy and speed when the total parameter quantity keeps small. The model is tested using random objects in the Cornell dataset (Fig. 8). And we also perform real-time detection of unknown objects (Fig. 9). The experiment shows that the network designed can output the grasp frame with accurate positioning and posture information for objects with different properties, including objects partially in the figure, translucent objects, reflective objects, bifurcated objects, irregularly shaped objects, and even transparent objects.ConclusionsThis study is based on simultaneously achieving high accuracy and timeliness of robot grasp detection, reducing the number of system parameters and ensuring the stability of the network. Referring to the pixel-based U-net lightweight network model, we design a robot grasp detection method based on stable lightweight network. Firstly, the quantitative results show that the simulated curve is stable and the total parameter quantity of the method is 478900. Our method can maintain more than 80% accuracy when the IOU is less than 0.5, outperforming the existing methods. At the same time, when the IOU is 0.25, it has a high accuracy of 94.4% and a speed of 40.8 frame/s. It is rational that this method can meet the current requirements for the accuracy, timeliness and stability of robot grasp detection. Moreover, the qualitative results show that the network model designed in this study is effective on objects with different properties. Especially, our method is not disturbed by the situation that the current depth camera cannot accurately measure transparent objects. Finally, it is shown that adding IN and FPN to the lightweight network can effectively improve the performance of robot grasp detection.
Jul. 10, 2023Vol. 50 Issue 13 1304003 (2023)
Wang Jiang, and Kaihua Sun
ObjectiveAs thin-walled structural components are widely used in the aerospace field, it is necessary to evaluate their mechanical properties, particularly the elastic modulus. The traditional methods for measuring the elastic modulus include the tensile and indentation methods; however, these methods are not suitable for the detection of formed structural components because they are destructive. By contrast, laser ultrasound is a nondestructive testing method with the characteristics of high resolution, flexible sound source, multiple modes, and noncontact; therefore, this method is appropriate for measuring the elastic modulus of thin-walled structures. The primary advantage of measuring the elastic modulus using laser ultrasound is the accurate detection of the velocities of compressional and shear waves. For bulk structures, compressional and shear waves can be motivated simultaneously and measured accurately. Several scholars have used this method to calculate the elastic moduli of various materials. However, in thin-walled structures, ultrasonic waves propagate in the form of Lamb waves, and it is difficult to directly measure the velocities of compressional and shear waves. Therefore, the velocities must be inversed using the Lamb wave data. Dispersion curve inversion is a commonly used inversion method; however, it obtains signals by scanning a large area. In this case, the results would be affected by the uneven thickness of the sample. A local detection method is required to accurately measure the local elastic modulus of thin-walled structures. In this paper, the Lamb wave dual-modal resonance method is proposed based on the zero group velocity (ZGV) resonance and thickness resonance of the plates. In this method, the local Poisson's ratio and the local bulk wave velocity of the thin plate are calculated using the S1 modal ZGV resonance peaks and any other resonance peak in the spectrum through single-point detection without scanning, and the local elastic modulus is determined by combining the measured densities. This method provides a theoretical basis for the online monitoring of the elastic modulus of thin-walled structures.MethodsThe dual-modal resonance method uses resonance peaks to calculate the velocity of ultrasonic waves and Poisson's ratio and then combines the densities measured to detect the local elastic modulus. First, the relationship curve between the correction factor and the Poisson's ratio is calculated (Fig. 5). Then, the spectra of aluminum, copper, and titanium plates by single-point detection are obtained using laser ultrasound (Fig. 8). Subsequently, the S1 modal ZGV resonance peaks with large amplitude and any other resonance peak in the spectrum are selected to calculate the local Poisson's ratio and the local bulk wave velocity of the thin plate using the dual-mode resonance method, and the local elastic modulus is obtained by combining the measured densities (Table 3). Finally, the measured compressional wave velocity and elastic modulus are verified using a 50-MHz compressional wave probe and a nano-indenter.Results and DiscussionsLaser ultrasound experiments are performed to detect the resonance peaks and calculate the elastic modulus using the dual-modal resonance method. The results show that there are multiple resonance peaks in the spectrum, and the amplitude of the S1 modal ZGV resonance peak is the largest. In the spectrum of the titanium plate, the A3 resonance peaks are disturbed by noise and are difficult to identify (Fig. 8). In this case, the calculation can be completed by combining the S1 modal ZGV resonance peaks with any other resonance peak, without A3 resonance peaks. The results show that the difference in the velocities between the calculated and measured values is within 20 m/s, and the difference in the elastic moduli between the calculated and measured values is within 2 GPa. Therefore, the Lamb wave dual-modal resonance method is reliable for accurately calculating the elastic modulus of thin-walled structures.ConclusionsIn this paper, a local detection method, namely, the Lamb wave dual-modal resonance method, for measuring the elastic modulus is proposed. In this method, the local Poisson's ratio and the local bulk wave velocity of the thin plate can be calculated using the S1 modal ZGV resonance and any other modal resonance in the spectrum, and the local elastic modulus can be determined by combining the measured densities. The measurement results by the compressional wave probe and the nanoindentation instrument prove the accuracy of the proposed method. Compared with the traditional methods used for measuring the elastic modulus, this method is nondestructive, efficient, and noncontact, and is suitable for detecting the elastic modulus of thin-walled structural components. In addition, compared with the inversion method using the dispersion curve, this method is more efficient because it identifies signals through single-point detection. Finally, when some resonance peaks cannot be identified in the spectrum owing to noise, the calculation can be completed using other resonance peaks that are not affected by noise through this novel method.
Jul. 10, 2023Vol. 50 Issue 13 1304004 (2023)
Xing Hu, Shangbin Yang, Kaifan Ji, Jiaben Lin, Yuanyong Deng, Xianyong Bai, Xiaoming Zhu, Yang Bai, and Quan Wang
ObjectiveThe filter-type magnetograph is one of the main devices for measuring the solar vector magnetic field. SMAT in Huairou, a solar magnetograph, is initially used for conventional observation in China. It obtains polarization information at a fixed temperature and wavelength point, and then acquires the solar vector magnetic field through the calibration process. Due to the changeable factors such as temperature variation and mechanical errors (e.g., tooth gap), the wavelength points observed by the filter would be altered, which weakens or removes the polarization signal. It would finally affect the accuracy of solar vector magnetic field measurement. The current method of wavelength point calibration takes more time, less data and lower temporal resolution by scanning the spectral line profile and locating wavelength points. In addition, the frequent mechanical rotation lowers the lifetime of filter, which further impedes the acquisition of stable and high-quality data. Last but not least, the current method could not form a real-time and closed-loop system to distinguish and control the wavelength points. In view of this, based on the analysis of the data characteristic of SMAT, we summarize a new data pre-processing way, employ the supervised learning of machine learning and then propose a neural-network-based observation scheme of wavelength point calibration. This scheme has established the relationship between a single frame image and the corresponding wavelength point, which shortens the time of locating the position of wavelength point by a single frame image.MethodsThe present study uses the spectral line scan data from SMAT, which are 31 monochromatic images obtained by moving the filter from the blue to the red side of the spectral line, subject to the observation conditions. We first analyze the data characteristics. It is found that the Doppler velocity generated by the rotation of the Sun from west to east causes the image to exhibit a large scale uneven distribution of grayscale (brighter on one side and darker on the other). Therefore, when the filter gradually takes images from the blue side to the red side of the spectrum at different wavelength points, the image gradually changes from bright left and dark right to dark left and bright right with the shooting position (Fig. 2). Then, the data are pre-processed: selecting the data that can be fitted with a smooth spectral profile, and performing P-angle correction, edge dimming removal, and normalization on these data. Next, the information outside the solar circle is removed by polar coordinate transformation, and the image size is also decreased. Then, principal component analysis (PCA) is used to reduce the dimensionality of the data, so as to eliminate the interference of small signals and avoid problems caused by high-dimensional features. Based on this, a regression multilayer perceptron (MLP) network based on back propagation (BP) algorithm is proposed. As for the neural network, we took 70% of the data as the training set and 30% as the test set, and carried out the method validation experiment, grouping test experiment, and experiment to overcome system change, respectively. Finally, we propose the general flow of the observing wavelength point calibration algorithm and select data of different time periods to compare the traditional method and the present method in time consumption, and the results show that the method can greatly save the calibration time.Results and DiscussionsThe results of the method validation experiment show that the mean square errors (MSEs) of the training set and the test set are 0.0003 and 0.0005 (Fig. 10), indicating that 99.73% of the data have the error of less than 0.0009 nm and 0.0015 nm, respectively. In the grouping test experiment, to ensure that the data of the experimental set were observed under a relatively stable system, all data were divided into five experimental sets according to the maintenance records. The MSEs of the training set and the test set are 0.0002 and 0.0027 [Figs. 11(a) and 11(b)], and the test set that is close to the training set in time has a small error in the prediction results [Fig. 11(c)], which illustrates the effectiveness of the method. The gradual increase in error in the test set far from the training set in time is consistent with the actual change of the system from stable to unstable. The experimental results of the other groups are also consistent with this situation (Fig. 12). To overcome the systematic variation in reality, we narrowed the band range and the standard deviation of the errors in the training and test sets were 0.0001 and 0.0006, respectively, indicating that 99.73% of the data had the error of less than 0.0003 nm and 0.0018 nm (Fig. 13). This result indicates that using data with a smaller band range for training the network can effectively overcome the effect of system instability. In terms of time consumption, the time required for calibration by the traditional method is 15-20 min, while that of the proposed method is less than 7 s, showing a 100 times improvement of the proposed method in calibration speed (Table 2).ConclusionsIn this paper, we investigate the calibration of the observing wavelength points of a birefringent narrow band filter-type magnetograph. Firstly, an effective pre-processing scheme of data is proposed based on the reasonable analysis of image data. And then, the BP-based MLP regression network calibration scheme is put forward. Afterwards, this scheme is tested by feasibility verification, grouping test experiment and the experiment to overcome system change. In addition, the scheme is compared with traditional methods in efficiency. At last, the experimental results show that this scheme is more than 100 times faster with reliable and effective data than the traditional method, so it can be regarded as a more efficient method for the calibration of observing wavelength points. Meanwhile, the regression network can be used to judge the operating condition of the instrument, namely, calibrating the same set of data with the network can give the information whether the magnetometer is stably operated or not by the residuals and variation trend of the predicted value and tag value. This method can effectively reduce the shortening of working life of the filter due to the frequent motor rotation during calibration. It can also increase the efficiency and stability of the observation on terrestrial and space solar magnetic field measurements. In the future application, this scheme could support the automatic real-time regulation of the filter position by introducing a real-time closed-loop feedback mechanism in the filter band adjustment, which could ensure the stable and high-quality output of observation data.
Jul. 10, 2023Vol. 50 Issue 13 1304005 (2023)
Yunjun Lu, Zhongliang Li, Feng Tang, and Xiangzhao Wang
ObjectiveThe wavefront aberration and the numerical aperture (NA) of projection lens directly determine the critical dimension and resolution in lithography. Hence, high-accuracy wavefront and NA measurement is crucial in lithography systems. With the advantages of a common optical path, null testing, and no need for extra ideal reference, double-grating Ronchi lateral shearing interferometry (LSI) has great potential for high-accuracy and high-dynamic-range wavefront measurement, which is suitable for online wavefront aberration measurement of the projection lens in lithography. In Ronchi LSI, NA is also a basic parameter for wavefront measurement. Traditional method of NA measurement needs to measure the focal length and the exit pupil diameter. Although there are many ways to measure the focal length, the diameter of exit pupil cannot be measured, unless the aperture of the system is that of the last element. The method which uses the commercial Abbe apertometer (Zeiss) is relatively mature, however, this method requires manual adjustment of the vernier and surveyors have to observe at the exit pupil plane, which increases the complexity of the measurement process. In the present study, we report a new method of NA measurement in the double-grating Ronchi LSI system. With theoretical derivation of the geometric optical path difference introduced in the shearing wavefront, by measuring the shearing wavefront and calculating the tilt coefficient (the coefficient of Zernike Z2 in X-direction shearing wavefront or Z3 in Y-direction shearing wavefront) at two different axial positions, NA is calculated by using the distance between the two axial positions and the differential value of the tilt coefficients. This method can be integrated easily into the current double-grating Ronchi LSI system, which can achieve the online measurement of the NA and wavefront simultaneously.MethodsThe image-plane grating is moved along the axial direction (Z direction) in the study. Taking the X-direction shearing interferogram for example. The projection lens under test is placed in the double-grating Ronchi LSI system, and the object-plane grating and the image-plane grating are placed at the corresponding focal planes of the projection lens under test, respectively. The image-plane grating is moved to the first position, and then moved along the X direction according to the phase shifts mentioned in the (3N+1)-frame algorithm, where N is a positive integer. A total of 3N+1 interferograms are obtained. Firstly, the shearing wavefront φ1 at the first position is calculated using the (3N+1)-frame algorithm. Then, the image-plane grating is moved along the axial direction with distance δz to the second position, and the shearing wavefront φ2 at the second position is measured and calculated again with the same method. Thirdly, the X-tilt coefficients of Zernike terms (Z2) of φ1 and φ2 are calculated, which are recorded as c21 and c22, respectively. The differential value Δc2 between c21 and c22 is obtained. Substituting the δz and Δc2 values into Eq. (12), the NA of the projection lens under test is calculated. The method using Y-direction shearing interferogram has the similar process. The NA of the projection lens under test is calculated by substituting the δz and Δc3 (differential value of Z3 coefficients between the first position and the second position) values into Eq. (13). The image-plane grating can be moved n times, then an average value of the n-1 groups of Δc2 and Δc3 will be obtained to eliminate the random error during the measurement.Results and DiscussionsThe projection lens under test used in the experiment has a magnification of 5× and an NA of 0.3. Overall, with the equally spaced movement of image-plane grating along the axial direction, i.e., all the intervals between two adjacent positions are equal, the measured tilt coefficients of c2 of Z2 (X direction) and c3 of Z3 (Y direction) change linearly with the position variation along the axial direction, as shown in Fig. 13. We can see that both c2 and c3 have nearly the same value at the same positions, which is consistent with the information shown in Eqs. (12) and (13). An average value of the 12 groups of Δc2 and Δc3 is 216.4 nm, and the distance δz between any two adjacent positions is 10 μm, then the NA of the projection lens under test is calculated to be 0.292.ConclusionsIn this paper, a new method which can be used for the online measurement of the NA of projection lens in the double-grating Ronchi LSI system is proposed. The geometric optical path difference in the shearing wavefront introduced by the defocusing of image-plane grating is theoretically derived, and the mathematical model of the relationship between NA and the tilt coefficients of the shearing wavefront (Z2 in X-direction shearing wavefront and Z3 in Y-direction shearing wavefront) is established. By moving the image-plane grating along the axial direction, the shearing wavefront is measured and the tilt coefficients are calculated at each position. The NA of the projection lens under test is calculated using the corresponding mathematical model. A microscope with a designed NA value of 0.3 is used to carry out the experiment, and the experimental measurement result is 0.292. The result of NA measurement by using geometric optical method is 0.294, which verifies the effectiveness of the proposed method. Compared with the traditional geometric optical method, the NA value can be obtained by small defocusing near the focal plane using the proposed method and only the shearing wavefronts at two different positions along the axial direction are needed to measure. This method is also the premise of high-accuracy and high-NA wavefront measurement in Ronchi LSI system, and it provides a convenient method for the measurement of wavefront and NA in Ronchi LSI system simultaneously, without any need of other devices.
Jul. 10, 2023Vol. 50 Issue 13 1304006 (2023)
Jie Yu, Lei Gong, Haibin Wang, Liguo Wang, Lihong Yang, Yao Li, and Zhiqiang Yang
ObjectiveWith the continuing development of photoelectric detection technology, infrared polarization technology offers significant advantages, such as cloud penetration and target recognition. Infrared polarization technology has been widely used in stealth, anti-stealth, and military camouflage. The camouflaged target may be more accurately detected using infrared polarization detection since it shows substantial polarization radiation features in the infrared range. In contrast, coating the surface with a depolarization coating can effectively diminish its polarization characteristics, thereby creating a target camouflage. Therefore, investigating the characteristic polarization modeling of camouflage coatings can aid in the effective generation of camouflage and anti-camouflage for the target. Most of the shading functions utilized in the current polarization bidirectional reflectance distribution function (pBRDF) are blind simplified models that do not correspond to the actual rough surface elements. Consequently, it is necessary to conduct shading function research consistent with the real scenario. Research on the polarization characteristics of coatings in the extended infrared band, in particular, is still in its infancy and requires further investigation.MethodsIn this work, an improved shading function model is adopted, and the specular reflection coefficient and diffuse reflection coefficient are introduced to characterize the polarized radiation characteristics of the camouflage coating surface using the Priest-Germer (P-G) model. A two-component pBRDF optimization model is established, and a linear polarization degree model of infrared radiation is derived. The numerical calculation results of the model are compared with the experimental data, and the effects of the surface roughness, geometric attenuation, and diffuse reflection on the infrared polarization degree of the coating surface are analyzed numerically. Additionally, the effect of environmental radiation on the infrared polarization characteristics of the coating is analyzed.Results and DiscussionsThe numerical results of the proposed infrared polarization model are compared with the experimental data, and the slope of the curve after linear fitting is 0.9924 (Fig. 4). The linear polarization degree model reflecting the geometric attenuation and diffuse reflection effects is analyzed. The results show that the larger the surface roughness of the coating, the smaller the infrared polarization degree (Fig. 6). The more significant the geometric attenuation and diffuse reflection effects, the lower the infrared polarization degree of the coating (Fig. 7). When the ambient radiation ratio is less than 1, that is, when the spontaneous radiation is dominant, the lower the ambient radiation ratio, the higher the degree of linear polarization of the coating. When the ambient radiation ratio is higher than 1, the ambient radiation becomes dominant, and the higher the ratio, the lower the degree of linear polarization of the coating (Fig. 8). When the ratio of the coating radiation intensity to the background radiation intensity is closer to 1, the infrared polarization degree of the coating reduces.ConclusionsThe geometric attenuation model established in this study can effectively eliminate the sharp inflection point of the blind model and ensure that the model does not exhibit larger amplitudes at large incident angles, improving the accuracy of the model. Considering the geometric attenuation and diffuse reflection effects, the calculation results of the linear polarization degree is consistent with the experimental data. The greater the surface roughness of the coating, the lower the infrared polarization degree; the more significant the geometric attenuation effect, the lower the infrared polarization degree of the coating. The diffuse reflection effect is negatively correlated with the infrared polarization degree of the coating, and the contributions of geometric attenuation effect and diffuse reflection effect are elucidated. Different linear polarization degrees are obtained with the change in the incident zenith angle, and the peaks of the linear polarization degrees of the camouflaged coatings appear between 70° and 80°. When the ratio of the ambient radiation of the coating is closer to 1, the degree of linear polarization is lower. The conclusions above provide theoretical support for camouflaged coatings in infrared polarization stealth and anti-stealth coatings. Because of the limitations of theory and space, many areas in this study still require further improvement. For example, the effects of volume/surface scattering on the surface-polarized radiation characteristics of infrared coatings are ignored in this study. Further research should be conducted, considering volume/surface composite radiation modeling.
Jul. 10, 2023Vol. 50 Issue 13 1304007 (2023)
Weichuan Zhang, Qing Pan, Lihua Su, Tianyi Wu, and Chen Dong
ObjectivePulse position modulation, which is a modulation method obtained from the on-off keying (OOK) after encoding, has the characteristic of a high energy efficiency ratio, which increases peak optical power by reducing the duty cycle to overcome the adverse effects of factors such as atmospheric turbulence and dark counts on the signal. It also increases the signal-to-noise ratio, giving it better channel interference immunity, which is important in a wide range of applications in atmospheric and even deep-space optical communications. In pulse position modulation communication systems, classical receivers usually use direct detection to detect pulse position modulated signals, and their bit error rate (BER) performance is limited to the standard quantum limit (SQL). However, in quantum theory, their counterparts, which can obtain more information than classical communication systems, increase the BER performance to the Helstrom limit. However, there is a lack of relevant studies on the effects of practical factors on the BER performance of pulse position modulated quantum-enhanced receivers. In this study, we analyze the effects of the main practical factors, interference visibility, dark counts, and detection efficiency on the BER performance of a single pulse position modulated joint detection quantum-enhanced receivers based on 4-PPM (PPM, pulse position modulation) signal modulation. We also provide a theoretical reference for the subsequent development of quantum-enhanced receiver design and experiments.MethodsFirst, the structure of the joint detection quantum-enhanced receiver system for pulse position modulated signals is introduced. Second, a decision-tree model of the corresponding feedback control strategy is established, from which the theoretical BER performance of the joint detection quantum-enhanced receiver is obtained. Then, the effects of practical factors such as interference visibility, dark counts, and detection efficiency on the system performance are analyzed by Monte Carlo simulation and compared with SQL, the Helstrom limit, and the ideal performance of the receiver to determine the influence mechanisms of various practical factors.Results and DiscussionsThe simulation results show that as the average number of photons increases, the non-ideal interference visibility causes the bit error to first decrease and then increase, and its minimum point value is positively correlated with the interference visibility (Fig. 3). The existence of dark counts causes the bit error rate to converge to a fixed value, which is a monotonically decreasing function of dark counts (Fig. 4). Moreover, the non-ideal detection efficiency causes the bit error rate to decrease exponentially and the deceleration rate to increase with the detection efficiency (Fig. 5).ConclusionsIn the experiment, by adjusting the moderate numbers of average photons of input signals and the intensity and polarization of the local oscillator to obtain high interference visibility, and applying the single photon detector with high detection efficiency and low dark count, the BER performance of the single-pulse position modulation quantum-enhanced receiver can be improved under practical conditions while saving energy. In future, this approach could also be extended to multipulse position modulation to further determine the effects of practical factors on pulse position modulation at higher code rates. Meanwhile, the development of a suitable feedback strategy to reduce uncertainties in the conditional pulse nulling strategy could reduce the probability of code-word judgment errors.
Jul. 10, 2023Vol. 50 Issue 13 1312001 (2023)
Yong Li, Yinzheng Luo, Qipeng Pu, Mingfei Han, and Feng Shuang
ObjectiveThe quality of tunnel engineering is crucial factor for ensuring traffic operation safety. In this regard, tunnel construction analysis, tunnel deformation monitoring, and tunnel disaster prediction and early warning can be realized by using three-dimensional laser scanner to scan the tunnel regularly or irregularly to generate a point cloud model and then analyze the point cloud data. The segmentation of tunnel wall and target sphere from scanned tunnel laser point cloud scenes is an important part of tunnel 3D reconstruction and is the key technology for realizing the automatic monitoring of tunnel scenes. However, the tunnel 3D point cloud obtained by laser scanning often contains noise points and outliers, a high proportion of which is attributable to the ground points, which are connected with the tunnel wall, in the tunnel point cloud scenes. Direct processing of the tunnel point cloud data affects the extraction and recognition of the target sphere and tunnel wall. Considering the challenge of tunnel ground filtering and the lack of application platforms directly usable to segment the tunnel wall and extract the point cloud of the tunnel target ball, a ground filtering algorithm suitable for tunnel scenes and extraction method of the tunnel wall and target ball are proposed herein.MethodsGiven that extant point cloud filtering algorithms are not suitable for tunnel point cloud scenes, this paper proposes a ground filtering algorithm based on a combination of RANSAC plane fitting and pass-through filtering based on normal evaluation. A normal estimation process is added to the plane based on RANSAC fitting to ensure that the fitting optimal plane model is on the tunnel ground level. Then, the points below the optimal plane level are filtered out in conjunction with the pass-through filtering to obtain the tunnel ground points. Considering that it is challenging to extract the tunnel wall and target sphere, a segmentation method for laser point cloud on the tunnel wall (from coarse to fine) and a target sphere extraction method are proposed herein. First, the region of interest is extracted from the tunnel feature points, and the noise point clusters of the non-tunnel wall are then filtered out based on the DBSCAN method under constraints so as to obtain the tunnel wall model and possible distribution area of the target ball. The DBSCAN fine segmentation of the possible distribution area of the target ball under constraints is performed to obtain the target ball point clusters, and the nonlinear least squares (NLS) fitting is employed to obtain the ball center coordinates and related parameters of the target ball.Results and DiscussionsThis paper also presents the verification of the effectiveness of the proposed ground filtering algorithm and target ball and tunnel wall extraction method in two tunnel scenes. Table 3 indicates that the proposed ground filtering method is superior to the conventional CSF filtering, slope filtering, and ground filtering methods in terms of the regional growth and elevation change for three types of errors, Kappa coefficient values, and time efficiency values. Thus, the effectiveness and advantages of the proposed filtering algorithm in tunnel scenes are demonstrated. Table 3 and Fig.7 (b) show that the Kappa coefficient value of the proposed filtering algorithm is the highest, indicating its high robustness. As indicated by the results of the fusion comparison experiment, as compared to the RANSAC plane fitting, the fusion of normal estimation, pass‐through filtering, and downsampling has a better effect on the ground filtering, and the comprehensive filtering effect is stronger than that of the comparison methods. This paper presents a comparison of the target sphere cluster (DBRTS) obtained by the DBSCAN condition constraint method and the manually intercepted target sphere cluster (Manual) by using ball fitting experiments. The final ball center error and fitting rate verify the effectiveness of the method of obtaining the target sphere and fitting method proposed herein. It is evident from the comparison in Table 4 that among the three target balls, the fitting effect of the proposed method is not as good as that of the NLS fitting. This is because the manually intercepted target ball point cloud retains more target points, and the more the details, the better the fitting effect. However, the proposed method can be employed to automatically obtain the target ball point cloud; this is more applicable and robust than the method of manually intercepting the target ball. Moreover, the spherical center error of DBRTS on the second and third fitting target balls is smaller than that of the NLS fitting method of manually intercepting the target ball; this indicates that the spherical center coordinates of the target ball fitted by this method are closer to the true values. In general, the target sphere point cloud obtained with our method and sphere fitting method proposed in this paper have evident advantages and are applicable in tunnel point cloud scenes.ConclusionsConsidering the 3D point cloud data of tunnel scenes as the research object, this paper first proposes a ground filtering algorithm that entails a combination of the RANSAC plane fitting method based on normal evaluation and pass‐through filtering. This method dynamically adjusts the threshold according to the point cloud scene and realizes adaptive filtering, which has good applicability and robustness. Second, a target sphere and tunnel wall extraction scheme based on DBSCAN constraint conditions and NLS sphere fitting is also proposed. The clustering segmentation is mainly realized using the density property of point cloud. The tunnel wall and target sphere point clusters are extracted by filtering the noise point clusters in the tunnel by standardizing the constraint conditions, and the relevant parameters and distribution are then obtained by fitting the target sphere point clusters based on the NLS sphere. The target sphere point cloud obtained by this method is compared with the manually intercepted target sphere point cloud. The experimental results indicate the effectiveness of this method and also highlight the advantages of the NLS sphere fitting, which completed the target sphere extraction task in tunnel scenes. Although the proposed algorithm achieves good results, a few deficiencies still exist. For example, regarding large-scale laser point cloud scenes, adoption of DBSCAN clustering segmentation is time-consuming, and some methods to improve the efficiency of clustering optimization algorithm can be studied in the future.
Jul. 10, 2023Vol. 50 Issue 13 1310001 (2023)
Cheng Zhang, Xuehui Ma, Junfa Zhao, Zhenqian Shen, Jixuan Wu, and Jing Yang
ObjectiveOptical fiber sensing technology has attracted attention because of its high sensitivity, corrosion resistance, immunity to electromagnetic interference, small size, and wide measurement bandwidth. Temperature plays a significant role in daily life and various applications; particularly, the controllability and accuracy of temperature sensitivity in biological protein activity and medical experiments are essential. Among them, the method of increasing temperature sensitivity through the vernier effect is widely used in optical fiber sensors. The optical vernier effect can be achieved using a sensing interferometer and a reference interferometer. The reference interferometer, which is not sensitive to temperature, provides a 'calibration master ruler' to the sensing interferometer based on the optical vernier effect, thereby amplifying the temperature sensitivity, as opposed to using a single sensing interferometer. However, the instability of the interferometer can result in measurement errors. Therefore, this study proposes using a virtual reference interferometer for achieving a sensitivity-tunable optical vernier effect to increase the temperature sensitivity. This method is applied to the Fabry-Perot (FP) temperature sensor based on UV glue, and the sensitization effect of its temperature sensitivity is verified through experiments. Subsequently, the feasibility of realizing the increase of temperature sensitivity is demonstrated.MethodsTheoretically, the principle of the vernier effect sensitization is derived from the interference formula. Therefore, the amplification of the vernier envelope is simulated by changing the cavity length of the sensing interferometer or that of the reference interferometer. It is verified that the increase in sensitivity can be achieved using the virtual vernier interferometer, and this sensitivity can be regulated by changing the cavity length. Experimentally, the FP temperature sensor is fabricated by inserting a tapered optical fiber into a capillary tube with UV glue. The UV glue expands and contracts at different temperatures, resulting in a change in the cavity length and a drift in the superimposed spectrum. In the experiment, various temperature sensitivities are controlled by changing the cavity length of the reference interferometer. The feasibility of the scheme is verified.Results and DiscussionsBased on the principle of increased sensitivity based on the vernier effect, when the cavity length of the sensing interferometer or reference interferometer is changed, the superimposed vernier interference envelope spectrum achieves a certain multiple of sensitivity amplification, compared to that achieved using single FP sensing interferometer. Subsequently, by the spectral simulation of the double cavity length, it is deduced that when the free spectral range of the sensing interferometer is larger than that of the reference interferometer, the cavity length of the sensing interferometer decreases with increasing temperature, and the spectrum moves to the left drift, whereas the interference spectral envelope drifts to the left. When the free spectral range of the sensing interferometer is smaller than that of the reference interferometer, the cavity length of the sensing interferometer decreases with increasing temperature and the spectrum shifts to the left, whereas the interference spectral envelope shifts to the right (Figs. 3 and 4). Therefore, the temperature sensitivity can be controlled by introducing reference interferometers with different cavity lengths without changing the sensing interferometer. In the experiment, according to the theoretical formula, the cavity lengths of the relevant reference interferometers are set as 180, 160, 150, 144, and 140 μm, respectively, and their temperature sensitivities are 4.018, 6.021, 8.009, 10.033, and 12.096. It is inferred through experiments that, compared with the single sensing interferometer with a temperature sensitivity of 2.015 nm/℃, the FP temperature sensor based on the virtual vernier achieves 2-6 times temperature sensitivities, which is consistent with the results obtained by the FP temperature sensor theoretically (Figs. 9-13).ConclusionsIn this study, the temperature sensitivity regulation of the FP sensor is realized using the sensitization method of the optical vernier based on a virtual reference interferometer. The envelope drift simulations of the superimposed spectra with different double cavity lengths are conducted according to the amplification principle of the vernier envelope obtained from the sensing formula. In the experiment, when the cavity length of the virtual reference interferometer is changed, the control of different temperature sensitivities ranging from 2-6 times is realized, thereby verifying that the sensitization scheme of the optical vernier is feasible. This virtual simulation method not only avoids the influence of the external environment on the reference interferometer during the measurement process but also effectively increases the temperature sensitivity. This method does not require additional modification of the interferometer and can be applied to other interferometric fiber optic sensors; it has significant potential for the enhancement of existing fiber optic sensor networks.
Jul. 10, 2023Vol. 50 Issue 13 1310002 (2023)
Hengkang Zhang, Li Wang, Shaogang Guo, and Lin Li
ObjectiveFrequency-modulated continuous-wave (FMCW) lidar has the ability to measure ranges and velocities of moving targets simultaneously with high precision, and thus it has great potential in numerous applications such as space debris detection and space situational awareness. The conventional measuring method is to perform fast Fourier transform (FFT) to the intermediate frequency signal, and then the peak-value frequency is used as the intermediate frequency to calculate the target range and velocity. However, this method cannot achieve high-precision measurement of high-speed targets. The high-speed movements of targets could cause spectral broadening of the intermediate frequency signal, resulting in a multi-peak spectral structure. Therefore, it is difficult to accurately find the intermediate frequency, especially in noisy environments, which has a serious impact on the measurement precision. To deal with this problem, a new spectrum analysis method is desired. In this paper, we propose a novel algorithm for calculating intermediate frequency based on self-convolution of the spectrum. By conducting numerical simulations, we verify the ability of the proposed algorithm in correcting measurement error induced by spectral broadening and realizing high-precision measurements of the target range and velocity. Meanwhile, it has small computation, strong anti-noise ability and broad application prospect. Therefore, it is of great significance for promoting the applications of FMCW lidar in space technologies.MethodsA novel algorithm (Fig. 3) is proposed to correct the measurement error caused by high-speed-movement-induced spectral broadening of the intermediate frequency signal, and its validity is verified by numerical simulation. With a theoretical analysis, we find that the intermediate frequency spectrum of FMCW lidar when measuring high-speed targets has the symmetry characteristics, and its center frequency has a certain relationship with target range and velocity. Therefore, as long as the center frequency is known, the target range and velocity can be calculated. We utilize the following algorithm to calculate the center frequency. First, we calculate the self-convolution of the amplitude of the intermediate frequency spectrum, Fn(f). Then we search the peak value of the self-convolution function O(f) and its position. O(f) is calculated by integrating the product of Fn(f) and its shifted mirror image, and O(f) takes its peak value only when Fn(f) overlaps its mirror image completely, since Fn(f) is symmetric. Hence, with the position of the peak value of O(f), we can obtain the center frequency of Fn(f). Utilizing this algorithm, we simulate single-target measurement and multi-target measurement with a model of double-sideband FMCW lidar.Results and DiscussionsWe first conduct numerical simulations of single-target measurement, where the target velocity is 5 km/s and the signal‐to-noise ratio (SNR) is set to be 10, 5 and 1, respectively. The results show that the proposed method can realize accurate measurement of the target range and velocity, and the measurement precision decreases with the decrease of the SNR (Fig. 7). With the SNR of 1, the random errors of the target range and velocity are 421.48 μm (1σ) and 65.19 μm/s (1σ), respectively. As a contrast, we also conduct a simulation with the traditional method, where the peak-value frequency of the intermediate frequency spectrum is used to calculate the target range, and the SNR is set to be 10. Compared with the traditional method, our method can improve the measurement precision by more than three orders of magnitude under the same SNR (Fig. 5). This shows that our method can effectively correct the measurement error caused by the high-speed movement of the target. Moreover, we also conduct a numerical simulation of multi-target measurement (Table 2). The results show that the proposed method can realize accurate range and velocity measurements of multiple targets (Fig. 8).ConclusionsIn this paper, the measurement of high-speed targets with FMCW lidar is studied. A novel algorithm for analyzing the intermediate frequency spectrum is proposed to correct the measurement error caused by high-speed-movement-induced spectral broadening of the intermediate frequency signal. Firstly, with theoretical analysis, we derive the theoretical expression of the intermediate frequency spectrum, and we study the variation of the intermediate frequency spectral structure with the increase of target velocity. Based on the symmetry characteristics of the intermediate frequency spectrum, the center frequency of the spectrum can be found by searching the peak value of the self-convolution function of the spectrum amplitude. With this algorithm applied to the double-sideband FMCW lidar, the target distance and velocity can be calculated. Then, the validity of the theoretical analysis and the effectiveness of the algorithm in correcting the measurement error of high-speed targets are verified by numerical simulation. Compared with the traditional method, the proposed method can improve the measurement precision by more than three orders of magnitude under the same SNR. The advantages of the proposed method also include the small computation burden and strong anti-noise ability. The research work in this paper provides a feasible approach for high-precision range and velocity measurement of high-speed targets, and we believe it will promote the application of FMCW lidar in space technologies.
Jul. 10, 2023Vol. 50 Issue 13 1310003 (2023)
Jian Huang, and Gongchang Wang
ObjectiveSodium laser guide star (LGS) adaptive optics (AO) mitigates the aberrations induced by atmospheric turbulence to achieve a near diffraction limited image, and acts as an essential setup for large ground-based optical telescopes. Unfortunately, the classical AO system with a single sodium LGS achieves good resolution within a field of view (FOV) smaller than several arcseconds in the visible wavelength range, which severely limits the application of AO system for observations of more objects. In order to increase the FOV, multi-conjugated adaptive optics (MCAO) was proposed. In MCAO, the atmosphere turbulence is sensed by sodium LGSs in different sights with independent wavefront sensors respectively, then a three-dimensional map of the atmosphere is reconstructed by tomography, and finally, the turbulence at different altitudes are compensated by a series of deformable mirrors. To enhance the performance of the MCAO, it is usually necessary to optimize the conjugated heights and number of deformable mirrors (DMs), enhance the photon return of the LGSs, and so on. However, the number and configuration of the sodium LGSs are the main factors which can affect the tomography performance of the MCAO system. In our study, we report a method to optimize the number and configuration of the LGSs to maximize the tomography performance and uniformity within the FOV. We hope this work will be of guiding significance to the engineers of AO systems.MethodsIn order to study the influence of sodium LGS constellation on the atmosphere turbulence tomography performance of the MCAO, for a 10 m diameter telescope with a FOV of 1′, an atmosphere model for Lijiang Gaomeigu [median value of Fried parameter (r0) is 8 cm at a wavelength of 550 nm] with a two-layer MCAO system is established, with the two layers located at 0 km and 8 km. The projection matrix for three sodium LGSs equispaced at the edge of the FOV can be calculated. Then, the LGSs are seen by three 25×25 Shack-Hartmann wavefront sensors independently to compute the MCAO high-order correction. At last, tomography is performed for the two turbulent layers. The research is numerically studied by using the OOMAO simulation platform. The Strehl ratio (SR) map at H band in the FOV is obtained, as shown in Fig. 4. The mean value of SR, RSˉ, and the normalized standard deviation (STD) of the SR map are used to evaluate the tomography performance and uniformity of the MCAO.Results and DiscussionsFor the three sodium LGSs equispaced at the edge of the FOV, the simulation results show that the reconstructed wavefront at the ground layer is more accurate than that at the high layer. The reason is that the footprint from each LGS illuminates only a portion of the meta-pupil at the high layer, while the footprint and the meta-pupil are equal at the ground layer. Meanwhile, the maximum SR along the sight of LGS reaches 0.69, and the minimum SR 0.45 appears at the intersection of two LGS sights. At the same time, the performance evolution of 500 frame images for the MCAO system tomography with three sodium LGSs during 1 s is simulated. The mean values of SR and STD are 0.42 and 0.226, respectively.Then, the turbulence tomography is performed for 3-6 sodium LGSs located at the vertices of regular polygons or the vertices combined with the center of FOV (Fig. 7), and the influence of the zenith angle of the regular polygons is also analyzed. Under the condition that the zenith angle is 41.459″, the maximum value of RSˉ is 0.53 for the configurations of 3+1 and 5+1 LGSs. For all configurations of the constellations, the values of STD in the FOV range from 0.22 to 0.23. For the zenith angles ranging from 6″ to 41.459″, the performance of three LGSs located at the vertices of a triangle reaches the optimum when the zenith angle is half of the FOV. For other constellations, the SR is improved from 0.4 to 0.55 with the increase of the zenith angle (Fig. 9) and the STD is decreased when the zenith angle is increased (Fig. 10).ConclusionsIn our study, for a MCAO with several LGSs, the SR reaches the maximum along the sight of LGS while the minimum appears at the intersection of two LGS sights. For the FOV of 1′, the turbulence can be detected comprehensively by the constellation of 3+1 LGSs with a large zenith angle of the regular polygons. For the zenith angle of the regular polygons less than half of the FOV, the SR reaches the maximum with the constellation pattern of 4 LGSs, while for the zenith angle larger than half of the FOV, the optimal performance is reached with the constellation configuration of 5+1 LGSs. For all the configurations of constellations, the uniformity is improved with the increase of the zenith angle, and for the configuration of constellation of 4 LGSs, a preferable uniformity can be obtained.
Jul. 10, 2023Vol. 50 Issue 13 1310004 (2023)
Xinqi Zhu, Pei Zhang, Guanghui Wang, Shuanghong Chen, Jianping Zhang, Jing Zhu, and Huijie Huang
ObjectiveBiological aerosols include viruses, bacteria and related agglomerates, as well as fungi, pollen, plant and animal debris. The diffusion of bioaerosol particles will seriously affect the development of agriculture and the health of animals and human beings, and even water circulation and climate. In recent years, using laser-induced intrinsic fluorescence, researchers have constructed various optical instruments to enable real-time monitoring of particulate matter in the air. The carefully designed devices use multiple excitation wavelengths and fluorescence channels, so they enable aerosol identification with multiple parameters, but exhibit drawbacks of high cost and bulky appearance. As for portable devices, there is usually a single-wavelength excitation light source to excite the fluorescence signal, and the discrimination between fluorescent and non-fluorescent particles is achieved in most devices. However, it is still a challenge to achieve discrimination between different bioaerosol types with portable devices. In our previous work, we developed a fluorescent particle counter and there was a great linear consistency between the number of fluorescent particles measured by the counter and the number of bacteria measured by the culture method. In the practical application of this counter, some fluorescent interfering particles in air possibly trigger false alarms. In this work, we propose a method for preliminary differentiation of aerosol particle types based on normalized fluorescence, and apply it to the fluorescent particle counter, which will effectively reduce the false alarm rate of the instrument while monitoring biological aerosols.MethodsWe designed a fluorescent particle counter with a 405 nm laser diode as the light source and lens group to collimate and focus the excitation light beam. The optical axis of the excitation light path is perpendicular to the optical axis of the fluorescence receiving light path, and there is a photosensitive zone near their intersection. The airflow brings the aerosol particles to the photosensitive zone. The laser light will be scattered by the particles to produce elastic scattered light, and there will also be intrinsic fluorescence excited with biological particles. The scattered light is separated from the fluorescence using a dichroic mirror and received by two photomultiplier tubes (PMTs). The ratio of the fluorescence pulse amplitude of each particle signal to its corresponding scattered light pulse amplitude is calculated to obtain the normalized fluorescence value (Fig. 2).Results and DiscussionsPolystyrene latex (PSL) microspheres, phosphate buffer solution (PBS), and fluorescent microspheres were used as detection objects to evaluate the instrument’s ability to classify fluorescent and non-fluorescent particles. From the experimental results, we found that there are almost no fluorescent particles in PSL microspheres and PBS, and the proportion of fluorescent particles in the total number of particles tends to be close to 0, while the fluorescent microspheres exhibit fluorescent particles with >84% of the total number of particles (Table 1). Therefore, the instrument can effectively distinguish between fluorescent and non-fluorescent particles. Seven samples including Bacillus subtilis, Escherichia coli, riboflavin, B800 fluorescent microspheres, cigarette smoke, vehicle exhaust, and general office ambient air, were tested using the instrument, and the results of 12 groups of samples with different concentrations were recorded. The normalized fluorescence values of each group of fluorescence-scattering pulses were calculated and divided into four intervals, and the number of fluorescent particles in each interval and their proportions to the total fluorescent particles were calculated. The results show that the fluorescence particle numbers of different kinds of aerosol samples have different distributions in the four intervals, so the classification of aerosols can be achieved by detecting and calculating the normalized fluorescence values of each sample (Fig. 3). The obtained fluorescence particle numbers of the different samples within the four intervals were visualized using principal component analysis (PCA). With a summed contribution of 75.32%, the first two principal components (PC1 and PC2) of different aerosol samples already contain most of the information and show a good clustering effect on the graph (Fig. 4). The classification results could be more visually presented with three-dimensional score plot (Fig. 5).ConclusionsIn this paper, we proposed a method to classify aerosol particles using normalized fluorescence signals, which was applied to a fluorescent particle counter with a 405 nm laser diode as the excitation light source, allowing preliminary classification of different aerosol particles such as bacteria, riboflavin, cigarette smoke, vehicle exhaust, and fluorescent microspheres. The normalized values of the fluorescence signals of individual particles on the corresponding scattered light signals were divided into four intervals and counted in each of the four intervals. The experimental results were visualized using PCA. This method can be applied to the identification and early warning of microbial particles, and reduce the interference of non-biological fluorescent particles in the environment.
Jul. 10, 2023Vol. 50 Issue 13 1310005 (2023)
CO Volume Fraction Measurement Based on Wavelength Modulated Cavity-Enhanced Absorption Spectroscopy
Xuan Wang, Guangzhen Gao, Fangyu Long, Yubing Yang, and Tingdong Cai
ObjectiveBased on cavity-enhanced absorption spectroscopy (CEAS) and wavelength modulated spectroscopy (WMS) technology, a cavity-enhanced spectrum measurement system was built to measure the volume fraction of CO gas. In an experiment, a distributed feedback laser (DFB) laser with a central wavelength of 2.3 μm was used as the light source, and an optical cavity with a base length of 30 cm was constructed with two highly reflective mirrors with a reflectivity of 99.8%. An effective absorption path of 147.15 m was achieved. On this basis, CO was detected using the CO absorption spectral line at 4297.705 cm-1 as the sensing target. In the experiment, the measurement accuracy of the system was verified using CO and N2 gas mixtures with different volume fractions of CO. The measured value was consistent with the reference value, and the measurement error was approximately 0.2%, which confirmed the measurement accuracy of the system. The detection limit of the system was analyzed using the second harmonic signal of CO gas with a volume fraction of 3×10⁻⁶, and the lowest detectable CO volume fraction with the system was 138×10-9.MethodsThe optical cavity in the sealed box was composed of two highly reflective mirrors. The length of the cavity was 30 cm, diameter of the highly reflective mirrors specified by the manufacturer was 25.4 mm, and radius of curvature was 1 m. Their reflectivity reached 99.8% in a wavelength range of 1.9-2.3 μm. In the experiment, the laser output from the 2.3 μm DFB laser was divided into two parts using a fiber beam splitter. One part was passed through an oscilloscope (Bristol 671) to obtain the real-time scanning output wavelength of the laser, and the other part passed through the sealed box made of tempered glass. The laser beam entered the optical cavity through the sealed box. Then, after multiple reflections in the cavity, it was transmitted from the other end and converged in the InGaAs detector through a lens with focal length of 5 mm for detection. After the detector signal was sent to the input port of a lock-in amplifier, it demodulated the signal according to the specific setting parameters. The demodulated signal was collected by a data acquisition card (National Instruments USB-6361) and stored in the computer for subsequent data processing. A triangle wave with a frequency of 2 Hz generated by a function generator and a sine wave with a frequency of 880 Hz generated by a phase-locked amplifier were superimposed together by an adder, and the superimposed signal was sent to the laser controller to achieve scanning and modulation of the laser wavelength.Results and DiscussionsThe experiment was carried out under the fixed conditions of 101325 Pa and 300 K, and the second harmonic (2f) signals of different volume fractions of CO were measured. The 2f signals of CO with volume fraction of 3×10⁻⁶, 10×10-6, 30×10-6, and 50×10-6 are shown in Fig. 5. Figure 6 shows the linear relationship between the peak height of the 2f signal of each volume fraction of CO and the volume fraction. The fitting results show that the linearity, R2, between the data points was 0.998, while the relative standard deviation was 0.34%. It can be seen that the two maintained a good linear relationship within the volume fraction range measured in the experiment.In this study, the measured CO volume fraction was compared with the known reference value during the gas distribution. This comparison is shown in Fig. 7. The linearity, R2, between the data points in the figure was 0.998, which shows that the measured CO volume fraction was consistent with the reference value, and there was a good linear relationship between them. The red line in the figure was obtained by the linear fitting of the scatter plots. The slope of the fitting line was 1.00282 ± 0.02261. It can be seen that the measurement accuracy of the experimental system was maintained at approximately 0.2%, which confirmed that the measurement of the experimental system had high accuracy.The system was used to conduct a 500 s time series measurement of CO gas with a volume fraction of 3×10⁻⁶. Each data sampling time was 1 s. Thus, a total of 500 volume fraction points of CO gas were obtained, as shown in Fig. 8 (a). Figure 8 (b) shows the histogram distribution of the 500 data points. The histogram shows a good Gaussian distribution, and the half-height width (HWHM) of the curve could be used to evaluate the measurement accuracy of the system. The results show that the CO volume fraction measurement accuracy of the system was 286×10-9. The Allan variance was used to analyze the detection sensitivity of the system under the environmental conditions of a temperature of 300 K and pressure of 101325 Pa, as shown in Fig. 9. It can be seen from the figure that when the system time was approximately 1850 s, the Allan variance was the lowest, which meant that this time was the best detection time for the system, and the detection limit at this time could reach 138×10-9. Before the optimal detection time of 1850 s, the Allan variance of the system was higher than the minimum detection limit, which was due to the influence of the white noise of the system. The noise after this was mainly caused by the instability of the system. Therefore, when measuring a stable flow field, the noise could be reduced and the measurement accuracy could be improved by averaging the collected data for many measurements within a period of 1850 s.ConclusionsThe CO absorption spectrum line at 4297.705 cm-1 was selected in the experiment. Based on cavity-enhanced absorption spectroscopy (CEAS) technology, combined with wavelength modulated spectroscopy (WMS) technology, a cavity-enhanced spectrum measurement system was built with a self-made sealed box. The reflectivity of the cavity mirror at 2.3 μm was calibrated to be 99.8%, which was consistent with the data given by the manufacturer. At the same time, the effective absorption optical path of the system was calibrated to be 147.15 m, and the optimal modulation amplitude was determined to be 360 mV. During the experiment, a DFB laser with a central wavelength of 2.3 μm was used as the light source. Under the conditions of 101325 Pa and 300 K, the linear relationship between the peak height of the 2f signal of each each volume fraction of CO and the volume fraction was obtained by measuring the 2f signals of the CO with different volume fractions prepared using the CO and N2 mixture gas, and a good linear relationship between the two was determined within the measured volume fraction range. Finally, the CO volume fraction measured by the system was compared with the known value during the gas distribution, and the measurement error was approximately 0.2%, which verified the reliability and accuracy of the system.
Jul. 10, 2023Vol. 50 Issue 13 1311001 (2023)
Daoming You, Manqing Tan, Xiaofeng Guo, Wentao Guo, Yingchun Cao, and Wenbin Chen
ObjectiveThe ripple index is one of the most crucial parameters of superluminescent diodes (SLDs). A low ripple index is necessary for the application of SLDs in sensing areas such as fiber-optic gyroscopes. Therefore, reduced reflectivity of the facet is required, and the main strategy involves coating with antireflective (AR) films. The reflectivity of the AR films is generally less than 0.1%, which is a strict requirement. Although the AR film designed using the plane wave method (PWM) is widely used, its performance in SLDs is not ideal, and the actual reflectivity deviates from the design value. Therefore, the purpose of this study is to design and fabricate AR films for SLDs that can effectively reduce the ripple index.MethodsThe first part is the simulation method. The finite difference time domain (FDTD) method is used to analyze the optical properties of the films, and a perfect matching layer (PML) is used as the boundary condition. In addition, to reduce the resource requirements of the FDTD method, a simplified simulation model is used, which highlights the main influencing factors. To optimize the films, parameters such as film thickness and refractive index are scanned by FDTD method to determine the parameter range of low reflectivity, and the particle swarm algorithm is used to obtain the optimal parameters within this range. For the coating process, the optical film is manufactured by reactive magnetron sputtering, and an AR ion beam assists the coating process. In addition, the film thickness is monitored and controlled online using a crystal oscillator control system. Reflectivity measurement of thin films is important, including direct measurement of the accompanying films and indirect measurement of the facet of the SLD. The SLD is indirectly measured by spectral ripple, which is also the mainstream reflectivity measurement method for other semiconductor optoelectronic devices.Results and DiscussionsThe simulation results show that the design of the PWM film faces many problems. For the single-layer and double-layer AR films, the reflection curve becomes blue-shifted, and the shift exceeds 150 nm. In addition, the reflectivity is more than one order of magnitude higher than the designed value, and the deviation is further enlarged at a large angle. Therefore, the AR film designed by PWM does not meet the requirements and cannot be used for SLD. To solve these issues, the optical film is optimized. For single-layer AR films, the average reflectivity is less than 0.11% and the lowest reflectivity is 0.04%. The optimized design of the double-layer film provides better results: the average reflectivity is less than 0.05% and the lowest reflectivity is only 0.01%. The optimized design effectively reduces the reflectivity, particularly for the optimized double-layer AR film, which has evident advantages over the film designed by PWM.The double-layer AR films are prepared by reactive magnetron sputtering. After optimization, the reflectivity of the AR film on the companion substrate is 0.12%, and the low-reflectivity bandwidth is greater than 200 nm, which verifies the coating process. The design and measurement curves do not fit because the size and structure of the companion substrate are different from those of the SLD. The reflectivity of the AR film on the SLD is indirectly measured. After optimization, the average reflectivity of the AR film decreases by 50%, indicating that the optimized design effectively reduces the reflectivity. The spectrum of the SLD shows that the intensity and number of ripples are clearly reduced, and the average ripple index is only 0.019, which is 44.5% of that before optimization. The average modulation index decreases from 4.79×10⁻³ to 2.30×10⁻³, a decrease of more than 50%. In addition, under a driving current of 100 mA, the output power of the SLD chips remains above 10 mW, maintaining a high output power and high efficiency.ConclusionsIn this study, the AR film designed by the PWM is analyzed, particularly its poor performance in inclined-cavity SLD. The FDTD method is used to analyze and determine the deviation of the reflection curve and high reflectivity. Therefore, the AR film design is optimized and the film is coated by reactive magnetron sputtering; this is verified by reflectivity and spectrum measurements. After optimization, the average reflectivity of the double-layer AR film is controlled within 0.1% and the lowest value is only 0.05%. The AR film effectively suppresses the ripple, and the ripple and modulation index are only 0.019 dB and 2.30×10⁻³, respectively, with a decrease of more than 50% compared with those of the traditional PWM film. The prepared SLD chips still maintain a 10-mW output power under a current of 100 mA. The AR film developed in this study can effectively reduce the reflectivity of the facet, and the fabricated weak-ripple SLD is prepared by using the film. The research results provide a reference for the development of optical films of SLD and other semiconductor optoelectronic devices.
Jul. 10, 2023Vol. 50 Issue 13 1303101 (2023)
Yanhe Chang, Xiuhua Fu, Gong Zhang, Jing Zhang, Chun Li, and Shigeng Song
ObjectiveGREGOR is an assembled solar telescope with 1.5 m diameter that is designed for high-precision measurements of the magnetic field and gas motion in the solar photosphere and chromosphere with a resolution of 70 km on the sun and high-resolution stellar spectroscopy. To meet the specific requirements of measurement using the GREGOR telescope system, the surfaces of the lenses need to be modified using interference coatings. These coatings form the optical filters required to achieve the rejection bands at the specific wavelength ranges originating from fluorescence. Therefore, a multi-notch filter covering visible light with high transmittance for passbands and high optical density for rejection bands is designed and fabricated to improve the signal-to-noise ratio, where the noise signals are rejected.MethodsIn this design, two materials with high and low refractive indices are employed and the ripples in the passband regions are suppressed by modulating the layer thicknesses of the layer stacks with high order apodization functions. As the full width at half maximum (FWHM) and central wavelength of the multi-rejection bands are also specified, high-order iteration algorithms are used to insert and adjust modulating layers to achieve the desired merit functions. This realizes the global search for a multi-band notch filter with effective ripple suppression. The designed multi-notch filters are then fabricated on B270 substrates using ion-beam-assisted reactive magnetron sputtering deposition. Optical monitoring and time control methods are used to control the thickness of the non-quarter wavelength optical thickness (QWOT) layers. The trigger point of the deposition of each layer can be determined using the turning points of the QWOT if the thicknesses are larger than the QWOT, whereas the trigger point of the deposition of each layer is determined by time using the average deposition rate for thicknesses less than the QWOT. The errors in the layer thickness can be automatically compensated by the optical monitoring method. By changing the number and position of the test glass, multi-rejection notch filters with improved spectral performance are fabricated.Results and DiscussionsThe measurement results of the fabricated muti-band notch filter demonstrate good agreement with the designed spectra, thus proving the feasibility of the fabrication process (Fig. 5). Considering the high number of layers in the stack for the filter, gradient temperature annealing is performed at 200 ℃. This reduces the stress from -233 MPa to -89 MPa, indicating that relaxation of the internal stress can be achieved by the annealing method. The filter deposition method where the substrates rotate at high speeds and the masks are optimized after multi-iterations enables improvements in the fabrication of filters and results in a higher thickness uniformity (Fig. 6). From the above results, we demonstrate a design for a multi-notch filter with a narrow high-rejection band, where the sidelobes can be strongly suppressed by apodization. Fabricating a multi-notch filter is always a challenge, with difficulties in the accurate control of the index of refraction and thickness of each layer during deposition. The accuracy in the layers affects the steepness at the reflecting band edges and the high transmittance in the passband, resulting in high requirements in the accuracy of the index and thickness control. The advantage of this design approach is that the layer thicknesses are all close to the half wave length at the central rejection wavelength and therefore are very suitable for accurate monitoring during deposition. These coatings are produced by ion-beam-assisted reactive magnetron sputtering deposition technology with a high deposition rate and low stress.ConclusionsThe apodization thickness modulated design method presented in this work generates notch filter designs with strongly suppressed ripples in the transmission regions and high optical density for the rejection bands. The total layer number of the multi-notch filter is 190 and the total filter thickness is approximately 20 μm. The good performance multi-notch filter is deposited successfully. The multi-notch filter is prepared by ion-beam-assisted reactive magnetron sputtering on B270. Optical monitoring and time control methods are utilized to monitor the non-quarter thickness. The average transmittance in the passbands of the fabricated multi-notch filter is higher than 90%, the cut-off depth for the rejection bands is better than 0.1%, the full width at half maximum of the rejection bands is less than 24 nm, and the maximum deviation of the band position is 2 nm. This indicates the fabricated multi-notch filter with excellent performance and high production yield meets the specified requirements for the GREGOR telescope application.
Jul. 10, 2023Vol. 50 Issue 13 1303102 (2023)
© Copyright 2018-2021 | Chinese Laser Press.
All Rights Reserved 沪ICP备15018463号-20