


Please enter the answer below before you can view the full text.

Zhibing Xu, Jinjin Wu, Lu Ding, Zihan Wang, Suwei Zhou, Hui Shang, Huijie Wang, and Jianhua Yin
ObjectiveBreast cancer has been the most common life-threatening cancer of women in recent years. Both diagnostic imaging and pathology are routinely employed to diagnose breast cancer, while the latter is considered the "gold standard" for cancer diagnosis. In clinical practice, however, the routine pathological diagnosis is strongly hindered by the complicated and time-consuming process of staining the biopsy sections with hematoxylin and eosin (H&E) for highlighting the fine structures of cells and tissues. Moreover, the diagnosis is manually performed by pathologists, therefore the diagnostic speed and accuracy are highly dependent on their knowledge and experience. In order to better serve the treatment of breast cancer, the pathological diagnosis is greatly expected to be accelerated and automated, especially providing the efficient intraoperative assessment for precision surgical therapy. In this study, a rapid, accurate and automatic diagnostic technique of breast cancer is proposed based on the polarization and bright-field multimodal microscopic imaging. To accelerate the pathological diagnosis, the breast biopsy sections are directly investigated without the H&E staining, while the cell structures are no longer distinct under the bright-field microscopic imaging. In this case, the polarization microscopic imaging is introduced to further extract the morphological difference between the normal and cancerous breast tissues. Collagen fiber is an important part of the extracellular matrix (ECM), and the organization of collagen fibers has been found to be closely related with the cancer progression. Due to the inherent optical anisotropy, collagen fibers can be examined by cross-polarization imaging. To perform the automatic diagnosis, deep learning is employed to distinguish the normal and cancerous breast tissues, where the convolutional neural network (CNN) classification model is established to extract features from the multimodal microscopic images and make the accurate and reliable judgements.MethodsIn this study, 23 breast biopsies from 16 patients were first rapidly frozen in liquid nitrogen and cut into sections with the thickness of 15 μm using a cryotome. Without the H&E staining, the bright-field microscopic imaging and polarization microscopic imaging were sequentially performed through switching the light source, polarizer and analyzer of the custom-made transmission polarization microscope. The polarization microscopic imaging was operated in the cross-polarization mode, where the polarizer was orthogonal to the analyzer. Since the period of cross-polarization imaging is 90°, the polarizer-analyzer pair was rotated by 0°, 30° and 60° to characterize the biopsy sections. Following the microscopic imaging, the pixel-level image fusion was conducted to transform the four multimodal images into a single fused image for breast cancer diagnosis. In order to perform the deep learning-assisted automatic diagnosis, the classical CNN ResNet34 was utilized to develop a classification model, whose input is the pixel-level fused image. In addition to the pixel-level fusion, the decision-level fusion was also examined for comparison, where two classification models were created based on the bright-field and polarization microscopic imaging, respectively. In this way, the final classification result was generated according to the weight coefficients determined using the logistic regression algorithm. To evaluate the performance of CNN classification model, four parameters including accuracy, sensitivity, specificity and AUC [area under receiver operating characteristic (ROC) curve] were calculated. Due to the rather small amount of breast biopsies, the leave-one-out cross validation was performed in order to avoid overfitting.Results and DiscussionsThe cross-polarization microscopic imaging of normal breast tissues exhibits the distinct periodic change in the brightness with the rotation of the polarizer-analyzer pair from 0° to 90°, while that of cancerous breast tissues is almost unchanged (Fig. 3). This polarization-sensitive brightness change results from the anisotropic organization of collagen fibers in the normal breast tissues, which alters during the cancer progression. Further, the classification result of the multi-polarization imaging is better than that of the single-polarization imaging (Table 1). Following the pixel-level fusion of multimodal images, the CNN classification model based on ResNet34 was established. As a result, the accuracy of 0.8727 and AUC of 0.9400 were realized, better than bright-field (0.8540, 0.9013) and polarization (0.8575, 0.9307) microscopic imaging, respectively (Table 2). In addition, the decision-level fusion was also evaluated, achieving the accuracy of 0.8710 and AUC of 0.9367. The weight coefficients of bright-field and polarization imaging were calculated to be 0.3971 and 0.6029, respectively.ConclusionsA deep learning-assisted multimodal microscopic imaging technique is proposed for the rapid, accurate and automatic diagnosis of breast cancer, combining bright-field and cross-polarization microscopic imaging. In this scheme, the time-consuming process of H&E staining can be removed to accelerate the breast cancer diagnosis, and the automatic diagnosis can be performed with the CNN classification model. Moreover, the accurate diagnosis can be realized, since the cross-polarization microscopic imaging can further extract the polarization-sensitive morphological change closely related with the cancer progression, such as the organization of the optically anisotropic collagen fibers. In this sense, the multimodal microscopic imaging diagnosis has great potential to better serve the surgical treatment of breast cancer with the efficient intraoperative assessment.
Jan. 01, 1900Vol. 49 Issue 24 2407102 (2022)
Congcong Zhou, X. Steve Yao, Ya Su, Peng Hao, Shengwei Cui, Yifei Liu, and Song He
ObjectiveDiabetes is one of the major diseases affecting human health. Patients are required to monitor and control their blood glucose concentration continuously to prevent complications. Compared with traditional invasive methods, optical noninvasive blood glucose detection greatly reduces the pain of blood collection for patients and controls blood glucose more accurately by increasing the number of measurements. Recently, the noninvasive blood glucose detection method using optical coherence tomography (OCT) has become a technology with great development potential. However, the acquired three-dimensional images in skin areas are inconsistent in spatial range during the image acquisition due to the slight involuntary shaking of the subject, affecting the accuracy of the noninvasive blood glucose measurement. To solve this problem, we propose a skin three-dimensional image correction and compensation method based on OCT noninvasive blood glucose detection.MethodsThe deviation of the 3D OCT image collected during noninvasive blood glucose detection is corrected and compensated using an algorithm. First, we study the influence of image deviation on experimental data using theoretical analysis. In the experiment, the skin area is roughly positioned by pasting a square positioning label on the skin surface. Due to the uneven border of the positioning and the involuntary movement of the arm when collecting images, a deviation is observed in the image of the extracted skin area, leading to errors in the calibration and prediction results. The image of the skin area is extracted using morphological erosion expansion, then the image boundary is smoothed and the skin surface is aligned. After the template is determined by selecting the central area of the collected skin image, the compensation algorithm is used to gradually match the template with the skin area images involved in the subsequent blood glucose calculation and perform correction and compensation to ensure consistency in the skin area. We compare the data before and after compensation by the human blood glucose experiments. Furthermore, we compare the predicted results before and after compensation, such as the standard deviation of the actual and predicted blood glucose concentration, correlation coefficient, and other parameters, to validate the compensation algorithm.Results and DiscussionsIn this paper, the deviation of the skin image data is corrected using a compensation algorithm. Figure 6 shows a comparison between the skin images acquired at different moments during the blood glucose collection and the image corrected using the template image. The results show a high correlation between the template and correction images. The average correlation coefficient between the image and template is 7.3 times higher than that without correction. The number of relevant areas in the calibration chart after compensation increases, as shown in Table 2. Furthermore, we obtain the difference between the prediction results before and after the compensation. From the prediction chart, the prediction results calculated from skin image after applying the compensation algorithm are closer to the real blood glucose concentrations. Table 3 shows the correction and compensation effects of different volunteers. The correlation coefficient increases from 0.37 to 0.65, and the proportion of predicted blood glucose in zone A using the Clark grid error analysis increases from 51.82% to 79.86%. Additionally, the standard deviation of the prediction results decreases from 1.34 mmol/L to 0.83 mmol/L after compensation. Clinical experimental data show that the accuracy of the noninvasive blood glucose prediction value is improved by 36.57%. Moreover, we study the influence of the change in the blood glucose concentration on the scattering coefficient. The results show that the scattering coefficient change caused by the blood glucose concentration change of 1 mmol/L is about 15.8 times greater than that when there is no blood glucose change.ConclusionsAs a methodology of optical noninvasive blood glucose detection, OCT is noninvasive, real-time, and sensitive to changes in blood glucose concentration in dermal tissue interstitial fluid. In this paper, we propose a compensation algorithm for image correction to improve the motion artifacts caused by the subject shaking. The compensation algorithm can find the position with the greatest similarity between the template and each image. The results show that using the compensated skin image for blood glucose calibration calculation increases the number of areas with higher correlation coefficients in the calibration chart. Meanwhile, the deviation of the predicted result is smaller than that without compensation. Furthermore, the difference between the predicted and actual values decreases after compensation, and the correlation is better than that before compensation. Therefore, the compensation algorithm effectively solves the prediction error caused by the extracted skin area deviating. This study has the important reference value for optical noninvasive blood glucose detection and is suitable for other optical imaging applications that require accurate quantitative calculations.
Jan. 01, 1900Vol. 49 Issue 24 2407201 (2022)
Renqing Jia, Gaofang Yin, Nanjing Zhao, Min Xu, Xiang Hu, Peng Huang, Tianhong Liang, Qianfeng He, Xiaowei Chen, Tingting Gan, Xiaoling Zhang, and Mingjun Ma
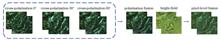
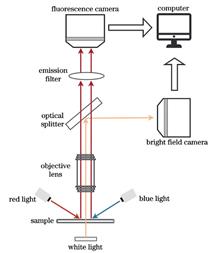
ObjectiveDetection of phytoplankton diversity is an important part of a water quality bioassessment. The traditional manual microscopic detection of algae species requires professional operation and is time-consuming and laborious; therefore, these challenges can be overcome by the development of a method for automatic identification of phytoplankton cell images. Similar to manual identification, deep learning and other automatic identification technologies identify phytoplankton cells based on the morphological characteristics of bright field cell images; however, the practical applications of such technologies encounter complications, such as the difficulty of accurate segmentation of phytoplankton cells and the limitation in high recognition accuracy of algae species only with a small range of groups. Previous studies have shown that the accuracy of algal cell segmentation and recognition can be effectively improved by fusing the bright field and fluorescence images of phytoplankton cells. However, the fusion of bright field and fluorescence images synchronously measured from phytoplankton cells requires significantly high accuracy and shockproof capability of the mechanical structure of the acquisition system. Under a high-power microscope, even a small error in the mechanical structure or a small vibration of the camera can lead to a dislocation between the bright field and fluorescence images, thus causing difficulties in the fusion of the images. Therefore, the registration of bright field and fluorescence images of algae is of great significance for the automatic identification of phytoplankton.MethodsThe displacement between bright field and fluorescence images can be represented by a rigid transformation model, which consists of three parameters: the translation in the x direction, translation in the y direction, and rotation angle. Normalized mutual information is used to calculate the similarity between the bright field and fluorescence images. The goal of image registration is to find a set of rigid transformation parameters that maximize the normalized mutual information of the two images. Owing to the significant difference between the bright field and fluorescence images of phytoplankton cells, the similarity is difficult to be characterized by directly calculating the normalized mutual information. In this study, the normalized mutual information of the S channel binary image of the bright field HSV color space and the binary image of the fluorescence gray level was assumed as the similarity between the bright field and fluorescence images. The S component of the bright field HSV image and the fluorescence gray image were decomposed using a two-dimensional discrete wavelet transform, and the low-frequency components were binarized, to accelerate the registration. First, the particle swarm algorithm was used to register the low-frequency components of the five-level wavelet decomposition. Subsequently, the translation and rotation angle of the preliminary registration were assumed as the initial values, and the low-frequency components of the wavelet three-level decomposition are further registered using Powell’s algorithm.Results and DiscussionsScenedesmus sp., Selenastrum capricornutum, and Nostoc sp. are used as experimental objects. The similarity and registration methods are compared and analyzed. As shown in Figs. 3 and 4, the normalized mutual information of the bright field S channel and the fluorescence grayscale image has an obvious peak value after binarization, which is extremely conducive to parameter optimization in the registration process. As shown in Fig. 5, after the bright field and fluorescence images are decomposed by the wavelet, the noise in the high-frequency component is concentrated, and the low-frequency component has a higher normalized mutual information. Therefore, the normalized mutual information of binary images of low-frequency components after wavelet decomposition is chosen as the similarity measurement index for bright field and fluorescence images. Table 1 presents an experimental comparison between the proposed method and other registration methods. Compared with particle swarm optimization algorithm, the proposed method reduces the mismatch rate by 0, 8.1, and 0.7 percentage points, shortens the running time by 128.26 s, 448.95 s and 237.20 s, and improves the normalized mutual information by 0.065, 0.083, and 0.106; Powell’s method depends on the initial value; therefore, it is easy to fall into the local maximum in the process of optimization, which leads to a high mismatch rate; compared with GA, the mismatch rates of proposed method are reduced by 6.1, 26.2, and 10.2 percentage points, the running time is shortened by 23.78 s, 60.95 s and 33.74 s, and the normalized mutual information after registration is improved by 0.149, 0.170, and 0.180. The experimental results demonstrate that the proposed method has obvious advantages in terms of registration accuracy and running time compared with other registration methods.ConclusionsIn this study, the bright field image is converted into a binary image by processing the S channel of the HSV color space; the fluorescence gray image is binarized; normalized mutual information is used as the similarity criterion to characterize the similarity of the bright field and fluorescence image. Using Scenedesmus sp., Selenastrum capricornutum, and Nostoc sp. as experimental objects, the application of wavelet decomposition in the registration of microscopic bright field and fluorescence images of phytoplankton cells was studied. The global search advantage of the particle swarm optimization algorithm is used for preliminary registration in the high-level decomposition component, and the local search ability of Powell algorithm is used for fine-tuning the registration accuracy in the low-level decomposition component. A comparative analysis is performed with other commonly used registration methods, and the experimental results verify the feasibility of the registration method.
Dec. 25, 2022Vol. 49 Issue 24 2407202 (2022)
Tong Wu, Xinkang Zhou, Youwen Liu, Jiming Wang, Yuangang Lu, Hong Shen, Xiaorong Gu, Yaoyao Shi, and Chongjun He
ObjectiveQuantitative measurement of burn depth is of great significance for the clinical assessment of burn degree and treatment plan. Currently, the most widely used assessment method is visual inspection, which places high demands on doctors’ experience and is easily influenced by subjective judgment. Other detection techniques, such as laser Doppler imaging, ultrasound imaging, and fluorescence imaging, have also been used to assess the extent of burns; however, these techniques cannot non-invasively and accurately measure burn depth. Polarization-sensitive optical coherence tomography (PSOCT) has the advantages of non-invasiveness, fast imaging speed and high resolution and can quantitatively measure the burn depth based on the polarization information of the burned tissue. However, the traditional measurement method is based on the accumulated polarization information from the sample surface to a certain depth inside the sample, which cannot accurately characterize the local polarization information at this depth; hence, the burn depth cannot be accurately measured. Therefore, this study proposes a local polarization information extraction algorithm based on spectral domain polarization-sensitive optical coherence tomography (SD-PSOCT) to obtain polarization information at each depth inside the burned biological tissue to quantitatively measure the burn depth of the biological tissue.MethodsA local polarization property extraction algorithm based on the SD-PSOCT system was proposed and used to quantitatively measure the burn depth of biological tissue. All single-mode-fiber-based systems adopt fiber-based polarization controllers to illuminate a sample with a single-input polarization state. A custom-built linear-in-wavenumber spectrometer consisting of a diffraction grating, dispersive prism, Wollaston prism, and a focusing lens was used to realize polarization-sensitive detection (Fig. 2). Then, the local phase retardation and axis orientation of each layer of the sample were calculated by eigenvalue decomposition based on the Jones matrix and layer-by-layer iterative algorithm. To evaluate the measurement accuracy and stability of the system, we used a quarter-wave plate (QWP) as the sample and measured the phase retardation and axis orientation of the QWP under different axis orientations each day for 14 days. To measure the burn depth of the biological tissue, we selected a piece of bovine tendon tissue as experimental sample, burned the same position of the bovine tendon five times for 10 s each, and then reconstructed the local phase retardation images of the bovine tendon unburned and burned for 10 s, 20 s, 30 s, 40 s, and 50 s, respectively. We then considered the full width at half maximum of the local phase retardation versus the imaging depth curve as the burn depth.Results and DiscussionsFrom the sensitivity roll-off curves we can see that the sensitivity at the detection depths of 0.2 mm and 1.2 mm are approximately 105 dB and 98 dB, respectively (Fig. 3). The measured average value of the phase retardation of the QWP is 82.9° and the measurement error is 1.9° (Fig. 4). The 14-day measurement results show that the phase retardation varies within a range of -0.42° to + 0.42° and the axis orientation varies within a range of -0.66° to + 0.66°. By comparing the local phase retardation images of the bovine tendon subjected to different burn times (Fig. 6), it is found that the local phase retardation inside the burned bovine tendon increases, and as the burn time increases, the region with a higher local phase retardation extendes to a deeper position. From the depth-resolved local phase retardation, it can be seen that the region with higher phase retardation gradually widens with increasing burn time (Fig. 6). Thus, the measured burn depth of bovine tendon tissue burned for 50 s is 390 μm.ConclusionsWe deduce the local polarization property extraction algorithm based on the Jones matrix in detail and provide the calculation formulas of local phase retardation and axis orientation. The sensitivity roll-off curves of the two orthogonal polarization channels in the linear wavenumber spectrometer are experimentally measured, and the measured sensitivity of the system is 105 dB. The actual phase retardation and axis orientation of the QWP at different axis orientations are measured and it is verified that the system can measure the polarization properties of birefringent samples with high accuracy and maintain good measurement stability. The imaging results of bovine tendon tissue subjected to different burn times show that the SD-PSOCT system can obtain polarization images with higher contrast than traditional OCT images. Additionally, compared with the cumulative phase retardation image, the local phase retardation image obtained by the algorithm can highlight the difference in the bovine tendon after being burned for different times and quantitatively measure the burn depth according to the local phase retardation images. This study provides a new method for quantitatively measuring tissue burn depth, which can be applied to clinical diagnosis and burn treatment in the future.
Dec. 25, 2022Vol. 49 Issue 24 2407203 (2022)
Chenmeng Li, Pengfei Shao, Bingxuan Wu, Mingzhai Sun, Peng Yao, Shuwei Shen, Peng Liu, and Xiaorong Xu
ObjectiveFluorescence molecular imaging is widely used in clinical practice. Different hardware and software designs in different fluorescence imaging systems lead to differences in imaging performance between instruments. However, unlike radiographic imaging, fluorescence imaging currently has no mature specifications or standards to test the performance of imaging instruments. Phantoms are tools used in standardized imaging performance testing and are commonly used in radiography. Unlike human tissues, phantoms have preset shapes and contrasts that simulate specific tissue parameters over time. These properties allow phantoms to be used to measure, evaluate, and confirm the performance of imaging instruments. In research on near-infrared fluorescent phantoms, fluorescent agents and quantum dots are used as samples for fluorescence imaging performance testing. However, owing to the different materials and preparation methods used in the samples, as well as the stability of the materials themselves, there is still no stable sample for accurately simulating the fluorescence spectrum as a standardized test tool. In this study, a fluorescence emission simulation system for simulating fluorescent samples is proposed. Imaging instruments can exhibit the same response as real fluorophores when imaging a fluorescence simulation system. Compared with traditional fluorescent agents, the fluorescence emission simulation (FES) system can more accurately simulate fluorescence emission characteristics in a stable manner.MethodsIn this study, we propose a fluorescent light-emitting system that uses an optical system to simulate fluorophores. First, according to the characteristics of the fluorescent agent, a simulation method for fluorescence excitation efficiency, spatial distribution, and fluorescence emission spectrum characteristics is designed such that the fluorescence imaging instrument has the same response as the real fluorescent agent when imaging the FES system. The system controls the intensity of the outgoing fluorescence according to the intensity of the detected excitation light, thereby simulating the fluorescence excitation efficiency of the fluorescent agent sample. The design of the optical entrance and exit based on the integrating sphere can simulate the spatial distribution of outgoing fluorescence. In this study, a spectral simulation method based on a linear filter LVF and liquid crystal display (LCD) is used, and based on this method, an improved least squares spectral fitting algorithm is designed to automatically simulate arbitrary fluorescence spectra.Results and DiscussionsThe performance verification shows that the subspectra of the FEM system have linear additivity (Fig. 5), and the subspectrum satisfies a certain gray-transmittance relationship [Fig. 6(a)]. A grayscale transmittance curve of the sub-spectrum was obtained [Fig. 6(b)]. Functional verification of the system is realized by fluorescence emission simulation of ICG. The simulation of the fluorescence emission spectrum characteristics [Fig. 7(a)] and fluorescence excitation efficiency [Figs. 7(b)-(d)] of the ICG aqueous solution samples with different concentrations is performed using the FES system. The simulation system obtains the same test results as the fluorescent samples (Fig. 8), and compared with traditional fluorescent agents, the FES system more accurately simulates the fluorescence emission characteristics in a stable manner, which verifies the feasibility of the system as a standardized test tool.ConclusionsIn this study, a method for simulating fluorescent samples with an optical system is proposed. A programmable FES system is built and an optical system is used to simulate fluorescent agents for the standardization test of near-infrared fluorescence imaging performance. The FES system can simulate the fluorescence excitation efficiency, spatial distribution, and fluorescence emission spectrum characteristics of the fluorescent sample such that the fluorescence imaging instrument has the same response as the real fluorescent agent when imaging the FES system. A spectral simulation method based on a linear filter and liquid crystal display is also proposed and an improved least squares spectral fitting algorithm is designed, which can automatically simulate any fluorescence spectrum. Finally, based on the FES system, the fluorescence imaging sensitivities of different near-infrared fluorescence imaging instruments are tested and the test results of different instruments are compared. The test results show that compared with traditional fluorescent agents, the FES system can more accurately simulate the fluorescence emission characteristics in a stable manner, which verifies the feasibility of the system as a standardized test tool.
Dec. 25, 2022Vol. 49 Issue 24 2407204 (2022)
Xiaoxue Zhong, Guowu Huang, Hongbo Miu, Chenghao Hu, Wei Liu, Chunrong Sun, Zhihua Chen, Gangning Li, Zili Cao, Xin Jin, and Weihao Lin
ObjectiveThe increasing burn mortality rate places an urgent need for accurate diagnosis and treatment of burns. Currently, the third-degree quartile is internationally used to classify the degree of burns based on burn depth, and clinical treatment methods for different degrees of burns are significantly dissimilar. Burn surgeons overestimating the severity of burns can lead to unnecessary surgery, whereas underestimating them leads to treatment delays and worsening of the burn conditions. In addition, studies have shown that burn severity changes dynamically over time, with superficial Ⅱ burn worsening to deep Ⅱ or Ⅲ burns within 48 h of burn occurrence. Therefore, overcoming the defects of subjective judgment using the naked eye and quantitatively monitoring the dynamic changes in the burn degree in real time has become a challenge in the early diagnosis of burns. Burn diagnosis methods based on photonics, such as near-infrared spectroscopy, reflective confocal microscopy, and laser Doppler flowmetry, are developing rapidly. However, their clinical application is limited owing to low accuracy, invasiveness, high detection environment requirements, and high costs. In this study, a noninvasive quantitative method for assessing the burn degree was developed based on spatial frequency-domain imaging (SFDI). Combined with the systematic clustering method and multiparameter dimensionality reduction analysis, the proposed method results in improved classification accuracy of different burn degrees and shortened classification time, thus indicating the potential for early diagnosis of clinical burns.MethodsIn this study, the SFDI technique was applied to a rat burn model. First, the backs of Sprague-Dawley (SD) rats were depilated, and a thermostatic iron heated to 100 ℃ was used on the backs of the anesthetized SD rats for 4, 12, and 24 s, respectively, to establish a rat burn model with different burn degrees. Next, the sinusoidally modulated structural patterns were projected onto the surface of each burned area, and the backscattered structural patterns from the tissues were captured using a charge-coupled device (CCD) camera. Subsequently, we used single-snapshot multifrequency demodulation (SSMD) to extract the modulation transfer function (MTF) of light from the burned tissues. Compared with the traditional three-phase shift demodulation method, SSMD only requires a single snapshot to achieve parameter extraction, which significantly suppresses the problem of motion artifacts and improves the signal-to-noise ratio of imaging using filtering technology. Based on the photon diffusion transmission theory, the optical parameters (μa and μ′s) were then recovered using the look-up table method at the 5th, 10th, 30th, 60th, 90th, and 120th minutes after burn. Finally, systematic clustering and multiparameter dimensionality reduction analysis were performed on the optical parameters to quantify and classify different burn degrees.Results and DiscussionsDifferent degrees of burns can be effectively distinguished by the relative changes in the two optical parameters at the three wavelengths. The results show that the magnitude of the absorption coefficient positively correlates with the degree of burn. In contrast, the magnitude of the reduced scattering coefficient negatively correlates with the degree of burn. Although the distinction between optical parameters is not significant at the beginning of burns, the optical parameters of the 4 s burn group gradually decrease or gradually recover to the unburned state with observation time. In contrast, the optical parameters of the 12 s and 24 s groups gradually deviate from the normal state (Fig. 6). The burn results are divided into two categories through optimal analysis of systematic clustering. The 4 s group is classified as mild burns, whereas the 12 s and 24 s groups are classified as severe burns. Although the classification accuracy is less than 85% in the first 10 min after burn, it is 100% in the later stages (Table 1). Two new factors (the absorption factor FAC1 and the reduced scattering factor FAC2) reflecting approximately 93% of the original variable information can be generated using the principal component analysis to reduce the dimensionality of the six optical parameters. The results show that the absorption factor, FAC1, distinguishes the degree of burns in a large category (mild burns in the 4 s group and severe burns in the other two groups) and increases the difference between deep Ⅱ degree burn in the 12 s group and Ⅲ burn in the 24 s group. In addition, the assessment of burn severity using principal constituent factors can reduce interference and improve classification accuracy in the early stage after burn (Fig. 9).ConclusionsThe quantitative burn imaging device based on real-time spatial frequency-domain imaging technology has remarkable advantages over existing diagnostic techniques, for example, ease of handling, compact structure, and high precision. Through dynamic monitoring of changes in optical parameters combined with cluster analysis and parameter dimensionality reduction, the degree of burns can be determined through noninvasive assessment, providing a reliable guarantee for the precise treatment of burns. In future studies, we will supplement the pathological verification, characterize additional physiological parameters (such as hemoglobin content, blood oxygen saturation, and melanin concentration) from the optical parameters, and extend this technology to clinical applications so as to significantly reduce the treatment cycle and cost to patients.
Dec. 25, 2022Vol. 49 Issue 24 2407205 (2022)
Kewei Wang, Kang Xiao, Jing Sun, and Zhongyang Wang
ObjectiveMicroscopy is an essential tool in most life science laboratories. However, the resolution of the microscope is limited by the numerical aperture (NA) of the objective and light wavelength, which is defined as λ/( 2NA ). In recent decades, methods such as stimulated emission depletion (STED), stochastic optical reconstruction microscopy (STORM), and photoactivated localization microscopy (PALM) have been proposed to overcome this limitation. However, in some fields, such as X-ray crystallography, wavefront sensing, and living cell imaging, label-free methods have demonstrated significant advantages. Aperture synthesis has been reported as one of the most effective label-free imaging methods that can be used to increase microscope resolution. Currently, most analyses of synthetic aperture techniques are based on scalar diffraction theory. However, for imaging objects smaller than the optical wavelength, the approximations and hypotheses in scalar diffraction theory are no longer valid. In this study, the imaging of subwavelength gratings is analyzed using the synthetic aperture method based on rigorous coupled-wave analysis (RCWA), which directly solves the Maxwell equation to obtain the analytical solution of the exit field under Gaussian beam illumination. The proposed method provides a more accurate analysis of synthetic-aperture imaging techniques for subwavelength gratings.MethodsRCWA was used to analyze the diffraction of a grating incident by a plane wave. In practice, illumination is a focused Gaussian beam that can be expanded into a series of plane waves. Therefore, the output field distribution can be expressed as the product of each plane wave component of the rotated Gaussian beam and diffraction field at the corresponding incident angle solved by RCWA. A one-dimensional rectangular grating with a 280 nm period and 140 nm line width was employed in the simulation (Fig. 1). RCWA under Gaussian beam illumination was used to analyze the output optical field and angular spectrum distribution with a half angle of 10° at different angles (Fig. 3). The angular spectra obtained from different illumination angles were combined using the synthetic aperture method (Fig. 4). Then, inverse Fourier transform was used to obtain the image of the sub-wavelength grating. Thus, a super-resolution grating structure was obtained (Fig. 5).Results and DiscussionsAs shown in equation (1), the dielectric constant of the grating area is expanded into the Fourier series, which represents the corresponding eigenmode of grating during calculation. The number of modes used in grating reconstruction is closely related to the boundedness of the grating. We discuss two cases: the illumination area being larger than the grating area (Fig. 6) and the illumination area being smaller than the grating area (Fig. 7). Overall, the number of modes required for reconstruction relates to the grating size and period. When the grating size is small and the grating period is less than the wavelength, at least five eigenmodes must be retained. Subsequently, the differences between scalar diffraction theory and RCWA are discussed. The errors of scalar diffraction theory relative to the RCWA method are analyzed for different grating periods, depths, and materials with different refractive indices (Fig. 8). This study shows that because the interaction between electromagnetic fields is ignored, scalar diffraction theory is no longer valid for sub-wavelength gratings. Finally, the resolution of the synthetic aperture method is discussed. Equation (5) and Fig. 9 show that the minimum distinguishable period is half the wavelength of the incident light. In addition, the minimum resolution is one-quarter of the wavelength of the incident light (Fig. 11).ConclusionsIn this study, the synthetic aperture imaging of sub-wavelength gratings is theoretically analyzed using strict coupled wave theory under Gaussian beam illumination. By accurately solving the optical field and angular spectrum distribution of the grating, the half space of the angular spectrum is synthesized using the synthetic aperture technique, and the image of the grating structure can be obtained by an inverse Fourier transform. In particular, the image of a grating with a 280 nm period and 140 nm line width is successfully reconstructed with the illumination of a 532 nm wavelength laser. For this synthetic aperture technique, the theoretical resolution is only related to the wavelength of the illumination light, as the resolved minimum grating period is λ/2 and the resolution of the line width is λ/4. This study provides guidance for using synthetic aperture technology with sub-wavelength gratings.
Jan. 01, 1900Vol. 49 Issue 24 2406001 (2022)
Yingying Gao, Xiaodan Jiang, Miaohua Xu, and Yingjun Li
ObjectiveIn laser-plasma interactions,a magnetic field with a strength up to 100 T magnitudes can be generated as a result of different physical mechanisms.In recent years,many achievements have been made in theoretical and experimental research on self-generated magnetic fields,including proton radiography diagnostics of magnetic fields.In Ref.[12],time-resolved monoenergetic proton radiography was used to measure the magnetic field generated in nanosecond laser foil interactions.The 2D hydrodynamic program LASNEX was used to simulate magnetic field generation and evolution,and the hybrid particle-in-cell program LSP was used to calculate the image formed by the proton beam deflection due to the applied magnetic field.The circular ring structure and overall deformation structure are reproduced almost exactly by LASNEX+LSP simulations.However,considering the mean radius of the ring and the deflection of each beamlet,there remain differences between the experimental results and the LASNEX+LSP results at 0.6 ns,0.9 ns,and 1.2 ns.In this study,we attempt to determine the magnetic field distribution that matches the experimental results using the Monte Carlo particle transport program.MethodsFLUKA is a versatile Monte Carlo particle transport program that can perform calculations about particle transport and interactions with matter.As it can reasonably consider the interaction between protons and matter and couple a magnetic field with a certain spatial distribution into the program,it can be used in the calculations of the proton radiography of the self-generated magnetic field,which is the focus of this study.Based on the understanding of the generation mechanisms of the magnetic field,the features of the magnetic field distributions obtained via LASNEX simulations,and the displacement of each proton beamlet obtained from the experimental results in Ref.[12],we assume that the magnetic fields have the form B=B0exp(?|r?Rb|lb)×d2Rb2, where B0is the peak intensity,Rbcorresponds to the radius of the bubble surface,lbis the scale length of the magnetic field,r is the distance from the field point to the laser focal point,and d is the vertical distance from the field point to the z-axis.Moreover,simulations are performed using different parameters.The one-dimensional displacement of the proton beamlets is compared with the experimental results.Good consistency is achieved with the proton radiography images in Ref.[12].Results and DiscussionsThe spatial distributions and time evolution of the magnetic field deduced from FLUKA and those calculated from LASNEX are compared and analyzed.First,we find that the peak intensity of the magnetic field increases during the laser pulse,reaching 38 T at 0.9 ns,and decreases when the laser is switched off(Fig.4),which is consistent with the LASNEX results.Second,we roughly estimate the speed of plasma expansion when the laser is on according to the evolution of the radius of magnetic field(Fig.6).Third,we find that the range of the magnetic field inferred from the FLUKA calculations(Fig.7 and Table 1)is larger than that calculated from the LASNEX simulations.One main reason for this is the influence of magnetic field dissipation.Another reason is the existence of an under-dense plasma region with a small temperature gradient before the critical surface.ConclusionsThe distribution of the magnetic field in long-pulse laser-plasma interactions is achieved in this study.We achieve good consistency with the proton radiography images obtained in Ref.[12]using the FLUKA simulations.The evolution of the peak intensity and bubble radius are examined.The range of the magnetic field is compared with that calculated using the hydrodynamic program,LASNEX.The field range is found to be larger than that obtained from the LASNEX simulations,and possible reasons for this are analyzed.FLUKA can be an efficient tool for obtaining a detailed and reasonable interpretation of experimental data,which is vital in proton radiography studies.
Jan. 01, 1900Vol. 49 Issue 24 2401001 (2022)
Kunpeng Zhang, Xiaoqi Zhang, Tao Feng, Yanli Zhang, Hui Wei, Fanglun Yang, and Jianqiang Zhu
ObjectiveSpatial coherence is one of the characteristics of traditional lasers. High spatial coherence enables good directivity in lasers; however, it also results in speckles. Thus, to suppress speckle noise, many methods have been developed to reduce the spatial coherence of lasers, including the mechanical vibration and photoelectric methods. Specifically, the mechanical vibration method is relatively slow and fails to achieve speckle suppression within short periods; alternatively, the photoelectric method suffers from problems pertaining to low threshold power and high cost. Notably, the laser with a degenerate cavity structure proposed by Arnaud in 1969 features low temporal and spatial coherence. Over recent years, factors influencing the spatio-temporal coherence characteristics of 4F degenerate cavity lasers have been studied; however, the influence of the thermal effect in the laser gain medium on the 4F degenerate cavity has been neglected. The thermal effect in solid-state lasers is a problem that cannot be ignored; this thermal lens effect of the laser gain medium degrades the perfect imaging characteristics of 4F degenerate cavity lasers and also alters the degenerate characteristics of the 4F resonant cavity. Accordingly, considering the thermal lens effect in the degenerate cavity gain medium, the influence of cavity length variations on the space – time output characteristics is analyzed and experimentally verified in this work. These results provide theoretical and experimental supports for research on low spacetime coherent lasers.MethodsIn this study, the transmission matrix and G-parameter equivalent cavity analysis methods are used for analyzing the spatio-temporal spectrum distribution characteristics of the beam in lasers considering the thermal lens effect in the degenerate cavity. The existence of the thermal lens, which degrade the degeneracy of the transverse mode spectrum in the degenerate cavity, is analyzed. In this experiment, a set of thermal lens measurement optical paths based on the 4F degenerate cavity laser is built. The focal length of the thermal lens, laser beat frequency signal, and maximum transverse mode order of the 4F degenerate cavity laser are measured. Additionally, considering a thermal lens in the cavity, the influence of cavity length variations on the maximum transverse mode order and the transverse mode beat frequency bandwidth in the cavity is theoretically calculated and experimentally verified.Results and DiscussionsA set of thermal lens measurement optical paths based on the 4F degenerate cavity laser is built in this experiment (Fig. 2). The influence of cavity length variations in the 4F degenerate cavity laser on the focal length of the thermal lens (Fig. 3), laser beat signal (Fig. 4), and maximum transverse mode order (Fig. 5) is studied. Experimental results reveal that the total spectral bandwidth of the degenerate laser cavity does not vary with the focal length and cavity length of the thermal lens. Further, as the cavity length of the thermal lens increases, the frequency interval of the transverse mode increases, the beat frequency bandwidth of the transverse mode fluctuates, and the maximum transverse mode order, Nmax, decreases significantly. Moreover, this study theoretically simulates the maximum transverse mode order with cavity length variations under the influence of a thermal lens, and the simulation results in the time domain are consistent with the experimental results.ConclusionsHere, the influence of cavity length variations on the maximum transverse mode order and spectral structure of a degenerate laser cavity is studied considering the thermal lens effect in the laser gain medium. The existence of a thermal lens degrades the perfect imaging characteristics of the 4F degenerate cavity and the degenerate characteristics at the transverse and longitudinal mode frequencies. In this work, under the influence of a thermal lens, the beat frequency signal and maximum transverse mode order of a degenerate laser cavity are measured considering changes in the cavity length. Results indicate that the total spectral bandwidth of the degenerate laser cavity does not vary with the focal length and cavity length of the thermal lens. As the cavity length under the thermal lens increases, the transverse mode frequency interval increases and the transverse mode beat frequency bandwidth fluctuates. This suggests that changes in the cavity length affect the mode distribution in the spectrum. Further, experimental results for the maximum transverse mode order show that, owing to the existence of the thermal lens, a small distance of cavity mirror from the ideal position has a significant impact on the maximum transverse mode order. The maximum transverse mode order under the influence of a thermal lens is also theoretically simulated with changes in the cavity length. Notably, simulation results in the time domain are consistent with the experimental results, indicating that the theoretical model of the thermal lens has a practical significance for research on the spatio-temporal output characteristics of 4F degenerate cavity lases. Analyses also indicate that adjusting the laser cavity length is an effective method for controlling the spatial coherence of these lasers.
Jan. 01, 1900Vol. 49 Issue 24 2401002 (2022)
Chengdong Yang, Linlin Su, Kaipeng Xia, and Wenye Ma
ObjectiveHigh-sensitivity ultraviolet (UV) detectors are required in many critical applications such as corona discharge, missile plume detection, environmental monitoring, and non-line-of-sight communications. As an attractive candidate for weak UV signal detection, avalanche photodiodes (APDs) operating in Geiger mode exhibit promising performance, including small size, low dark current, and high multiplication gain. Wide-bandgap semiconductor materials, such as GaN and SiC, can effectively shield the influence of visible light and infrared light, showing obvious advantages in the field of UV detection. The defect density of GaN is relatively high, which leads to a generally high dark current in GaN APDs. In addition, the photoresponse behavior of GaN APDs under high pressure undergoes a significant red shift, and the cut-off wavelength is extended to 440 nm, indicating the loss of visible light blindness. In comparison, SiC can construct APDs with a much lower dark current than GaN owing to its excellent material epitaxial technology. However, there is still little research on the high-voltage photoresponse characteristics of SiC APDs, which are a key issue related to the background noise of the device. This work discusses the photoresponse behavior of SiC APD under high voltages. Moreover, owing to material defects, the size of the SiC APD is always below 300 μm, but a device with a large photosensitive area is needed to improve the detection sensitivity. Although some studies have reported SiC APDs with a diameter of 800 μm, the key parameter of the single-photon detection efficiency has not been successfully detected. In this study, low-dark-current SiC APDs with a diameter of 500 μm were successfully fabricated, and the devices exhibited single-photon detection performance. This is clearly a breakthrough in terms of the size of SiC APDs.MethodsSiC APDs were fabricated on n-type 4H-SiC substrates (Fig. 1). The epi-structure from bottom to top consists of a 10 μm p+ layer (NA=3×1018 cm-3), a 0.78 μm n- multiplication layer (ND=1×1015 cm-3), a 0.2 μm n layer (ND=1×1018 cm-3), and a 0.15 μm n+ contact layer (ND=1×1019 cm-3). To suppress peak electrical field around device edge, the beveled mesa with a slope angle of 5° was obtained via photoresist reflow technique, and the mesa was etched down to the multiplication layer by inductively coupled plasma. The device surface was then passivated by thermal oxidation at 1050 ℃ in oxygen atmosphere followed by a 1 μm SiO2 layer deposited by plasma enhanced chemical vapor deposition at 350 ℃. The n and p type metal stacks, both based on Ni/Ti/Al/Au (35 nm/50 nm/100 nm/100 nm), were deposited by electron-beam evaporation. The devices were then annealed at 850 ℃ for 3 min in N2 ambient by rapid thermal annealing.Results and DiscussionsTo analyze whether the SiC APDs still have visible light blindness in the Geiger mode, the photoresponse characteristics of the SiC APD are measured under high voltages. The results show that the response peak of SiC APD is always maintained at 280 nm when the voltage changes from 0% to 90% breakdown voltage (Fig. 3). It is proved that SiC APDs still exhibit visible-light blindness characteristics under high voltages. Owing to the properties of SiC, SiC APD enables the shielding effect of visible and infrared light, which greatly reduces the complexity, volume, and cost of the device. The activation energy of the 500 μm SiC APD is 0.131 eV (Fig. 5), which indicates that the tunneling effect is the main cause of the dark current. At present, the best SiC epitaxy technology can grow epitaxial wafers with a dislocation density of 1000-2000 cm-2. This implies that there are at least 2-4 dislocations in SiC APD with a diameter of 500 μm, which exacerbates defect-assisted tunneling and leads to a rapid increase in dark current. Therefore, the material defect density is a key problem that restricts the development of large-sized SiC APD. The dark current of the reported SiC APDs at 95% breakdown voltage has been calculated, and the comparison shows that the 500 μm SiC APDs fabricated in this work have a lower dark current (Fig. 7). Most importantly, the 500 μm SiC APDs in this work still have the single-photon detection capability. At a dark count rate of 1 Hz/μm2, the single photon detection efficiency of the device is 0.7%. The most recently reported largest diameter of SiC APD with single-photon detection capability was 300 μm. Although the single-photon detection efficiency of the 500 μm SiC APD reported in this work needs to be improved, a breakthrough in device size has been achieved.ConclusionsIn this work, by studying the photoresponse characteristics of SiC APDs under high voltages, it is proved that SiC APDs still exhibit visible light blindness in the avalanche breakdown state, which is more suitable for weak UV light detection than traditional Si or GaN. In addition, we successfully achieve a breakthrough in the photosensitive area of SiC APD and fabricate a large-sized SiC APD with single-photon detection performance. The dark current of the device is better than the existing level. However, to further improve the single-photon detection efficiency of large-sized SiC APDs, it is necessary to optimize the quality of SiC epitaxial wafers in future work.
Dec. 25, 2022Vol. 49 Issue 24 2401003 (2022)
Weijian Liu, Zhishan Gao, Yicen Ma, Xiaoyu Che, Lihua Lei, Yunxia Fu, and Qun Yuan
ObjectiveCollimated wavefront is an important parameter to estimate the quality of optical systems such as collimator, interferometer, and camera lens. Pentaprism scanning method is a conventional method to detect large aperture collimated wavefront by continuously collecting the coordinates of the focus of sub-aperture beams along the scanning direction and retrieving the wavefront distribution from the slope of the wavefront. The traditional pentaprism scanning method can only measure the wavefront distribution on one line of the collimated wavefront, and cannot obtain the full aperture aberration distribution of the wavefront. In order to obtain the full aperture aberration distribution of the wavefront, it is necessary to conduct multiple scans to obtain the slopes of multiple lines of the wavefront. This scanning method is often used for the surface shape detection of large aperture flat optical elements, through rotating the optical flat and measuring the slope of the surface in polar coordinates. However, the method is not suitable for measuring the collimated wavefront of the optical system. To measure the full aperture collimated wavefront, two pentaprism scanning systems in the X and Y directions, respectively, are generally required. The scanning mechanisms are complex, time-consuming, and vulnerable to environmental disturbances. In this paper, pentaprism array is proposed to simplify the scanning mechanism, shorten the scanning detection time of the full aperture collimated wavefront, and realize the rapid detection of the collimated wavefront.MethodsBased on the traditional one-dimensional pentaprism scanning method, we propose to add multiple pentaprisms to form a group of parallel pentaprisms and a group of series pentaprisms, and realize a pentaprism array scanning based on nonuniform sampling to measure the three-dimensional distribution of large aperture collimated wavefront. Three parallel pentaprisms parallel to the scanning direction are used to measure the slope of the collimated wavefront in the X direction, and simultaneously three series pentaprisms perpendicular to the scanning direction are used to measure the slope of the collimated wavefront in the Y direction. All the pentaprisms move along the scanning direction simultaneously. Thus, this method only needs one scanning measurement process to obtain the slopes of the three lines of the wavefront simultaneously. It avoids the process of multiple scanning in the X and Y directions when measuring the full aperture collimated wavefront by the traditional method. The measured slope is fitted with the derivative function of the 4th11th terms in the Zernike polynomials, and then the three-dimensional distribution of the collimated wavefront is represented by the Zernike polynomials. Only low order aberrations of the wavefront can be fitted since the low sampling rate in the Y direction.Results and DiscussionsThe feasibility and accuracy of using the slopes of the three lines of the wavefront to reconstruct the wavefront are verified by simulations, in which the reconstruction errors of the collimated wavefront with the pentaprism array are peak-to-valley (PV) value of 0.058λ and root-mean-square (RMS) value of 0.009λ (Fig. 3). The analysis for robustness of the proposed method is also given (Fig. 4). The proposed method is used to detect the collimated wavefront with the aperture of 1 m (Fig. 5). After correcting the mechanical scanning errors, the PV and RMS values of the measured wavefront are 2.495λ and 0.448λ, respectively. As a comparison, detection of the wavefront is also carried out with interferometry, with which the PV and RMS values of the measured wavefront are 2.752λ and 0.496λ, respectively. The retrieved collimated wavefront results obtained by the two methods are basically consistent, with nearly the same values and distribution form, which proves the feasibility of this method (Fig. 9). The uncertainty analysis of the pentaprism array scanning method is carried out, including uncertainty of spot centroid detection, uncertainty of the rail straightness and uncertainty of environmental disturbance. The combined uncertainty of the proposed method is 0.035λ.ConclusionsBased on the traditional pentaprism scanning method, in this paper we propose a pentaprism array scanning method based on nonuniform sampling to measure the large aperture collimated wavefront. It solves the problem of complex and time-consuming scanning mechanism for the traditional pentaprism scanning method to detect the full aperture three-dimensional aberration distribution of large aperture collimated wavefront. This method measures the slope of the collimated wavefront in the X direction through three pentaprisms in parallel and the slope in the Y direction through three pentaprisms in series, and fits the low order aberration of the wavefront through the derivative of Zernike polynomials. The proposed method is simulated and analyzed, and the collimated wavefront with the aperture of 1 m is detected. The detection results are compared with the collimated wavefront measured by interferometry. The low order aberration distributions of the collimated wavefront measured by the two methods are basically consistent with the numerical value, which proves the feasibility and accuracy of the proposed method. The uncertainty analysis of the pentaprism array scanning method is also carried out, which demonstrates the measurement accuracy of the proposed method.
Jan. 01, 1900Vol. 49 Issue 24 2404001 (2022)
Hengyi Zheng, Fukang Yin, Tiejun Wang, Yaoxiang Liu, Yingxia Wei, Bin Zhu, Kainan Zhou, and Yuxin Leng
ObjectiveFemtosecond laser filamentation has garnered significant attention and shown great potential in guiding discharge and remote sensing detection owing to its unique characteristics. The measurement of the size and internal electron density of a filament is of great significance for understanding the nonlinear propagation and evolution law of a filament and for developing various applications. Electron density measurements in a filament can be divided into two categories: direct measurement detection method such as electrical measurement and measurement of the density by interference, diffraction, and holography. The experimental setup of the longitudinal diffraction method is relatively simple, and the temporal evolution of plasma density can be recorded at the expense of axial resolution information. However, the diffraction propagation models of probe beam based on the longitudinal diffraction method in previous studies ignored the modulation of the probe beam intensity affected by plasma defocusing. Modulation from the plasma defocusing effect cannot be ignored when the plasma density is high. In this study, a segmented diffraction imaging model based on scalar diffraction theory is established to accurately simulate the diffraction transmission process of a probe beam.MethodsScalar diffraction theory effectively describes the propagation of light in free space and is a reasonable approximation of the propagation effect of light. In this work, a plasma channel was divided equally into N segments; the length of each segment was Δd=Lfil/N, and the complex amplitude distribution of the probe beam at the entrance of the filament (z=z0) was U0=exp(-ar2). The defocusing modulation experienced by the probe beam in each section was regarded only as a phase change. The calculation process is illustrated in Figure 2. First, the diffraction transmission result of the probe beam at a distance was calculated using equation (1). Second, the result of the first step was multiplied by the phase shift caused by this section of the filament. The result of the second step was the final light-field distribution in this section and the complex amplitude distribution of the initial plane of the next transmission process. Finally, the first and second steps were repeated N times, and the complex amplitude distribution at the exit of the filament was obtained. A comparison was made between the segmented diffraction model and previous models.Results and DiscussionsThe structure of the diffraction ring changes correspondingly with changes in ne0 and w. The intensity of higher-order diffraction rings and the number of diffraction rings increase with an increase in the electron density. The modulation of the central region is enhanced, and the intensity of the high-order diffraction rings is weakened with an increase in the filament radius. Additionally, the radius of the diffraction rings always increases with an increase in ne0 and w. Under the conditions of high pulse energy and tight focusing, the early high-density plasma channel shows strong diffraction modulation for the probe beam [Figure 4(a1)]. The SSE logarithmic surfaces with N=25 and N=10 produce a significant depression area, and the minimum values in the depression are obtained at (ne0, 2w)=(8.8×1017 cm-3, 90 μm) using the segmented diffraction model. The corresponding fitting results are shown in Figure 4 (e1). The plasma defocusing effect is only reflected in the additional phase shift, and the optimal solution corresponding to the minimum value of the SSE is (ne0, 2w)=(2.1×1018 cm-3, 90 μm) with the number of segments N=0. The SSE value of segment N=0 is larger than that based on the segment diffraction model. This indicates that the corresponding fitting effect of segments N=0 is worse than that of the segmented model. The surface obtained without segmentation does not produce a prominent concave region; therefore, the minimum value is insignificant and the corresponding electron density distribution is not accurate and reliable. The probe beam is only subject to a change in the phase shift, and the diffraction intensity distribution deviates greatly from the actual situation. It is difficult to accurately measure the electron density and diameter of a filament with a relatively high electron density. The SSE value of segments N=0 is also larger than the result based on the segment diffraction model under the relatively low electron density condition [Figure 4(e2)]. The measurement results of the two models are similar, and both fit the experimental results well when the electron density drops to approximately 1×1017 cm-3. The plasma channel is assumed to have a cylindrical symmetric electron density distribution. The modulation effect of the probe beam passing through the plasma channel is not a simple phase modulation but a complex amplitude modulation. The consideration of directly adding a phase-shift model to this modulation process is imperfect. The segmented diffraction calculation reflects the process by which the complex amplitude of the light field is modulated as a whole. The segmented calculation simulates the distribution of the complex amplitude of the modulated probe beam with a smaller fitting error. Correspondingly, the radial spatial distribution of the electron density of the filament can be obtained more accurately. The radial intensity distribution of the experimental curve is relatively stable. The radial intensity variation trend of the diffraction structure fitted according to the minimum value of the sum variance SSE is consistent with the experimental results. The calculation method based on subsection diffraction is reasonable and reliable for the diagnosis and estimation of electron density distribution.ConclusionsA piecewise diffraction calculation model based on scalar diffraction theory was proposed to simulate the propagation of probe beam in the same direction as the filament. Based on this model, the diffraction rings of the detected light recorded in the experiment were fitted. The results show that the segmented diffraction model can extend the measurement range for higher electron densities. The measurements of the electron density and filament size based on the segmented diffraction model provide a new analysis method for the precise diagnosis of filaments.
Dec. 25, 2022Vol. 49 Issue 24 2408001 (2022)
Characteristics of Mirror Misalignment of Plane-Parallel Cavity-Based Optical Parametric Oscillators
Qiaoqiao Fu, Pengxiang Liu, Feng Qi, Weifan Li, Chuncao Niu, Wei Li, Liyuan Guo, Yelong Wang, and Zhaoyang Liu
ObjectiveOptical parametric oscillators(OPOs)have been proven to be effective,coherent light sources that can expand the wavelengths of commercial lasers(typically limited to narrow emission lines and bands)to a broad range from visible to far-infraredbands. Q-switched lasers with high peak powers have significantly promoted the development and applications of OPOs with the following advantageous characteristics:system compactness(for example,two cavity mirrors and a nonlinear crystal),relatively high conversion efficiency,singly resonant operation,and frequency-agile tunability(for example,angle tuning).A plane-parallel cavity with a large mode volume is well-suited for Q-switched laser pumps.This type of OPO is widely adopted,for example,as a pump/seed source in nonlinear terahertz or mid-infrared(MIR)generation or directly as an MIR source,owing to the wide tuning range and ease of construction.As the earliest configuration in a laser resonator,a plane-parallel cavity is critically stable and sensitive to mirror misalignment.The misalignment of laser cavities,including those of argon ion,CO2,and Nd∶YAG lasers,has been analyzed previously;however,studies on OPO cavities have rarely been reported.In this study,we performed an experimental investigation on the misalignment characteristics of a plane-parallel cavity-based OPO.MethodsIn this study,an OPO based on a plane-parallel cavity structure was developed.A potassium titanyl phosphate(KTP)crystal was utilized as the nonlinear medium(cut at θ=60°,φ=0°,and 10 mm×7 mm×20 mm,anti-reflection(AR)-coated at 532 nm/800-900 nm/1300 1600 nm).A frequency-doubled Nd∶YAG laser(532 nm,10 ns,and 10 Hz)was employed as the pump source.Two flat mirrors(AR-coated at 532 nm/1300-1600 nm and highly reflection-coated at 800 900 nm)formed a singly resonant cavity.The ns-pulsed OPO was operated at a wavelength of 1514 nm via o→e(signal)+o(idler)critical phase matching.The cavity mirrors were precisely controlled using piezoelectric optical mounts for alignment.Each mount was equipped with two piezo actuators,which could provide a two-dimensional(2D)adjustment(axes 1 and 2 for output mirror M1 and axes 3 and 4 for input mirror M2)with an angular resolution of ≤0.7 μrad.Results and DiscussionsTypical output results(pulse envelopes and beam profile)of the KTP-OPO are presented in Fig.2.The piezoelectric optical mounts with a motion controller module facilitate quantitative analysis of the influence of mirror misalignment on the OPO output.The variation in the output pulse energy with angular tilt δxis measured while scanning each cavity mirror along two directions around the well-aligned position(δx=0),as presented by the 2D graphs in Fig.3.The subscripts x=1–4 correspond to the four actuators,axes 1–4,respectively.The four curves presented in Fig.3 present envelopes along the principal axis(with the other three δ=0).The full widths at half maximum of the curves(called alignment tolerance)from axes 1 to 4 are 0.171,1.861,0.177,and 1.933 mrad,respectively,which are determined at a pump beamdiameter Φ=4 mm,cavity length L=65 mm,and output pulse energy=6.6 mJ.The discrepancy between the two mirrors along the same direction(axes 1 and 3 and axes 2 and 4)is minimal,which is verified by alternating the two mounts.The tolerances along the horizontal direction(axes 2 and 4, y-principal dielectric axis)are approximately 10 times those along the vertical direction(axes 1 and 3, x-z-principal plane).This can be attributed to the critical phase matching configuration(Fig.4).As presented in Fig.5(a),the alignment tolerance increases with the beam size at a specific pump intensity and cavity length because a larger interaction region(cross-section)can provide more effective round trips for misaligned signal beams.The relationship between the tolerance andoutput energy,shown in Fig.5(b),demonstrates an increasing trend because a higheroutput energycorresponds to a higher single-pass gain(easier to build up).The alignment tolerances of different cavity lengths are compared at fixed input[Fig.6(a)]and output pulse energies[Fig.6(b)].In addition,the other output characteristics vary with the OPO cavity length.A longer cavity length results in a higher threshold and lower energy conversion efficiency(Fig.7).The divergent angles decrease with the cavity length at approximately equal output energies and beam sizes(left y-axis of Fig.8).Better beam quality and worse stability can be obtained with a more extended cavity(right y-axis of Fig.8),and the root-mean-square(RMS)of pulse energy fluctuation increases(3.09%→3.61%→3.96%).ConclusionsHerein,we quantitatively characterize the mirror misalignment of a plane-parallel cavity-based OPO,which has been widely utilized as a convenient coherent light source with a desired wavelength.A green laser-pumped KTP-OPO equipped with piezoelectric optical mounts is constructed.An almost circular Gaussian beam with a wavelength of 1514 nm is delivered with a slope efficiency of ≥25% and a pulse energy fluctuation(RMS)of ≤4%. The output shrinkage is measured by scanning the cavity mirrors around a well-aligned position.The alignment appears to be significantly more sensitive in the critical direction than in the noncritical direction,which can be explained based on the phase-matching configuration.The alignment tolerance increases with the beam size and input intensity.In addition,the cavity length dependence is analyzed at specific input and output pulse energies.This paper presents a type of ns-pulsed,singly resonant,and critical phase-matched OPO with a wide-angle tuning capability.
Dec. 25, 2022Vol. 49 Issue 24 2408002 (2022)
Jie Zheng, Dongyuan Liu, Qi Zhang, Limin Zhang, and Feng Gao
ObjectiveEarly-stage detection and treatment of mucosal tissue lesions are effective means for curbing mucosal cancer. Histopathological examination is the gold standard for the clinical examination of mucosal tissue lesions. However, this method is invasive and easily affected by doctors' experience and is unsuitable for large-scale and rapid screening of precancerous lesions. Spectral technologies can detect the changes in optical properties caused by the morphological changes of mucosal tissue cells in a real-time, in vivo, and noninvasive way, and can objectively analyze them using reasonable algorithms, which provides low-cost and large-scale screening of mucosal tissue lesions. In this study, we develop a mucosal lesion diagnosis system using joint sub-diffusive domain diffuse reflectance and fluorescence spectroscopy to improve sensitivity and specificity. The system can efficiently collect diffuse reflectance and autofluorescence spectra of mucosal tissues at varying depths. Furthermore, it extracts the characteristics of spectral data to realize the rapid screening of mucosal lesions and the real-time diagnosis of malignant tumor grade.MethodsIn this study, the mucosal lesion diagnostic system is composed of a light source module, detection module, main control module, man-machine interface module, and an optical fiber probe to measure the joint spectrum signal and real-time analysis and display tissue lesion information. First, we evaluate the stability of the light source module of the system using phantom experiments. Next, the in vitro experiments are conducted to verify the ability of the system to distinguish different tissues, including chicken and pork tissues. In the spectral pretreatment, the spectral data are preprocessed by smoothing and normalization to eliminate the system and environmental noise. Furthermore, the first derivative, principal component analysis, kurtosis, skewness, mean, and variance are used as input information for subsequent tissue classification to extract spectral features and realize the feature extraction. Next, we employ the support vector machine to distinguish the spectral characteristics of different tissues due to its advantages in dealing with small sample pattern recognition. To further verify the effectiveness and recognition ability of the proposed system, we conduct in vivo experiments on the human oral mucosa. The diffuse reflectance and autofluorescence spectra of the lower lip and tongue mucosal tissues are collected for tissue spectrum comparison.Results and DiscussionsThe results of the phantom experiments show that the proportion of the intensity standard deviation of the two LEDs in the overall intensity is below 1%, implying that the system has excellent measurement stability (Fig. 7). The in vitro tissue experiments show that the system has excellent classification ability (the classification accuracy of different tissues is above 98%; the classification accuracy of different parts in a specific tissue is above 74%) (Tables 1 and 2). The in vivo experiments preliminarily verify the application potential of the system in mucosal tissue diagnosis and classification (Fig. 10).ConclusionsIn this study, we develop a mucosal lesion diagnosis system using joint sub-diffusive domain diffuse reflectance and fluorescence spectroscopy, which is noninvasive, operates in real-time, and is cost effective. First, the phantom with stable diffuse reflectance verifies that the system meets the required steady-state measurement. Next, the classification results of different tissues by the diffuse reflectance and autofluorescence spectra verify that our proposed system can realize the classification of different in vitro tissues. Finally, the in vivo experiments on human oral mucosa preliminarily verify that the system has the ability of in vivo detection. In the future, the detection of diseased mucosal tissue will be performed to further explore the clinical potential of the developed system. These findings support the utility of the system. In conclusion, the system provides strong systematic support and is an important method of reference for low-cost, large-scale screening of precancerous lesions of mucosal tissue.
Jan. 01, 1900Vol. 49 Issue 24 2407101 (2022)
Min Wang, Shuo Meng, Jianghui Guo, and Ting Li
ObjectivePulmonary embolism (PE) is a clinical and pathophysiological syndrome in which an endogenous or exogenous embolus occludes the pulmonary artery or its branches, causing pulmonary circulatory impairment that can lead to severe pulmonary infarction, usually accompanied by cardiovascular disease. Currently, the most accurate method for detecting PE is digital subtraction angiography (DSA) of the pulmonary arteries. However, this detection method is invasive and can easily damage blood vessels or surrounding tissues and often causes additional complications. Therefore, non-invasive, real-time, and accurate detection of pulmonary artery hemodynamics is highly desirable. Near-infrared spectroscopy (NIRS) is a simple, rapid, portable, and relatively inexpensive technique for non-invasive deep-tissue hemodynamic monitoring, which is based on the spectral characteristics of oxyhemoglobin (HbO2) and deoxyhemoglobin (Hb), which are characteristics used to quantify tissue hemoglobin oxygen saturation for disease measurement. In recent years, an increasing number of research groups have chosen to use NIRS to monitor human diseases, and it has been validated for use in studies involving many tissue sites in the body. However, the study of photons in the human pulmonary artery site has not been conducted in depth. Therefore, the feasibility of using NIRS to detect pulmonary artery embolism is investigated in this study.MethodsIn this study, we used 80 photographic images from the Visual Chinese Human (VCH) dataset slices to map the thoracic tissue region of the pulmonary artery from top to bottom to build a 436×420×80 voxel thoracic photographic model (Figure 1). Each voxel is defined as a 0.4 mm×0.4 mm×0.4 mm cube. The entire model is divided into eight parts based on tissue type, including skin, muscle, bone, subcutaneous fat, lung, pulmonary artery, arterial blood, and venous blood. The constructed model is then loaded into a software program developed by our team for Monte Carlo simulation of light propagation in Voxelated Media (MCVM). MCVM generates two files: a photon absorption data file and a photon escape data file at the body surface, from which we can calculate a series of evaluation metrics to better evaluate the relationship between photon propagation and the separation of the light source and detector (LSD) in the VCH chest model.Results and DiscussionsAccording to photon absorption data, photons pass successively through the skin, fat, muscle, adipose tissue, and pulmonary artery to the venous blood. The intensity when reaching the pulmonary artery is estimated to be 45 voxel (Figure 3), which is sufficient to demonstrate that photons can cross the thoracic cavity and penetrate the experimental region of interest. Four indicators are introduced to study the optimized light source and detector distance: differential optical path-length factor (DPF), partial path-length factor (PPF), the ratio of PPF to DPF, and the proportion of photon absorption in the pulmonary artery. DPF increases exponentially with the increase of LSD,whereas the three other indicators (PPF, the ratio of PPF to DPF, and proportion of photo absorption in the pulmonary artery) trend upward and then downward, with the peak occurring in the 2.8-3.1 cm LSD range (Figure 4). Based on the above results, we selected 2.9 cm to study the effects of different degrees of pulmonary embolism on SSD (Table 3) and on the intensity of light detected on the body surface (Figure 5). As pulmonary embolism progressively worsens, the percentage of SSD present in the pulmonary arteries decreases (0.0131%, 0.0129%, 0.0127%, and 0.0126% in healthy, Level Ⅰ, Level Ⅱ, and Level Ⅲ subjects, respectively). The SSD proportions in arteriovenous blood and lungs were then evaluated for different degrees of pulmonary embolism. The results indicate that the proportion of SSD in the lung and venous blood gradually decreases as the degree of pulmonary embolism increases. However, the proportion of SSD in the arterial blood is almost zero. These results suggest that venous blood and lung tissue influence the sensitivity of the total assay. A one-dimensional linear regression analysis was performed by standardizing the light intensity of the measurement in the normal state and different embolic levels as independent variables. The results indicate that the standardized light intensity decreases with increasing levels of pulmonary embolism. Thus, the level of pulmonary embolism can be approximated using the detected light intensity.ConclusionsThis study implements noninvasive optical monitoring of pulmonary artery embolism based on the Visible Chinese Human dataset and use of Monte Carlo simulations. By simulating light migration in human thoracic tissues, the number of absorbed photons and the light fluence distribution in the thoracic tissues are derived, and the evidence suggests that some of the photons can reach the pulmonary artery, indicating that the proposed technique is feasible. In addition, this study proposes an optimized separation distance between the light source and the detector and concludes that a separation of 2.8-3.1 cm may be optimal based on two path length factors, PPF and DPF. The effect of pulmonary artery embolism on photon detection is verified based on SSD estimates at the pulmonary artery and the output photon intensity. The results indicate that the SSD at the pulmonary artery decreases with increasing embolization. Furthermore, light intensity directly correlates with the degree of embolization, and the presence of embolization can significantly decrease the light intensity, therefore indicating the presence of emboli in the pulmonary artery. Overall, this study demonstrates the great potential of NIRS for continuous bedside monitoring of pulmonary embolism.
Dec. 25, 2022Vol. 49 Issue 24 2407103 (2022)
Ting Yang, Lina Sun, Guopeng Dai, Xiaofeng Lü, and Xiaoduo Wang
ObjectiveThe study of single cell is of great significance in the fields of cell heterogeneity, genetic metabolism, genetic engineering, and toxicity detection. To identify the functional characteristics of individual cells, individual cell capture must first be achieved. However, most trapping methods require a constant force to keep the cell trapped. When the force decreases or disappears, the cells easily revert to a disordered state, which is very harmful to subsequent characterization and analysis. Therefore, a method for capturing individual cells stably without the use of constant external forces is expected to open up a new avenue for single cell research. This paper proposes a method of rapid capture of single cell during the self-assembly process of micropillars based on femtosecond laser multiphoton processing technology and the principle of capillary force self-assembly. It has fast capture, convenient operation, and a broad application range, and has a lot of potential in bioengineering, drug analysis, and other fields.MethodsHigh aspect ratio micropillars were prepared by single-pulse femtosecond laser multiphoton polymerization. The height and space of the micropillars can be adjusted by moving the micro/nano translation stages vertically and horizontally. The laser-processed sample was developed upside down by a developer for 6 min to remove the photoresist in the unprocessed area. After the sample was developed, it was washed in isopropanol solution for 10 min to remove any residual developer. To prevent the self-assembly of the sample after developing and cleaning, we put it into a PBS solution immediately. The sample was sealed and degassed for 8 h before being disinfected. Drop the cell solution directly above the micropillar arrays with a density of 1.2×10⁵ cell/mL. After seeding cells, the sample was placed in the cell incubator for 2 h to allow the cells to fully adhere to the Petri dish and fall into the bottom of the micropillar gap. Subsequently, the uncapped cells were washed off with trypsin, and the sample was processed using living dead staining. Using a pipette gun, remove the liquid and allow the residual solution to evaporate naturally. The cells between the micropillars were captured during the self-assembly process of micropillars.Results and DiscussionsThe micropillar structure with a high aspect ratio has a large diameter at the bottom and gradually shrinks to the top, showing a conical shape (Fig. 1). The bottom diameter of the micropillar gradually increases as the height and laser power increase. By shortening the distance between micropillars, increasing the distance between self-assembly structures, and reasonably adjusting the height of micropillars, the micropillars close to each other can be self-assembled based on capillary force, to realize the high-efficiency preparation of largescale three-dimensional (3D) complex patterned self-assembly structures (Fig. 2). The experiment of micropillars’ self-assembly driven by capillary force to capture microspheres shows that the micropillars can still be self-assembled into microcage structures when there are particles in the micropillar gap (Fig. 3). Based on the above methods, a single cell array capture experiment was carried out. The results of fluorescence imaging and scanning electron microscope (SEM) images show that this method can realize high-throughput in situ capture of single cell array simply and efficiently (Fig. 5). Additionally, the cell capture experiment of microcage composed of a different number of micropillars provides a relatively simple method for sorting, capturing, and in situ observation of cells of different sizes (Fig. 6). The four micropillar microscage can only capture cell with similar diameter of the microcage, providing a new method for cells sorting. The six micropillar microscage can capture different sizes of cells, and single cell analysis experiment can be carried out by the micropillars’ gap. The eight micropillar microscage can strictly restrict the captured cell well in the microcage and is expected to be used in domain-limited growth characteristics research of single cell.ConclusionsTo meet the application requirements of high throughput single cell capture, a domain-limited passive capture method of single cell arrays based on self-assembly of a micropillar array is proposed. Based on femtosecond laser single pulse multiphoton polymerization technology and the capillary force self-assembly principle, this method realizes the high-throughput in situ capture of the MCF-7 single cell array. Using femtosecond laser single pulse multiphoton polymerization to achieve the high-efficiency preparation of micropillar arrays with a high aspect ratio. By optimizing the spacing and height of micropillars as well as largescale path planning, high throughput capillary force self-assembly of a largescale 3D complex microcage structure was achieved. The in situ capture of a single cell array based on capillary force self-assembly was successfully realized by matching the structural parameters of the microcage with the size of the cells. Different from the traditional single cell capture methods, such as single cell orientation capture method previously proposed by us, this method provides a relatively simple and efficient method for the sorting, capture, and in situ observation of cells with different sizes without the need for continuous additional external force. It has various application prospects in the fields of bioengineering, pharmaceutical analysis, and other domains.
Jan. 01, 1900Vol. 49 Issue 24 2407104 (2022)
Tingdan Luo, and Yiming Li
SignificanceSingle-molecule localization microscopy (SMLM) is widely used for 3D spatial resolution of subcellular structures. Traditional single-molecule localization analysis methods rely on point spread function (PSF) model fitting, which restricts the application of some more complex PSF models. The emergence of deep learning is gradually changing the analysis methods of single-molecule localization, which is expected to be used to analyze complex PSF models and can provide new directions and ideas.ProgressTo break through the diffraction limit, various super-resolution fluorescence microscopy techniques have been developed for nanoscale imaging in recent years, making it possible to observe the interactions between individual molecules inside cells. Several imaging methods have emerged to achieve high resolution beyond the optical diffraction limit, including structured illumination microscopy (SIM), stimulated emission depletion (STED) microscopy, and SMLM. Among them, SMLM is widely used in the study of organelles and protein structures. The main idea of SMLM imaging is to avoid the overlapping of multiple point light sources in the diffraction-limited area, and control the imaging area with activation light and excitation light to emit only a small number of random and discrete single fluorescent molecules each time.With the development of deep learning, a large number of excellent network frameworks have emerged, which have achieved good results in the field of computer vision, for example, convolutional neural network (CNN) widely used in feature extraction, recurrent neural network (RNN) for time series data extraction, generative adversarial network (GAN) for generating data, and so on. Developed super-resolution microscopy techniques combined with deep learning have achieved good results. Depending on the type of input data and target output data, SMLM image data analysis employs various efficient and well-performing neural network architectures. Currently, deep learning has been widely used to extract single-molecule localization from diffraction-limited images. Compared with traditional model fitting methods, deep learning can greatly reduce the processing time while ensuring a certain accuracy. By learning the structural redundancy of similar images, deep learning can reconstruct high-quality super-resolution images from sparse images. This approach can minimize phototoxicity and facilitate super-resolution imaging of live cells. Deep learning solves the limitation of traditional methods in high-density single-molecule localization and improves the localization accuracy. Additionally, employing deep learning-based methods is of great help in extracting various hidden molecular information, such as single-molecule axial position and emission color information, which can improve the localization and spectral accuracy.For specific application scenarios, deep learning is used to model complex mathematical models by data training method, and the network is optimized by loss function, which makes many complex PSF designs possible. PSFs usually contain rich multidimensional information, such as transverse and axial position, emission wavelength, color and so on. Using deep learning can fully extract the information contained in PSFs, thereby improving localization accuracy.Deep learning is a data-driven feature extraction method. By learning a large number of samples, a deep and specific feature representation of the dataset can be obtained. So diversity of data is extremely important. Different from the traditional natural image dataset, the desired single-molecule image can be simulated by the simulator. The emergence of a large number of excellent single-molecule data simulators also provides a favorable tool for the combination of deep learning and single-molecule localization.Conclusions and ProspectsDeep learning has had a huge impact on computer vision and image processing, and has become an emerging and powerful tool for image analysis. Recently developed super-resolution microscopy techniques combined with deep learning have achieved good results. Depending on the type of input data and target output data, SMLM image data analysis employs various efficient and well-performing neural network architectures. For the combination of single-molecule localization and deep learning, we analyze it from three aspects: dataset, network framework, and loss function.Deep learning is a method that relies on training data to extract features from a large amount of data to obtain target results. For example, deep learning algorithms based on sparse image reconstruction often rely on the biological sample structure of the training dataset. Data mismatches need to be taken into account when training with deep learning, while developing methods that are aware or robust to differences between test and training data is needed. On the other hand, the similarity between the data simulation and the real data is improved, and the error is reduced. Considering the characteristics of single-molecule datasets and the training difficulty, number of parameters and training time of the network, transfer learning is a feasible method. Considering the structural similarity of the single-molecule datasets, retraining on the pretrained network will greatly reduce the training time and training difficulty. In addition to the feature of structural similarity, the input of the network is a continuous frame with time sequence. According to this feature, the RNN-type network can better extract features. For the loss function, we need to consider these issues. When constructing the loss function, we need to consider whether the components of the loss function are correlated, whether a simple summation can be performed, and how to choose the weights of different parts. Deep learning algorithms have had a huge impact on many fields of scientific research. We expect deep learning to be more deeply integrated with single-molecule localization and achieve more remarkable achievements.
Jan. 01, 1900Vol. 49 Issue 24 2407206 (2022)
Haoxin Liu, Yuanmeng Zhao, Cunlin Zhang, Fengxia Zhu, and Moxuan Yang
ObjectiveCone beam computed tomography (CBCT) has played an important role in the diagnosis of oral diseases. However, it remains a very important research issue in stomatology to obtain accurate information of teeth from complex original scanning images. Because of the complexity of the human oral environment, various human tissues, especially dental bones, seriously affect the teeth segmentation algorithm. This problem is particularly obvious in the image regions around the roots of the teeth. Moreover, tooth fillings also seriously interfere with the operation of the algorithm. Therefore, compared with other image segmentation algorithms, the current core requirement of teeth image segmentation algorithms is higher segmentation accuracy. The algorithm should have the ability to accurately segment targets out of objects with similar gray levels in various interferences. Conventional image segmentation algorithms such as U-net algorithm and Mask R-CNN algorithm cannot achieve the required segmentation accuracy. The main purpose of this paper is to research and propose a method of teeth image segmentation and three-dimensional (3D) reconstruction from CBCT images. We construct CBCT image dataset from original images and realize 3D teeth image reconstruction through programming and training.MethodsWe use a novel segmentation algorithm based on an improved U-net network, for which the spatial attention mechanism is introduced into conventional artificial neural network. Spatial attention mechanism can effectively enhance the features of teeth and suppress unimportant features to improve the recognition ability of the network, which can help us to segment teeth more accurately. Combined with the isosurface extraction algorithm, the accurate segmentation and three-dimensional reconstruction of teeth CBCT images are realized. First, we use Labelme software with the patient data collected from medical institutions to create a human oral CBCT dataset, and then we train the model using the improved U-net network. Second, we use the trained model to segment the images to obtain images that only retain the teeth information. Third, the results are reconstructed to create a three-dimensional model of the teeth by Marching Cubes algorithm.Results and DiscussionsWe applied the new method proposed in this paper to the CBCT tomographic images, and obtained the image segmentation and reconstruction results. We actually tested the segmentation and recognition effect of the algorithm, and got the MIoU parameters of the model, as well as the image segmentation and reconstruction effect. The MIoU parameters of the improved U-net network and the original U-net network were compared. It could be seen that the improved algorithm has 0.064 higher recognition effect on teeth, 0.002 higher recognition effect on background, and 0.033 higher overall recognition effect. The quantitative analysis of MIoU parameters showed that the improved algorithm has better recognition ability. Compared with the actual teeth image segmentation recognition effect, it could be seen that the newly proposed algorithm in this paper has better recognition effect and can effectively recognize the image under the influence of tooth fillings. Compared with the 3D model reconstructed by MicroDicom Viewer software, it could be seen that the teeth had been effectively reconstructed, and the contour, relative position and the roots of the teeth can be clearly seen. In contrast, the roots of the teeth are difficult to distinguish in the original CBCT data, because they are often close to the jaw. In addition, the reconstructed image of this experiment had clear and complete contour, and there was no fault. The above experiments used the CBCT data of an impacted wisdom tooth patient. After applying our reconstruction algorithm to the data, the patient’s oral condition could be clearly seen from the side. It was obvious that the growth direction of the innermost two teeth of the patient is completely different from that of the normal teeth, especially the impacted tooth below. In summary, the experimental results showed that the method proposed in this paper has a good application effect in the field of oral medicine.ConclusionsThe experimental results showed that the improved network can accurately recognize teeth from the original image, and has better recognition ability than the original U-net network; besides, the novel network can accurately recognize teeth under the interference of tooth fillings. Compared with the 3D model reconstructed by MicroDicom Viewer software, the final reconstructed 3D model has a clearer and more complete contour, and can more realistically reproduce the patient’s tooth conditions. The experimental results also showed that this method can effectively extract tooth information, which is helpful to the diagnosis and treatment of oral diseases, especially tooth diseases. The trial feedback of this method testing in the cooperative hospital is quite terrific, and the effect of helping stomatologists to diagnose and treat is significant. The research findings of this paper are expected to make greater contributions in the field of oral health in the future.
Jan. 01, 1900Vol. 49 Issue 24 2407207 (2022)
Qingdian Lin, Dongdong Song, Jun Yu, Zhe Zhang, Hualong Zhao, Yishan Wang, Feng Li, Xiaoyang Guo, Cangtao Zhou, and Shuangchen Ruan
Dec. 25, 2022Vol. 49 Issue 24 2416001 (2022)
Yan Sun, Fan Wang, Yafei Wang, Qiubai Yang, Xin Wang, Shubin Chen, Chunlei Yu, and Lili Hu
Dec. 25, 2022Vol. 49 Issue 24 2416002 (2022)
Jianhong Shi, Tianyi Du, Gaiming Ma, Qixin Zhu, Huixuan Hu, Rui Liu, Yingbin Xing, Jinyan Li, and Dapeng Yan
Dec. 01, 2022Vol. 49 Issue 24 2416003 (2022)
Xiulu Hao, Yang Li, Chenchen Fan, Zhiyong Pan, Jinyong Leng, Tianfu Yao, and Pu Zhou
Jan. 01, 1900Vol. 49 Issue 24 2416004 (2022)
© Copyright 2018-2021 | Chinese Laser Press.
All Rights Reserved 沪ICP备15018463号-20