


Please enter the answer below before you can view the full text.

Ling Qin, Dongxing Wang, Mingquan Shi, Fengying Wang, and Xiaoli Hu
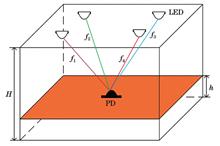
ObjectiveRecently, with the advancement of science and technology, public desire for indoor positioning services has grown significantly. Thus, most researchers have turned their attention to indoor positioning technology. Visible light is harmless to the human body, does not interfere with other electronic devices, and has a low effect by multipath reflection; it can be employed as the information carrier of the indoor positioning system. Thus, visible light positioning is one of the most promising indoor positioning technologies. LED lights are frequently employed in indoor positioning studies because of their high cost performance, high broadband, and long service life. With the maturation of machine learning technology, the application of machine learning algorithms to indoor visible light localization has become the focus of several scholars’ research, and good localization results have been obtained. To further enhance the accuracy and stability of indoor visible light localization, this study proposes an indoor visible light localization system based on a genetic algorithm-optimized extreme learning machine (ELM) neural network. The genetic algorithm can efficiently enhance the stability of the ELM neural network, which in turn improves the global localization accuracy.MethodsFirst, the fingerprint database was constructed. In this research, 441 sets of data were selected as the training set and 225 sets of data were employed as the test set. Second, the training set was employed as the ELM neural network input, which was fed into the neural network for training. Since the ELM neural network was prone to local optimum and instability, its weights and thresholds were sought out using a genetic algorithm during training, and the optimal weights and thresholds were found and assigned to the ELM neural network after selection, crossover, and variation operations. Then, the test set was sent into the trained neural network, which predicted coordinate points. Finally, the error between the actual and predicted locations was computed to examine the localization performance of the system.Results and DiscussionsThe average localization errors of the receiver were 1.39, 2.23, 3.75, and 6.64 cm at the test heights of 0.2, 0.4, 0.6, and 0.8 m, respectively, and the maximum localization errors were 6.86, 11.04, 16.41, and 24.11 cm, respectively. As the height of the receiver increases, the channel gain decreases because of the increasing emission angle of the LEDs as well as the reception angle of the receiver, which causes the optical signal to fade and decreases the optical power received by the receiver, thereby decreasing localization accuracy. In the experimental situation, the indoor localization system based on a genetic algorithm-optimized ELM neural network (GA-ELM) achieved an average localization error of 0.9214 cm and a maximum localization error of 3.9192 cm. Compared with the findings obtained from the indoor positioning system based on the ELM neural network, which show an improvement of 86.1% on the average localization error and 70.16% on the maximum localization error, the average localization error of the GA-ELM positioning algorithm reached the millimeter level. Furthermore, this research compares the algorithm with the BP neural network, support vector machine (SVM), and GA-BP algorithms. The maximum and average localization errors of the proposed algorithm are significantly smaller than those of the other three algorithms. Finally, the average localization time of the GA-ELM algorithm is compared with the other three algorithms to illustrate the timeliness of the GA-ELM algorithm, and the average localization time needed by the GA-ELM algorithm is 0.04235 s. Compared with the SVM, BP, and GA-BP algorithms, the localization time of the proposed algorithm is shortened dramatically, indicating that the proposed algorithm is better in terms of timeliness.ConclusionsIn this research, a multi-LED light localization system with a genetic algorithm-optimized ELM neural network is employed to obtain indoor high-precision localization. The received optical power value of PD is measured through the direct line-of-sight link to establish the fingerprint database in the offline stage. In the online stage, the fingerprint data are introduced into the optimized ELM neural network to complete the localization. In this study, the performance simulation and experiments of the localization algorithm are performed in a space of 4 m×4 m×3 m. The simulation findings reveal that the average localization error of the localization algorithm employed in this study increases as the receiver height increases, and the experimental findings reveal that the average localization error of the localization algorithm employed in this research is 0.9214 cm and the maximum localization error is 3.9192 cm, which is comparable to ELM, GA-BP, SVM, and BP, improves the localization accuracy, and has broader range of application than ELM, GA-BP, SVM, and BP. From the domestic and international investigation studies over the past 1 or 2 years, there are substantial enhancements in localization accuracy using various localization algorithms in various environments, which are highly applicable. The investigation in this paper is at a high level in terms of localization accuracy, and a significant improvement is observed in the stability of the system.
Jan. 01, 1900Vol. 49 Issue 21 2106001 (2022)
Lingyi Xin, Xuefang Zhou, Meihua Bi, Guowei Yang, Miao Hu, Haozhen Li, and Tianshu Wang
ObjectiveFiber comb filters are widely concerned because of simple structure, low cost, strong stability, and strong compatibility with optical fiber communication systems. A common application scenario for fiber comb filters involves multiwavelength fiber lasers ( MWFLs ). Generally, an all-fiber comb filter is fixed with a constant channel interval that is challenging to meet the needs of tunability in some practical uses. In previous research, our team has conducted detailed theoretical studies and transmission characteristics tests on a double Sagnac loop and experimentally verified its viability in channel interval switching when used in MWFL. In this research, we unravel the double Sagnac loop and transform it into a novel dual Lyot filter based on parallel polarization-maintaining fibers. The findings of theoretical analysis and experimental tests demonstrate that the channel interval is switchable and the extinction ratio is tunable with the polarization controller’s adjustment. The MWFL based on the dual Lyot filter is capable of generating a multiwavelength output with two various channel intervals. This research may provide some references for scholars who engage in the study of MWFL with high flexibility.MethodsFirst, the designed dual Lyot filter’s transmission function is derived based on the theoretical analysis and the transfer matrix theory. Then, the transmission spectrum is simulated using the Matlab software. The channel interval switch function is confirmed from a theoretical perspective. By replacing the polarization-maintaining fibers (PMFs), various wavelength interval combinations can be accessible, further confirming the filtering structure’s flexibility in obtaining channel interval switching. After that, the impact of the polarization controller (PC) before PMF on the extinction ratio ( ER ) of the transmission spectrum is discussed. Furthermore, a PC is added to the proposed filter to optimize the filter’s ER performance and tunability. Moreover, to confirm the theoretical conclusion, the experimental measurement of the transmission spectrum and the performance comparison of the filter before and after the optimization are conducted. Finally, a multiwavelength fiber laser based on the optimized filter is experimentally demonstrated, and its channel interval switch ability is confirmed in the laser system.Results and DiscussionsThe dual Lyot filter’s transmission function (Eq. 10) is derived using a transmission matrix. The filter’s simulation transmission spectrum is drawn to simulate channel interval switching (Fig. 2) with the following parameters: the coupling coefficient k1=k2=0.5, the two PMFs’ birefringence BPMF1=BPMF2=5.1×10⁻⁴, and the PMFs’ lengths L1=7.2 m and L2=13.5 m. When the polarized light’s angle to the fast axis of PMF2 is a multiple of π/2, the filter’s channel interval is produced by PMF1 with a length of 0.65 nm. Similarly, when the polarized light’s angle to the fast axis of PMF1 is a multiple of π/2, the channel interval is 0.35 nm produced by PMF2. The simulation findings are consistent with the theoretical computation. Changing the characteristics of two parallel PMFs with the following parameters: BPMF1=4.0×10⁻⁴, BPMF2=5.1×10⁻⁴, L1=6.6 m, and L2=10 m. Two new channel intervals of 0.91 nm and 0.47 nm can be obtained (Fig. 3). In addition to the switching of channel interval, the PC can be adjusted for the ER turning. The filter transmission spectrum’s ER varies sinusoidally as the polarized light’s angle to the PMFs’ fast axis (x-axis) increases (Fig. 4). In the transmission characteristic experiment, the same PMFs as Fig. 2 are taken to compare the filter’s maximum amplitude before and after optimization (Fig. 6). The transmission spectra with the channel intervals of 0.65 nm and 0.34 nm obtained agree with the simulation findings. The optimized filter demonstrates a better ER and tunability. An experiment is performed to confirm that the dual Lyot filter allows channel interval switching in laser applications (Fig. 7). In the experiment, the highly nonlinear fiber is 105 m long, the coupling ratio of OC3 is 10: 90, and the rest device parameters are the same as those for testing transmission characteristics. Modifying the PC gives two multiwavelength laser outputs with channel intervals of 0.65 nm and 0.34 nm, respectively (Fig. 8). The two laser outputs’ channel intervals are consistent with the channel interval measured by the filter transmission spectrum.ConclusionsIn this research, an all-fiber comb filter with a switchable channel interval is proposed based on theoretical derivation and experimental verification. The filter’s channel interval is determined by the PMFs connected in parallel in the dual Lyot filter. By replacing the PMFs, various wavelength interval combinations are accessible, meeting the requirements of diverse application situations. Careful adjustment of the PC allows the channel interval switching and the ER’s tuning. The experimental findings show an optimized turnability by adding a PC to the filter. Moreover, the filter’s practicality is further shown using the designed filter with a multiwavelength fiber laser. The two PMFs’ length difference in the filter is preferable in the unit of meter. Additionally, it is challenging to switch the channel intervals if they are very close, because of the challenges of observing the polarization state in the optical path. However, for the close channel intervals, the filter under this structure is better to be used as a component of a highly sensitive sensor with a vernier effect rather than a wavelength selection element of MWFL with a flexible channel interval. In conclusion, the dual Lyot filter has considerable uses in MWFLs, dense wavelength division multiplexing optical networks, and fiber optic sensors.
Jan. 01, 1900Vol. 49 Issue 21 2106002 (2022)
Zhenfei Yuan, Jin Jiang, Zhiwei Cheng, Xin Du, Baixin Qi, Qiang Wu, Shunhua Yang, and Rongshi Xiao
ObjectiveGH3128 has the benefits of strong heat, pressure, and corrosion resistance, and is extensively employed in high-temperature components of active thermal protection structures in the aerospace field. Laser welding is the primary manufacturing process of active thermal protection components, and the lap joint is the primary joint form. The thermal load condition of the active thermal protection components is harsh, which puts forward higher demands on the high-temperature mechanical properties of lap joints. In this study, in view of the joint forms and high-temperature short-time work characteristics of active thermal protection components, the microstructure and mechanical properties of GH3128 lap joints under different vacuum heat treatment conditions are investigated on the basis of fiber laser non-penetrating deep fusion welding process under the condition of side blowing protection.MethodsThe test materials are GH3128 plates with the solution state, the upper plates' size is 200 mm×150 mm×1 mm, and the lower plates' size is 200 mm×150 mm×2 mm. The light source is a fiber laser with a wavelength of 1060-1070 nm. The beam focusing parameter is Kf=8 mm· mrad, the transmission fiber core diameter is 200 μm, the output coupling collimator's focal length is 200 mm, and the focusing lens' focal length is 300 mm. High purity Ar gas is employed as the protection gas, and the flow rate is 8 L/min. The nozzle's inner diameter is 8 mm, the phosgene spacing is 2 mm, the nozzle's output length is 6 mm, and the protective gas output angle is 50°. The welding process parameters are as follows: the laser output power is 1500 W, the welding speed is 2 m/min, and the defocusing is 0. After welding, the mechanical properties of GH3128 lap joints are tested, and the GH3128 lap joints are subjected to 900 ℃ vacuum heat treatment with different cycles.The weld is corroded with aqua regia (6 mL HCl+ 2 mL HNO3), cleaned with alcohol, and used as a metallographic sample. An optical microscope is employed to observe the weld morphology. The fracture and microstructure are observed using a scanning electron microscope. The weld hardness is tested using a microhardness tester with a load of 100 g and loading time of 15 s. The tensile testing machine is employed to test the tensile properties of each batch of samples at room temperature. The tensile testing machine is employed to test the weld's tensile properties at 900 ℃. At 900 ℃, the equipment is employed to test the weld's creep property. The tensile force is 800 N and the time is 6 h.Results and DiscussionsThe joints are typical "nail head" weld shapes in deep fusion welding, and there are circular sporadic pores near the weld's root at the joint surface's lower part. The joint microstructures are primarily columnar crystals, symmetrically dispersed along the weld center line, and the growth direction is perpendicular to the fusion line (Fig. 4). The columnar crystals near the "nail head" at the upper part of the weld are longer compared with the columnar crystals at the joint surface and the lower weld. After vacuum heat treatments with different cycles, the weld joint's grain size becomes larger and there are no microcracks around the porosity.The microhardness of lap joints under different heat treatment cycles is higher than that of the base metal, and the microhardnesses of the weld joints and base metal have no visible change (Fig. 6). The tensile properties demonstrate that the GH3128 lap joints' tensile strength at high temperatures decreases by about 50% compared to that at the room temperature. After different heat treatments, the joint's tensile strength at the room temperature increases by about 35%. The joint's tensile strength increases by about 20% at 900 ℃ (Fig. 7). Vacuum heat treatment can enhance the joints' tensile strength, but the number of heat treatment cycles has little impact on the joints' tensile strength at room temperature and high temperature. The creep property test findings demonstrate that the creep curve's slope of joints without heat treatment is the largest. The slope of the joints' curves after heat treatment increases slightly with the increase in numbers of heat treatment cycles, but it is far less than the slope of the specimen's creep curves without heat treatment (Fig. 10).The microstructure of lap joint faces after heat treatments with different cycles is observed and examined. The findings demonstrate that the microstructure at the joints' central position without heat treatment is primarily made of small columnar dendrites, while the columnar dendrite structure at both sides of the central line of the joints is slightly larger in size. After the first heat treatment, the grain boundaries of coarse equiaxed grains appears at each position of the joint interface, and the dendrite structure demonstrates the sign of melting. After heat treatments with five cycles, the columnar dendrite structure at each position of the interface melts within the equiaxed grain. After each heat treatment, there is no microcracks on the bonding surface (Fig. 12). After heat treatment, the joints' coarse equiaxed grain may be the reason for enhancing of tensile and creep properties of joints at high temperatures.ConclusionsCompared with the joints without heat treatment, the tensile properties of GH3128 lap joints at room temperature and high temperature increase by 35% and 20%. Simultaneously, the joints' creep property is significantly enhanced, and the joints' maximum creep strain decreases from 1.08%(without heat treatment) to 0.12%( after heat treatments with five cycles). The analysis of the joints' microstructure demonstrates that the joints' grain size becomes larger and the dendrite structure in the grain is gradually melted after heat treatments with five cycles. After heat treatments with five cycles, the joints' microstructure is coarse equiaxed grain, and the dendrite structure is entirely melted. The joints' fracture morphology demonstrates that there are "parabolic" dimples on each fracture, and the opening direction is consistent with the direction of the tensile force, demonstrating ductile fracture characteristics without microcracks. The number of heat treatment cycles has little impact on the microhardness, and tensile properties at room temperature and high temperature. With the increase in the number of heat treatment cycles, the joints' creep properties decrease, and the joints' maximum creep strain increases from 0.05% (after heat treatment with one cycle)to 0.12%(after heat treatments with five cycles).
Jan. 01, 1900Vol. 49 Issue 21 2106003 (2022)
Jiajun Ma, Qingyang Liu, Yanran Lü, Wei Zeng, Yongchao Liang, and Junbiao Jiang
ObjectiveFiber optic gyroscope is a high-precision angular velocity sensor based on Sagnac effect, with the advantages of all solid state, small size, low cost and easy maintenance. It is widely used in national defense, aviation, aerospace and other fields. Due to the characteristics of optical components and environmental factors, the output signal of fiber optic gyroscope is usually a non-smooth, nonlinear random signal. Noise interference in the output signal is the main factor affecting the performance of fiber optic gyroscope. In engineering, low-pass filtering is usually used for the noise reduction of the output signal of fiber optic gyroscope. However, since the frequency bands of effective signal and noise overlap with each other, this method cannot suppress the low frequency noise interference. At present, the main adaptive filters are least mean square (LMS) adaptive filter and recursive least square (RLS) adaptive filter. LMS adaptive filter minimizes the performance function by stochastic gradient descent method, which has the advantages of low computational complexity and easy implementation. Compared with LMS adaptive filter, RLS adaptive filter has obvious advantages in convergence speed, and the adaptation of RLS adaptive filter is also better than LMS adaptive filter under non-smooth random signal conditions. However, RLS adaptive filtering has not been implemented on any hardware platform due to its high computational complexity, which makes it difficult to be applied in engineering.MethodsIn this paper, we analyze the principle of RLS adaptive filtering and propose a real-time noise reduction technique of RLS adaptive filtering for fiber optic gyroscope based on field programmable gate array (FPGA) to address the above problems. According to the principle of RLS adaptive filtering, the most direct parallel operation and the traditional serial operation can be implemented. Parallel operation can complete all operations of a filter in one clock cycle, but it will consume a lot of computing resources. Serial operation requires less computing resources, but it takes more computing time to complete a filter. We design a new alternate storage multiply-accumulate pipeline structure based on FPGA to implement RLS adaptive filtering, which ensures the operation accuracy of RLS adaptive filter by double precision floating point operation, reduces the storage space by tactfully designing the alternate storage structure, and saves the FPGA logic resources by realizing the time-division multiplexing of multiply-accumulate structure with multiple switches. The filtering effects of the LMS adaptive filter and the RLS adaptive filter are experimentally compared under static conditions, and the post-filter performance indexes are analyzed using Allan variance. The difference in delay between the LMS adaptive filter and the RLS adaptive filter is studied under dynamic conditions.Results and DiscussionsThe experimental results show that the RLS algorithm shows a superior performance in noise reduction of the fiber optic gyroscope output signal due to its better adaptability to non-smooth signals. In the low frequency band, the noise amplitude after LMS adaptive filtering is comparable to that before filtering, while the RLS adaptive filter produces a certain degree of noise suppression; in the high frequency band, both the LMS adaptive filter and the RLS adaptive filter produce some suppression of the noise (Fig. 6). Compared with the 10th order LMS adaptive filter, the 4th order RLS adaptive filter improves the fiber optic gyroscope accuracy by about 50% (Table 2). For the swing experiments at 5 Hz and 10 Hz, the delays of RLS adaptive filter are 0.24 ms and 0.25 ms, respectively, while the delays of LMS adaptive filter are 0.38 ms and 0.37 ms, respectively. The delay of the RLS adaptive filter mainly comes from the sample hold of the input signal, which is about 1 sample clock cycle in size, while the delay of the LMS filter mainly comes from the 2nd order averaging of the desired signal on the input signal, which is about 1.5 sample clock cycles in size. Under dynamic conditions, the RLS adaptive filter reduces the phase delay by about 30% compared with the LMS adaptive filter (Fig. 7).ConclusionsUsing the alternate storage multiply-accumulate pipeline structure proposed in this paper, when the system clock is 40 MHz, the RLS adaptive filter can complete the calculation within 3 μs, and the highest sampling rate can reach more than 370 kHz, which can meet the demand of real-time noise reduction of most fiber optic gyroscopes. The research in this paper makes RLS adaptive filtering in fiber optic gyroscope noise reduction technology have engineering practical value, effectively suppressing noise in fiber optic gyroscope output signal and improving its control accuracy in high precision stable tracking platform and high maneuverability aircraft.
Jan. 01, 1900Vol. 49 Issue 21 2106004 (2022)
Jingguo Zhu, Zhenyuan Xu, Ye Tian, Xin Zhang, Ying Yang, Shengheng Zheng, and Wei Han
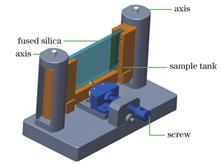
ObjectiveLaser-induced damage to optical components seriously hinders the output ability and operation ability of high-power laser systems, particularly UV laser-induced damage. Various studies on the damage generation and growth of fused silica have been conducted, and it is recognized that laser damage is caused by several kinds of defects, including subsurface cracks, organic pollution on the optical component surface, and so on. Advanced mitigation processes are employed to eliminate the defects and considerably enhance the damage performance of fused silica components. However, the laser damage performances of vacuum windows which are a special kind of fused silica optical component employed in high-power laser systems, is substantially worse than those of other fused silica components. The rear surface of the vacuum window withstands tens of MPa tensile stress to isolate the internal vacuum environment in the target chamber from the external atmospheric environment outside the target chamber, which may influence the damage generation and growth characteristics of the vacuum window. To solve the damage problem of vacuum window in high-power laser systems, it is necessary to investigate the impact of external stress on damage generation and growth of fused silica.MethodsWe employ the Nd∶YAG laser delivering a Gaussian pulse width of 5 ns at 351 nm. Uncoated fused silica samples are investigated in the experiments. First, the sample is placed in a specially made clamping structure (Fig.1) to apply uniform external stress to the sample. Simultaneously, the laser displacement sensor is employed to measure the surface displacement of fused silica sample. Driven by a one-dimensional stepper motor, the surface displacement in the middle area of the sample is sampled. The finite element simulation is conducted using ANSYS software, and the relationship between surface stress and surface displacement is deduced. Next, the 1-on-1 approach is employed to test the laser damage threshold, and the R-on-1 approach is employed to test the growth threshold of the initial damage. For each sample, the damage test is conducted under the condition of external stress, and then the stress is removed for further testing. Simultaneously, to observe the damage phenomenon under each given laser fluence, a CCD camera is employed to monitor the damage after each laser radiation, and an optical microscope with a resolution of 6 μm is used to measure the size of the damage crater ex situ off-line.Results and DiscussionsThe experimental findings reveal that in the case of the tensile stress of 10-50 MPa, the difference in the damage threshold of fused silica with and without stress is less than 4.1% of the minimum (Fig.3), and the average difference between the initial damage point sizes is less than 5.5% of the minimum (Fig.5), indicating that the external tensile stress does not affect the damage threshold and the size of initial damage. The average damage growth threshold of fused silica with and without stress is 3.84 J/cm2 and 3.88 J/cm2, respectively (Fig.6), demonstrating that the external stress does not affect the damage growth threshold of fused silica. This is because the damage to fused silica under ultraviolet laser irradiation is primarily caused by the defect absorbing laser energy, causing the temperatures of the defect and its surrounding local area to rise, and finally resulting in "microexplosion" .The pressure of the shock wave produced by microexplosion can reach 30 GPa, while the external stress applied in the experiment is less than 50 MPa, making it difficult to influence the laser damage process of the material.ConclusionsDamage threshold and damage growth threshold of fused silica under the external tensile stress of 10-50 MPa are experimentally investigated. The findings reveal that the difference in the damage threshold of fused silica with and without stress is less than 4.1% of the minimum, and the average difference in the initial damage size is less than 5.5% of the minimum. In the experiments, no impact of stress on the damage threshold is observed. In addition, the average damage growth thresholds of fused silica with and without stress are 3.84 J/cm2 and 3.88 J/cm2, respectively. No substantial effect of the stress on the damage growth threshold is found. In this study, the effect of external stress on the damage performance of fused silica is studied and the results rule out the effect of external stress on the damage performance of fused silica, providing crucial experimental support for solving the damage problem of vacuum window in high-power laser systems.
Jan. 01, 1900Vol. 49 Issue 21 2101001 (2022)
Qiao Chen, Wenqi Ge, Shengwei Bian, Tianqi Wang, and Jisi Qiu
ObjectiveSolid-state lasers are extensively employed in industrial processing, medical treatment, scientific research, etc. Recently, with the maturity of semiconductor laser devices, solid-state lasers pumped by semiconductor lasers are developing towards higher power and higher beam quality, which is applied to more scenes. However, when the pump power increases, more heat accumulates in the gain medium, resulting in more serious thermal impacts, which will affect the further enhancement of beam quality and laser power. To reduce the thermal effect, different designs, including cryogenically cooled gain medium, direct pumping approaches, and thin disks, are employed. Compared with traditional gain medium configurations including rods and slabs, the thin-disk gain medium has a minimal temperature gradient in the axial direction, which can obtain a high-power laser output with high beam quality. The finite element numerical simulation and experimental tests are carried out to further understand the beam quality degradation and output power limitation caused by thermal effect in the laser diode array side-pumped Nd∶YAG disk. The axial and radial distributions of pump light absorption flux and temperature in the polygon disks with 90° and 45° cutting angles are examined and compared.MethodsThe side-pumped pentagon thin disk gain medium discussed in this study is an Nd∶YAG crystal with a doping concentration(atomic fraction) of 0.3%, and a thickness of 1.5 mm. Five laser diode arrays are symmetrically positioned around the disk, and the pump light is vertically incident on the crystal side through the pump coupling structure. In the pump coupling structure, the fast-axis collimator is employed to control the transmission direction of the fast-axis beam to be nearly parallel, and the coupling structure consisted of the cylindrical lens and reflectors is used to compress the large-area pump light to match the thin disk size. Experiments reveal that the pump light coupling efficiency is 97%. The pump light is transmitted along a zig-zag path through total internal reflection inside the medium, and the pump light is incident from numerous directions overlapping into an approximately circular area in the crystal. The absorption flux distribution of the pump light in the gain medium is nearly flat-topped in the radial direction and approximately Gaussian in the axial direction when the cutting angle of thin disk is 90°. The absorption flux of the pump light is primarily concentrated in the middle of the disk along the thickness direction, resulting in uneven temperature gain of the medium. When the cutting angle of thin disk is 45°, the absorption flux distribution of the pump light is nearly flat-topped in the radial and axial directions, and the heat generation inside the crystal is uniform. A three-dimensional finite element analysis model of a polygonal thin-disk gain medium is created using thermal analysis software. When the average pump power is 165 W, compared to the gain medium with a cutting angle of 90°, the overall radial temperature of the gain medium with a cutting angle of 45° decreases by approximately 5 ℃, and the temperature difference decreases by about 2 ℃. The temperature difference increases with an increase in pumping power. Under various cutting angles, the axial temperature difference is larger. When the cutting angle is 90°, the temperature difference between the front-end and back-end surfaces of the thin crystal is about 12 ℃. When the cutting angle is 45°, the temperature difference between the two ends of the thin disk crystal is 9 ℃.Results and DiscussionsExperimental findings reveal that the fluorescence distribution (Fig. 9), temperature distribution (Fig. 10) and wavefront aberration (Fig. 11) in the gain medium are consistent with theoretical analysis results. The root mean square (RMS) of uniformity of fluorescence distribution in the range with 16 mm diameter is 2.52%. The gain medium's over-temperature distribution is relatively uniform, and the temperature in the inscribed circle of the center is 46-52 ℃. When the pumping power is 165 W, the thermal-induced wavefront distortion of the Nd∶YAG thin disk gain medium is about 0.14λ. Here λ is the test wavelength. Under 220 W pump power, 85 W output power is obtained from the polygonal Nd∶YAG thin-disk laser, with a slope efficiency of 40.1% and beam quality β≈10 (Fig.12).ConclusionsIn this study, numerical simulations and experiments are conducted on a polygonal Nd∶YAG thin-disk gain medium pumped by diode lasers. Experimental findings show that a side-zigzag-pumped polygonal thin disk with 45° cutting angle can achieve a flat-top distribution of energy storage and further reduce the gain medium thermal effect. The thermal effect's reduction in the gain medium is conducive to enhancing the output power of the solid-state laser while maintaining better beam quality.
Jan. 01, 1900Vol. 49 Issue 21 2101002 (2022)
Lizhao Yang, Xiaodong Fang, and Libing You
ObjectiveThe dielectric gas in excimer lasers generates light via glow discharge between the main discharge electrodes, which produces gaseous and solid discharge products and a large amount of heat in the discharge area. Generally, a crossflow fan is used in the laser chamber to maintain and renew the gas flow in the discharge area, thus ensuring that each discharge is not affected by the products and heat from the previous when the laser operates repeatedly. For high-power (> 300 W) excimer lasers, their discharge area is large; moreover, the high-power excimer lasers have higher discharge voltage and frequency than medium- or low- power excimer lasers, so there are higher requirements for the gas flow field between the main discharge electrodes. This article studies a 600 W high-power excimer laser with a laser discharge voltage of up to 30 kV and a discharge repetition rate of up to 600 Hz. Its discharge area generates more discharge products, and has a heat-generation power of close to 50 kW at full power output, so a higher gas-renewal rate is required between the discharge electrodes. Therefore, when developing this high-power excimer laser, the structural design of the discharge chamber and gas-circulation system within it are critical, and flow-field analysis is required to provide a theoretical basis for the design.MethodsA multiple-reference-frame model is used to simulate the steady-state flow field in the laser. In the model, the rotation of the crossflow fan provides all the kinetic energy of the flow field. The flow field simulation adopts the standard k-ε turbulence model. To improve the reliability of the simulation results, we also selected the renormalization group (RNG) and Realizable k-ε turbulence models for simulation calculations and compared the results.Results and DiscussionsFigure 2 shows the numerical calculation results of the flow field in the laser chamber. Figures 2 (a) and (b) show the global flow velocity distribution and absolute pressure distribution, which provide a reference for the access position of the gas-purification system. Figures 2 (c) and (d) show the flow velocity distribution and flow velocity vector diagram in the laser discharge area. The simulation results show that the gas-renewal rate in the discharge area meets the requirements. The uniformity of the flow field in discharge area is ideal. Figure 3 shows the simulation results using the RNG and Realizable k-ε turbulence models. It can be seen by comparing the simulation results that the flow velocity distribution trends in the laser chamber calculated by the standard, RNG, and Realizable k-ε turbulence models are roughly the same. Figure 4 is a comparison diagram of the distribution of flow velocity along the central axis of the electrodes calculated using three different models. The calculated variation trend in the flow velocity on the central axis of the electrodes is nearly the same for all three models. The simulation results show that when the fan speed is 3500 r/min, the average gas velocity in the discharge area is higher than the target value of 32.76 m/s, and the gas velocity is uniform. It is proven theoretically that this set of self-designed gas-circulation system can meet the working requirements of the high-power excimer laser. The average flow velocity of the working gas between the electrodes of the excimer laser tends to be correlated linearly and positively with the fan speed, and the torsional moment of the fan tends to be linearly and positively correlated with the square of the fan speed. This result provides a reference for the power and speed control of the crossflow fan drive motor when the laser operates at different frequencies. Furthermore, the torsional moment of the fan is basically linear with respect to the air pressure in the chamber. This result provides insight into the selection of the structural materials of the cross-flow fan, the requirements of the overall assembly rigidity of the fan, and performance requirements of the magnetic coupler driving the fan.ConclusionsIn this paper, a two-dimensional numerical study of the flow field is carried out for a self-designed high-speed gas-circulation system in the chamber of a high-power excimer laser. The important parameters of high-power excimer laser design, such as the renewal rate of the gas in the laser discharge area, uniformity of the gas flow, pressure distribution in the chamber, and torsional moment of the fan, are discussed. The results provide a reference for the access position of the gas-purification system on the chamber, power and speed control of the motor at different operating frequencies, selection of structural materials for the crossflow fan, rigidity requirements of the overall fan assembly, and performance requirements of the magnetic coupler that drives the fan. The simulation results show that when the fan speed is 3500 r/min, the average gas velocity in the discharge area is higher than the target value of 32.76 m/s, and the gas velocity is uniform. This set of self-designed gas-circulation systems is theoretically proven to be able to meet the working requirements of the high-power excimer laser. It should be noted that we set the cavity temperature to a fixed value and ignore the effect of cavity temperature variation on flow filed. So, our simulation has certain difference with the actual results.
Jan. 01, 1900Vol. 49 Issue 21 2101003 (2022)
Yingying Zeng, Xiaohong Shen, Lin Mao, Tao Wang, Renjiang Zhu, Haijun Luo, Cunzhu Tong, Lijie Wang, Yanrong Song, and Peng Zhang
ObjectiveWavelength-tunable lasers have important applications, particularly in laser spectroscopy, life sciences, environmental monitoring, and information processing. Ultrashort laser pulses produced by mode-locking can be widely used in nonlinear frequency conversion, medical diagnosis, high-speed electro-optic sampling, and laser micro/nano fabrication. Wavelength-tunable mode-locked lasers combine the advantages of these two types of lasers and enable the development of multiple applications such as fluorescence excitation, laser spectroscopy, optical frequency combs, and super-resolution microscopic imaging. External-cavity surface-emitting lasers possess the advantages of both solid-state disk lasers and surface-emitting semiconductor lasers and can simultaneously produce high power with good beam quality. In this study, a wavelength-tunable Kerr mode-locked external-cavity surface-emitting laser is proposed. Wavelength-tuning and mode-locking are realized simultaneously in a linear cavity, and the output performance of the proposed approach is experimentally studied. In addition, relevant physical mechanisms involving wavelength tuning and Kerr mode locking are analyzed to understand the experimental results.MethodsUsing the nonlinear Kerr effect in a semiconductor gain medium and a soft aperture formed by the overlap between the pump and laser spots on the gain chip, an equivalent saturable absorber can be built into an optically pumped external-cavity surface-emitting laser. The Kerr effect forms an equivalent lens to focus the laser beam, and the soft aperture limits the transverse dimension of the laser. Their combined action, namely saturable absorption, involves selecting a pulse with sufficient strength from the intracavity noises, amplifying and shaping the selected pulse in the round-trip process, and finally maintaining a stable oscillation in the cavity and a steady output pulse train, thereby realizing continuous-wave mode-locking. Wavelength tuning of the laser was achieved by inserting a birefringent filter into the resonator. The birefringent filter was placed at the Brewster angle, and its optical axis was parallel to the surface of the filter. When the birefringent filter was rotated around the normal to the surface, the transmission wavelength allowed by the filter differed according to the tuning angle, thereby effectively realizing the tuning of the laser wavelength. A plane-concave reflector (radius of curvature: 150 mm) was used as the output coupler, and a 30 W fiber-coupled output semiconductor laser was employed as the pump source.Results and DiscussionsIn the experiment, the length of the resonator is selected as approximately 135 mm for the purpose of mode-matching between the spots of the pump and laser. After the laser output stabilizes, continually increasing the pump power and carefully tuning the resonator can produce continuous-wave mode-locking. When the pump power is 5.5 W, steady Kerr mode-locking with a repetition rate of 1.1 GHz, pulse width of 4.3 ps (Fig. 4) and spectral width of 1.25 nm is achieved (Fig. 5). The time-bandwidth-product of the mode-locked pulse is 1.68, which is approximately 4 times that of the Fourier-transform limit pulse, indicating that the pulses contain an obvious chirp. We believe that this chirp is caused by the nonlinear refractive index in the semiconductor gain medium, because of which new frequency components are generated during the evolution of the pulse, which results in a large chirp. By inserting a 2 mm thick birefringent filter into the cavity, wavelength tuning from 950 to 979 nm can be achieved, and stable mode-locking can be maintained for a 15 nm wavelength range from 964 to 979 nm (Fig. 6). By changing the thickness of the inserted filter from 2 to 4 mm, the wavelength tuning range can be reduced to 22 nm, and the range for maintaining mode-locking is reduced to 12 nm (Fig. 7). The tuning range reduction of the birefringent filter with increased thickness is determined by its free spectral range.ConclusionsIn summary, we have demonstrated a wavelength-tunable Kerr mode-locked external-cavity surface-emitting laser using a simple linear cavity. The mode-locked pulse repetition rate is 1.1 GHz, and the pulse width is 4.3 ps. When a 2 mm thick birefringent filter is inserted into the cavity, a wavelength tuning range of 30 nm is achieved, the maximum average output power is 129 mW, and stable continuous-wave mode-locking can be maintained in the 15 nm wavelength range of 964-979 nm. When the thickness of the birefringent filter is increased to 4 mm, the wavelength-tuning range is reduced to 22 nm, the maximum output power is 166 mW, and the stable continuous-wave mode-locking range is 12 nm. Wavelength-tunable Kerr mode-locked VECSELs possess a compact structure and enable stable mode-locking with large wavelength tuning range. They have potential applications in laser spectroscopy, laser confocal microscopy, coherent optical communication, and multiple other fields.
Jan. 01, 1900Vol. 49 Issue 21 2101004 (2022)
Guangsheng Deng, Wenqing Chen, Zhenchun Yu, Jun Yang, and Zhiping Yin
ObjectiveMetamaterial microwave absorbers are widely used in many fields, such as radars, stealth technology, electromagnetic compatibility, anti-electromagnetic interference, and sensors. To increase their usability, the functional requirements of absorbers have been also improved, including not only the broadband absorption properties but also wide-angle absorption characteristics. Furthermore, polarization insensitivity is now required, while all-dielectric metamaterials absorbers show unique potential in improving impedance matching in wide band. It is interesting to note that water, as an abundant natural resource on earth, possesses a high dielectric constant and large dispersion, which is of great significance for all-dielectric absorber applications. In addition, most of the water-based absorbers proposed in the literature cannot circulate the aqueous solution between the cells, or the cross-sectional area of the water flow channel of the adjacent cells is too small. The fact that most of the microwave energy absorbed by water-based metamaterials is converted into heat, if the water itself cannot circulate and dissipate heat, indicates the accumulated heat will seriously deteriorate the working performance of the absorber. However, if a water-based resonant cell with a larger cross-sectional area of the water flow channel is designed, the aqueous solution can be circulated both inside and outside. Hence, the generated heat can be efficiently dissipated during high-power microwave absorption.MethodsFirst, a microwave absorber based on a water-dielectric resonant structure is designed. More specifically, the resonant cell mainly comprises a cruciform water cavity and its respective encapsulation structure. The absorption spectrum of the model is simulated under different polarization angles and incident angles using the finite element method. Moreover, the electromagnetic wave absorption mechanism of the absorber is systematically studied through the distributions of the electric and magnetic fields and power loss density distribution. The array structure consisting 25×25 cells is processed by the 3D printing technology. The extracted electromagnetic wave absorption characteristics of the samples under different polarization angles and incident angles are tested using the free space method. Furthermore, the comparison and analysis with the simulated results are performed.Results and DiscussionsIn this study, an all-dielectric water-based microwave absorber is proposed (Fig. 1). The array structure consisting 25×25 cells is processed by the 3D printing technology, and the acquired absorption characteristics of the absorber are experimentally investigated by the free space method (Fig. 2). Both the simulated and experimental test results reveal that the absorptivity of the absorber is greater than 90% in the microwave broadband frequency of 21.8-35.9 GHz (Fig. 3). The simulated relative impedances of the water-based absorber are approximately equal to the free space impedance in the operation frequency range, which provides the wideband absorption with high absorptivity (Fig. 4). The electric field, magnetic field, and power loss density at resonant frequency are simulated, and the water layer plays a key role in wideband absorption (Fig. 5). The effects of both the structural parameters and the channel cross-sectional areas on the electromagnetic wave absorption spectrum are also simulated and analyzed (Figs. 6 and 7), and the results provide an important reference for optimizing the structural model. The absorption performances of the absorber at different temperatures are analyzed, and the results suggest that the absorptivity of the absorber is almost insensitive to water temperature changes (Fig. 7). Next, the absorption of the structure at different polarization angles is investigated, and both the simulated and experimental results show that the absorber is insensitive to polarization angles (Fig. 8). Finally, the absorption spectra of the proposed absorber at different incident angles for transverse-electric and transverse-magnetic polarizations are analyzed. The experimental results validate that the structure can maintain wideband absorption at wide incident angle ranges (Figs. 9 and 10).ConclusionsA microwave absorber based on a water-dielectric resonator is designed. Simulation results reveal that the absorber can achieve electromagnetic absorptivity of more than 90% in the frequency range of 21.8-35.9 GHz, while the relative absorption bandwidth is 48.9%. Compared with the water-based cells that are not connected to each other in the configuration of the traditional water-based wave-absorbing metamaterials, the cross-sectional area of the water flow channel formed by the cruciform cavity in this structure can reach 3 mm×3 mm. As a result, the water-cooling working condition of the absorber can be addressed, and it can be applied to high-power microwave absorption occasions. In addition, the proposed structure possesses polarization-independent absorption characteristics and also operates well on broadband absorption under wide-angle incidence. The absorber sample is processed by the 3D printing technology, whereas the electromagnetic wave absorption characteristics of the sample under both different polarization and incident angles are explored by the free space method. Interestingly, the test outcomes are in good agreement with the simulation results. Our work therefore provides a practical solution for the enhanced broadband absorption of high-power electromagnetic waves.
Jan. 01, 1900Vol. 49 Issue 21 2103001 (2022)
Peng Feng, Zhongliang Li, Xiangzhao Wang, Yang Bu, Yunjun Lu, Fudong Guo, and Sikun Li
ObjectiveWavefront aberration is a crucial parameter for describing the properties of an imaging optical system. With the quick development of optical technology, the requirement for aberration quality of imaging systems is increasing. Phase-shifting point diffraction interferometer (PS/PDI) is a high-precision instrument for detecting wave aberration in an optical imaging system. A recent study from the Lawrence Berkeley National Laboratory demonstrated that the root means square (RMS) of PS/PDI detection accuracy could be better than 0.1 nm. The PS/PDI classical technique is to change the reference light’s phase step by step and record the interferograms to achieve high-precision detection. However, because of its dependence on the external environment, the conventional phase-shifting measurement approach is susceptible to interference from ambient vibration and airflow. Thus, its application in high-precision detection in a complicated environment is challenging. In this paper, we report a polarization phase-shifting point diffraction interferometer that has the benefit of being insensitive to mechanical vibrations and air disturbances. We hope that our study will aid wavefront aberration detection in complicated scenarios with interference, including optical workshops and telephoto imaging systems.MethodsA polarization phase-shifting point diffraction interferometer (PPS/DHPDI) was proposed in this study. The polarization synchronous phase-shifting technique was employed in double fiber point diffraction interferometry. A multi-longitudinal mode diode-pumped solid-state laser operating at 532 nm was employed. The coherence length of the laser was several centimeters. It produced two orthogonal linearly polarized lights from two beams. The two beams passed through the imaging system under test, and the object points were imaged on the image plane. The image mask comprised a measurement window and a diffraction pinhole. The measurement light was generated by one beam passing through the window, whereas the reference light was generated by the other beam passing through the diffraction pinhole. After the two beams passed through the mask, they passed through a 1/4 wave plate whose principal axis direction is 45° to the polarization direction of the two beams, and they became left and right circularly polarized light. Subsequently, they passed through a micro polarization array of the same size as a charge-coupled device (CCD) pixel unit, and the CCD collected a single interference pattern. Four phase-shifting interference images with fixed additional phase differences (0, π/2, π, and 3π/2) were achieved by sampling a combination of the single interference patterns. Two measurement modes, point diffraction, and a system error measurement mode were designed based on the interferometer. Two beams passed through the window form the point diffraction measurement mode. One beam passed through the window, and the other beam passed through the pinhole form the system error measurement mode. The measurement findings of the point diffraction measurement mode included geometrical path error of the test light and point diffraction light, system error introduced by the wave plate, and detector tilt error. These systematic errors can be calibrated quickly and conveniently using system error mode measurement.Results and DiscussionsA dual-fiber point diffraction interference system based on a polarization phase-shifting system was built for assessing the wavefront aberration of a 5X demagnification transmission projection objective lens. The measurement findings and experimental error were examined. With high vibration noise at low frequencies, 32 repeatability tests were conducted in a vibration environment. Among the 37 Zernike fitting coefficients, the measurement repeatability (RMS) of Z5 to Z9 was less than 0.5 nm. These findings reveal that the system has good vibration resistance and repeatability in a vibration environment.ConclusionsWe investigated a dual-fiber point diffraction interference approach based on polarization phase-shifting to measure the imaging system’s wavefront aberration. Single-mode polarization-maintaining fiber is employed to generate ideal spherical waves whose polarization states are perpendicular to each other on the object plane. On the image plane, we employ a pinhole to produce the reference light. A 1/4 wave plate and a CCD camera with an integrated micro polarization array is employed to form and collect a single image and obtain four phase-shifting interferograms. The interferometer’s antivibration performance is enhanced and realized in the high-precision real-time detection of the imaging system’s wave aberration. The transmission microprojection objective lens verifies the validity of the detection technology proposed in this study.
Jan. 01, 1900Vol. 49 Issue 21 2104001 (2022)
Hongping Wang, Yu Wang, Shichen Zhao, and Xin Liu
ObjectiveA countersunk hole provides the main connection between the components and skin of an aircraft. Measuring the sizes and depths of countersunk holes to meet quality requirements is essential for ensuring connection accuracy and structural strength. The manual-contact method currently used in China requires only a low degree of intelligence and provides low measurement accuracy, while measurement methods using monocular vision require the camera to remain perpendicular to the measured object. Both of these methods directly influence the accuracy of perspective projections of the depth of the dimple. This study addresses these issues by proposing an online detection method for evaluating the quality of drilled countersink holes using binocular vision. A FANUC robot is adopted as the motion carrier for performing real-time detection of the hole-shape parameters using a visual-inspection system mounted on the end of the actuator.MethodsIn the round-hole detection algorithm based on binocular vision, the basic requirement is to accurately match the subpixel edge points. In the present study, a method for matching crossed laser lines was adopted that enables high-accuracy detection. In this method, a projection-mapping model of the boundary points is first constructed based on the intersection of the crossed laser lines and the countersunk hole. Using iterative projection transformations, the RANSAC algorithm is then applied to optimize the resulting single matrix. Second, to consider the influence of distortion in the perspective projection, a multilayer perceptron model based on the simulated-annealing algorithm (SA-MLP) is used to perform secondary corrective optimization of boundary points that were outside this mapping relationship. This model solved the problem of mismatch caused by small differences between light and dark regions of the boundary area and ensured matching accuracy of the boundary points. Finally, the spatial curvature of the three-dimensional reconstructed-contour point cloud data for the drilled countersink hole was employed to establish a mathematical model. The pore size and the depth of the reticle were calculated from the geometric relationship of the fitted cone model.Results and DiscussionsA preliminary mapping relationship between pairs of boundary points was established after implementing the perspective transformation and the RANSAC algorithm (Fig. 5). The boundary points on the left side of the countersunk hole were mapped onto the boundary contour on the right after a projection transformation. The parallel polar lines also indicated a linear relationship for the projection-mapping model based on the boundary points generated in this study. After error compensation by the SA-MLP network (Fig. 7), the boundary points from the left side of the hole were mapped precisely onto the right contour boundary (Fig. 9). To intuitively reflect the method of matching the laser cross, CloudCompare software was introduced to calculate the flatness of the point cloud generated by this method and the local feature matching method. The simulation results (Table 2, Fig. 11) showed that the point cloud generated by the proposed algorithm was increased in flatness by 77.7% and that the error volatility was reduced by 88.6%. Thus, the overall matching accuracy was considerably improved. Finally, the shape parameters of the drilled countersink hole were obtained using a space-cone model (Fig. 13) and were compared with the results from monocular visual inspection. The experimental results (Table 3, Fig. 18) showed that although the use of a telecentric lens improved the detection accuracy of monocular vision for the inner aperture (the directly measured index), the error generated by the projection process—for example, in the angle and depth of the dimple—were ignored by the overly idealized parallel-projection scheme. The measurement accuracy of the monocular method was considerably lower than that of the binocular results and cannot meet the requirements of the actual project. The measurement method based on binocular vision had a maximum error of 0.031 mm in dimple depth, and the error fluctuation was relatively stable, while the maximum errors in the aperture and the angle of the socket were 0.031 mm and 0.152°, respectively, which met the detection indices.ConclusionsTo improve the accuracy and robustness of the drilling-and-riveting detection process, this project constructs a visual-inspection system using a FANUC robot as the motion carrier and proposes a binocular-vision detection algorithm based on crossed laser lines. First, the algorithm uses the center of the laser cross as the matching benchmark and uses the RANSAC algorithm to optimize the projection matrix. The SA-MLP network model is used to compensate for the error of deviation point to obtain an accurate boundary-point matching relationship. Second, the generated boundary-point-cloud data is used to fit the inner and outer contour curves. On this basis, an ideal cone model is constructed for the drilled countersink hole. The dimple angle and dimple depth of the countersink hole can be derived from this model. Experimental results show that the point cloud data generated for round holes by the matching algorithm proposed in this paper increase the planarity of the point cloud by 77.7% and reduce the error volatility by 88.6% compared with the traditional algorithm. The final detection error in the aperture of the drilled countersink hole was less than 0.031 mm, dimple angle was less than 0.152°, dimple depth was within 0.04 mm, and the proposed algorithm had better stability and feasibility than methods in current use.
Jan. 01, 1900Vol. 49 Issue 21 2104002 (2022)
Yilang Ruan, Dahai Li, Linzhi Yu, Xinwei Zhang, and Xiangtian Xiao
ObjectiveImaging lenses, as a type of important optical element, are widely used in microscopes, cameras, and lasers. The demand for imaging lenses has considerably increased because of the rapid development of the optical industry, and there is an important need for a method that can efficiently measure the wave aberration of imaging lenses. The existing methods mainly include interferometry and geometric methods.Interferometry can achieve high accuracy. However, this has limitations in practice because of its low dynamic range, high costs, and inability to be used for online optics testing. Furthermore, this method cannot measure the off-axis aberration of imaging lenses. The accuracy of the Shack-Hartmann test method is limited by the size and quality of the microlens array and the low sampling rate of the data used to reconstruct the wavefront. The Ronchi test method is usually used to measure low-order aberrations and cannot completely evaluate wavefronts. The accuracy of Moiré deflectometry greatly depends on the grating quality. To overcome the existing difficulties, we propose a new method for measuring the off-axis aberration of imaging lenses. This method has the advantages of high dynamic range, simple equipment, low cost, and is not sensitive to the testing environment. Furthermore, complex camera calibration processes are avoided.MethodsDuring the reversed Hartmann test, rays are emitted from the pinhole of the camera. These rays leave the exit pupil of the lens and intersect the liquid crystal display (LCD) screen. The wave aberration of the lens can be calculated using the aberration theory as long as the coordinates of the idea intersection points, real intersection points, and exit pupil plane are obtained. Therefore, a measurement system is built, and the coordinates of the real intersection points are obtained using a phase shift algorithm. Meanwhile, the model of the experiment system is built in software with calibrated parameters. The coordinates of the idea intersection points and the exit pupil plane can be obtained by ray-tracing. The derivative of wave aberration can be calculated using these three sets of coordinates. Finally, the wave aberration of the lens can be obtained by integration.Results and DiscussionsThe simulation results show that our method can realize good accuracy. When the field angle is 5°, the errors of the result for a plano-convex lens are only 2.43% in RMS and 3.51% in PV (Fig. 4). The primary astigmatism measured using the proposed method is proportional to the square of the field of view and the square of the entrance pupil’s diameter, and the primary coma is proportional to the field of view and the cube of the entrance pupil’s diameter (Fig. 6), which is consistent with the theory of primary aberration. These proportional relationships are used to confirm the feasibility of the proposed method. Furthermore, this method is also used in the experiment to measure the aberrations of a plano-convex lens at different field angles. The errors are not high (4.13% in RMS and 4.08% in PV), even at a field angle of 5.17°. Therefore, this method is feasible in the experiment.ConclusionsThis study proposes a novel off-axis aberration measurement method based on phase measuring deflectometry. The reversed ray-tracing method is presented based on the theory of aberration and the reversed Hartmann test viewpoint at first, and then the method for obtaining wave aberration is introduced. The difference between the actual wave aberration and that measured wave aberration using our method is then analyzed at different field angles in the simulation for a plano-convex lens, confirming that the reversed wave aberration can replace the forward wavefront aberration. Finally, in the experiment, a plano-convex lens with a diameter of 60mm is tested at different field angles, and the measurement system is built. The result is compared with that of the simulation to confirm the accuracy of the experiment and analyze the sources of errors. The method proposed in this study is simple. The off-axis aberration of an imaging lens can be measured effectively with an LCD screen and a charge coupled device (CCD) camera, and it provides a feasible method to realize the online off-axis aberration measurement.
Jan. 01, 1900Vol. 49 Issue 21 2104003 (2022)
Xiang Liu, Zhenliang Wang, Peng Yao, Yao Hou, Heyong Zhang, Dongkai Chu, and Shuoshuo Qu
ObjectiveSurface morphologies of workpieces affect the properties of mechanical system, such as friction and wear, fatigue strength, and corrosion resistance. Precise measurements of surface morphologies are of great significance, which can show the processing quality, guide processing and improve surface performance. The contact measurement method is inefficient, and may cause workpiece damage. Optical non-contact precision measurement methods are developed based on the properties of light, which have the advantages of non-destruction, large area, high precision, high sensitivity, simplicity and efficiency, so they are widely applied. The structured light measurement method is one of the most popular measurement methods, in which different lights with different modes are projected onto a object surface and the 3D morphology is reconstructed by shooting distorted images with a camera. However, when a line laser profilometer is used to measure the 3D morphology of a workpiece, a relatively linear motion is usually needed between them, so the system needs a linear motion module with high precision and occupies a large space. Therefore, it is difficult to achieve precision measurement. To solve these problems, a rotation scanning measurement method with a line laser profilometer is proposed in this paper.MethodsFirst, the line structured light rotation measurement system (Fig. 10) is built, which can project the laser stripe vertically onto a standard plane. Then, when the laser profilometer rotates with the rotation stage at different angles (Fig. 12), the fixed CMOS camera shoots images of line structured light. By the Matlab programming, the images are processed based on the extremum method, and the motion trajectory of the laser light strip (Fig. 13) is fitted based on the least square method. Then, the eccentricity error of rotation center of profilometer and rotation stage are calculated according to the fitted trajectory. In the next step, by the Java programming, 3D synthesis and polar processing of point cloud data are processed. The run-out and eccentricity errors of the rotation stage and the tilt error of the line laser profilometer are compensated. Finally, the effectiveness of the proposed method is verified by measuring the radius of a standard zirconia ceramic ball and the diameter, width and height of a key.Results and DiscussionsThe line structured light is shot by the CMOS camera, and the eccentric error is calculated by fitting the motion trajectory. After the relative position between the laser profilometer and the rotation stage is adjusted, the minimum error reaches 0.02752 mm (Table 9), which provides a good position for rotation measurement. A high-precision profilometer and the proposed method are used to measure the radius of the standard zirconia ceramic ball (Figs. 18 and 19), the average error of measurement results is 2.99 μm (Table 10). Due to the shortcoming of line structured light in measuring smooth surface, the non-measurement region appears in the spherical crown, but our method still presents high measurement accuracy. When a key surface is measured by the two methods, the measurement range of the proposed method is larger than that of the confocal measurement method. That is to say, when large size features are measured, the confocal measurement method needs multiple measurements and data splicing, which reduces the measurement efficiency and accuracy. The deviations of the measured widths of the key surface at three different positions by the two methods are 2.9 μm, 1.9 μm, 3.3 μm, and the deviations of the measured diameter and height of the key surface by the two methods are 4.2 μm and 2.8 μm(Table 11), respectively. Due to the low machining accuracy and the abrasion and corrosion of the key surface, the large deviation appears in the measurement results.ConclusionsIn this paper, a method for measurement and error compensation of 3D morphology with precision rotation line structured light is proposed. When the proposed method is used to measure the radius of the standard sphere, the error is smaller than 3 μm compared with the measurement result by a precision profilometer, which is close to the limit of measurement accuracy of this instrument set. The CMOS camera is used to capture the images at different positions to fit the motion trajectory of the line structured light when the line structured light rotates with the rotation stage. In this process, it is necessary to keep the camera fixed and a stable lighting environment without stray light interference. After the laser stripe center is extracted by the extremum method, the least square method is used for trajectory fitting, then the relative position between the laser profilometer and the rotation stage is adjusted according to the fitting results. In this process, the gray distribution and fitting regression evaluation index are monitored to ensure the effectiveness of the fitting method. Compared with the confocal measurement method, our method has a larger measurement range and higher efficiency when measuring large features. Meanwhile, the minimum and maximum deviations between the two measurement results are 1.9 μm and 4.2 μm, respectively, which proves the accuracy of the proposed method. The verified results indicate that the proposed method is suit for on-machine precision measurement of 3D workpiece morphologies when the workpiece or motion stage is too large and the precision of the relative motion is not high enough.
Jan. 01, 1900Vol. 49 Issue 21 2104004 (2022)
Song Cheng, Honggang Yang, Xueqian Xu, Min Li, and Yunxia Chen
ObjectiveIndustrial equipment is prone to various internal welding defects during the process owing to factors such as the manufacturing process and welding environments, such as pores, slag inclusion, and incomplete penetration. However, the problem of small defects in radiographic inspection of weld defects is challenging as well. The most serious problem is the lack of detailed features visible to the naked eye, making it difficult to distinguish between the foreground and background during the inspection process. Therefore, it is essential to detect the internal defects of the weld in real-time. In industrial inspection, the type of X-ray flaw detection images is generally determined and located manually. Manual film evaluation has a high workload and low efficiency, as well as false and missed detection. Deep learning is now widely used in target recognition, thanks to the rapid development of computer and digital image processing technology. In this paper, a weld defect detection algorithm based on lightweight YOLOv5-Tiny is proposed, which is combined with the characteristics of weld internal defects in X-ray images.MethodsFirst, the edges of pores and incomplete penetration are blurred, making it difficult for the model to extract the edge information of defects, resulting in a low model recall rate. Therefore, an attention mechanism SELayer is added to the Backbone part. This mechanism can use limited attention resources to quickly filter out high-value information from a large amount of information, allowing the model to pay more attention to the edge information of defects, retains more edge information, and improve the model’s performance continuously. Second, replace all C3 modules with the GhostBottleneck module in the Head section. The GhostBottleneck module is composed of two GhostConv modules and a residual edge. The function of the GhostConv_1 module is to process the input feature map by convolution, normalization, and activation function; the GhostConv_2 module removes the activation function and processes the feature map using convolution and normalization to connect the context information. Therefore, after nonlinear convolution, the model is convolved and normalized again on the feature map, allowing it to capture more feature maps and eliminate redundant features, resulting in a more lightweight model. Finally, the 13×13 feature layer used to detect large objects is removed, and the 26×26 and 52×52 feature layers are reserved for predicting pores, slag inclusion, and incomplete penetration, thereby speeding up the training and prediction of the model.Results and DiscussionsWhen compared to the original YOLOv5 model, the improved model changes more gently in accuracy and recall without large fluctuations during the training process (Fig. 8). The attention mechanism and GhostBottleneck module enable the model to learn more defect features, and various detection indicators such as accuracy, recall, AP (average precision), and mAP (mean average precision) values have significantly improved (Table 5 and Table 7). The 13×13 feature layer is removed and combined with depth separable convolution, so that the model reduces the number of parameters by 33.6%, the processing time of each frame by 14.9% ( shortens from 0.0175 s to 0.0149 s), and the size of the prediction weight by 32.8% (Table 6).ConclusionsAn improved lightweight YOLOv5-Tiny weld internal defect detection algorithm is proposed to address the problem of difficult detection of small target defects in X-ray weld images. The algorithm adds an attention mechanism, replaces the C3 module in the enhanced feature extraction network with the GhostBottleneck module, deletes the 13×13 feature layer used to detect large targets, and replaces part of ordinary convolution with depthwise separable convolution when compared to the original YOLOv5 model. Therefore, while the number of model parameters is reduced, the edge information of three defects, such as pore, slag inclusion, and incomplete penetration, is more accurately preserved. Finally, the improved model is trained using the CIoU and DIoU loss functions, respectively. The training results show that the improved model can improve the detection indicators of F1, AP, and mAP of the three defects, and its processing velocity has been significantly improved. The processing time of a single frame of images is reduced from 0.0175 s of the YOLOv5 model to 0.0149 s. When compared to the original YOLOv5s algorithm, the YOLOv5-Tiny algorithm has a faster detection speed and higher recall rate, and its smaller prediction weight is more convenient for embedded use. The proposed algorithm is of great significance for the rapid and accurate defect detection of aluminum alloy weld radiographic images.
Jan. 01, 1900Vol. 49 Issue 21 2104005 (2022)
Yu Wang, and Hongfang Chen
ObjectiveThe development trend of laser heterodyne interferometry is the enhancement of measurement resolution and accuracy. The primary factor that hinders the further enhancement of laser heterodyne interferometry accuracy is the periodic nonlinear error. This research proposes a nonlinear error compensation approach for laser heterodyne interferometry based on wavelet transform. The Morlet wavelet transform is employed for the nonlinear error function, and the wavelet ridge is extracted from the wavelet coefficient matrix’s information. Next, the characteristic information of wavelet ridge line is examined and the first harmonic nonlinear error is rebuilt. After compensating for the first harmonic nonlinear error based on the wavelet transform approach, the second harmonic nonlinear error is fitted iteratively by the least-squares nonlinear fitting approach.MethodsFirst, a nonlinear error compensation approach based on a wavelet transform is proposed. Periodic nonlinear errors in laser heterodyne interference systems can be modeled as the superposition of pure sine waves. The wavelet family is created by changing the time and scale factors of complex Morlet wavelet. The pure sinusoidal model is converted using wavelet transform based on the Morlet wavelet family. By further computation, the wavelet coefficient’s modulus and phase are obtained, so that the wavelet ridge is extracted. When the modulus of the wavelet system is the largest at the ridge position, the corresponding scale corresponds to the first harmonic nonlinear error frequency. The first harmonic nonlinear error phase is the corresponding phase. The second harmonic nonlinear error frequency is twice that of the first harmonic nonlinear error. Additionally, the second harmonic nonlinear error phase is achieved under the corresponding frequency’s scale. Based on this, the first harmonic nonlinear error function’s amplitude is computed, and the rebuilt first harmonic nonlinear error function model is achieved. After compensating for the first harmonic nonlinear error, the nonlinear fitting approach based on the least square is employed to further fit the nonlinear second harmonic. Furthermore, a laser heterodyne interferometer optical path is constructed to measure nonlinear errors. The nonlinear error compensation based on the wavelet transform is employed for the nonlinear error measurement, and the actual compensation impact is investigated.Results and DiscussionsBased on the principle of laser heterodyne interference, an experimental optical path of laser heterodyne interference is constructed (Fig. 3). The measurement signal’s nonlinear error in the experimental device is measured. The interference signal’s spectrum when the gauge block moves at 8 mm/s is examined (Fig. 4). The first harmonic’s magnitude and the nonlinear error’s second harmonic are 5.97 nm and 0.25 nm, respectively. The nonlinear error compensation approach for laser heterodyne interference based on the continuous wavelet transform is employed to compensate for the nonlinear error. The measurement system’s nonlinear error component decreases from 5.97 nm to 1.09 nm, and the nonlinear error component is reduced to 18% of the original. Based on this approach, the impact of nonlinear error can be suppressed efficiently and the measurement accuracy of laser heterodyne interference can be enhanced.ConclusionsBy addressing the challenge of periodic nonlinear error compensation in laser heterodyne interferometry, a nonlinear error compensation approach based on continuous wavelet transform is proposed. The Morlet wavelet transform is employed for the nonlinear error function, and the wavelet ridge is extracted from the wavelet coefficient matrix’s information. Next, the characteristic information of wavelet ridge line is examined and the first harmonic nonlinear error is rebuilt. After compensating for the first harmonic nonlinear error based on the wavelet transform approach, the second harmonic nonlinear error is fitted iteratively using the least-squares nonlinear fitting approach. Experimental findings demonstrate that the nonlinear error component decreases from 5.97 nm to 1.09 nm, and the nonlinear error component is reduced to 18% of the original when the approach is employed for laser heterodyne interferometry. Based on this approach, the impact of nonlinear errors can be suppressed efficiently and the measurement accuracy of laser heterodyne interference can be enhanced.
Jan. 01, 1900Vol. 49 Issue 21 2104006 (2022)
Jiajia Li, Chang Chen, Qiyuan Jiang, Zhiguo Wang, and Hui Luo
ObjectiveThe nuclear magnetic resonance gyroscope (NMRG) has attracted wide interest in recent years because of its small size, low power consumption and high precision. The alkali metal atoms, as an important component in the vapor cell of the NMRG, can be used to polarize noble gas atoms through spin-exchange optical pumping and are sensitive to the magnetic field generated by the nuclear magnetic moment of noble gas. The performance of embedded magnetometer directly determines the measurement accuracy of the NMRG, and therefore the parameter optimization and selection for the embedded magnetometer are critical. At present, most researchers focus on the influence of parameters such as the frequency and power of pump light on the zero-bias stability of the NMRG, and the research on the probe light mostly focuses on the frequency stability methods. In contrast, the research on the performance of the embedded magnetometer affected by the frequency of the probe light is rarely reported. As an important parameter, the frequency of the probe light plays an important role in improving the performance of the embedded magnetometer. In this study, a theoretical model of the probe light frequency influencing the embedded magnetometer signal is established, and the asymmetry of the positive and negative frequency responses of the experimental D1 line and the phenomenon of local extreme value near the central frequency by introducing hyperfine structure correction are explained. The simulation and experiment results match well, which proves the reliability of the theoretical model. The proposed theoretical model can provide design rules for improving the performance of the embedded magnetometer and the accuracy of the NMRG.MethodsFirst, the theoretical model of the relationship between the Faraday rotation angle and the probe light frequency is established without considering the hyperfine structure. Second, the corresponding experimental system is established, the signal amplitude and transmitted light power of the embedded magnetometer are measured under different probe light frequency detunings and different cell temperatures. Third, the experimental results are compared with the theoretical results to analyze the errors in the theoretical model. At last, the hyperfine structure is taken into consideration to modify the theoretical model, and the simulation results are compared with the experimental results to verify the reliability of the modified theoretical model.Results and DiscussionsWithout considering the hyperfine structure, the signal amplitude first increases and then decreases with the decreasing absolute value of the frequency detuning under the same cell temperature. On the other hand, the signal amplitude continues to increase when the cell temperature increases from 90 ℃ to 120 ℃, and starts to decrease at 130 ℃, while the absolute values of the frequency detunings corresponding to the maximum values under different temperature conditions gradually increase. The experimental and theoretical results match well in the negative frequency part of the D1 line, while the experimental results are significantly lower than the theoretical results in the positive frequency part of the D1 line, which may due to ignoring the hyperfine structure (Fig.3). After considering the hyperfine structure, the theoretical results and the experimental results match well. The asymmetry of the positive and negative frequencies is explained and it is caused by the asymmetry of the hyperfine structure. The results show that the signal amplitude can be optimized by about 3 orders of magnitude relative to the minimum by selecting the probe frequency detuning of around -17 GHz from the D1 line under a suitable gas chamber temperature (120 ℃) (Fig.4). The transmittance distribution at each temperature is basically consistent with the theoretical result, showing a Voigt distribution, and the transmittance curve gradually decreases with the increase of the temperature. Furthermore, there exists a small local extreme point near the central frequency, which is caused by the hyperfine structure and more obvious at lower temperatures (Fig. 5). The signal amplitude distribution at each temperature has also such an extreme point near the central frequency. As the temperature increases, the rotation angle curve with dispersion form is almost close and gradually decreases, while the extreme point position remains basically unchanged. The discrepancy may due to the weak signal amplitude near the central frequency which may be caused by the non-ideal 85Rb isotope in the vapor cell. The small extreme point near the central frequency is also caused by the hyperfine structure (Fig.6).ConclusionsAn optimization model that describes the influence of the probe light frequency on the embedded magnetometer is established. The theoretical and the experimental results match well, which show that the signal amplitude can be optimized by about 3 orders of magnitude relative to the minimum by selecting the probe frequency detuning of around -17 GHz from the D1 line under a suitable gas chamber temperature (120 ℃). By introducing the hyperfine structure correction, the asymmetry of the positive and negative frequency responses of the D1 line and the local extreme point near the central frequency are explained, which verifies the reliability of the theoretical model. The proposed theoretical model can provide design rules for improving the performance of the embedded magnetometer and the accuracy of the NMRG.
Jan. 01, 1900Vol. 49 Issue 21 2112001 (2022)
Tianyuan Zang, Siliang Yang, Lei Liu, Wentao Wang, Shihan Meng, Jianliang Jiang, and Hengli Zhang
Jan. 01, 1900Vol. 49 Issue 21 2116001 (2022)
Zhenxu Bai, Hui Chen, Zhihan Zhu, Jiaqi Lu, Yaoyao Qi, Jie Ding, Bingzheng Yan, Yulei Wang, and Zhiwei Lu
Jan. 01, 1900Vol. 49 Issue 21 2116002 (2022)
Yujun Tang, Xiaoxuan Zhou, Xinyue Ni, and Fansheng Chen
ObjectiveHigh-sensitivity continuous detection and tracking has gained widespread attention in the field of infrared surveillance of space dim targets. Moreover, studies on the infrared radiation and motion characteristics of targets are the premise of the system parameter design. High-speed air vehicles have strong maneuverability when the flight altitude and speed greatly fluctuate. Moreover, their angle of attack constantly changes and adjusts, showing a jumping trajectory during the flight. The radiant intensity reaching the entrance pupil of the detection system is low due to atmospheric absorption and changes drastically. Simultaneously, the background radiant intensity varies widely due to the complex and changeable earth background during flight, which reduces the detection efficiency of the traditional infrared detection system. However, current traditional detection systems using fixed parameters are unable to achieve high-sensitivity detection under all conditions when detecting targets with drastic changes in radiation and motion characteristics, leading to reduced system detection capability. Therefore, adaptively optimizing system parameters in real-time to ensure stable target detection and tracking is necessary. Additionally, it is necessary to propose a new detection method with real-time adaptive optimization of system parameters to ensure stable detection and tracking capabilities, thereby significantly improving the robustness of the system.MethodsWe propose a detection and tracking method via exposure time and integrating capacitor adaptive optimization using real-time image information. First, we develop a mathematical model of the system detection sensitivity decoupled from the target radiant intensity. The initial integration capacitance and exposure time are optimized to match the detector parameters with the optical system parameters using both the characteristics of the typical high-speed air vehicle motion and earth background radiation, respectively, and realizing a high-sensitivity search. Upon detecting the target and sustaining the tracking process, the target motion information and radiation information are collected. Subsequently, the target motion trajectory is fitted and the target center position in the next frame and motion speed are estimated. Additionally, we estimate the target center position and earth background radiation information in the next frame. From the formula (8), the optimal exposure time and the integration capacitance of the target tracking process are adaptively adjusted using the time-varying continuity of the target radiant intensity and the time-slow variability of the earth’s background radiation, keeping the target signal-to-noise ratio continuously optimal and achieving continuous tracking of the target.Results and DiscussionsA system detection spectrum of 2.7-3.0 μm is selected to suppress the earth’s background and ensure sufficient atmospheric transmittance. From the difference in background radiance, the earth’s background can be divided into the strong reflection background, such as high-altitude cirrus, and the conventional background, such as ocean, land, and low-altitude clouds whose typical radiance values are 2.4×10⁻⁶ W/( sr·cm2) and 3.5×10⁻⁷ W/( sr·cm2), respectively. We study the geosynchronous orbit satellite platform with the optical system parameters presented in Table 1. The typical speed of a high-speed air vehicle is 10 Ma. From the proposed mathematical model, the typical system exposure time is 158 ms, and the optimal full capacity is 3×10⁵ and 1×10⁶ under strong reflection and conventional backgrounds, respectively. Figure 5 shows the detection sensitivities under different working conditions. Figures 5(a) and 5(b) show system detection sensitivities for real-time parameter optimization and fixed system parameter detection methods, respectively. Using the fixed-parameter detection and adaptive parameter optimization methods, we can obtain detection sensitivities of up to 3 W/sr and 0.64 W/sr, respectively, thereby improving the detection capability by more than 4.5 times. For example, considering Falcon Hypersonic Technology Vehicle 2 (HTV2), whose entrance pupil radiant intensity goes as low as 200 W/sr, as shown in Fig. 6, the detectable radiant intensity threshold can reach up to 277 W/sr with the fixed parameter detection method, which fails to continuously detect and track HTV2. However, the radiant intensity threshold can be reduced to 195 W/sr using the real-time parameter optimization detection method, which meets the continuous detection and tracking requirements.ConclusionsIn this study, we propose a detection and tracking method using self-adaptive optimization of exposure time and integral capacitance. First, we optimize the initial system integration capacitance and exposure time using the target motion and background radiation characteristics. Notably, the actual target motion and surrounding background radiation characteristics are collected in real-time, and we adaptively adjust the optimal exposure time and integration capacitance, thus improving the detection and tracking performance. The numerical simulation results show that the system detection sensitivity is improved by up to 4.5 times using the real-time parameter optimization detection method, achieving the high-sensitivity target detection and tracking with the radiant intensity of 200 W/sr.
Jan. 01, 1900Vol. 49 Issue 21 2110001 (2022)
Junlin Chen, Xiaokun Wang, Haiyong Zhu, Zhijiang Zeng, Yaran Li, Shaobo Luo, Xi Wang, and Chun Lin
ObjectiveMost current advanced optical systems employ low-temperature optical technology to cool the optical lens to a lower temperature level to reduce optomechanical radiation and enhance the detection sensitivity and dynamic range of remote sensing instruments, which helps to enhance the detection performance of optical remote sensing instruments. This research focuses on the packaging technologies that are required for the engineering application of multiband long-wave infrared detectors for cryogenic optics, including multimodule splicing and multiband integrated filter low-temperature registration, support and heat insulation of low-temperature optical windows of modules, and coupling stress between detectors and refrigerators. Through systematic investigation, the multiband long-wave infrared detector’s Dewar for low-temperature optics has been successfully developed, and it has been confirmed by a series of space environment adaptability tests.Methods1. Low-temperature module splicing registration and four three-band integrated filters. The filter was designed based on the imaging optical path. The closer the filter was to the chip, the smaller the non-uniformity, stray radiation energy, and the detector image surface’s stray ratio. To enhance the detector image plane’s uniformity, the filter in the Dewar package should be as close to the chip as possible (Fig. 5). Detectors and filters were packaged as follows: 1) four three-band detectors were spliced and cemented on the ceramic substrate, and the flatness of the cemented surface of the ceramic substrate detector’s gemstone was controlled to be less than 5 μm; 2) the four integrated filters were preliminarily bonded to the filter holder, and the splicing accuracy was controlled in the range from -3 μm to + 3 μm; 3) the filter holder was aligned with the detector’s center, ensuring the alignment accuracy was in the range from -5 μm to + 5 μm.2. The design of the flexible bellows shell’s thermal insulation structure. We proposed a Dewar flexible bellows shell structure for the infrared detector assembly employed in the low-temperature optical system. By increasing the heat transfer path, reducing heat leakage, and increasing thermal insulation, the heat transfer area of the transfer link can be reduced.3. The design of a cold platform for physical isolation of coupled stress. In this research, based on the detector’s coupling characteristics and the refrigerator’s cold finger, an arc-shaped isolation groove of a specific shape was designed and processed on the cold platform. The groove width is H1 (Fig. 8). On the heat transfer capacity’s premise needed by a certain heat load, the heat conduction link’s physical isolation and the coupling stress transfer channel were achieved.Results and DiscussionsThrough the positioning and integration design of four three-band integrated filters, the alignment error between three-band integrated filter and detector back cover is less than 10 μm. By implementing the Dewar flexible bellows shell structure, the thermal isolation between the infrared detector Dewar refrigeration assembly’s low-temperature shell and the refrigerator expander or pulse tube is achieved, as well as the infrared detector Dewar assembly flexible corrugated shell’s 101 mW thermal insulation (Table 1). During the thermal vacuum test, at the operating temperature of 55 K, the temperatures of the compressor’s cooling surface and the pulse tube’s cooling surface increased immediately, and there was no visible response to the Dewar temperature (Fig. 7). We measured the cold platform’s surface deformation after slotting and compared it with the cold platform’s surface deformation without slotting (Fig. 9). During the implementation of the Dewar’s full coupling and the refrigerator, the unslotted cold platform’s surface deformation increases sharply and stabilizes at around 40 μm/m, while the cold platform’s surface deformation after grooving does not change, and stabilizes at about 8 μm/m, and the deformation decreases by about 80%. From this, it can be deduced that the cold platform’s surface stress is reduced by 80% after grooving.ConclusionsThe challenges of packaging multiband long-wave infrared detectors are examined to meet the requirements of spliced multiband long-wave IRFPA in cryogenic optics. It is proposed that the three-band integrated filter and the detector’s back cover can be aligned with a misalignment of fewer than 10 μm, and the Dewar flexible corrugated housing 101 mW heat insulation is realized. Simultaneously, measures including a multilayer thermal layer structure that physically isolates the coupled stress are designed on the Dewar cold platform. It addresses essential technologies like low light string, low background radiation, low power consumption, high-temperature uniformity of cold platform, and high reliability of multiband long-wave infrared detector components. A 12.5 μm three-band 2000×12 element detector component for cryogenic optics was successfully developed and a series of space environment adaptation tests were implemented, and the test results indicate that the Dewar assembly meets the criteria of engineering application.
Jan. 01, 1900Vol. 49 Issue 21 2110002 (2022)
Xiaolin Wang, Yujun Wen, Hanwei Zhang, Xiaoming Xi, Chen Shi, Baolai Yang, Peng Wang, Zhiyong Pan, Zefeng Wang, Xiaojun Xu, and Jinbao Chen
SignificanceIn the power scaling process of fiber lasers, nonlinear effects are one of the most important limiting factors. In order to suppress the nonlinear effects in high power fiber lasers, researchers have proposed to use a gain fiber whose core diameter is variable along the length direction (called core-diameter-variable gain fiber) as the laser gain medium. Core-diameter-variable gain fibers mainly includes single-tapered fibers, spindle-shaped fibers, and saddle-shaped fibers. Core-diameter-variable gain fibers have many advantages over the ordinary gain fibers. This type of fiber used in lasers can make the laser have the capabilities of maintaining beam quality, suppressing mode instability, and mitigating amplified spontaneous emission (ASE) simultaneously, and has a broad application prospect in the field of high power lasers. In particular, the spindle-shaped gain fiber with an asymmetric structure may become the key device that breaks through the power limitation of the traditional gain fibers with uniform core diameters and obtains a high power laser output.ProgressCore-diameter-variable gain fibers can effectively suppress nonlinear effects and maintain good beam quality, and have been widely used in single-frequency and narrow-linewidth amplifiers. Commercial polarization-maintaining tapered ytterbium-doped fibers are used in single-frequency fiber lasers with an output power of 550 W. They are also used in pulsed fiber lasers to break through the peak power output. Since 2014, the lasers based on this type of fiber have been extensively studied, and the power has been rapidly increased while maintaining the beam quality. In 2017, a femtosecond pulsed laser with an output peak power of 22 MW was realized based on the ytterbium-doped tapered fiber combined with the pulse compression technology. In 2021, the peak was increased to 97 MW with the diffraction limit beam quality in a femtosecond pulsed laser system using an ytterbium-doped tapered fiber. After the non-polarization-maintaining fiber technology matured, in order to achieve the high peak linear polarization, researchers began to study the tapered gain fiber lasers based on the linear-polarization-maintaining characteristics. There are two types of double-clad ytterbium-doped tapered fibers which can maintain the polarization: the Panda polarization-maintaining tapered fiber and the spun tapered fiber. The comparison between the spun tapered double-clad gain fiber and the Panda polarization-maintaining fiber shows that the spun tapered double-clad fiber has better extinction ratio retention characteristics. Based on these fibers, a linearly polarized pulsed laser output with an average power of 72.5 W and an extinction ratio larger than 17 dB was achieved. In 2021, based on the Panda polarization-maintaining ytterbium-doped tapered fiber, a linearly polarized pulsed laser with an average power of 150 W, a peak power of 0.74 MW, and an extinction ratio of 13.5 dB was realized. Narrow-linewidth pulsed lasers based on tapered gain fibers also attracted attention at the same time. In 2021, a narrow-linewidth pulsed laser with a linewidth of 167 pm and a peak output of 170 kW at a pulse duration of 3 ns was achieved. Core-diameter-variable gain fibers have also been widely used in the continuous-wave lasers. In 2020, the spindle-shaped ytterbium-doped fiber was used to achieve a continuous-wave laser with an output power of larger than 5 kW, and the saddle-shaped ytterbium-doped fiber was also used to achieve a 1313 W continuous-wave laser output. With the development of technologies, the application of core-diameter-variable ytterbium-doped fibers is becoming more and more extensive. At present, the development of core-diameter-variable ytterbium-doped fiber lasers shows that the output laser wavelength extends from the conventional wavelengths to some special wavelengths, the laser polarization characteristics extend from non-linear polarization to linear polarization, and the fiber structure changes from single-tapered to spindle-shaped and saddle-shaped. For new types of optical fibers, the concept of variable diameter has evolved from core to cladding. With the development of fiber manufacturing processes, core-diameter-variable ytterbium-doped fibers will be widely used in various fields of fiber lasers. The core-diameter-variable gain fibers have special requirements for the drawing process. In order to realize the fabrication of core-diameter-variable ytterbium-doped fibers, the method of preform form control and the method of drawing with a variable speed as well as the combination of these two methods can be used. Many institutions in the world have mastered the manufacturing processes of polarization-maintaining and non-maintaining core-diameter-variable fibers, and have launched some products. However, the domestic related researches mainly began at around 2016, and until now many institutions have already preliminarily mastered the manufacturing processes of non-polarization core-diameter-variable ytterbium-doped gain fibers.Conclusion and ProspectThe application of core-diameter-variable gain fibers in high power lasers has been widely studied. With the progress of technologies and the traction of high power laser demand, core-diameter-variable ytterbium-doped fibers have moved gradually from the laboratory to the market in recent years, greatly promoting the development of high power fiber lasers. In the near future, based on the technologies of core-diameter-variable ytterbium-doped fibers and new pumping sources, it can be expected that an industrial-grade, near single-mode fiber laser with an output power larger than 10 kW, beam quality (M2) smaller than 2, and stable operation for long time can be realized.
Jan. 01, 1900Vol. 49 Issue 21 2100001 (2022)
Chenghao Liu, Yiqing Cao, Xiahui Tang, Ming Tang, and Luming Zhao
SignificanceA dissipative soliton resonance (DSR) pulse is a special output pulse from a mode-locked fiber laser. The pulse duration increases linearly with the increase of the pump power. At the same time, the peak power of the pulse is clamped, which means the pulse energy increases linearly. With the development of mode-locking technologies and rare-earth element doping technologies, DSR fiber lasers have been developed rapidly. As we all know that in the past few decades, various pulse shaping mechanisms have been successively proposed to improve the pulse energy from a fiber laser. Soliton is the first to be proposed and the pulse can maintain its shape when propagating in a laser cavity. However, the output pulse has a low pulse energy and is easy to break. Subsequently, a dispersion-managed soliton is proposed and by controlling the dispersion map in the cavity, one can get a pulse with a higher energy. Further, the self-similar and gain-guided soliton has been reported, and the dissipative solitons operating in the normal dispersion region have been subsequently observed experimentally. On this basis, the dissipative soliton resonance pulse has been confirmed by theoretical prediction and experimental observation. The research on DSR pulses is of great significance because the DSP pulse possess the potential to achieve a larger pulse energy. The properties of DSR fiber lasers under various laser cavity structures and various mode-locking methods have been investigated, and the DSR pulses with different center wavelengths have been realized. In addition, the research on the evolution characteristics of a DSR pulse in a cavity has also attracted lots of attention in recent years. Some anti-DSR phenomena including period doubling (PD) and pulse shrinkage are observed and explored. These studies can help us better understand the developing characteristics of DSR pulses, and find a way to further improve the pulse energy.ProgressWe first introduce the research background of DSR pulses, then illustrate the pulse generation mechanism and the corresponding characteristics. The DSR fiber lasers under different mode-locking mechanisms are summarized. Finally, the state-of-the-art research status and potential applications are comprehensively illustrated. This paper discusses and compares the output characteristics, advantages, and disadvantages of different mode-locked DSR fiber lasers. The performance of the existing DSR fiber lasers is discussed and analyzed, and the anti-DSR phenomena and the influence of the spectral filtering on the DSR pulses are also discussed. Under ideal conditions in time domain, the DSR pulse duration is linearly proportional to the gain. In other words, the DSR pulse is broadened in the increase process of gain, and so does the corresponding pulse energy. However, some phenomena that contradict theoretical predictions have been experimentally observed. The first is PD, a classical property of a nonlinear system. The DSR pulses are theoretically immune to the appearance of PD as the DSR pulses have clamped peak powers with the increase of pump power, while PD is a nonlinear threshold effect. However, the PD phenomenon has been experimentally observed and numerically demonstrated. In addition to the periodic bifurcation of a single pulse, the periodic bifurcation under the double-pulse and multi-pulse states has also been observed. The study of the periodic bifurcation state can help us to understand the DSR pulse more comprehensively and to avoid this nonlinear effect for efficiently boosting the pulse energy further. Pulse shrinkage is another anti-DSR phenomenon. As the gain continues to increase, the DSR pulse is not broadened but narrowed. In the simulation, by constructing a filter whose center wavelength varies with the effective gain, one can obtain the shrinkage phenomenon similar to the experimental results. In addition, by adjusting the parameters, we further observe DSR pulse shrinkage in the PD state. The exploration of this phenomenon is helpful for us to understand the hindrance in the energy increase process of a DSR pulse.Conclusions and ProspectsDSR pulses have a broad application prospect in the fields of laser processing and laser medical treatment, and also have a great potential in obtaining high energies. Whether different mode-locking methods and intra-cavity structures are used or doped fibers at different wavelength ranges are adopted, researches on DSR pulses have always been in pursuit of higher and higher pulse energies. By exploring the DSR properties, one can comprehensively understand how to control the filtering effect in the cavity to obtain a higher pulse energy. The investigation on the anti-DSR phenomena can help us to understand the physical mechanism for the interruption of the continuous increase of pulse energy, and can further guide us to avoid this phenomenon, which in turn helps us to further improve the achievable pulse energy. In addition, finding new types of DSR pulses, such as considering DSR pulses operating in a multi-mode state, and exploring the generation and characteristics of a multi-mode DSR, are also conducive to further improve the pulse energy.
Jan. 01, 1900Vol. 49 Issue 21 2100002 (2022)
Yue Wang, and Jingqi Lu
ObjectiveWith the economy’s development and the enhancement of people’s living standards, the need for daily-use ceramic is increasing day by day. To meet various life scenes and requirements, there are not only low-cost products in the market but also high-end products. In the trend of product diversification, there exists the phenomenon of low-priced goods being counterfeited as high-priced goods, which damages the consumers’ rights and interests. Due to the difference in the producing area and the technology, the quality and price are set differently. It is difficult to identify with the naked eye due to its slight difference in appearance, so we must take reasonable measurements to select and identify products strictly.MethodsThe laser-induced breakdown spectroscopy (LIBS), a fast and emerging element detection approach, has the benefits of simple sample preparation and fast detection speed.The LIBS can be done in situ and can be employed for the identification of various kinds of daily-use ceramics. For this purpose, LIBS integrated with a generalized regression neural network (GRNN) is used for the classification and identification of various types of daily-use ceramics. All the 40 daily-use ceramic samples employed in this experiment are purchased from the market. The places of origin are Chaozhou City in Guangdong Province, Jingdezhen City in Jiangxi Province, Liling City in Hunan Province, and Suzhou City in Jiangsu Province. Before we get start, the samples are cleaned, dried, and then fragmented. The four various categories of daily-use ceramic samples are excited using LIBS technology. It is worth noting that a non-painting small fragment demonstrating a flat surface and without colored glaze is selected to produce the LIBS emission spectrum. LIBS spectra of ceramic samples are separated into training sets and test sets at random. The GRNN classification model is trained using training sets, and the test sets are employed to confirm the generated classification model.The experiment primarily consists of two aspects: first, discussing the impact of spectral data extraction on model effectiveness; second, optimizing the model’s performance. To discuss the impact of spectral data extraction on model effectiveness, two spectral data inputs are proposed: the whole spectral range and various primary characteristic spectral lines of the main elements. The ceramic body’s main elements include Fe, Mg, Si, Ca, Ti, K, Al, and Na. The main characteristic spectral lines are screened from the National Institute of Standards and Technology Atomic Spectra Database. Based on the LIBS spectra produced in the experiment and the screening principle of characteristic spectral lines, 28 characteristic lines of various elements are reserved (Table 1). To optimize the classification model’s performance and enhance the accurate rate of recognition, the model with the set of 28 characteristic spectral lines of the primary elements of the ceramic body as the input is improved. Before modeling, the spectral data are adjusted and then the abnormal spectral data are excluded using the Mahalanobis distance to reduce the adverse effect of poor spectra on the GRNN classification model. Then, the principal component analysis is employed to further simplify the LIBS spectral data. As shown in Fig. 6, the four major factors’ accumulative contribution rate to total variation accounts for more than 95%, maintaining most of the information, and achieving the purpose of simplifying the data. After finishing the GRNN model optimization, the two kinds of daily-use ceramics’ average spectra from Suzhou and Chaozhou are computed, and the difference in the various elements’ contents is discussed.Results and DiscussionsAs demonstrated in Table 2, the analyses show that the screening of valid data for the LIBS spectrum can significantly increase the modeling efficiency and the speed by about 45 times. On this basis, the spectral data are normalized, the abnormal spectra are screened out, and then the principal component analysis is employed to optimize the network’s performance. As demonstrated in Figs. 4 and 5, the prediction accuracy of GRNN increases from 94.5% to 97.44% after being screened by Mahalanobis distance. As demonstrated in Fig. 7, the prediction accuracy of GRNN after principal component analysis (PCA) can reach 100%. The process is repeated and the results are averaged. The findings are summarized in Table 3, the single prediction accuracy for the second set can reach 100%, and the average prediction accuracy can reach 99.74% after normalization, the data filtering with Mahalanobis distance and principal component analysis. Figure 8 describes the difference between the two ceramics’ average spectra from Suzhou and Chaozhou, the spectral line intensities of Ca, Al, K, Mg, and Si are visibly different.ConclusionsIn this research, the LIBS integrated with GRNN for the classification and identification of various types of daily-use ceramics is proposed. It has gained excellent findings. Taking the whole spectral range as the input of the GRNN classification model takes longer time than taking various main characteristic spectral lines of the primary elements as the input of the GRNN classification model. The model’s poor performance is attributed to data redundancy. The modeling speed is increased by 45 times after the screening of spectral lines. On this basis, spectral data are normalized, abnormal spectra are screened out using Mahalanobis distance, and then the principal component analysis is employed to optimize the network’s performance. The accuracy of classification is further enhanced. On all these counts, the correct classification of daily-use ceramic from their LIBS spectra integrated with GRNN can be achieved.
Jan. 01, 1900Vol. 49 Issue 21 2111001 (2022)
Chenlu Hu, Dawei Li, Xiaofeng Liu, Xiaoling Li, Yuanan Zhao, and Jianda Shao
ObjectiveIn the micro-electro-mechanical system, inertial confinement fusion, high power laser, and other fields, the problem of thermal failure or even damage of thin film components has become increasingly prominent, which has raised the concern on the thermal characteristics of thin-film devices. Therefore, it is necessary to study the generation and diffusion of heat in these devices. In addition, if necesssary, the forced heat dissipation is considered. Thermal diffusivity is a very important thermal parameter. The mechanism of laser damage, especially under long pulse or continuous laser irradiation, is thermal melting or thermal-mechanical coupling. Under certain heat sources, thermal diffusivity determines the temperature field distribution, thus determining the damage form and threshold. Therefore, the laser damage threshold of thin-film elements can be improved by improving thermal diffusivity. However, compared with bulk materials, the thermophysical properties of thin films are more specific. Different microstructures, impurities, and defects of thin films lead to great differences in thermal diffusivity. At present, there are not many high-precision measurement methods for micro-nano thin-film materials, and the existing methods have some disadvantages. Therefore, it is necessary to study a thermal diffusivity test method with high accuracy that is suitable for micro-nano thin-film materials, without letting the measurement results getting easily affected by the environment.MethodsIn this paper, a thermal diffusivity measurement method based on surface thermal lens (STL) technology is proposed. Pulsed pump light is used to heat the sample and a temperature field is formed by conduction along the film layer. A surface thermal bulge forms and the probe light is modulated to form an STL effect because of the thermal expansion in the temperature rise area. As the heat gradually diffuses from the pump spot to the surrounding area, the radius of the heat bulge gradually becomes large, but the time for the heat bulge reaching its peak height is different at different positions. The larger the distance from the pump spot, the more delayed the time for forming the heat bulge. Therefore, there exist phase differences among heat bulges generated at different positions along the radial direction, and this phase differences reflect the time required for heat to diffuse from the center to the surrounding area, which is affected by thermal diffusivity. The phase of the STL signal is found to be linearly related to the detection distance, and its proportional coefficient is related to the thermal diffusion length. The thermal diffusivity can be calculated using the diffusion length and the modulation frequency of the pump light. In the experiment, the phase data of the STL signal can be directly measured by the lock-in amplifier and the measurement distance data can be read on the displacement platform. By calibrating the magnification of the measurement distance and the detection distance, the detection distance can be calculated. Following this, the slope can be calculated and then thermal diffusivity can be calculated by drawing the relationship diagram between the phase and the detection distance.Results and DiscussionsThe thermal diffusivity of chromium film samples with a film thickness of 150 nm is measured by the proposed method and photothermal deflection spectroscopy (PDS) (Fig.5). For the STL method, the wavelength of pump light is 1064 nm, the power before modulation is 50 mW, and the wavelength of probe light is 632.8 nm. The measurement result by STL method is 36.9 mm2/s and the measurement error is only 0.8% compared with that by PDS. To verify the applicability of this method, measurements are also conducted for carbon, high-reflection, and antireflective films. The data of the two methods are close enough to prove the effectiveness of this method.ConclusionsCompared with PDS, the STL method has two major advantages. First, it is convenient to adjust and the detection light is conveniently aligned with a large pump spot. Moreover, the influence of the adjustment of the distance between the probe beam and the sample surface on the measurement results is avoided, which can save a lot of tedious device adjustment work, and errors caused by inadequate adjustment are avoided. Second, compared with PDS, which often uses air as the transmission medium, STL uses the probe beam as the medium to transmit thermal diffusion information, which can avoid signal fluctuation and measurement error caused by air flow disturbance around the sample. The device can be placed in a vacuum environment to reduce heat dissipation via air convection and improve measurement accuracy. The proposed method has advantages of relatively high measurement accuracy, capability of measuring micro-nano thin-film materials, device simplicity, and less environmental influence. Moreover, it can be further optimized to improve the measurement accuracies.
Jan. 01, 1900Vol. 49 Issue 21 2103101 (2022)
© Copyright 2018-2021 | Chinese Laser Press.
All Rights Reserved 沪ICP备15018463号-20