


Please enter the answer below before you can view the full text.

Jianrong Qiu, Chen Yang, Cheng Zhang, Jia Meng, Tao Han, Huanghe Qian, Peizhe Chen, Lu Yang, Zhiyi Liu, and Zhihua Ding
ObjectiveDeveloping a fiber probe with a high lateral resolution, long depth of focus, long working distance, and uniform axial light intensity is essential for endoscopic optical coherence tomography (OCT). Traditional beam shaping components, such as axicon lens and binary-phase mask, were minimized and adapted to miniature fiber probes for optimized output beams, but with a short working distance and reduced depth of focus gain compared to their bulk-optic counterparts. Alternatively, pure fiber techniques that simply splice fibers in series were proposed and demonstrated a significant enhancement in the imaging quality. The first demonstration of the concept suggested a phase mask consisting of a short section of overfilled graded-index fiber (Lorenser, 2012). However, the most recent progress indicated that using a step-index large core fiber as a coaxially focused multimode beam generator (Yin, 2017) or a high-efficient fiber-based filter (Ding, 2018) would be advantageous in terms of easy fabrication and increased depth of focus gain. However, full optimization of such probes is not straightforward, where the difficulty originates from the complexity of the light field by multimode interference and the arrangement flexibility of fiber components. Therefore, this study presents systematic research on the optimization of large core fiber probes. We discuss key design considerations for selecting fiber optics for mode excitation, number of modes, beam expansion method, and selecting the lens-free mode or spatial filter mode. We hope that our findings can be essential in designing the ultrathin fiber probe with improved performance for OCT imaging.MethodsA unified equation quantifying the depth of focus gain was first deduced by comparing the Gaussian beam with the same minimal beam diameter. Then, the fiber mode theory was applied to demonstrate the light field manipulated by the large core fiber. The tunning length of the large core fiber was determined by its re-imaging property and modal dispersion. According to the relative position of the large core fiber to the pupil of the objective, the working modes of the probe were classified into two catalogs. Consequently, proximate equations of the output light field were deduced for the two working modes. Then, the optimization goals and restrictions were established in terms of the depth of focus gain, lateral resolution, uniformity of axial light intensity, working distance, and sidelobes. The fast simulation method based on the mode expansion was applied to search for the probe parameters according to the established goals and restrictions. We obtained the preferable structure and the maximum achievable performance of the large-core-fiber-based probe by comparing the optimized results under different working modes, beam expansion methods, and the number of modes. The fiber probe with optimized parameters was fabricated and interfaced to a swept-source OCT system. A conventional probe with the same minimal beam diameter was also fabricated for comparison. The same region of fresh lemon was scanned with a translational stage and imaged by the two probes to confirm whether the improved specifications led to corresponding enhancement in the imaging quality.Results and DiscussionsSimilar to the binary phase filter that regulates the output beam by encoding the phases of annular zones on the aperture, the large core fiber can also adjust modal phases independently for the output beam manipulation. Additionally, the depth of focus, working distance, and lateral resolution are expected to increase with introduced higher modes. Although sidelobes become more significant with increased depth of focus, they can be mitigated by optimizing the modal power distribution. The large-core-fiber-based probe has less stringency on fabrication than the fiber phase mask. With a length tolerance of -28-+ 20 μm (Fig. 8), it is achievable for a commercial off-the-shelf fiber processing platform. The large-core-fiber-based probe features axially uniform light intensity compared with the coaxially focused multimode beam generator (Figs. 10 and 12). For the mode excitation device, we find that the graded-index fiber is superior to the tapered fiber in terms of a more robust splicing point. For the dual-mode interference, the amplitude ratio of the fiber mode can be tuned in the range of 0.2-0.3. For multimode interference, the graded-index fiber can be used with the no core fiber for efficient higher-order mode excitation (Fig. 12). For the working modes of the probe, we conclude that the spatial filter mode is advantageous in a larger depth of focus gain. Additionally, a longer working distance is attainable with beam relay optics (Table 4). The modal dispersion is the ultimate limit on the performance of the large-core-fiber-based probe. We confirmed that the maximum DOF gain of the probe was 3.8.ConclusionsThis study systematically investigates the optimization method of a large-core-fiber-based probe. By comparing the lateral resolution, working distance, and focal depth gain of various probe designs, we believe that the spatial filter design with beam relay optics and higher-order modes is beneficial for the probe performance. In addition to OCT imaging, the principle of the framework can be applied to optimize the output beam in laser scanning and photoacoustic imaging systems. Some presented elements of the work can also provide technical implications for non-imaging applications, such as fabrication of laser-fiber couplers and optical tweezers.
Jan. 01, 1900Vol. 49 Issue 20 2007201 (2022)
Xiuli Wang, Ruoxuan Du, X.Steve Yao, Ya Su, Shengwei Cui, Peng Hao, Lijun Yang, and Bingbing Duan
ObjectiveCardiovascular is one of the major diseases that threatens human health, and the prevalence of cardiovascular disease in China continues to grow. Therefore, it is important to select an appropriate model organism to understand the development of the heart. Locust has the characteristics of easy operation, strong plasticity, and short development cycle as well as the similar gene regulation mechanism with human beings in the process of cardiac development, therefore it becomes a useful candidate for studying the cardiac function and for the pathological gene analysis. Researchers have proposed a variety of methods to evaluate the heart function of insects, such as multi-sensor electrocardiogram, atomic force microscope monitoring, and electrical stress method. However, these methods are invasive and cannot monitor the same living body continuously. Therefore, a method which can monitor the heart development and screen the phenotypic variation of insects or other model organisms non-invasively is more desiderated. Fortunately, optical coherence tomography (OCT), widely used in biomedical detection because of its noninvasiveness, real-time, and high resolution, can be used to detect the internal structures of biological tissues and other non-uniform scatterers. Therefore, it is a more suitable tool to monitor the embryonic heart development of a locust. In addition, the measurement of cardiac function parameters (such as heart rate) still needs to be calculated manually by the M-Mode diagram, which is not only time-consuming but also prone to errors. Therefore, a high efficiency automatic detection algorithm is a critical issue to be solved urgently in the high-throughput screening and phenotypic analysis of model biological pathogenic genes.MethodsUsing a locust as the model organism, in our previous works we have monitored the embryo development and screened the phenotypic variation caused by the RNAi technology. Here, a new method is proposed to automatically and quickly calculate the insect heart function parameters, such as end diastolic diameter (EDD), end systolic diameter (ESD), end diastolic area (EDA), end systolic area (ESA) and heart rate (HR). The processing flow is shown in Fig. 2. The collected 3D data are expanded in time series to obtain the M-Mode diagram of the embryo heart chamber. After gray-scale transformation of the M-Mode diagram, by a series of operations including threshold-segmentation-based regional growth, boundary recognition, morphological processing, and feature peak extraction, the parameters including HR, EDD and ESD can be obtained.Results and DiscussionsThe low-frequency noise in the original M-Mode image [Fig. 3(a)] is removed after gray-scale transformation [Fig. 3(b)], which is beneficial for the calculation by the regional growth algorithm. Then, any point selected in the fetal heart ventricle [the red dot in Fig. 3(c)] can be used as the initial seed point, and the binary regional growth result can be obtained under the specified regional growth criterion [Fig. 3(d)]. As shown in Fig. 3(d), there are burrs at the edge of the ventricle caused by the non-uniformity of the grayscale distribution, which adversely influences the accuracy in obtaining the heart beat amplitude in the next step. To solve this problem, morphological processing is introduced, which plays a good role in smoothing the cavity edge. The image after removing burrs is shown in Fig. 3(e). By counting the numbers of pixels with the logical value of 0 in A-scan and knowing the size of single pixel, the beat amplitude of the heart at different moments can be obtained [Fig. 3(f)]. As shown in Fig. 3(g), the HR, EDD, and ESD cardiac parameters can be calculated after the extreme points are found by the peak extraction algorithm. If the original image is changed from the M-Mode image to the B-scan image of the cross section of the embryonic heart, the maximum EDA and the minimum ESA of the locust embryonic heart can be calculated according to the steps in section 2.2, as shown in Fig. 6. Therefore, one can automatically detect and quantitatively analyze the heart function parameters of insect embryos by the proposed algorithm.ConclusionsIn the field of heart development and mechanism of heart disease, OCT has been successfully applied to detect the heart function of model organisms such as insects due to its advantages of noninvasiveness, real-time, and high resolution. However, the detection algorithm still has some problems, such as low efficiency, high requirements on image quality, and inaccuracy of measurement, especially it is not suitable for the detection under a large sample size. In this paper, we propose a high speed automatic detection and quantitative analysis algorithm of insect cardiac function parameters by OCT. The position of the seed point is determined through human-computer interaction, and a series of processing such as automatic image segmentation and target region division are performed on the OCT M-Mode image of the insect heart. The proposed algorithm can quickly and accurately measure the cardiac function parameters including the end diastolic diameter, end systolic diameter, end diastolic area, end systolic area, and heart rate. This method can improve the screening and analysis efficiency of pathogenic genes in high-throughput biological samples and has important applicable value in the research of cardiovascular disease using insects as model organisms.
Jan. 01, 1900Vol. 49 Issue 20 2007202 (2022)
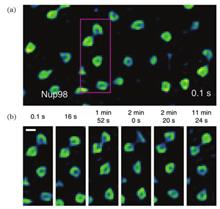
Guanchen Wang, and Tongsheng Chen
SignificanceIt is well-known that subcellular organelles are essential components of cells. Their morphological structures and dynamic characteristics directly reflect the physiological state of cells. Scientists have paid significant attention to the observation and analysis of the fine structures of subcellular organelles in living specimens.The emerging super-resolution microscopy (SRM) techniques in the early 21st century, such as structured illumination microscopy (SIM), stimulated emission depletion (STED), and single-molecule localization microscopy (SMLM), skillfully bypass the limitation of the optical diffraction limit and effectively retain the advantages of optical microscopy. SRM techniques have been widely used in monitoring subcellular organelles in living cells.ProgressThis article systematically elaborates and analyzes the super-resolution structure characteristics of subcellular organelles in living cells. First, it briefly introduces the basic principles and fundamental characteristics of the three kinds of SRM techniques, i.e., STED, SIM, and SMLM, and expounds their development status. Second, the super-resolution fine structures and dynamic characteristics of subcellular organelles, such as the nucleus, cytoskeleton, mitochondrion, and endoplasmic reticulum (ER), are presented.In 2016, Chagin et al. quantitatively measured and analyzed replication foci (RF) in mammalian cells using three-dimensional (3D) SIM. Mitchell-Jordan et al. (2012) directly imaged histone protein H3 in mammalian cells using STED to show the chromatin domain characteristics at the scale of 40-70 nm. Wombacher et al. and Lukinavicˇius et al. also employed STORM to observe the distribution of histone protein H2B in living HeLa and U2OS cells, respectively. Pelicci et al. (2020) imaged nuclear Lamin-A in intact nuclei of living cells through SPLIT-STED. Otsuka et al. (2016) captured images of different steps involved in assembling the NPC in a human cell. Lu et al. and Zhao et al. also realized the NPC super-resolution fluorescence imaging using different methods.Gustafsson et al. (2009) employed SIM to monitor the dynamic characteristics and fine structures of microtubules. Additionally, Li Dong et al. further investigated the fine structures of the cytoskeleton based on SIM. Shao et al. (2011) clearly observed that microtubules in Drosophila S2 cells showed wrapped reticular structure and were distributed sparsely in these 3D-SIM images. Zhuang Xiaowei et al. (2012) revealed the 3D ultrastructure of the microfilament skeleton using the dual-objective STORM (Fig. 2). D’Este (2015) combined the two-color STED nanoscopy with SiR-Actin to show that the periodic cytoskeleton organization is ubiquity in axons and dendrites of living hippocampal neurons. Lukinavicˇius et al. (2014) disclosed the ninefold symmetry of the centrosome and the spatial organization of the actin in the axons of rats using STED. Recently, Wang et al. (2022) proposed JSFR-SIM and followed the microtubule motion in live COS-7 cells.Additionally, Shim et al. (2012) observed the dynamic processes of mitochondrial fission/fusion through the STORM images of the mitochondrial membrane of living BS-C-1 cells. In 2020, the image data, hyperfine structures of mitochondria, and dynamic processes at different time points in living HeLa cells were attainable using STORM. Huang et al. (2018) successfully found the changes in mitochondrial crista during the fission and fusion of the mitochondrial. They identified the inter-cristae mergence in a single non-fusion mitochondrion using the Hessian-SIM system suitable for long-term super-resolution imaging of living cells (Fig. 3). Guo et al. (2018) also combined multicolor imaging technology with the newly proposed GI-SIM to observe the mitochondrial fission/fusion events at the ER-mitochondria contact sites. Wang et al. (2019) and Yang et al. (2020) accomplished the dynamic monitoring of mitochondrial crista using STED (Fig. 4). Recently, Wang et al. (2022) visualized the mitochondrial dynamics of living COS-7 cells through JSFR-SIM. A mitochondrion extended a tubulation tip, made contact with another mitochondrion, and then immediately retreated in the opposite direction.Furthermore, Shim et al. (2012) successfully realized the STORM dynamic imaging of ER membrane (Fig. 5) and expressly observed the previously obscured details of morphological changes in ER remodeling. Georgiades et al. (2017) quantitatively analyzed the length and diameter of ER tubules using STORM. Guo et al. (2018) employed GI-SIM to obtain the formation and disappearance of ER contraction sites and the reconstruction of ER tubules in living COS-7 cells. Zhu et al. (2020) recently realized the real-time STED monitoring of 3D dynamic interaction between ER and mitochondria.Finally, the development potential of combining super-resolution imaging with machine learning in exploring the fine structures of subcellular organelles is discussed.Conclusion and ProspectIt is an inevitable trend in cell image processing fields to apply deep learning algorithms in extracting information from subcellular super-resolution fluorescence images and help researchers analyze the image data. To achieve accurate and robust subcellular super-resolution image analysis, it is necessary to solve the problems of insufficient standardization of datasets and poor generalization ability of algorithm models.
Jan. 01, 1900Vol. 49 Issue 20 2007203 (2022)
Ruirong Wang, Dandan Cui, and Yujiao Shi
ObjectiveThe occurrence of numerous diseases, including cancer, cardiovascular diseases, and degenerative diseases, is closely related to the specific high expression of GSH. For instance, in A549 human lung adenocarcinoma cells, the GSH concentration was approximately an order of magnitude higher than that in normal cells. Therefore, the development of highly sensitive GSH detection and imaging approaches has crucial clinical value for the diagnosis of related diseases and a better understanding of the pathogenesis of the disease. The development of highly sensitive deep imaging approaches that can achieve GSH-specific responses in tumor tissues is still urgently needed. Photoacoustic (PA) imaging technology, as a novel biomedical imaging approach, which combines the high sensitivity of optical imaging with the deep penetration capability (up to 10 cm) of ultrasonic imaging, has been favored by the field of biomedical imaging in the last two decades. However, the characteristic molecules of many major diseases have weak optical absorption in the optical window of biological tissue (NIR-Ⅰ, 650-950 nm; NIR-Ⅱ, 950-1700 nm), resulting in the inability to generate a strong enough signal under excitation light irradiation, so that it is impossible to Realize photoacoustic imaging. Thus, developing nanoprobes with specific optical absorption properties as exogenous contrast agents for photoacoustic imaging can enhance the photoacoustic signal, thereby greatly improving the imaging contrast. Presently, various nanomaterials have been developed as exogenous contrast agents for photoacoustic imaging, including noble metal nanoprobes, carbon-based nano-2D materials, and high molecular polymers. Most of these materials are not biologically responsive and cannot specifically respond to specific substances in cells; they often lack the specific ability to recognize diseases. In this study, the authors developed a photosensitive AgBr@PLGA nanoprobe that can specifically respond to highly expressed GSH in the tumor microenvironment and proposed a tumor-specific near-infrared second region (NIR-Ⅱ) photoacoustic imaging approach.MethodsThe synthesized photosensitive AgBr@PLGA nanoprobes can be passively targeted to tumor tissue and can generate optical latent images triggered by external white light LEDs. GSH in the tumor microenvironment can reduce these optical latent images, resulting in a considerable number of silver nanoparticles that demonstrate strong light absorption and sharp improvements in photoacoustic signal in the NIR-Ⅱ region, thereby realizing specific photoacoustic imaging of tumor tissue.Results and DiscussionsThe authors characterize the morphology and optical properties of the synthesized nanoprobes, and confirm in vitro their photosensitivity and GSH response characteristics in response to externally triggered white light LEDs. The experimental findings show that the prepared nanoparticles have good biocompatibility and ultra-high sensitivity to external trigger light, and the photoacoustic signal is continuously strengthened as exposure time increases. The model demonstrated that the synthesized AgBr@PLGA nanoprobes can attain high-contrast tumor-specific imaging in vivo, demonstrating the synthesized photosensitive great application potential of nanoprobes in tumor-specific photoacoustic detection and diagnosis.ConclusionsIn this research, AgBr@PLGA nanocrystals were successfully used for ultrahigh-sensitivity and tumor-specific photoacoustic imaging through optical writing and redox chromogenic reactions. AgBr@PLGA NCs can show improved NIR-Ⅱ absorption because of the reduction of Ag nanoparticles when exposed to external trigger light after activation by GSH at the tumor site, as illustrated in Figure 2. The tumor-rich GSH content reduces the turn-on of NIR-II light absorption of AgBr@PLGA nanocrystals, enabling tumor-specific photoacoustic imaging with relatively high imaging depth, as demonstrated in Figure 5. Furthermore, this technique can accomplish contrast improvement in the tumor area by controlling the exposure time, and employing this approach can suppress unwanted background signals, such as blood signals in molecular imaging, as demonstrated in Figure 4. However, it should be noted that the response of the material at the imaging wavelength is not the same as the position of the absorption peak. We will develop photosensitive materials with strong absorption in the NIR-Ⅱ region in the following study to achieve deeper PA imaging. This study will attract more attention to the development of effective activatable PA probes for accurate biomedical imaging.
Jan. 01, 1900Vol. 49 Issue 20 2007204 (2022)
Yuan Yuan, Minghui Chen, Shuting Ke, Teng Wang, Longxi He, Linjie Lü, Hao Sun, and Jiannan Liu
ObjectiveWith the increasing prevalence and blindness rate of fundus diseases, the lack of ophthalmologist resources is increasingly unable to meet the demand for medical examination. Given the shortage of ophthalmic medical staff, long waiting process for medical treatment, and challenges in remote areas, there is an irresistible trend to reduce the workload of medical staff via artificial intelligence. Several studies have applied convolutional neural network (CNN) in the classification task of fundus diseases; however with the advancement of Transformer model application, Vision Transformer (ViT) model has shown higher performance in the field of medical images. ViT models require pretraining on large datasets and are limited by the high cost of medical image acquisition. Thus, this study proposes an ensemble model. The ensemble model combines CNN (EfficientNetV2-S) and Transformer models (ViT). Compared with the existing advanced model, the proposed model can extract the features of fundus images in two completely different ways to achieve better classification results, which not only have high accuracy but also have precision and sensitivity. Specifically, it can be used to diagnose fundus diseases. This model can improve the work efficiency of the fundamental doctor if applied to the medical secondary diagnosis process, thus effectively alleviating the difficulties in diagnosis of fundus diseases caused by the shortage of ophthalmologist staff, long medical treatment process, and difficult medical treatment in remote areas.MethodsWe propose the EfficientNet-ViT ensemble model for the classification of fundus images. This model integrates the CNN and Transformer models, which adopt the EfficientNetV2-S and ViT models, respectively. First, train the EfficientNetV2-S and ViT models. Then, apply adaptive weighting data fusion technology to accomplish the complementation of the function of the two types of models. The optimal weighting factors of the EfficientNetV2-S and ViT models are calculated using the adaptive weighting algorithm and then the new model (EfficientNet-ViT) is integrated with them. After calculating the weighting factors 0.4 and 0.6, multiply the output of the ViT model by a weighting factor of 0.4, multiply the output of the EfficientNetV2-S model by a weighting factor of 0.6, and then weigh the two to obtain the final prediction result. According to clinical statistics, the current common fundamental disease in my country includes the following diseases: diabetic retinopathy (DR), age-related macular degeneration (ARMD), cataract, and myopia. These fundus diseases are the main factors that cause irreversible blindness in my country. Thus, we classify fundus images into the following five categories: normal, DR, ARMD, myopia, and cataract. Furthermore, we use three indicators, such as accuracy, precision, and specificity. The EfficientNet-ViT ensemble model can extract the features of fundus images in two completely different ways to achieve better classification results and higher accuracy. Finally, we compare the performance indicators of this model and other models. The superiority of the integrated model in the fundus classification is verified.Results and DiscussionsThe accuracy of EfficientNet-ViT ensemble model in fundus image classification reaches 92.7%, the precision is 88.3%, and the specificity reaches 98.1%. Compared with EfficientNetV2-S and ViT models, the precision of EfficientNet-ViT ensemble model improves by 0.5% and 1.6%, accuracy improves by 0.7% and 1.9%, and specificity increases by 0.6% and 0.9%, respectively (Table 3). Compared with Resnet50, Densenet121, ResNeSt-101, and EfficientNet-B0, the accuracy of the EfficientNet-ViT ensemble model increases by 5.4%, 3.2%, 2.0%, 1.4%, respectively (Table 4), showing its superiority in the fundus image classification task.ConclusionsThe EfficientNet-ViT ensemble model proposed in this study is a network model combining a CNN and a transformer. The core of the CNN is the convolution kernel, which has inductive biases, such as translation invariance and local sensitivity, and can capture local spatio-temporal information but lacks a global understanding of the image itself. Compared with the CNN, the self-attention mechanism of the transformer is not limited by local interactions and can not only mine long-distance dependencies but also perform parallel computation. This study uses the EfficientNetV2-S and ViT models to calculate the most weighted factors for the CNN and Transformer models through the adaptive weighted fusion method. The EfficientNet-ViT can extract image features in two completely different ways. Our experimental results show that the accuracy and precision of fundus image classification can be improved by integrating the two models. If applied in the process of medical auxiliary diagnosis, this model can improve the work efficiency of fundus doctors and effectively alleviate the difficulties in diagnosis of fundus diseases caused by the shortage of ophthalmic medical staff, long waiting process for medical treatment, and difficult medical treatment in remote areas in China. When more datasets are used to train the model in the future, the accuracy, precision, and sensitivity of automatic classification may be further improved to achieve better clinical results.
Jan. 01, 1900Vol. 49 Issue 20 2007205 (2022)
Lingran Gong, Xiyu Jia, Yuanyuan Xu, Yawei Wang, and Ying Ji
ObjectiveCells are the basic units of biomass, and their morphological structures are often associated with the functional state of biomass. Therefore, the morphology of a cell is an important research topic in life science and a critical factor in clinical medical diagnosis. Quantitative phase imaging technology, as a powerful nondestructive and label-free imaging tool, provides various biological and physical properties for the quantitative evaluation of cells. Although the phase diagram of the sample provided by this technology contains information about its internal structure, the thickness and refractive index of the sample is coupled with the phase data. Decoupling the phase data is required to reconstruct a three-dimensional (3D) morphology of the sample. Dual-wavelength imaging technology is effective for single medium samples. However, this method does not work for multimedia phase objects. In response to this shortage, this study proposes a new reconstruction method based on orthogonal dual-wavelength measurements.MethodsThe 3D reconstruction method is based on three phase images from two orthogonal directions. Two of these phase images are obtained with two different wavelengths. The first step is to separate the phase shift due to different substructures. Given that the environmental liquid is a highly dispersive material relative to the cell sample, the refractive index (RI) of the environmental liquid correspondingly changes under different incident light, whereas the RI of the sample remains constant. Thus, by subtracting the two images at two different wavelengths, the physical thickness of the media adjacent to the environment (such as cytoplasm) can be determined. Next, the average RI of the cytoplasm can be extracted using the associated phase value distribution, while phase shifts due to cytoplasm and nucleus are also separated immediately. Following that, the thickness information of the nucleus for the incidence along the two directions can be obtained using a phase diagram from the orthogonal direction. Thus, the RI of the nucleus can be calculated from the nuclear phase value. The relative position of the cytoplasm and nucleus can also be determined using two orthogonal phase diagrams. The 3D morphology of the multimedia phase object is obtained by combining the physical thickness distributions of the cytoplasm and nucleus.Results and DiscussionsThe reconstructions of models with different structural characteristics are explored, including a cell with a single spherical nucleus (Fig. 2), a cell with a single saddle shape nucleus [Fig. 5(a)], and a binuclear cell with a double spherical nucleus [Fig. 6(a)]. The results of these samples [Figs. 9, 11(c), and 12(e)] are consistent with the initial model. Especially, the analytic method provides a sharp reconstruction result of the physical thickness of the cytoplasm and the entire reconstruction process takes a short time (Tables 1, 2, and 3). This study suggests the feasibility of this reconstruction method, but the actual application effect depends on many factors, such as image noise, heterogeneity of RI distribution, and calculation error in edge detection. An emphasis of the following study is to explore an efficient reconstruction algorithm suitable for experiments.ConclusionsThis study proposes a 3D morphological reconstruction method for nucleated cells based on orthogonal dual-wavelength phase images. This method requires three phase images from two orthogonal directions and is divided into two steps. First, using the high dispersion characteristics of environmental liquid and edge detection, the phases of the cytoplasm and nucleus are separated based on the independence and superposition of phase data, and the thickness of the cytoplasm is decoupled simultaneously. Then, the 3D morphology of the sample is reconstructed using another orthogonal phase diagram, RI and thickness information of the coupling nucleus, and the relative position relationship of the substructure expressed by two mutually orthogonal phase diagrams. This method collects sample information from two directions simultaneously. A small amount of data means convenient data acquisition and fast data processing. The simulation results show that the algorithm, which may provide a reference for real-time imaging of biological cells, is effective.
Jan. 01, 1900Vol. 49 Issue 20 2007206 (2022)
Feng Liu, Min Han, Jun Wang, and Chao Liu
ObjectiveSince the outbreak of COVID-19, many hospitals have become overloaded with patients seeking examination, resulting in an imbalance between medical staff and patients. These high concentrations of people in hospital settings not only aggravate the risk of cross-infection among patients, but also stall the public medical system. Consequently, mild and chronic conditions cannot be treated effectively, and eventually develop into serious diseases. Therefore, the use of deep learning to accurately and efficiently analyze X-ray images for diagnostic purposes is crucial in alleviating the pressure on medical institutions during epidemics. The method developed in this study accurately detects dental X-ray lesions, thus enabling patients to self-diagnose dental conditions.MethodsThe method proposed in this study employs the YOLOV5 algorithm to detect lesion areas on digital X-ray images and optimize the network model’s parameters. When hospitals and medical professionals collect and label training data, they use image normalization to enhance the images. Consequently, in combination with the network environment, parameters were adjusted into four modules in the YOLOV5 algorithm. In the Input module, Mosaic data enhancement and adaptive anchor box algorithms are used to generate the initial box. The focus component was added to the Backbone module, and a CSP structure was implemented to determine the image features. When the obtained image features are input into the Backbone module, the FPN and PAN structures are used to realize feature fusion. Subsequently, GIOU_Loss function is applied to the Head moudule, and NMS non-maximum suppression is used to generate a regression of results.Results and DiscussionsThe proposed YOLOV5-based neural network yields satisfactory training and testing results. The training algorithm produced a recall rate of 95%, accuracy rate of 95%, and F1 score of 96%. All evaluation criteria are higher than those of the target detection algorithms of SSD and Faster-RCNN (Table 1). The network converges to smoothness after loss is reduced in the training process (Fig. 6), which proves that the network successfully learns the necessary features. Thus, the difference between predicted and real values is very small, which indicates good model performance. The mAP value of network training is 0.985 (Fig. 7), which proves that the network training meets the research requirements. Finally, an observation of the visualized thermodynamic diagram reveals that the network’s region of interest matches the target detection region (Fig. 8).ConclusionsThis study proposes the use of the YOLOV5 algorithm for detecting lesions in dental X-ray images, training and testing on the dataset, modifying the network’s nominal batch size, selecting an appropriate optimizer, adjusting the weight parameters, and modifying the learning rate attenuation strategy. The model’s training results were compared with those of algorithms used in previous studies. Finally, the effect of feature extraction was analyzed after the thermodynamic diagram was visualized. The experimental results show that the algorithm model detects lesion areas with an accuracy rate of more than 95%, making it an effective autonomous diagnostic tool for patients.
Jan. 01, 1900Vol. 49 Issue 20 2007207 (2022)
Gen Mu, Zhenhui Zhang, and Yujiao Shi
SignificanceMedical imaging is a key tool for life science research, diagnosis and treatment. Traditional medical imaging techniques include magnetic resonance imaging (MRI), computed tomography (CT), positron emission tomography (PET), ultrasonic imaging (US) and optical coherence tomography (OCT), etc. Each of them plays an important role in medical imaging, with each showing its own advantages and limitations. MRI is not only expensive but also has many safety restrictions, which means it is not suitable for the patients with pacemakers or claustrophobic. CT is not suitable for children and pregnant women because of ionizing radiation. PET has a large number of applications in the study of life metabolism and tumor research. However, it requires radioactive element markers and is difficult to be widely used in clinical medical imaging due to its high cost. US has poor specificity and spatial resolution, and lacks fine biological structure imaging capabilities for the early development of the disease. OCT and other optical imaging technologies are limited by the optical diffusion limit, which results in the general imaging depth within about 1 mm.Photoacoustic (PA) imaging is a hybrid biomedical imaging modality combining the advantages of high contrast of optical imaging and deep penetration of ultrasound imaging. The spatial scale of PA imaging covers from subcellular structures to organs. In addition, it has many other advantages such as non-invasive imaging, label-free imaging, molecular imaging and compatible with multi-modality. Although PA imaging has encountered many challenges in the process of clinical translation, PA imaging has overcome a series of difficulties and will have broader application prospects in the field of biomedical imaging thanks to the development of related technologies. The purpose of this article is to help readers in related fields of biomedical imaging to form a more comprehensive understanding of PA imaging, and to quickly understand the main progress of PA imaging research in recent years.ProgressThis review article provides a brief introduction to the basic principles and main modes of PA imaging. Photoacoustic computed tomography (PACT) and photoacoustic microscopy imaging (PAM) are the two main modes of PA imaging. Photoacoustic endscopy (PAE) is the application of PA in endoscopy, and photoacoustic molecular imaging expands the capabilities of PA imaging in molecular-level detection.PACT is suitable for large-scale imaging of the human brain, limbs, breast and other large-size targets. Over the past decade, PACT has made lots of advances in high-speed and deep imaging. However, the issues about economy and portability still hinder the further clinical translation of PACT. Fortunately, the technological development of ultrasonic transducers and low-cost laser sources and the advancement of advanced reconstruction algorithms have provided solutions to the above problems. PAM has broad application prospects from subcellular structure to organ level. High/super-resolution, fast imaging, and higher imaging quality have always been the common pursuit of researchers. The nonlinear effect greatly contributes to the improvement of the resolution of PA imaging. The extended depth-of-field technology can solve the defocus problem encountered by PAM in volume imaging. Advanced scanning methods are one of the main solutions to high-speed PA imaging. In addition, non-contact PA imaging is another important direction in clinical applications, and corresponding technological breakthroughs have also been made in recent years. As the expansion of PA imaging, PAE is a promising technology for endoscopic imaging by drawing on the related progress of PACT and PAM, such as extended depth-of-field technology, optical scanning methods and multi-modality imaging. Aiming at the problem that some tumors lack characteristic absorption peaks, PA molecular imaging holds great promise in the diagnosis and treatment of diseases. In recent years, the development of PA molecular imaging has focused on the near-infrared window to improve the depth of imaging. The PA signal enhancement mechanism can improve the sensitivity and specificity of imaging. Furthermore, the design of integrated diagnosis and treatment PA contrast agents is also a hot topic in PA molecular imaging.Conclusions and ProspectsAlthough PA imaging has made a lot of breakthroughs in recent years, it has not yet achieved a large-scale clinical application. In the next few years, the resolution, depth, speed and sensitivity of PA imaging will still be the research focus of researchers in related fields. Costs will be further reduced by using low-cost laser sources, while imaging speed and quality will meet the needs of most clinical applications thanks to technological advances in related fields. In addition, by the design of the PA contrast agent in the second near-infrared window (NIR-Ⅱ), the depth of PA imaging will further increase. We believe that through the joint efforts of researchers in related fields, PA imaging will play a more important role in the clinic practices.
Jan. 01, 1900Vol. 49 Issue 20 2007208 (2022)
Yakun Liu, Wen Xiao, Leiping Che, Yinjia Li, Xi Xiao, Hao Wang, and Feng Pan
ObjectiveCancer is a disease caused by the uncontrolled growth and division of malignant cancer cells. Since the 21st century, the incidence and mortality of cancer have been increasing rapidly worldwide, making it a medical problem that affects countries worldwide. The pathological mechanism of cancer and the study of various therapeutics based on inducing cancer cell death both greatly benefit from research on the morphology and function of cancer cells at the single-cell level, particularly research on the process of cancer cell death. Digital holographic microscopy, a quantitative phase imaging technique, offers a nondestructive, unlabeled, and noncontact quantitative measurement tool for biological research. It can also provide nondestructive quantitative imaging of living cells. In this paper, digital holographic tomography was used in the three-dimensional quantitative detection of bladder cancer cell vacuolation. This work can broaden the field of application for digital holographic tomography in the biomedical industry, offer new perspectives on how to study the morphological changes that occur during cancer cell apoptosis, and investigate potential new cancer treatment approaches.MethodsThis study focuses on the vacuolar structure of cancer cells existing in the process of paraptosis. First, the hologram of bladder cancer cells with vacuoles inside was obtained using digital holographic microscopy. Then, the amplitude and phase of cells were obtained by filtering, digital focusing, angular spectrum propagation, and phase unwrapping. Their three-dimensional morphology and spatial locations were reconstructed using the diffraction tomography reconstruction algorithm combined with nonnegative constraints. Finally, morphological parameters such as the surface and volume of the vacuoles were calculated according to the number of pixels in the image.Results and DiscussionsDigital holographic tomography was used in this study to produce three-dimensional reconstruction results of four bladder cancer cells with vacuoles (Figure 8). Four morphological parameters, including the volume, surface, surface to volume, and the ratio of vacuoles volume to cell volume, were calculated (Table 1). Digital holographic tomography, as a technique for three-dimensional quantitative imaging, was used to examine cancer cells with vacuoles. It can quantitatively determine the volume, position, and other morphological parameters of the vacuoles. By combining with the biomedical research, it can be used to observe the changes in three-dimensional shape and volume of tumor cells’ internal vacuoles induced by drugs, to explore the correlation between the expression of some proteins and the morphological characteristics of vacuoles, to provide a more comprehensive and profound understanding of the process of paraptosis of cancer cells and to find new methods for cancer treatment.ConclusionsThe application of digital holographic tomography to bladder cancer cell vacuolation imaging is described in this research. The results have shown that digital holographic tomography can accurately reconstruct the three-dimensional shape and space position of the vacuolation in bladder cancer cells. The above research progress is of great significance for studying the paraptosis process of cancer cells as well as the related mechanisms and treatment strategies of drug-induced paraptosis of cancer cells.
Jan. 01, 1900Vol. 49 Issue 20 2007209 (2022)
Hongfei Wang, ShiQing Ma, Lei Min, Shuai Wang, Wei Yang, Chuan Xu, and Ping Yang
ObjectiveIn the process of medical image acquisition, due to some factors of the image acquisition device (such as improper parameter adjustment and the limitation of the equipment’s inherent attributes) or the conditions of the object itself (that is, the light absorption and reflection of different attributes) makes the signal collecting process and transferring process in the presence of complicated noise model, causing lung CT image has the characteristics of low contrast and visible mask. Therefore, images with poor visual quality seriously interfere with the efficiency of clinical diagnosis and are a significant obstacle to the subsequent use of images. There is a lot of research on medical image enhancement, but the work on lung CT image enhancement is still lacking. Additionally, when processing images, existing image contrast enhancement algorithms based on histogram equalization tend to introduce unnecessary artifacts, produce an artificial appearance, and cause wash-off effects. Therefore, this paper researched lung CT image enhancement.MethodsWe devote to overcoming this over-enhancing problem of existing algorithms and then propose an algorithm which can realize appropriate contrast enhancement without introducing new artifacts, that is an image enhancement algorithm based on image segmentation and a total variation model. As is known to all, lung CT images are poor in contrast due to their narrow dynamic grayscale range. And the visual perception of difference relies on gray histogram distribution characteristics to a great extent. Therefore, the research method of contrast enhancement adopted in this article is based on gray histogram transformation. Furthermore, regarding the feature differences between the foreground and background of lung CT images, a segmentation method based on a global threshold is used to segment the lung parenchyma that doctors are interested in for further processing.As for the complex noise model in the image, traditional denoising methods are challenging to ensure the regularization of image enhancement results. Consequently, this framework uses the gradient descent method and the total variation framework to separate the image’s noise from the perspective of minimizing energy. Following that, the image structure information and the image detail information will be obtained along with the noise. Then, wavelet transform technique is used to suppress the noise among the image detail information.The pipeline of the algorithm is as follows, dividing the image into foreground and background firstly, performing bipolar threshold clipping and cumulative distribution function redistribution on the histogram of the foreground lung parenchyma image to form a modified histogram, and then performing Gamma adaptive stretching on the image according to the modified histogram. As a result, the contrast-enhanced foreground image is obtained and fused with the background image as the input of the total variation model. The total variation model then decomposes the image into a texture layer and a structural layer. Next, the texture layer is denoised by the wavelet threshold. Finally, the enhanced image is obtained by fusion of texture layer and structural layer.Results and DiscussionsThis research proposed a framework for improving lung CT images using image segmentation, histogram modification, total variational, and wavelet transform technique (Fig. 2). The subjective analysis of the experimental results shows that the algorithm effectively suppresses the artifacts noise of the image, solves the defect of the existing algorithm over-enhancing lung CT image, comprehensively improves the image contrast, and preserves the complete natural information of the image, as shown in Fig. 3 and Fig. 4. The comparison of image details in Fig. 3 shows that the enhanced image maintains a reasonable degree of regularity in terms of appearance display, texture details, and edge characteristics.The average value of the objective evaluation index of the experimental results is shown in Table 1. It can be seen that the objective evaluation index parameters of the proposed method have obvious advantages compared with other existing image enhancement methods by comparing the image evaluation index, such as the contrast, grayscale resolution, structural similarity, and absolute mean brightness difference. For instance, the proposed algorithm framework not only fully enhances contrast by increasing grayscale dynamic range display, but also assures the regularity of the enhanced results. The average intensity of the enhanced image by our algorithm is closest to that of the original image, showing the enhanced image has the highest similarity with the original image.ConclusionsThis paper proposes an image enhancement algorithm that solves the issues of low contrast and visible mask in lung CT images. Furthermore, it overcomes the tissues of over enhancement and washout effects which are easy to occur in existing image enhancement algorithms. The research shows that the proposed method can effectively suppress the artifacts noise of the original image in the different areas of the test image, enhance the contrast of the lung CT image, improve the visual effect significantly, and overcome the unwanted artificial artifact greatly. The algorithm is significantly better than other enhancement algorithms in terms of subjective performance evaluation and objective evaluation index. Therefore, the enhancement framework proposed in this paper can provide robust technical support for lung CT image enhancement and improve the efficiency and accuracy of clinical diagnosis and treatment.
Jan. 01, 1900Vol. 49 Issue 20 2007210 (2022)
Lu Gao, Beibei Gao, and Fu Wang
SignificanceThe mammalian brain is a complex and essential organ involving complex processes like memory, cognition, and feeling, and is linked to various mental diseases. However, our knowledge and research of this part are limited, and the research on the brain will be a long-term exploration. Currently, the brain imaging of living animals can intuitively display the morphological changes in the brain during life activities, allowing researchers to study the functional activities of the brain, which is vital for understanding the structure and function of the brain. Owing to the thick brain tissue, brain imaging in vivo is affected by factors such as light scattering, light absorption, and aberration, which hinders the optical imaging of the deep structure of the brain. Similarly, the resolution of the general optical microscope cannot exceed 200 nm due to an optical diffraction limit, and it cannot distinguish the subtle structures such as neuronal synapses in the brain nor analyze the structures that play a vital role in brain functional activities.The multiphoton imaging technology was used in the past to improve imaging depth. This technology uses a nonlinear excitation effect and often utilizes near-infrared excitation, which can stimulate short-wavelength fluorescence signals with long-wavelength lasers. With low scattering and the absorption of the near-infrared light of the tissue, it can attain a high penetration depth and reduce the background interference of the tissue. It is an important method for thick tissue imaging. Additionally, multiphoton imaging only stimulates fluorescence at the focal plane, which has the natural characteristic of "light slicing" , which decreases the signal interference of the defocus plane and tissue stimulation damage. Therefore, the multiphoton imaging technology is suitable for imaging the brain in vivo. Nevertheless, the diffraction limit remains a major concern for this technology.Introducing the super-resolution imaging technology makes nano-optical imaging possible. The super-resolution microscopic imaging technology is applied to the in vivo imaging of the brain, which can dictate the delicate features like neuronal synapses and then study the functional activities of the brain at the in vivo level. Meanwhile, based on the traditional multiphoton imaging technology, introducing the super-resolution microscopic imaging technology, combined with the benefits of penetration depth and spatial resolution, can enhance the in vivo imaging ability of the brain, which is beneficial in the fields such as neuroscience and brain disease research.ProgressFirst, the super-resolution imaging technologies used in brain imaging, stimulated emission depletion (STED) and structure illumination microscopy (SIM), are summarized (Table 1). Currently, the STED imaging technology is the main living animal brain imaging technology (Fig. 2). Hell’s research group applied STED to the imaging of neuronal dendritic spines or actin filaments in the mouse cerebral cortex and achieved a lateral resolution exceeding 70 nm. However, there are few reported SIM imaging technologies. Although the spatial resolution of SIM is essentially limited to 100 nm, its excellent imaging depth also has potential. Additionally, both super-resolution technologies have been tried to combine with the two-photon imaging technology. Although they have improved the imaging depth to a certain extent, the depth has not exceeded 120 nm, which does not achieve the desired effect of two-photon imaging. Moreover, according to the research status, the main challenges faced by the super-resolution imaging technology in living brain imaging are analyzed and discussed, and the five aspects of imaging speed, imaging depth, imaging time, fluorescent probe, and animal state are summarized. Furthermore, the application of the super-resolution imaging technology still needs to make efforts in spatial resolution. Finally, suggestions for solving these problems are presented.Conclusion and ProspectThe super-resolution imaging technology can break through the optical diffraction limit and be applied to living brain imaging. It is of great importance to study the structure and function of the brain at the nano level. Presently, STED and SIM are two main application technologies, and good progress has been made in combination with two-photon imaging. Presently, applying the super-resolution microscopic imaging technology in living brain imaging is not common, and it still faces many challenges. To make the best use of the super-resolution imaging technology, appropriate imaging technology, fluorescent probe, and experimental object should be selected based on the experiment requirements, and the imaging depth, imaging speed, and imaging time should be stable. The super-resolution microscopic imaging technology has great potential and its application and development will enhance the research of brain imaging in living animals.
Oct. 01, 2022Vol. 49 Issue 20 2007301 (2022)
Cong Chen, Miao Liu, Jigang Wang, and Shourui Yang
ObjectiveNeuronavigation has been extensively used in neurosurgery, such as tumor resection, tumor biopsy, and minimally invasive craniotomy. By neuronavigation, doctors can select the best surgical path before surgery, and precisely locate intracranial lesions or sites of interest during surgery, which helps reduce the invasiveness of surgery, enhances the treatment effect, and reduces the recovery time of patients. Realizing the registration of medical structure images between the actual surgical spaces is the major step in neuronavigation. An approach based on artificial markers is the most common approach for registration in clinical, which requires numerous markers fixed on the patient’s head and additional medical imaging scans. Alternatively, approaches based on anatomical landmarks and surface matching have been extensively investigated, and both do not require fixed markers. Compared to the method based on anatomical landmarks, the approach based on surface matching has higher precision. Surface-matching approach completes the registration by aligning the face point cloud in image space and patient space. However, because of space-time differences, deformation differences between the two types of face point clouds may exist, resulting in the deterioration of registration precision. Aiming at this problem, this study proposes a registration approach using an adaptive threshold to reduce the effect of local deformation on registration precision.MethodsFirst, the face point cloud in image space is isolated from the reconstructed head medical model, and the face point cloud in patient space is scanned using fringe projection and binocular stereo vision by the point cloud system. Next, using a voxel-based approach, these two face point clouds are down-sampled and denoised. For the face point cloud in the image space and patient space after down-sampling, we employed the SAC-IA algorithm for coarse registration to produce a suitable initial position. We calculated the Euclidean distance between each point in the source point cloud and its nearest point in the target point cloud, and then considered the average of these Euclidean distances as a threshold. Finally, we used the ICP algorithm to conduct fine registration for the final and more precise transformation, while the wrong pairs, which have a distance higher than the threshold in the previous step are rejected and do not participate in the computation of transformation matrix.Results and DiscussionsWe conducted an experiment to demonstrate the target registration error (TRE) of our registration approach using a self-made head model. This head model included simulated targets in the brain and may be locally deformed in the area of both cheeks. We also compared our approach with a general approach, which only differs from our approach in that no distance threshold was employed. In this experiment, four various degrees of deformation were set in the cheek area of the head model (no deformation, small deformation on both sides, substantial deformation on both sides, and small deformation on one side). The registration process between face point clouds in image space and patient space is repeated 1000 times while the corresponding TRE is computed. First, we counted the times each point in the source point cloud was rejected in our approach (Fig. 11). When no deformation occurred, the time of each point did not visibly gather. Moreover, when deformation occurred, the time of each point gathered in the cheek area. Next, the TRE and mean TRE of each target was computed in our approach (Table. 2) and in the general approach, respectively (Table. 3), and subsequently, we compared the mean TRE of the two approaches (Fig. 14). When no deformation occurred, the mean TRE of our approach was 0.55 mm±0.05 mm, which is not substantially different from the 0.55 mm±0.04 mm of the general approach. Corresponding to small deformation and big deformation of both sides and small deformation of one side, the mean TRE of our approach was 0.34 mm±0.10 mm, 0.28 mm±0.06 mm, and 0.56 mm±0.15 mm, respectively, which was substantially 1.81 mm±0.05 mm, 2.59 mm±0.04 mm, and 1.01 mm±0.12 mm of the general approach.ConclusionsIn this research, we propose a fully automatic surface-matching registration approach based on an adaptive distance threshold for noncooperative target neuronavigation. In the counting of times, each point in the source point cloud is rejected, and the finding reveals that the step to reject wrong point pairs in our approach is sufficiently accurate. In the comparison with mean TRE between our approach and the general approach, our approach is similar to the general approach when no deformation occurs, and is more accurate than the general approach when deformation occurs. Moreover, all standard deviation of our approach are not above 0.15 mm, which means that our approach is stable. In conclusion, our approach can reduce the effect of local deformation of the face, so that the spatial registration approach based on surface matching can be better and stably applied to neuronavigation.
Jan. 01, 1900Vol. 49 Issue 20 2007302 (2022)
Ziyan Song, Jun Huang, Yingzhe Li, Qitong Li, Shengnan Xia, Kehong Wang, and Yunfeng Rui
ObjectiveLaser welding of biological tissues is a noncontact suture technology. Compared to the traditional contact needle and thread suture, it has several advantages, such as simpler operation, faster speed, quicker postoperative recovery, and comparatively insignificant scars. Initial success has already been achieved in the welding of the skin, blood vessels, and lung tissue. As an ultrafast pulsed laser, the femtosecond laser has an extremely high peak power and an exceptionally short action time, that helps to avoid the linear absorption, transfer, and diffusion of energy to a large extent. Thus, it has been widely used in the medical field. However, there are only a few reports on the technology of using femtosecond laser for welding biological tissues. The mechanism of interaction between the femtosecond laser and tissue is not yet clear, and the influence of laser process parameters on the incision fusion effect of isolated skin tissue needs to be further studied. Therefore, in this study, we analyze the effects of laser power, defocus amount, and other process parameters on the fusion morphology of in vitro skin tissue, its incision tensile strength, and thermal damage by a mono-factorial experimental method. All the process parameters of the femtosecond laser are also optimized. We believe that our experiment and results will be helpful in determining the effect of femtosecond laser parameters on the fusion effect of biological tissue and promote further research on the laser welding of biological tissue.MethodsThis study adopts the mono-factorial experiment method considering that there are many factors affecting tissue fusion, while retaining the other process parameters. The four factors of the femtosecond laser power, defocus amount, scanning speed, and number of scannings are varied and each factor is set to 3-4 levels. Femtosecond laser-welding experiments are performed on in vitro pigskin. Subsequently, using a tensile force meter, a tensile strength test is conducted to obtain the tensile strength of the incision. During the welding process, the temperature of the isolated skin tissue is detected in real time using an infrared thermal imager and the temperature-change curve of the isolated skin tissue is then obtained. The temperature curve is fitted and the data is substituted into the Arrhenius equation to calculate the tissue thermal damage parameters. Then, the changes in the appearance, tensile strength, and thermal damage of the welded tissue with laser power, defocus amount, scanning speed, and number of scannings are obtained. The process parameters are optimized based on the tissue appearance, tensile strength, and thermal damage after welding.Results and DiscussionsThe laser power and scanning speed have a greater impact on the appearance of the in vitro skin tissue (Figs. 2 and 4), whereas the defocus amount has a minimal effect (Fig. 3). The tensile strength of the in vitro skin tissue after welding rapidly increases with an increase in laser power, but only gradually increases when the laser power exceeds a certain value. Further, it gradually decreases with an increase in scanning speed. When the number of scannings is increased, the tensile strength initially increases and subsequently decreases. In contrast, the defocus amount has no apparent effect on the tensile strength of the welded structure (Fig. 6). The thermal damage rapidly increases with the increase in laser power, whereas it increases more gradually with scanning time. With an increase in scanning speed, it initially decreases and then observably increases. Thermal damage to the isolated skin tissue after welding is also less affected (Fig. 7). The experimental results indicate that the femtosecond laser process parameters are successfully optimized; there is satisfactory tissue fusion after welding, and the surface is smooth (Fig. 8). The tensile strength of the in vitro skin tissue is 16.25 N/cm-2. The thermal damage parameter of tissue obtained by calculation is 0.00538, which is smaller than that of the thermal damage generated by continuous laser at the same tensile strength.ConclusionsIn this study, the influence of laser power, defocus amount, scanning speed, and number of scannings on the appearance and performance of in vitro skin tissue after welding is studied through mono-factorial experiments. The results show that by using femtosecond laser to weld in vitro skin tissue, the tissue can achieve improved fusion. The results show that laser power and scanning speed are two important factors that determine the appearance and tensile strength of in vitro skin tissue after welding, and the laser power has a decisive effect on the thermal damage of tissue. In cases where the tissue does not exhibit irreversible thermal damage and maintains a certain tensile strength, the thermal damage to the tissue is approximately 10-3 orders of magnitude. The tensile strength of the isolated skin tissue incision after welding is enhanced by decreasing the power and scanning speed of the laser and increasing the number of scannings. Based on this, we optimize the femtosecond laser process parameters. The post-weld incision has higher connection strength, and the thermal damage is less than that generated by continuous laser exposure under the same tensile strength, indicating that the use of a femtosecond laser for in vitro skin tissue welding can reduce tissue thermal damage to a greater extent and maintain tissue activity.
Jan. 01, 1900Vol. 49 Issue 20 2007001 (2022)
Penghui Zhao, Yibo Zhao, Dong Li, Bin Chen, and Liang Yao
ObjectiveFundus disease has been listed as one of the top three blinding eye diseases by the World Health Organization, accounting for 54.7% of all blinding eye diseases, and is the leading cause of blindness in the elderly. Traditional surgical methods are difficult to implement because the fundus is located behind the eyeball. Laser hyperthermia is the first choice for many retinal diseases. However, the probability of photoreceptor cell damage due to improper selection of laser parameters can be over 50%. Constructing an accurate three-dimensional heat transfer model of the entire eye will allow clinicians to select laser parameters. Therefore, a macroscopic heat transfer model of the entire eye was established on the basis of the real structure, and the effects of the external environment of the eye, anterior tissue absorption, and choroidal hemoperfusion on the fundus temperature distribution during laser surgery were analyzed using numerical simulation.MethodsA whole eye numerical model based on the Pennes' biological heat transfer equation was developed to calculate the thermal response process in the eyeball under steady state and laser heating in this paper. First, the fundamental properties of each region were strictly defined, including the external environment of the cornea, the initial temperature of the eyeball, and the setting of boundary conditions. The steady-state temperature distribution of the entire eye was solved by utilizing Pennes' biological heat transfer equation. The steady-state calculation results were then employed as the initial conditions to further solve the transient eye temperature distribution by changing the wavelength, pulse width, and energy density of the laser.Results and DiscussionsIn this study, the whole eye heat transfer model was established on the basis of real structure, the heat transfer process of fundus laser surgery was calculated, and the effects of ambient temperature, the light absorption of the anterior tissue of the eyeball, and choroid hemoperfusion on the temperature distribution in the eyeball were studied. The simulation findings showed that: 1) the heat transfer between the cornea and the external environment can change the temperature of the eyeball. The temperature distribution of the anterior eyeball is more sensitive to environmental factors, whereas the fundus tissue is less affected; thus, fundus laser surgery will not be affected (Fig. 5). 2) If the absorption and scattering of laser energy by the four layers of anterior eyeball tissue are not considered, the maximum errors of fundus temperature rise were 24% and 56%, respectively, in the common clinical wavelength of 450-900 nm, which significantly affects the accuracy of numerical calculation (Fig. 6). 3) The effect of choroid perfusion term in ocular temperature distribution in laser surgery mainly depends on pulse width. Because of the short laser action time, the peak temperatures of the eyeball were 48.58 ℃ and 48.63 ℃ when the choroidal blood perfusion effect was considered or ignored, respectively, with little difference. However, when the effect of choroid perfusion was considered or ignored, the peak values of eyeball temperatures were 48.54 ℃ and 58.15 ℃ (Fig. 7 and Fig. 8), respectively, and the temperature rise was 11.54 ℃ and 21.15 ℃, respectively, with an error of 83%.ConclusionsThrough theoretical research, the heat transfer process of fundus surgery under laser irradiation was analyzed from the macroscopic viewpoint in this report. The results indicated that the heat transfer between the cornea and the external environment could change intraocular temperature. The temperature distribution in the anterior part of the eyeball was more sensitive to the environmental factors, whereas the fundus tissue was less affected; thus, the fundus laser surgery would not be affected. The absorption and scattering of laser energy by the anterior tissue of the eyeball should be considered in the simulation to ensure the accuracy of the simulation of laser fundus surgery. The effect of choroidal blood perfusion on ocular temperature distribution in laser surgery was primarily determined using the laser pulse width. When the pulse width time was short (tp=0.1 s), hemoperfusion had no obvious cooling effect on fundus tissues, and the influence of perfusion factors could be ignored. Flow perfusion had a significant cooling effect on fundus tissues and significantly affected fundus temperature when the pulse width was long (tp=60 s). Therefore, the influence of perfusion factors must be considered. The results of this study provide important theoretical guidance for the clinical laser treatment of fundus diseases.
Jan. 01, 1900Vol. 49 Issue 20 2007101 (2022)
Ruijie Yang, Peng Liu, Xiaoxu Rao, Bingxuan Wu, Buyun Guo, Fan Zhang, Pengfei Shao, Chuanjun Chen, and Xiaorong Xu
ObjectiveDespite remarkable advances in surgical techniques over the last few decades, regional imbalances have grown dramatically, particularly in developing countries and remote rural areas. The implementation of surgical telementoring is critical and imperative to meet the increasing demand for surgery in these areas and to provide safe, timely, and affordable surgical opportunities for the region’s residents. According to the different display methods, the current remote surgical navigation instruments can be generally divided into monitor display and augmented reality display. Although the former has the advantages of convenience and low cost, it requires the surgeon to constantly switch the focus of vision between the surgical area and the monitor, which is distracting and time-consuming and may also result in surgical errors due to position matching errors. Although the latter can reduce surgical technical errors and shifts in visual focus, the weight, field of view, ergonomic design, and battery life must still be improved. Furthermore, the target surgical area is prone to large soft tissue deformation in most surgeries, and accurate integration of the virtual scene with the surgical display scene requires real-time 3D reconstruction of the complex surgical environment, which significantly reduces the reliability of augmented reality guidance. To overcome the limitations of current surgical telementoring devices in terms of display intuitiveness, interactive efficiency, and resistance of guidance marks to tissue deformation and displacement, we developed a coaxial vision photochromic marking system and a biocompatible photochromic film to retain remote surgical guidance marks directly on the patient’s skin.MethodsIn this study, we used solvent volatilization to create a photochromic film from spiropyran, a biocompatible photochromic material, and poly(lactic-co-glycolic acid), an FDA-approved film-forming material. When the film was exposed to ultraviolet (UV) light at 200-400 nm, the spiropyran molecule isomerized and transformd into the highly colored merocyanine. Taking advantage of this photochromic property, we proposed a technique for visualizing surgical guidance, that is, producing photochromic marks by precisely controlling the UV laser to scan the mark on the film. So, we created a surgical telementoring system (the CV-PM system) based on coaxial visual photochromic marking, which includes a 360 nm continuous UV laser, a color complementary metal-oxide semiconductor camera, and a two-dimensional laser galvanometer, and a beam splitter. We designed the coaxial optical path to match the camera field of view with the scanning area of the laser galvanometer. The remote specialist could view the surgical scene captured by the local CV-PM system, draw surgical guide marks, and drive the CV-PM system to complete the photochromic mark scan. The local trainee could perform the surgery while directly observing the guidance marks. We designed experiments to test the film’s extreme discoloration performance, determined the system’s laser parameters, and verified the fading performance of the photochromic marks. We devised a skin phantom experiment to quantify and compare the benefits of using this system to draw surgical guide marks versus viewing a display. Finally, we designed a nevus excision surgery on ex-vivo pig skin to validate the CV-PM system’s feasibility.Results and DiscussionsThe performance experiment shows that the CV-PM system can scan 160 mm long marks in 7 s if the maximum permissible exposure requirements are met. Furthermore, within 20 min, all lengths of marks can retain the visible color difference that can be seen with the naked eye (Fig. 5). The skin phantom experiment demonstrates that using the CV-PM system has obvious advantages over viewing a display to draw surgical guide marks in terms of marking accuracy [intersection over union (IoU)], operation time, and the number of sight switches. Additionally, the mean value of IoU between the marks scanned by the CV-PM system and the expert drawn marks in this experiment is up to 0.93±0.02, and the mean value of operating time is 5.4 s±0.9 s (Fig. 6). The surgery of nevus excision on porcine skin ex-vivo tissue provides strong support for the system’s application to surgical telementoring (Fig. 7).ConclusionsThis surgical telementoring visualization technology provides an efficient, accurate, safe, and intuitive telemedicine display solution, addressing many of the shortcomings of current screen-displayed telementoring devices, such as poor intuitiveness, limited interaction, low efficiency, and poor timeliness of guidance information due to tissue deformation and displacement. The design of the CV-PM system and the preparation of the photochromic film have fully considered the biosafety requirements, which makes this technology have the prospect of being widely used in clinical applications. Furthermore, the system is appropriate for emergency rescue and surgical teaching seminars, and it is extremely important in promoting the development of telemedicine, realizing the sharing of high-quality medical resources, and resolving the problem of unbalanced medical resources.
Jan. 01, 1900Vol. 49 Issue 20 2007102 (2022)
Biao Dong, Lihua Guo, Dayong Liu, Yuda Wang, Wei Liu, Rui Yang, Haitao He, and Jiao Sun
SignificanceCancer, characterized by abnormal cell proliferation, is one of the most important chronic and complex diseases. Not only is it a serious threat to people’s health and life, but also it has been a leading cause of death in every country in the world for a long time. It has caused huge loss to society, including the negative influence on the emotions and economies of patients and their families, the burden on medical resources and treatment investments, and the loss of human resources. The cancer survival rate is usually low, which may be related to a lack of timely and effective detection, which leads to late diagnosis and missed opportunities for targeted and standardized treatment. Early detection and effective diagnosis of cancer can significantly reduce the death rates of patients through early and effective prevention and treatment.Tumor markers are defined as substances that are synthesized and released by tumor cells themselves or that are produced by the body in response to the development and proliferation of tumors, and which can be identified in blood, urine, saliva, tissue, and other body fluids. Detection of tumor markers is an important indicator for cancer diagnosis, treatment, and efficient monitoring. It complements other clinical examination methods, such as imaging, endoscopic, and pathological examinations. The early detection of tumor markers has the advantages of being minimally or noninvasive, rapid, and convenient, and it has great application potential in cancer screening, diagnosis, treatment, prognosis, and other aspects.In the past few decades, advances in the early detection of cancer have led cancer research to a minted stage. Based on the specific recognition of intracellular and extracellular biomarkers, several promising detection methods have been developed, including the polymerase chain reaction, enzyme-linked immunosorbent assay, electrophoresis, surface plasmon resonance, surface-enhanced Raman spectroscopy, electrochemical sensing, mass spectrometry, flow cytometry, and other technologies. However, some of these methods are limited by being expensive, time-consuming, and complicated operate. In most cases, the relatively low sensitivity and accuracy of these methods are not adequate to meet new clinical requirements, and they cannot be used in an environment with few resources and extensive point-of-care detection. It is, therefore, urgent to develop a new detection technology with the characteristics of high efficiency, sensitivity, accuracy, stability, and economic friendliness.Fluorescence methods have attracted the attention of researchers in recent years because of their advantages of high sensitivity, low cost of instrumentation, and ease of operation, and tremendous advances have been made. The fluorescence method has been widely used for ultrasensitive and rapid detections of tumor markers, and the exploration of this method for the accurate detection of new markers is still being implemented in the laboratory. In addition, it is being used both to improve old methods and to create new methods for detecting tumor markers. Consequently, it is both important and necessary to summarize existing research in order to predict and guide the future development of the fluorescence method for tumor marker detection.ProgressThis paper first introduces tumor biomarkers and methods for detecting them and then compares the principles and characteristics of different detection methods (Table 1). Next, novel fluorescent-probe materials—such as carbon dots, upconversion nanoparticles, and polymer dots—are briefly introduced and their applications in the detection of biomarkers are summarized (Table 2). Various methods of capturing and detecting circulating tumor cells (CTCs) are then introduced. Based on traditional methods for enhancing the capture efficiency and detection sensitivity for CTCs, the effective introduction of near-infrared light (Fig. 3) and the one-step method for detecting CTCs has gradually become a new research focus (Fig. 4). Improvements in the traditional polymerase chain reaction for detecting circulating tumor DNA (ctDNA) and the development of fluorescence biosensor technology are next introduced (Fig. 5). Biosensors and emerging diagnostic technologies based on various fluorescent materials have greatly facilitated the development of ctDNA detection. Several methods for the comprehensive detection of exosomes are subsequently introduced (Fig. 6); they mainly include the combined application of microfluidics, nanotechnology, and fluorescent nanomaterials. Finally, the detection of carcinoembryonic antigen, alpha-fetoprotein, prostate-specific antigen, and simultaneous multiple detections of several biomarkers (Fig. 10) are briefly introduced. In addition to the basic requirements of high sensitivity and high specificity, fast, affordable, and portable detection platforms—such as biochips, immunochromatographic test strips, and point-of-care detection devices—are emerging.Conclusions and ProspectsIn summary, the fluorescence method has a wide range of applications to many diseases, including tumor detection. Although great advancements have already been made, many challenges remain in tumor-marker detection. Detection technology based on the fluorescence method still needs to be explored and improved constantly to provide high detection sensitivity and accuracy, so that it can meet application demands more widely and more simply and adapt to the constantly updated understanding of disease mechanisms and test requirements.
Jan. 01, 1900Vol. 49 Issue 20 2007103 (2022)
Jie Zheng, Dongyuan Liu, Qi Zhang, Limin Zhang, and Feng Gao
ObjectiveEarly-stage detection and treatment of mucosal tissue lesions are effective means for curbing mucosal cancer. Histopathological examination is the gold standard for the clinical examination of mucosal tissue lesions. However, this method is invasive and easily affected by doctors' experience and is unsuitable for large-scale and rapid screening of precancerous lesions. Spectral technologies can detect the changes in optical properties caused by the morphological changes of mucosal tissue cells in a real-time, in vivo, and noninvasive way, and can objectively analyze them using reasonable algorithms, which provides low-cost and large-scale screening of mucosal tissue lesions. In this study, we develop a mucosal lesion diagnosis system using joint sub-diffusive domain diffuse reflectance and fluorescence spectroscopy to improve sensitivity and specificity. The system can efficiently collect diffuse reflectance and autofluorescence spectra of mucosal tissues at varying depths. Furthermore, it extracts the characteristics of spectral data to realize the rapid screening of mucosal lesions and the real-time diagnosis of malignant tumor grade.MethodsIn this study, the mucosal lesion diagnostic system is composed of a light source module, detection module, main control module, man-machine interface module, and an optical fiber probe to measure the joint spectrum signal and real-time analysis and display tissue lesion information. First, we evaluate the stability of the light source module of the system using phantom experiments. Next, the in vitro experiments are conducted to verify the ability of the system to distinguish different tissues, including chicken and pork tissues. In the spectral pretreatment, the spectral data are preprocessed by smoothing and normalization to eliminate the system and environmental noise. Furthermore, the first derivative, principal component analysis, kurtosis, skewness, mean, and variance are used as input information for subsequent tissue classification to extract spectral features and realize the feature extraction. Next, we employ the support vector machine to distinguish the spectral characteristics of different tissues due to its advantages in dealing with small sample pattern recognition. To further verify the effectiveness and recognition ability of the proposed system, we conduct in vivo experiments on the human oral mucosa. The diffuse reflectance and autofluorescence spectra of the lower lip and tongue mucosal tissues are collected for tissue spectrum comparison.Results and DiscussionsThe results of the phantom experiments show that the proportion of the intensity standard deviation of the two LEDs in the overall intensity is below 1%, implying that the system has excellent measurement stability (Fig. 7). The in vitro tissue experiments show that the system has excellent classification ability (the classification accuracy of different tissues is above 98%; the classification accuracy of different parts in a specific tissue is above 74%) (Tables 1 and 2). The in vivo experiments preliminarily verify the application potential of the system in mucosal tissue diagnosis and classification (Fig. 10).ConclusionsIn this study, we develop a mucosal lesion diagnosis system using joint sub-diffusive domain diffuse reflectance and fluorescence spectroscopy, which is noninvasive, operates in real-time, and is cost effective. First, the phantom with stable diffuse reflectance verifies that the system meets the required steady-state measurement. Next, the classification results of different tissues by the diffuse reflectance and autofluorescence spectra verify that our proposed system can realize the classification of different in vitro tissues. Finally, the in vivo experiments on human oral mucosa preliminarily verify that the system has the ability of in vivo detection. In the future, the detection of diseased mucosal tissue will be performed to further explore the clinical potential of the developed system. These findings support the utility of the system. In conclusion, the system provides strong systematic support and is an important method of reference for low-cost, large-scale screening of precancerous lesions of mucosal tissue.
Jan. 01, 1900Vol. 49 Issue 20 2007104 (2022)
Meijie Qi, Lixin Liu, Yanru Li, Yujie Liu, Zhoufeng Zhang, and Junle Qu
ObjectiveHyperspectral microscopic imaging (HMI) technology combines optical microscopy and hyperspectral imaging to obtain both image and spectral information, thereby revealing spatial distribution and physical and chemical properties of a sample simultaneously. HMI, a novel nondestructive optical imaging technology, can be used to diagnose normal/cancerous tissues with high accuracy, sensitivity, and specificity. However, HMIs have a large amount of data and a complex data structure; thus, systematic and detailed data interpretation is required in cancer diagnosis. In this study, a push-broom HMI system is designed and developed, and the graphical user interface (GUI)-based software for system control, data acquisition, and data analysis is programmed to aid doctors in pathological diagnosis. The classification and staging of skin cancers (basal cell carcinoma, squamous cell carcinoma, and malignant melanoma) are studied on the basis of HMI technology and machine learning algorithms to confirm the performance of the system software. We hope that our HMI system, GUI-based software, and experimental results will be useful in cancer diagnosis and have application potential in biomedicine.MethodsFirst, a push-broom HMI system consists of a halogen lamp, objective lens, sample stage, single-axis motorized translation stage, two-axis manual translation stage, hyperspectral line-scan camera, and other optical devices (Fig. 1). The halogen lamp illuminates the sample on the sample stage. The transmitted light is collected by the objective lens and directed to the hyperspectral camera after passing through the mirror and lens group in sequence to obtain one-dimensional (1D) spatial and spectral information. The motorized translation stage controls the sample stage to move in the x-direction with a step size of 1 μm for HMI data cube acquisition. The spectral resolution of the hyperspectral camera is calibrated and calculated based on the sensor configuration (Fig. 2). HMI system performance parameters, such as spatial resolution, field of view, and magnification, are obtained by imaging a resolution target. Second, the software with graphical user interfaces for system control, data acquisition, and data analysis is programmed using MATLAB. Several machine learning-based data processing methods are provided. Finally, the HMI data cubes of basal cell carcinoma, squamous cell carcinoma, and malignant melanoma tissues are obtained using the HMI system and data acquisition software; subsequently, the classification and staging of skin cancer are studied using data analysis software.Results and DiscussionsThe push-broom HMI system has a spectral range of 465.5-905.1 nm, with a spectral resolution of ~3 nm, field of view of 400.18 μm×192.47 μm, system magnification of 28.15, and actual spatial resolution of 1.10-1.38 μm (Fig.3); it can collect a data cube of 2048 pixel×985 pixel×151. Additionally, GUI-based HMI data acquisition software and analysis software are designed and programmed using MATLAB. The data acquisition software includes the following three modules (Fig. 4): HMI system control and data acquisition module for controlling the hyperspectral camera and motorized translation stage, HMI data acquisition, light source background correction, and frequency domain filtering; HMI data display and processing module for displaying or cropping the HMI data cube and single-band image and calculating the correlation between each band; and save and exit module for saving the data processing results and exiting the acquisition software. The data analysis software consists of the following two modules (Fig. 5): a data extraction and viewing module that can realize HMI image display, spectrum viewing in the region of interest, converting 3D HMI data into 2D spectral data, and synthesizing RGB images with any three single-band images; and an HMI data processing module that can analyze image and spectral data and realize sample classification based on machine learning. HMI data from basal cell carcinoma, squamous cell carcinoma, and malignant melanoma are obtained to evaluate the performance of the system, and the machine learning is used to achieve the classification of three types of skin cancers and staging of squamous cell carcinoma. Spectral distribution, as well as 3D HMI, single-band, and RGB images, can be displayed (Fig. 6). The classification of three types of skin cancers based on image data is achieved using the data analysis software, and the highest classification accuracy of 85% and KAPPA value of 0.77 are obtained using color moment, gray-level co-occurrence matrix and local binary pattern as image features, partial least squares for dimensionality reduction, hold-out method for dividing the dataset, and a support vector machine models for classification. The optimal model for spectral data staging of squamous cell carcinoma corresponding to the standard normal variable transformation for spectral preprocessing, partial least squares for dimensionality reduction, hold-out method for dividing the dataset, and random forest for staging. The highest staging accuracy of 96.4% and a KAPPA value of 0.95 are obtained (Table 1).ConclusionsIn this study, a push-broom HMI system that can simultaneously obtain image and spectral information is developed to reveal spatial distribution and physicochemical properties of the samples. The HMI system can provide a data cube of 2048 pixel×985 pixel×151, a spectral resolution of ~3 nm, and actual spatial resolution of 1.10-1.38 μm. The HMI data acquisition software and analysis software are programmed using MATLAB. The graphical user interface of the software can standardize experiment procedures, allows intuitive data collection and processing, and provides analysis results, all of which can assist doctors in pathological diagnosis. Using this HMI system to image skin cancer tissues, high spectral and spatial resolution images are obtained, and the classification of different skin cancers and staging of squamous cell carcinomas can be achieved with high accuracy using machine learning algorithms. Our study shows that the combination of HMI technology and machine learning has significant application potential in the field of biomedicine.
Jan. 01, 1900Vol. 49 Issue 20 2007105 (2022)
Wenjing Chen, Zhaohang Jiao, Dongli Qi, Longhai Shen, Nuo Xu, Dongfei Xie, Yifei Li, Jiahua You, Qi Li, and Yu Feng
ObjectiveBreast cancer, the most common malignant disease with high mortality and morbidity, is the leading cause of death in women worldwide, especially in developing countries. The current methods for breast cancer diagnosis are time-consuming, expensive, and have low sensitivity, and these should be urgently addressed. Spectroscopy appears to offer a new method for clinical detection of normal and cancerous tissues. Fluorescence spectroscopy is a tool for the noninvasive acquisition of biochemical information and extracellular matrix, and its use is rapidly expanding owing to its safety and efficiency.MethodsBreast tissue autofluorescence spectroscopy mostly uses a light source in the 420-512 nm band, and the tryptophan and tyrosine residues in the tissue are more sensitive to a laser with a wavelength of 405 nm. Therefore, this study used a 405 nm laser source to obtain autofluorescence spectra of breast tissue sections to avoid the interference of fat and blood on the spectrum during in vivo detection and to improve the spectrum intensity. Various biological macromolecules or molecular groups in human tissues emit fluorescence, and the fluorescence spectrum is a superimposed spectrum of various luminescent substances. Because of the short distance between the fluorescence wavelengths emitted by some fluorescent substances, a peak overlapping phenomenon occurs, and the spectral characteristic peaks are not easy to distinguish. On directly using the fluorescence spectral peak area for quantitative analysis, the quantification is neither objective nor accurate. Therefore, this study proposes a Gaussian function to fit the fluorescence spectrum of breast tissue slices. Because the Gaussian function describes the normal distribution, it effectively separates the overlapping peaks, simplifies the spectrum, and extracts information using the characteristic parameter peaks of the fitted spectrum. The area ratio method was used to analyze the differences in the spectra of the normal and cancerous breast tissues. Finally, after studying several samples, this paper proposes the use of an SVM algorithm to classify the fluorescence spectrum and analyzes the feasibility of this algorithm for the classification of the breast tissue fluorescence spectrum.Results and DiscussionsAfter the breast tissue becomes cancerous, the content of some fluorescent substances also changes. The normalized mean fluorescence spectra of normal and cancerous breast tissues show obvious red shifts in the fluorescence peaks of cancerous tissues relative to normal tissues (Fig. 4). The difference in fluorescent substances in normal and cancerous breast tissues was analyzed using area ratio method. The peak area ratios (A517/A492,A635/A492) of cancerous tissues are 2.4-8.5 times that of normal tissues, which can be considered as criteria for the diagnosis of breast cancer (Table 3). The discrimination results of the SVM algorithm are as follows: accuracy rate of 87.50%, recall rate of 93.94%, precision of 88.57%, and F1-score of 91.18%. This proves that the method has high sensitivity and recognition ability for the fluorescence spectral information of breast cancer tissue, and can map normal and cancerous tissue fluorescence spectral signatures in different states for classification.ConclusionsIn this study, the fluorescence spectrum of breast tissues under a 405 nm laser was collected. After fitting the fluorescence spectrum with a Gaussian function, the fluorescence spectrum peak area ratios for normal and cancerous tissues were calculated, and the effect of the SVM algorithm on the fluorescence spectrum was analyzed. The autofluorescence spectrum of cancerous breast tissues has a red-shift phenomenon compared with that of normal tissues; after separating the overlapping peaks by Gaussian function fitting fluorescence spectrum, the peak areas at 517 nm, 635 nm, and 492 nm of cancerous tissues have a significant ability to distinguish between normal and cancerous tissues. The SVM algorithm is feasible for the classification of breast tissue fluorescence spectrum, with an accuracy of 87.50%. This proves that the method can recall and pinpoint cancerous breast tissues, and has a strong balance between recall rate and precision, thus, providing a rapid diagnosis of breast cancer. In summary, the Gaussian function fitting the fluorescence spectrum can obtain the spectral characteristic information of the fluorophore in breast cancer and the peak area ratio can be used as the standard for diagnosing breast cancer. Moreover, the combination of the fluorescence spectrum and the SVM classification algorithm model can be used for multi-sample breast cancer, providing a feasible method for rapid diagnosis.
Oct. 01, 2022Vol. 49 Issue 20 2007106 (2022)
Ziyan Song, Jun Huang, Yingzhe Li, Qitong Li, Shengnan Xia, Kehong Wang, and Yunfeng Rui
ObjectiveLaser welding of biological tissues is a noncontact suture technology. Compared to the traditional contact needle and thread suture, it has several advantages, such as simpler operation, faster speed, quicker postoperative recovery, and comparatively insignificant scars. Initial success has already been achieved in the welding of the skin, blood vessels, and lung tissue. As an ultrafast pulsed laser, the femtosecond laser has an extremely high peak power and an exceptionally short action time, that helps to avoid the linear absorption, transfer, and diffusion of energy to a large extent. Thus, it has been widely used in the medical field. However, there are only a few reports on the technology of using femtosecond laser for welding biological tissues. The mechanism of interaction between the femtosecond laser and tissue is not yet clear, and the influence of laser process parameters on the incision fusion effect of isolated skin tissue needs to be further studied. Therefore, in this study, we analyze the effects of laser power, defocus amount, and other process parameters on the fusion morphology of in vitro skin tissue, its incision tensile strength, and thermal damage by a mono-factorial experimental method. All the process parameters of the femtosecond laser are also optimized. We believe that our experiment and results will be helpful in determining the effect of femtosecond laser parameters on the fusion effect of biological tissue and promote further research on the laser welding of biological tissue.MethodsThis study adopts the mono-factorial experiment method considering that there are many factors affecting tissue fusion, while retaining the other process parameters. The four factors of the femtosecond laser power, defocus amount, scanning speed, and number of scannings are varied and each factor is set to 3-4 levels. Femtosecond laser-welding experiments are performed on in vitro pigskin. Subsequently, using a tensile force meter, a tensile strength test is conducted to obtain the tensile strength of the incision. During the welding process, the temperature of the isolated skin tissue is detected in real time using an infrared thermal imager and the temperature-change curve of the isolated skin tissue is then obtained. The temperature curve is fitted and the data is substituted into the Arrhenius equation to calculate the tissue thermal damage parameters. Then, the changes in the appearance, tensile strength, and thermal damage of the welded tissue with laser power, defocus amount, scanning speed, and number of scannings are obtained. The process parameters are optimized based on the tissue appearance, tensile strength, and thermal damage after welding.Results and DiscussionsThe laser power and scanning speed have a greater impact on the appearance of the in vitro skin tissue (Figs. 2 and 4), whereas the defocus amount has a minimal effect (Fig. 3). The tensile strength of the in vitro skin tissue after welding rapidly increases with an increase in laser power, but only gradually increases when the laser power exceeds a certain value. Further, it gradually decreases with an increase in scanning speed. When the number of scannings is increased, the tensile strength initially increases and subsequently decreases. In contrast, the defocus amount has no apparent effect on the tensile strength of the welded structure (Fig. 6). The thermal damage rapidly increases with the increase in laser power, whereas it increases more gradually with scanning time. With an increase in scanning speed, it initially decreases and then observably increases. Thermal damage to the isolated skin tissue after welding is also less affected (Fig. 7). The experimental results indicate that the femtosecond laser process parameters are successfully optimized; there is satisfactory tissue fusion after welding, and the surface is smooth (Fig. 8). The tensile strength of the in vitro skin tissue is 16.25 N/cm-2. The thermal damage parameter of tissue obtained by calculation is 0.00538, which is smaller than that of the thermal damage generated by continuous laser at the same tensile strength.ConclusionsIn this study, the influence of laser power, defocus amount, scanning speed, and number of scannings on the appearance and performance of in vitro skin tissue after welding is studied through mono-factorial experiments. The results show that by using femtosecond laser to weld in vitro skin tissue, the tissue can achieve improved fusion. The results show that laser power and scanning speed are two important factors that determine the appearance and tensile strength of in vitro skin tissue after welding, and the laser power has a decisive effect on the thermal damage of tissue. In cases where the tissue does not exhibit irreversible thermal damage and maintains a certain tensile strength, the thermal damage to the tissue is approximately 10-3 orders of magnitude. The tensile strength of the isolated skin tissue incision after welding is enhanced by decreasing the power and scanning speed of the laser and increasing the number of scannings. Based on this, we optimize the femtosecond laser process parameters. The post-weld incision has higher connection strength, and the thermal damage is less than that generated by continuous laser exposure under the same tensile strength, indicating that the use of a femtosecond laser for in vitro skin tissue welding can reduce tissue thermal damage to a greater extent and maintain tissue activity.
Jan. 01, 1900Vol. 49 Issue 20 2007107 (2022)
Baolai Yang, Huan Yang, Peng Wang, Liangjin Huang, Xiaoming Xi, Hanwei Zhang, Zilun Chen, Zhiping Yan, Chen Shi, Hu Xiao, Zhiyong Pan, Xiaolin Wang, Zefeng Wang, Pu Zhou, Xiaojun Xu, and Jinbao Chen
Jan. 01, 1900Vol. 49 Issue 20 2016001 (2022)
Zilun Chen, Min Fu, Yu Ning, Jinyong Leng, Yulong He, Zefeng Wang, Xiaolin Wang, Baolai Yang, Fengjie Xi, and Xiaojun Xu
Jan. 01, 1900Vol. 49 Issue 20 2016002 (2022)
Jianzeng Guo, Jie Wang, Shengtian Liu, Chang Liu, Xiongfei Qiu, Zhifeng Niu, Yusu Wang, Donghai Yu, Yan Li, and Jinxue Li
Jan. 01, 1900Vol. 49 Issue 20 2016003 (2022)
Fengyun Li, Jiangyun Dai, Nian Liu, Cong Gao, Changle Shen, Honglei He, Fang Li, Lei Jiang, Lihua Zhang, Jiakun Lu, Yi Chen, Haoyu Zhang, Yu Liu, Qiuhui Chu, Yi Shi, Honghuan Lin, Jianjun Wang, and Feng Jing
Jan. 01, 1900Vol. 49 Issue 20 2016004 (2022)
© Copyright 2018-2021 | Chinese Laser Press.
All Rights Reserved 沪ICP备15018463号-20