


Please enter the answer below before you can view the full text.

Liping Lai, and Qiren Zhuang
ObjectiveCurrently, the approaches to achieving uniform illumination largely involve adjusting the array arrangement of light-emitting diode (LED) plant light sources, designing the structure of an LED light source board, and adding optical features such as diffusion plate or free-form surface baseplate. These approaches cannot effectively enhance the uniform illumination of LED plant light because the optical efficiency is not high, and it is not conducive to large-area lighting of LED plant lamps. The red and blue LED array light sources widely used in plant manufacturing have been tuned to provide spectral uniformity based on the aforementioned issues. The scale lens is then designed, and the light output by the LED is uniform by employing the scale radian of the scale lens, which improves the optical efficiency and uniformity of the light surface by increasing the light coupling degree. It has some practical utility and serves as a guide for consistent illumination of large-area plants in practical engineering.MethodsFirst, 14 pieces of 1 W Samsung 3535, type LH351H 450 nm L4A4B blue LEDs and 70 pieces of 1.6 W Samsung 3535, type LH351H 660 nm V2 E7W410 red LEDs were used as plant lamp light sources, divided into seven rows with 12 LEDs in each row with a size of 380 mm×220 mm of LED plant lamp; the ratio and way of arrangement of the red and blue LEDs were studied. After comparing the spectra of two distinct LED array arrangement methods, the nine-point method was used to measure the spectrum. Second, a scale lens was designed according to optical and nonimaging optical principles. The scale radian of the scale lens ensures that the light output by the LED is uniform. Then, to find the best scale lens size, the impacts of different bulge heights, scales width, and the spacing between two LEDs center columns on photosynthetic photon flux density (PPFD) uniformity and optical efficiency were analyzed. Finally, the results were verified by experiment.Results and DiscussionsIt is the first time that a scale lens has been applied to an LED plant lamp to improve the illumination spectral uniformity and optical efficiency of the LED plant lamp. The homogeneous arrangement of red and blue LEDs was used to evaluate the LED plant light source. The experimental spectrum with uniform arrangement of red and blue LEDs in the LED plant light is essentially consistent with the theoretical simulation spectrum, and the spectral uniformity is good (Fig. 17). The scale lens was designed according to optical and nonimaging optical principles. By comparing the effects of the width and convex height of the scale lens on the PPFD uniformity and optical efficiency of the plant lamp, the optimized convex height H of the scale lens is 0.1 mm, the optimized scale width D is 0.35 mm, the optimized center column spacing B between two LEDs is 25 mm, the ray-tracing simulation with the TracePro software revealed that the light distribution curve of the whole LED plant lamp exhibits batwing light distribution. The experiment and simulation were well-accorded (Fig. 19). The test results show that the scale lens module has a PPFD uniformity of 93.12% in the illumination area within 500 mm×500 mm (Fig. 20), and optical efficiency of 90%, which is higher than the technical indexes reported in the references, thereby demonstrating the effectiveness of the scale lens.ConclusionsThe software simulation demonstrates that when the photon number ratio of red light to blue light is 8∶1, and 14 pieces of 1 W Samsung 3535, type LH351H 450 nm L4A4B blue LEDs, and 70 pieces of 1.6 W Samsung 3535, type LH351H 660 nm V2 E7W410 red LEDs are divided into seven rows with twelve LEDs in each row with a size of 380 mm×220 mm of LED plant lamp, the spectral uniformity of uniform arrangement of red LED and blue LED is better than that of uniform arrangement of blue LED in two columns. The experimental findings reveal that when the length of the scale lens is 22 mm, the width is 16 mm, the maximum height is 6.68 mm, the diameter of the bottom surface of the inner surface is 6.26 mm, the height is 2.98 mm, the height of the scale protrusion is 0.1 mm, the width of the scale is 0.35 mm, and the distance between the center columns of the two LEDs is 25 mm, the beam angle of the plant lamp is 90°, the receiving surface is 0.5 m away from the light-emitting surface of the plant lamp, and the 500 mm×500 mm plant illumination surface light source with PPFD uniformity of 93.12% and optical efficiency of 90% is obtained in the illumination area.
Jan. 01, 1900Vol. 49 Issue 18 1805001 (2022)
Jiayue Liu, Jianguo Zhang, Chuangye Li, and Yuncai Wang
ObjectiveNational security, economic stability, and people’s privacy are affected via information security. In recent decades, laser chaos synchronization communication has realized rapid development because of its enhanced physical security. It is based on the message being mixed with the transmitting end’s laser chaotic carrier to generate the encrypted signal, and then the encrypted signal being transmitted to the receiving end as its input signal. The receiver employs its chaos pass filtering effect to output the synchronized chaotic carrier signal, and the message is recovered through subtractive demodulation of the encrypted signal and the synchronized chaotic carrier. Thus, synchronization is the key to chaotic synchronization communication, and achieving high-quality synchronization necessitates the completely matched parameters between the sender and receiver, which not only causes a lower synchronization coefficient but increases the difficulty of hardware implementation. This study proposes a reservoir computing-based secure communication approach to laser chaos synchronization. The reservoir computing, as the chaos synchronization communication system’s receiver, is synchronized with the sender’s chaotic carrier and then obtains the message by subtracting the output variable synchronized chaotic carrier from the reservoir computing’s input variable encrypted signal. The proposed approach overcomes the difficulty of a lower synchronization coefficient in traditional chaotic synchronization communication because the parameters of the transmitter and receiver are difficult to match completely.MethodsOne of the machine learning algorithms is cross-prediction, the present study proposes the cross-prediction algorithm based on chaotic synchronization communication. Among them, the encrypted and chaotic carrier signals are employed as the reservoir computing’s input and output variables, respectively. Its non-linear structure with the following functions is obtained using the encrypted signal and part of the target chaotic carrier signal, which is transmitted back to back from the sender to receiver to train the reservoir computing. When the encrypted signal from the sender is continued to be input into the reservoir computing, the corresponding synchronized chaotic carrier can be automatically output. After synchronization, subtractive demodulation between the encrypted signal and synchronized chaotic carrier can be employed to decrypt the message. Compared with the currently widely employed model-free prediction algorithm, cross-prediction removes the effect of carrier synchronization error accumulation and enhances the prediction accuracy, then the long-term prediction and communication can be realized.Results and DiscussionsSimulation exploration comprises three parts. First, the synchronization performance and communication performance of the proposed system are explored, concluding that the system can realize high-quality chaotic synchronization and communication with the synchronization coefficient of 99.90% under the premise of ensuring security (Figs. 5, 8). The simulation results reveal that the carrier prediction mean square error can reach 10-4 orders of magnitude (Fig. 9), and the decryption bit error rate can reach the order of 10-9 (Fig. 6). The influences of the signal-to-noise ratio and the number of reservoir nodes on the system synchronization performance and communication performance are explored. The results reveal that the carrier prediction error and bit error rate decrease with increasing signal-to-noise ratio (Fig. 8). The optimal number of reservoir nodes is 1800 when the signal-to-noise ratio is 20 dB and the masking coefficient is 5.56% (Fig. 7). Second, when the cross-prediction and model-free prediction algorithms are applied to the system, the synchronization performance and communication performance are compared, respectively. The results reveal that the cross-prediction eliminates the carrier prediction error accumulation effect, and its prediction error shall not accumulate with the increase of the prediction length. Thus, the prediction accuracy is greatly improved, and long-term synchronization and communication can be realized (Fig. 9). Finally, the system’s feasibility is verified using the image communication simulation experiment. The results reveal the proposed system has good anti-attack performance and high decryption quality. Additionally, the security and system’s communication quality can be assured at the same time (Fig. 10).ConclusionsIn this study, reservoir computing based on the cross-prediction algorithm for laser chaos synchronization secure communication is proposed. Its advantages are as follows. 1) When compared with traditional chaotic synchronization communication, reservoir computing is employed as the receiver that avoids the difficulty of a lower synchronization coefficient due to the difficulty of completely matched parameters between the sender and receiver. The proposed system can realize high-quality chaotic synchronization and communication with a synchronization coefficient of 99.90% under the premise of ensuring security. 2) The cross-prediction algorithm based on reservoir computing applied to the chaotic synchronization communication realizes long-term prediction and communication. The cross-prediction algorithm removes the effect of carrier synchronization error accumulation, enhancing prediction accuracy by 3 orders of magnitude over model-free prediction. The prediction mean square error can reach 10-4 orders of magnitude, and the decryption bit error rate can reach the order of 10-9. Furthermore, the image communication simulation experiment demonstrates that the security and proposed system’s communication quality are assured at the same time.
Jan. 01, 1900Vol. 49 Issue 18 1806001 (2022)
Xin Liao, Hongyan Jiang, and Ning He
ObjectiveAiming at the constraints in cross-medium wireless communication and according to the characteristics of atmospheric and oceanic communication, the laser-induced acoustic communication adopting time slot-hopping pulse position modulation (PPM) is proposed to achieve cross-medium signal transmission. The mechanism of optoacoustic effect is studied. Meanwhile, the time- and frequency-domain characteristics of the laser-induced sound in the underwater conditions are analyzed. Combining atmospheric optical wireless communication with underwater acoustic communication and reasonably selecting time slot combination for hopping, the reliability and security for information transmission can be effectively improved. Based on the pulsed laser-induced sound, a time slot-hopping PPM communication link from air to underwater is established, where field programmable gate array (FPGA) is adopted to achieve coding and decoding. Tests for information transmission by frames are accomplished. Note that each frame has one-byte data. Using time slot-hopping technology can effectively reduce the interception probability of the transmitted signal.MethodsThe interaction of laser pulse with gas, liquid and solid can induce acoustic waves. Firstly, according to the basic theory of laser-induced acoustic waves in liquid, including the effects of laser characteristics, liquid characteristics and incidence angle on optoacoustic energy conversion efficiency as well as excitation mechanism, a technical methodology for cross-medium communication from air to water is introduced in this paper, where the pulsating acoustic source radiates radially outward in the form of spherical wave (Fig. 1). Subsquently, the PPM format with variable time slots is used. Framing with two pilot pulses and one-byte data, three frames with different time slots are presented (Fig. 3). Finally, the coding and decoding of time slot-hopping PPM is achieved by FPGA, and then the experimental test platform based on laser-induced acoustic waves is established for data transmission and analysis (Fig.7).Results and DiscussionsBy the experimental analysis of the time- and frequency-domain characteristics of laser-induced acoustic waves (Fig. 6), it has been shown that the time-domain waveform has many peaks, and the sound pulse gradually decays to disappear. By Fourier transform, the spectral characteristic is obtained, wherein the peak frequency is about 30 kHz. The components with frequencies greater than 100 kHz decay rapidly, and the energy is concentrated at the components with lower frequencies. The noise is regarded as an additive white Gaussian noise (AWGN), whose amplitude is much lower than that of the laser-induced sound pulse. The technologies of time slot-hopping PPM and framing with one-byte data are adopted. A combination of 256PPM, 16PPM and 4PPM is considered and the received waveform is obtained for the case that the optical energy arriving at the water surface is greater than 15 mJ, as shown in Fig. 8, wherein the top one represents the waveform detected and amplified by a hydrophone and the bottom one is a shaped signal as the input of the FPGA for decoding. The relationship between the data rate and frame length is discussed by comparisons among the three modulation orders (i.e., 8, 4 and 2, respectively). The data rate depends much on the modulation order and the time slot duration of PPM. Assuming that the laser source meets the requirements of pulse repetition frequency and response time, a data rate of 5 kbit/s could be achieved in the laser-induced acoustic communication with a time slot duration of 10 μs. In experiments, the time slot duration is set as 10 ms. Experimental results show that the symbol error rate could be lower than 10-5 if the optical energy arriving at the water surface is greater than 25 mJ. Combining more PPM formats with different orders is beneficial to reduce the probability of interception.ConclusionsIn the cross-medium communication from air to water based on the laser-induced sound, the optoacoustic integration is used to give full play to the advantages of atmospheric laser communication and underwater acoustic communication. Due to the controllable position of the induced acoustic pulse by airborne laser remote excitation, the flexibility and initiative of communication operations could be greatly improved. The characteristics of laser-induced acoustic source can meet the requirement of the frequency range in underwater acoustic communication. Using time slot-hopping technology and reasonably selecting time slots and time slot combination can effectively enhance the anti-interception ability, which could provide reference for the air-to-water communication.
Jan. 01, 1900Vol. 49 Issue 18 1806002 (2022)
Xin Zhang, Cunzhu Tong, Kaidi Cai, Yanjing Wang, Lijie Wang, and Sicong Tian
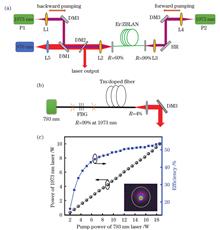
ObjectiveThere is an increasing scientific interest in developing mid-infrared laser sources to fulfill various application requirements in the biomedical, defense and security, and material processing. In particular, the 3.5 μm fiber laser has become a research hotspot due to its good beam quality, high brightness, and being in an atmospheric window. Limited by the nature of fiber materials and lack of fiber optical devices, the power of a mid-infrared fiber laser is two to three orders of magnitude less than that of a near-infrared laser. However, the low power of a mid-infrared fiber laser is a key factor limiting its practical applications. It is great significance for expanding its application fields to improve the power of a mid-infrared fiber laser.MethodsThe method of cascade pumping is proposed to achieve a high efficiency 3.5 μm fiber laser. The 1973 nm and 976 nm dual-wavelength laser source is used to pump the Er-doped fluoride fiber (Er∶ZBLAN). The ground-state particles are pumped by the 976 nm laser to the energy level of 4I11/2, and the particles at the 4I11/2 energy level are pumped by the 1973 nm laser to the upper energy level to achieve a 3.5 μm laser. However, the end of a fiber would be damaged under a high pump power. Considering that the main factor of the 3.5 μm laser power is the 1973 nm pump power, the bidirectional pumping scheme is proposed to improve the output power here. Double homemade 1973 nm pump laser sources are coupled into the 4.8 m long Er∶ZBLAN fiber. The core diameter and numerical aperture of the fiber are 17.8 μm and 0.12, the cladding diameter and numerical aperture are 250 μm and 0.5, and the doping concentration (mole fraction) is 1%. Both ends of the optical fiber are cut into a 0° angle and closely attached to the cavity mirror. The reflectivity of the output coupling mirror is about 60% at 3500 nm (high transmission @1973 nm & high transmission @976 nm). And a 45° dichroic mirror DM2 (high reflection@ 3500 nm & high transmission @1973 nm & high transmission @976 nm) is used to output a 3.5 μm laser from the system.Results and DiscussionsFirst, the 3.5 μm lasers are realized by forward and backward pumping, respectively. And the output powers are measured (Fig. 2). It can be seen that the output power for backward pumping is slightly higher than that for forward pumping. When the 976 nm pump power is fixed, the output power increases with the increase of the 1973 nm power and then reaches saturation. At this time, the output power continues to increase with the increase of the 1973 nm pump power when the 976 nm pump power increases. The reason can be analyzed by the energy level structure of the 3.5 μm Er∶ZBLAN fiber laser (Fig. 3). The ground-state particles are pumped by the 976 nm laser to the energy level of 4I11/2 and subsequently these particles are pumped by the 1973 nm laser to the upper energy level to achieve a 3.5 μm laser. When the 976 nm pump power is low, the number of particles at the 4I11/2 energy level is small. The output laser power will be saturated under the high 1973 nm pump power. And the output power continues to increase with the increase of the 1973 nm pump power by enhancing the 976 nm pump power, because the number of particles at the 4I11/2 energy level increases under the high 976 nm pump power. Of course, the number of particles pumped to the 4I11/2 energy level should be matched with the 1973 nm pump power. The excessively high 976 nm pump power would not contribute to improve the laser power, but increase the heat dissipation pressure on the fiber end face. By fully optimizing the 3.5 μm laser output power in both forward and backward pumping, the bidirectional pumping is conducted. When the backward pumping is turned on and the maximum output power is realized, the forward pumping is then turned on. With the increase of the 1973 nm pump power, the 976 nm power is also increased complementarily. The power curve for bidirectional pumping is recorded (Fig. 4). The laser threshold is 1.5 W, the maximum output power is 2.32 W, and the total light-to-light conversion efficiency is 10.33%. The output spectra under different pump powers are measured by the mid-infrared Fourier spectrometer (Fig. 5). When the 1973 nm pump power is 2 W, the central wavelength of the lasing spectrum is 3457 nm. As the pump power exceeds 2 W, the central wavelength is switched to 3539 nm. The beam envelope and diameter of the 3.5 μm output laser are measured by pyroelectric camera. The beam quality factor (M2) is calculated according to the laser beam quality test method (Fig. 6). The output laser beam presents a fundamental mode Gaussian distribution and its beam quality factor M2 is less than 1.5.ConclusionsBased on the homemade 1973 nm pump sources, a 3.5 μm Er∶ZBLAN fiber laser based on bidirectional pumping is achieved at room temperature. The maximum output power is 2.32 W, and the total light-to-light conversion efficiency is 10.33%. And there is no damage on the fiber end under the maximum pump power. When the 1973 nm pump power is below 2 W, the laser central wavelength is 3457 nm. The central wavelength is switched to 3540 nm as the 1973 nm pump power exceeds 2 W. The envelope of the laser beam presents a fundamental mode Gaussian distribution and the beam quality factor M2 is less than 1.5. By optimizing the pumping structure and fiber parameters, the laser power can be further improved.
Jan. 01, 1900Vol. 49 Issue 18 1801001 (2022)
Rongtao Li, Junqing Meng, Xiao Chen, and Weibiao Chen
ObjectiveSemiconductor lasers are highly efficiency and have a small divergence angle, narrow pulse width, and good durability. They are widely used in material processing, industrial manufacturing, laser lighting, lidar, and laser communication. However, the output spot of the traditional edge-emitting semiconductor laser is elliptical and an additional beam shaping system is required. Further, it is sensitive to temperature change because the temperature drift coefficient at the central wavelength is 0.3 nm/℃. Therefore, for a wide temperature range and large temperature differences between day and night, an additional temperature control system is required, which increases the volume, cost, and complexity of the laser. Recently, vertical-cavity surface-emitting lasers (VCSELs) have been used increasingly as semiconductor laser pump sources. Compared with traditional edge-emitting semiconductor lasers, VCSELs have circular output spots with a small divergence angle, good beam quality, small temperature drift coefficient, high reliability, and low cost. A VCSEL chip contains hundreds or thousands of units in the two-dimensional (2D) array distribution. Its high-power output of hundreds of watts or even kilowatts can be realized through the 2D array arrangement. Therefore, it is a suitable pump source for compact high-power solid-state lasers. In this paper, we report a laser with a VCSEL array as the pump source. The laser has the advantages of high beam quality, small volume, compact structure, and insensitivity to temperature change. It can be used under large day-to-night temperature differences as well as rapid temperature changes. Additionally, it serves as an emission light source for applications in space.MethodsThe laser uses an 808-nm VCSEL array as the pump source to pump Nd∶YAG crystal via end pumping. However, directly using it to pump the Nd∶YAG crystal will lead to low power density and low pump efficiency because the VCSEL array is composed of many units and has a large luminous area. Therefore, collimating and shaping the output laser of the VCSEL array is fundamental. To shape the output laser of each unit in the VCSEL array, we employ a 2D microlens array with the same distribution as that of VCSEL. The shaped VCSEL pump light is coupled to the crystal with a focusing lens. The doping concentration (atomic fraction) of Nd∶YAG crystal is 0.5%, and its size is 3 mm×3 mm×15 mm. The pumping side of the crystal is coated with 1064 nm high-reflection film and 808 nm high-transmission film. The output side is coated with 1064 nm and 808 nm high-transmission films. The electro-optic Q-switched module consists of a thin-film polarizer, KTP (KTiOPO4) crystal, and quarter-wave plate. It adopts a voltage-increased electro-optic Q-switched method and is driven by a high-voltage signal to realize the on-and-off switch. A flat mirror with transmissivity of 40% is used for output coupling, which forms a laser resonator with the gain crystal pumping side to realize the normal operation of the laser. The total length of the laser is 120 mm.Results and DiscussionsAt a repetition frequency of 100 Hz, when the VCSEL pump energy is 28.25 mJ (working current is 150 A), the static output energy and dynamic output energy are 7.96 mJ and 5.36 mJ, respectively. The ratio between dynamic output energy and static output energy for Q switching is 67.3%, and the optical-optical conversion efficiency is 18.9% (Fig. 6). Furthermore, the full width at half maximum of the output laser is 4.16 ns (Fig. 7) and the peak power is 1.29 MW. The beam quality factor along the two directions is Mx2=1.409 and My2=1.531 (Fig. 9). In the temperature range of 10-37 ℃, the minimum and maximum output energies are 5.24 mJ and 5.58 mJ, respectively.ConclusionsIn this paper, we propose a compact solid-state laser with a small volume and large operating temperature range. The pump module consists of VCSEL and microlens arrays, and the VCSEL output laser is shaped using the microlens array. The Nd∶YAG crystal is pumped via end-pumping. Through the electro-optic Q-switching method, the laser is obtained with a pulse width of 4.16 ns, output energy of 5.36 mJ, and beam quality factors of Mx2=1.409 and My2=1.531. With the advantages of good beam quality, small volume, compact structure, and insensitivity to temperature change, the laser proves efficient under large day-to-night temperature differences and rapid temperature changes and can further be used as an emission laser source for application in space.
Jan. 01, 1900Vol. 49 Issue 18 1801002 (2022)
Wei Sun, Yonghu Yan, Jie Guo, Zhipu Yao, Yonggang Zhu, Zuowei He, Jian Yuan, and Wei Chen
ObjectiveIn order to filter out the residual pump light, the high-order mode laser, the core leakage laser, and the reflected laser in the power delivery fiber (PDF) cladding of a high power fiber laser, it is urgent to improve the beam quality and keep the operational stability of a high power fiber laser. Cladding light stripper (CLS) as the critical component for cladding light filtering, is capable of efficiently stripping cladding light and ensuring the stability and beam quality of a fiber laser. In the practical laser applications, another significant effect of CLS is to resist returning light. Due to the reflection from the workpiece surface, the light returning back to the fiber damages the resonant tank and the fiber components, disturbs the stability of the resonant tank, burns the fiber components including the fiber Bragg grating (FBG) and the combiner, and breaks down the red light chip. CLS is able to effectively eliminate the returning light transmitting in the fiber cladding, so that the damage can be suppressed enormously. At present, the main research direction of CLS is to achieve a higher power attenuation coefficient, a lower temperature rise coefficient, and a tolerance of high power through different methods.In practical application of low numerical aperture(NA)cladding light, it is difficult to withstand high power and high attenuation coefficient, and the problem of high power CLS temperature rise is still difficult to solve, which is mainly due to the long filtering distance required for low NA light and the concentrated leakage of high NA light. Most researches about CLS devices use the PDF materials at abroad.MethodsHere the self-developed 20 μm/400 μm power delivery optical fiber is used as the preparation material of a CLS device, the KHF2 solution, glass frosted paste, and hydrofluoric acid are used as the etchants, and the segmented etching method and the composite application of the three etchants are adopted to prepare the gradient structured CLS. In order to test the CLS performance during stripping of high NA cladding light, a test device (Fig. 1) is built. The filtering performance and heating of CLS for 976 nm pump LD input are measured. This device uses three 140 W LDs as the input laser source. In order to test the filtering performance of CLS under different etchant processes, the samples (Table 1) are connected to the test device for a test. The input power of the pump laser is 180 W.According to the corrosion characteristics of each corrosive agent, the glass frosted paste and KHF2 are suitable for making rough structures on the PDF surface, and the HF is suitable for preparing a section of optical fiber with a special diameter. After filtering the cladding light, the power proportion of low NA light in the fiber increases relatively. Reasonable gradient transition and increase in roughness can improve the filtering performance of CLS. Therefore, the lengths of four sections of the gradually corroded CLS are designed as 70 mm, 25 mm, 25 mm, and 25 mm, respectively. According to the test result of a filtered pump laser, the KHF2 is used as the corrosive agent in the first section, and the glass frosted paste and HF are used as the corrosive agents in the last section. The process parameters of the designed CLS samples are shown in Table 2. The NAs of the high-order mode laser leaked from the actual core and the laser returned by the workpiece are much smaller than that of the pump light. In order to obtain high-power cladding light with the same brightness as that of the low NA core laser, the self-developed ytterbium doped fiber with a size of 19 μm/400 μm is adopted as the gain medium. When the ytterbium doped fiber is fused with an energy transfer fiber at the high reflective grid end, the core laser in the energy transfer fiber leaks to the cladding layer of the ytterbium doped fiber through the fiber core mismatch. Furthermore, the bending diameter of the fiber at the end of the high reflective fiber grating is less than 80 mm, which promotes the leakage of the high-order mode laser in the fiber core, so as to obtain the hundreds of watts level low NA cladding laser.Results and DiscussionsThe samples in Table 1 are used to strip the 180 W high NA pump laser with the test device shown in Fig. 1, and the obtained results are shown in Fig. 3. The power attenuation coefficient of the sample prepared by HF corrosion is the smallest, which is within 1 dB. The power attenuation coefficient of the sample prepared by KHF2 corrosion increases gradually with the increase of corrosion time, and its value approaches 2 dB and then remains balanced. The power attenuation coefficient of the sample prepared by glass frosted paste corrosion is the largest, which is up to 16 dB, and its filtering performance for semiconductor laser is the best. The CLS light leakage diagrams of different samples are shown in Fig. 4. Judging from the light leakage shape, the scattering power density in the cladding layer is reduced. If the corrosion length increases, the scattering power density decreases. Therefore, KHF2 is suitable for the first stage.The prepared CLS by the composite corrosion process (Table 2) is used to strip the 343 W pump laser power with the device shown in Fig. 1, and the output power is only 2.22 W with no obvious fever. The test results are shown in Fig. 9(a), and the corresponding power attenuation coefficient is 21.9 dB. As shown in Table 2, the composite corrosion process is more suitable for a high power laser stripper. Connecting the CLS (Table 2) to the test device (Fig. 2) can reflect the actual application effect of a CLS. The power difference before and after CLS access is calculated and recorded as the stripping power, so as to evaluate the optical stripping ability of the CLS cladding. The test results are shown in Fig. 9(b). Both the laser output power and the CLS stripping power increase linearly with the increase of input power, indicating that CLS can work stably and strip a low NA 208 W cladding laser when the laser input power is 1173 W. The CLS device is suspended without heat sink scattering. The direction of the bold arrow in Fig. 11 indicates the laser transmission direction, and the thermal imaging diagram shows that the maximum temperature of CLS is only 41.3 ℃, and the temperature field is evenly distributed.ConclusionsBased on the self-development PDF, the anhydrous cold CLS is prepared for a high power fiber laser. The gradient structure of CLS is prepared by optimizing the corrosion process and the surface structure of the optical fiber. When the pump light input power is 343 W, the power attenuation coefficient is 21.9 dB. The 1173 W input laser can be used to strip the 208 W low NA cladding light, and the working temperature of the stripper is stable below 45 ℃. The CLS performance can meet the application requirements of high beam quality and stability high-intensity fiber lasers.
Jan. 01, 1900Vol. 49 Issue 18 1801003 (2022)
Hailong Wang, Huiqi Yang, Jing Su, and Huadong Lu
ObjectiveDue to its small construction, low-intensity noise, and narrow linewidth, all-solid-state continuous-wave (CW) single-frequency lasers have been widely employed in scientific research, military, and medical applications. The emission wavelengths of lasers can be confined to many particular ranges due to the constraints of the fluorescence spectra of laser crystals, which cannot match the demands of rapidly increasing scientific research. As an effective laser wavelength conversion technology, the nonlinear frequency conversion process including optical parametric oscillation (OPO), sum frequency (SF), different frequency (DF), etc., provides multi-watt CW output powers in the deep-ultraviolet (DUV) to mid-infrared and further expands the applied field of lasers. The single-frequency 1550 nm laser is frequently utilized in the formation of quantum squeezed and entangled states because its wavelength matches the low dispersion and low loss window of fibers, allowing for long-distance and steady laser transmission through the fiber. At present, there are several methods to generate a 1550 nm laser. Firstly, the 1550 nm laser is produced by a laser crystal co-doped with ytterbium-erbium (Yb3+ , Er3+ ) directly pumped by a 976 nm semiconductor laser. The low cost, small construction, and ease of downsizing draw a lot of interest, however, the gain crystal’s intrinsic excited state absorption restricts the laser output power. Secondly, the 1550 nm laser is also produced by an erbium (Er3+ )-doped fiber laser. The erbium-doped fiber laser’s waveguide structure is advantageous for achieving high-power output, although the output laser’s noise is rather high. In comparison to the previous approaches, the OPO process combines the benefits of low noise, small line width, and high stability to make the single-frequency 1550 nm laser the ideal contender. Especially, when we would like to generate the 1550 nm squeezed and entangled states, it is needed to use 775 nm and 1550 nm lasers as the pump and signal lasers of the optical parametric amplifier (OPA), respectively. As a result, an intra-cavity frequency-doubled (FD) singly resonant optical parametric oscillator (SRO) made of four mirrors is created and reported in this research, with simultaneous watt-level CW single-frequency lasers at 775 nm, 1550 nm, and 3393 nm.MethodsIn the experiment, to achieve high power signal laser and its frequency-doubled laser, it is important to acquire two focus waists in the cavity. The thermal lens effect of the MgO∶PPLN crystal induced by the pump, signal, and idler lasers was initially estimated for this purpose. The thermal lens effect of MgO∶PPLN is mostly due to its absorption of high-power intra-cavity signal lasers, according to theoretical simulations. On this basis, a ring resonator including two small waists was designed and built, which consists of four concave mirrors (radius of curvature of mirrors M1 and M2 is 60 mm and that of mirrors M3 and M3 is 40 mm), and whose whole length was optimized to 406 mm. The waist radii of the signal lasers at the OPO and second harmonic generation (SHG) crystals were 70 μm and 52 μm, respectively, in this scenario. To ensure a singly resonant optical parametric oscillator for the signal and single-pass transmission for the pump and idler lasers, the input coupler M1 was coated with high reflection (HR, reflectivity R>99.8%) film for the signal laser across 1400-1700 nm and high transmitting (HT, transmittivity T>97%) film for the pump 1064 nm laser. Mirror M2 was coated with HR(R>99.8%) film for the signal laser and HT(T>95%) film for the idler laser (3000-4200 nm). Mirror M3 was coated with HR(R>99.8%) film for the signal laser. Mirror M4 was coated with 1% transmission film for signal laser and HT (T>95%) film for frequency-doubled laser across 730-850 nm. The pump source was a handmade all-solid-state CW single-frequency 1064 nm laser with good performance. A coupling system consisting of an optical isolator (OI), two half wave-plates (HWP), and two lenses oriented and focused the output laser beam on the OPO. A 40 mm long 5% MgO-doped periodically poled PPLN crystal (polarization cycle Λ=30.49 μm) was used as the OPO crystal owing to its wide transparent window and low absorption loss, which was placed at the focus point between the mirrors M1 and M2 to generate the high efficiency and high-power signal and idler lasers. For the intra-cavity SHG crystal, a PPKTP crystal (Λ=24.7μm) with the size of 2 mm×2 mm×15 mm was used and placed at the other waist between mirrors M3 and M4. For signal and frequency-doubled lasers, both sides of the crystals were covered with antireflection coatings. Both crystals were kept in separate ovens, each controlled by a 0.01 ℃ high precision temperature controller. The high-quality watts single-frequency infrared to mid-infrared laser output was generated by controlling the temperature of MgO∶PPLN and PPKTP to 51 ℃ and 40.2 ℃, respectively.Results and DiscussionsUsing a small double waists single resonance oscillation and periodically polarized crystal, a single-frequency CW three-wavelength laser output from the near-infrared to the mid-infrared at the watt level was obtained. Figure 1 depicts the effect of the pump, signal, and idler lasers on the thermal lens focal length of MgO∶PPLN crystal. It is shown that the effect of signal laser on the thermal lens focal length of MgO∶PPLN crystal is much larger than that of idle and pump lasers. A compact four-mirror ring SRO was designed as Fig. 2. We obtained 4.1 W of 1550 nm signal laser output power and 2.1 W of 3393 nm idler laser output power when the input pump power was 21 W (Fig.4), the quantity factor M2 of 1550 nm laser was better than 1.05 (Fig.5). The measured output power of signal and SHG lasers vs the input pump power is shown in Fig. 7. The pump threshold was discovered to be 8.3 W. When the incident pump power was raised to 16 W, more nonlinear effects appeared in the crystal as the signal laser power in the cavity rose, resulting in a reduction in FD conversion efficiency. When the pump power was increased to 21 W, the laser was operating stable and the output powers of 1550, 775, and 3393 nm lasers were 2.1, 1.1, and 1.7 W, respectively.The root-mean-square (RMS) variations of the output power during 5 h are less than 2.5% for the 1550 nm laser, 0.8% for the 3393 nm laser, and 1.6% for the 775 nm laser, respectively (Fig.8). The overall efficiency of light-to-light conversion was 23.3%. The 775 nm lasers’ measured beam quality was better than 1.13. (Fig.10). The output laser operates in a single longitudinal mode.ConclusionsThe experimental findings of the creation of near-infrared to mid-infrared lasers employing an SRO made up of four-mirror ring resonators and period poled crystals were described in this study. To begin, we looked at OPO’s focusing characteristics as well as the impact of the nonlinear crystal’s thermal lens effect on the laser stable area and waist size. On this basis, a four-mirror ring resonator structure with double small waists was designed. Then, as the OPO and frequency-doubling crystals, a MgO∶PPLN and a PPKTP were used to create the signal and frequency-doubled lasers, as well as the idler laser. When the pump power was 21 W, the output power of the 1550 nm signal laser could reach up to 2.1 W. The output powers of the 775 nm frequency-doubled laser and 3393 nm idler lasers were 1.1 W and 1.7 W, respectively, at the same time. The pump threshold was 8.3 W, the overall light-to-light conversion efficiency was 23.3%, and the beam quality was greater than 1.05 and 1.13 at 1550 and 775 nm, respectively. The RMS fluctuations of the power during 5 h were less than 2.5% of 1550 nm, 0.8% of 3393 nm, and 1.6% of 775 nm. The 775 nm and 1550 nm lasers created can be utilized as the pump and seed lasers of OPO and OPA, respectively, in quantum experiments to generate a 1550 nm compressed light field. It gives a trustworthy assurance for the development of a multi-component quantum light source, and it is viewed as a novel technological technique of attaining compact quantum squeezed state laser source manufacture.
Jan. 01, 1900Vol. 49 Issue 18 1801005 (2022)
Jingliang Liu, Xiaoqiong Li, Jian Dai, Jun Yin, Shouli Xu, Ruoqi Yu, Yansheng Hu, Chunliang Xu, and Tao Ni
ObjectiveLow-noise radio-frequency (RF) signal sources play an essential role in many fields and applications, such as radar, wireless communication, aerospace, measurement instruments, and scientific research. The optoelectronic oscillator uses a long fiber link to replace the traditional RF resonator as the high-Q-energy storage element, but this leads to issues related to the large volume, control difficulty, and poor stability. The coupled optoelectronic oscillator (COEO) uses active regeneration mode-locking technology to significantly shorten the length of the fiber ring cavity, which effectively improves its integration and stability. It is necessary to solve the issues of polarization sensitivity and supermode spurious for turnkey-coupled optoelectronic oscillators to realize self-start-up and stable single-mode oscillation.MethodsThe proposed turnkey-coupled optoelectronic oscillator mainly comprises an active non-polarization-maintaining fiber mode-locked ring cavity and an RF feedback amplification loop. In the 180 m non-polarization-maintaining fiber ring cavity, an electric absorption modulator (EAM) and a semiconductor optical amplifier (SOA) are used as the regenerative mode-locked element and amplification gain medium, respectively, to achieve self-starting capability and stable oscillation. In addition, the polarization insensitivity of the electric absorption modulation and the rapid gain saturation effect of the semiconductor optical amplification can help realize anti-polarization disturbance and supermode spurious suppression for the turnkey-coupled optoelectronic oscillator.Results and DiscussionsA turnkey-coupled photoelectric oscillator is demonstrated. The modulation gain fluctuation for an active fiber ring cavity is lower than 2.07 dB in 60 min, which is within the tolerance range for the mode-locked gain of the RF feedback amplification loop. In addition, the issues of the mode spurious and polarization disturbance are resolved, and the proposed 10 GHz oscillator can maintain stable single-mode oscillation after startup. Finally, the phase noise and spurious rejection ratio of the generated signal can reach -125 dBc/Hz at 10 kHz and 76.3 dB, respectively, which would significantly facilitate the development of coupled optoelectric oscillators.ConclusionsIn this study, a turnkey-coupled optoelectronic oscillator based on a 180 m non-polarization-maintaining active fiber ring cavity has been constructed to solve the issues of self-starting and stable oscillation owing to anti-polarization fluctuation and supermode spurious suppression. Finally, a 10 GHz RF signal is successfully generated with phase noise at a 10 kHz frequency offset lower than -125 dBc/Hz and a signal spurious suppression ratio of approximately 76.3 dB.
Jan. 01, 1900Vol. 49 Issue 18 1815001 (2022)
Yifan Liu, Baosheng Zhou, Tao Zhang, Detian Niu, Shijia Wang, Jianhui Su, Xiaoguo Song, and Caiwang Tan
ObjectiveLightweight structure has become a focus in industrial fields. One of the research hotspots is the effective joining of dissimilar materials. Because of their high specific strength, titanium alloys have been widely used in aerospace and automotive engineering applications. Carbon fiber reinforced plastics (CFRP) have many advantages over traditional metals, such as higher specific strength, fatigue resistance, and corrosion resistance, and have a broad application prospect to further realize lightweight. The laser joining of titanium alloy and CFRP can combine the advantages of the two materials and broaden their application. However, because of the large differences in microstructure and physical properties between the two base materials, the joining strength is relatively low. The properties enhancement of metal/CFRP joint can be achieved by improving mechanical interlocking and chemical bonding. The laser texturing process can fabricate a microstructure to improve the surface roughness of metal, as well as change the chemical state of the metal surface. Thus, the laser joining process of TC4 to CFRP via laser texturing TC4 surface and the strengthening mechanism of the interface were studied by us.MethodsTi-6Al-4V alloy (TC4) and polyether ether ketone reinforced by 30% carbon fibers (CFRP) were selected as base materials. The resin matrix of the composite material was polyether ether ketone (PEEK). The TC4 sheets were treated by laser texturing before laser joining. To obtain ideal micron-scale grooves, the spacing between each grid was 1 mm, and each grid line was filled with multiple equidistant scan lines. The number of scan lines was adjusted to control different micro-texture widths, and the micro-texture width in this study were set to 0.1-0.5 mm, as shown in Fig. 1. To evaluate the mechanical properties, tensile shear tests with a stretch speed of 0.5 mm/s were used. A high-temperature wetting angle measurement system was used to characterize the wettability of melted PEEK under different TC4 surface states. The optical digital microscope (OM) and scanning electron microscope (SEM) were used to examine the three-dimensional morphology of the laser textured surface, interface, and fracture surface of TC4/CFRP joints. The chemical bonding at the TC4/CFRP joint was examined using an X-ray photoelectron spectroscopy (XPS) analysis system.Results and DiscussionsThe introduction of micro-texture significantly increased the surface roughness of TC4, which first increased and then decreased with the increase of micro-texture width, when compared to the untreated TC4 surface. The canalization effect improved wettability significantly, as shown in Figs. 5 and 6. CFRP melted and completely filled the textured grid after laser joining with widths of 0.1 mm and 0.2 mm. When the width of the texturing grid was too wide, the molten CFRP could not be completely filled in the grid, as shown in Fig. 8. As shown in Fig. 10, new chemical bonding, such as Ti-C, was discovered at the treated interface, indicating that chemical bonding occurred. The shear force increased significantly after texturing compared with the untreated joint. The maximum tensile-shear force in the case of 0.2 mm micro-texture width was 2596 N, which was 154% higher than that of the untreated joint. The tensile-shear force of the TC4/CFRP laser joints increased first as the laser textured micro-texture width increased. The tendency was similar to that of TC4's surface roughness. A large amount of resin-carbon fiber mixture adhered to the fracture surface of the textured TC4 side, as shown in Figs. 12 and 13. The failure mode included interface failure, cohesive failure, and TC4 matrixes stripping from the substrate due to relatively high interfacial joining strength after laser texturing, indicating mechanical property enhancement.ConclusionsLaser texturing was used in the laser joining TC4 and CFRP. The grid pattern was used as the texturing pattern, and the effect of micro-texture width on joint strength was investigated. After laser texturing, the surface roughness of the TC4 surface and the wettability of molten CFRP to TC4 were significantly improved. With a micro-texture width of 0.2 mm, the surface roughness of TC4 could be increased approximately 15 times compared with untreated TC4 and the contact angle reduced from nonwetting to 49.9°, demonstrating that laser texturing could improve the affinity of molten CFRP on TC4 substrate. The maximum tensile-shear force in the case of 0.2 mm micro-texture width was 2596 N, which was 154% higher than the untreated joint. The surface failure mode was a hybrid failure mode including interface failure and cohesive failure. After laser texturing, TC4 matrixes are stripped from the substrate, indicating that the texturing grid may promote mechanical interlocking and increase the tensile-shear force of joints. New chemical bonding was confirmed at the joining interface, implying that chemical bonding occurred at the interface due to the high interfacial temperature. The laser texturing process increased the contact area of the joining interface, improving mechanical interlocking. Surface modification of the TC4 substrate can be achieved using laser texturing, promoting the formation of chemical bonding between CFRP and TC4 to further strengthen joints.
Jan. 01, 1900Vol. 49 Issue 18 1803001 (2022)
Haima Yang, Yan Jin, Jia Qiang, Jin Liu, Jun Li, Dawei Zhang, Yuanshen Huang, and Yong Yu
ObjectiveAs an important branch of quantum science, quantum optical communication has gained a lot of attention and investment in scientific research worldwide due to its advantages of high security and good physical confidentiality. In free-space quantum optical communication, the maintenance and detection of the beacon rotation angle between the transmitter and receiver of the beacon light is the key to ensure the success of quantum optical communication in the free-space motion platform. How to obtain the rotation angle of the beacon light transmitter on the moving platform and effectively use the limited optical link to obtain the attitude information of the target is one of the difficult technologies for low-cost mobile quantum optical communication in the future. The existing techniques for measuring the rotation angle of beacon light are limited by a variety of factors such as the large error of the measurement system caused by the construction of hardware equipment and the limited range of angle measurement, and the debugging of parameters in the angle calculation method using adaptive iteration has a large impact on the experimental results. In this paper, by streamlining the optical path design, an optical method of deviation self-compensation is proposed. A combined beacon beam is obtained using red (R), green (G) and blue (B) three-color light carrying different polarization angle information. The concepts of difference and ratio are introduced to construct the parameter β to calculate the three-color light intensity. Finally, the θ-β relation between the beacon rotation angle θ and the characteristic parameter β is established. In this way, we decouple the measurement of the rotational attitude angle of the platform. To some extent, the scheme we propose can reduce the interference error introduced by the environment, expand the application scenario of beacon rotation angle measurement, and achieve the design goal of the system.MethodsIn this paper, the red, green and blue combined beacon light adjusted by 0°, 45° and -45° polarizer start biases is designed to carry the rotational attitude angle information of the carrier platform. After the free-space transmission, the combined beacon light is decoupled by the ground receiving system and the three-color light intensity value of the beacon light is obtained at the receiving end using three photodetectors. The schematic diagram of the measurement system is shown in Fig. 1. The data processing flow of this measurement system involving four main steps (Fig. 6). The system performs RGB three-channel measurement on the carrier platform, and three sets of raw data will be obtained. First, the raw data need to be filtered to remove the noise in the measurement process and to be normalized to eliminate the influence of the magnitude on the values. In the next step, the magnitude relationship between the three-color light intensity values can be used to initially determine the range of the object rotation angle. Further, the characteristic parameter β is constructed according to the difference and ratio of the three-color light intensity values, and the calculation process of β is represented in Fig. 4 to establish the θ-β relation curve between the beacon light rotation angle θ and the characteristic parameter β. In this way, fine angle results are obtained, realizing the measurement and calculation process from light intensity value to rotation angle.Results and DiscussionsAccording to Malus law, the light intensity model of the scheme is established as shown in Eqs. (4)-(6). The θ-β relation curve under ideal condition is shown in Fig. 7. To test the applicability of the curves, the RGB ensemble beacon optical rotational attitude decoupling measurement system was established, and multiple measurements were performed at different distances both in the laboratory and outdoors. The experimental results (Figs. 10 and 11) are consistent with the theoretical values in the measurement range of 0°-90°. In the positions of θ=22°, 23°, 24°, 67°, 68°, there are relatively large errors in the experimental values, and the accuracy of the remaining parts is relatively high, with the error no more than 0.0012. This error contains two meanings. One is the randomness of the measurement results, caused by the background light, air pressure, temperature and other random factors at the time of measurement. This kind of error is generally small. The other comes from the phase deviation among three channels, which is caused by the optical path structure and optical devices and will lead to the false β calculation results. This kind of error will impact the measurement results more substantially than the former. We conducted a detailed error analysis of the theoretical values and measurement results, and the error characteristic indices are shown in Table 2. The spatial attitude angle accuracy of the beacon can be 0.05°, with 3σ of 0.5° under indoor conditions and 1° under outdoor conditions. In summary, the overall average error of the experimental system is low, and the consistency between the experimental results and the theoretical results is high, indicating that the proposed scheme is practical and feasible.ConclusionsThe method is based on the red (R), green (G), and blue (B) ensemble beacon light with specified starting angle of polarization to decouple the rotational attitude angle of a space motion platform. The idea of difference and ratio is introduced, and the correlation curves are constructed to provide intuitive numerical results for the application of polarized light to rotational attitude angle decoupling. The stable and high accuracy measurement results are maintained in the experiments of different measurement environments. The accuracy of the beacon spatial attitude angle can be up to 0.05°, with 3σ of 0.5° under indoor conditions and 1° under outdoor conditions. The error indices of the measurement results under different measurement conditions are calculated to verify the feasibility of the optical decoupled rotational attitude angle of the RGB ensemble beacon. The method has little dependence on environmental stability, low complexity of the measurement device, and light burden of experimental data calculation. The current measurement system still needs to be improved in terms of phase compensation, which can improve the resolution of the measurement and the error correction effects to meet the requirements of higher precision dynamic measurement.
Jan. 01, 1900Vol. 49 Issue 18 1804001 (2022)
Tanbin Shao, Wenping Guo, Yinghao Xi, Ziyu Liu, Kecheng Yang, and Min Xia
ObjectiveThe development of precision manufacturing puts forward higher requirements for surface flaw detection technology in industrial testing. Because precision devices are easy to scratch, the contact measurement technology based on mechanical probe is no longer suitable for the detection needs of such devices, while the non-contact measurement technology based on optical method begins to highlight its advantages. At present, the commonly used high-precision displacement sensor includes the laser triangle ranging sensor. It has the advantages of simple structure and convenient operation, but the measurement accuracy is influenced by the size and shape of the light spot, environmental light and other factors. Besides, the laser triangle ranging sensor depends on its sample surface scattering light, so it is not suitable for the measurement of high reflection and inclined surface. The chromatic confocal technology has the advantages of high resolution and insensitivity to surface texture, tilt, stray light and other factors, so it is more suitable for the detection needs of precision devices. In order to meet the requirement of a large measurement range in industrial testing, we design a large-range dispersion objective lens. In order to reduce the cost, a traditional spherical lens is adopted. We design a four-piece objective lens and optimize the aberration using the Zemax software. A chromatic confocal displacement measurement system is built with the designed dispersive objective lens. Experiments are designed and carried out to evaluate the displacement measurement error of the system and the measurement performance on different material samples. The results show that the system has certain adaptability to different material samples.MethodsA dispersion objective lens is designed by using the traditional spherical lens. According to the linear dispersion condition, we choose suitable materials, compute the initial structure of the objective lens, and then use the Zemax software to optimize the spherical aberration, dispersion range, and light spot size. In the process of optimization, the weight of the large dispersion is increased, and the demand for dispersion linearity is reduced. At the same time, the small spot size and spherical aberration are ensured, and finally the structure of the dispersion objective lens with large axial chromatic aberration is obtained. Using the designed dispersion objective lens, the chromatic confocal displacement measuring system is established. A spectral characteristic normalizing method is designed to eliminate the undesired effects on the spectral signals, resulting from the optical fiber attenuation characteristics, light source spectral distribution characteristics and spectrometer detector responsivity. The evaluation experiment is designed and carried out to figure out the displacement measurement error of the system. In addition, the displacement measurement experiment of different materials commonly used in industrial application is carried out, and the results show that the system has certain adaptability to the measurement of different materials.Results and DiscussionsMost of the existing studies on the design of chromatic confocal objective lens based on traditional spherical lens have a small measurement range and are greatly limited in the industrial testing. The dispersion objective lens designed in this study has an axial chromatic aberration of nearly 10 mm in the working band, and the spherical aberration of monochromatic wave is well corrected(Fig. 5). The chromatic confocal displacement measurement system built with this objective lens can obtain a measurement range of 10 mm, which can better meet the demand for industrial detection with large range(Fig. 9). Aiming at the problem that the spectral signal in the system is subjected to extra modulation, a normalized processing method of spectral characteristics is designed(Fig. 2), which reduces the adverse effects of the spectral distribution characteristics of light source, the attenuation characteristics of fiber and the response characteristics of spectrometer detector on the spectral signal received by the system and obtains the spectral signal with good characteristic peak(Fig. 8). The experimental results show that the system has good adaptability to different material samples(Table 3).ConclusionsIn this study, according to the basic principle of chromatic confocal displacement sensor and linear dispersion condition, the initial structure of the dispersion objective lens is designed. The light spot size at each wavelength and the monochromatic spherical aberration of the initial structure are optimized by using the Zemax software, and the axial chromatic aberration is controlled at the same time. Finally, a dispersion objective lens with an axial chromatic aberration of 9.962 mm in the 500-700 nm band is designed. A chromatic confocal displacement measurement system is designed by using the dispersion of the objective. In order to eliminate the effects of fiber attenuation characteristics , spectral distribution characteristics of the light source, and the spectrometer detector responsivity, the spectral characteristic normalizing processing method is designed and then the relationship between the peak wavelength and the position is obtained. The built displacement measurement system obtains the 10 mm measuring range, and the standard deviation of measurement is 0.5 μm and the mean absolute error of measurement is 0.6 μm. In addition, different material samples are measured, and the results show that the system has certain adaptability to different material samples. Compared with the laser triangle ranging sensor, the system is more suitable for high reflection samples.
Jan. 01, 1900Vol. 49 Issue 18 1804002 (2022)
Mengyao Zhang, Ailing Tian, Dasen Wang, Xueliang Zhu, Bingcai Liu, and Hongjun Wang
ObjectiveThe processing precision of optical elements is increasing as current optical technology advances, as does the requirement for detection accuracy. To improve the surface shape measurement accuracy of interferometry, it is necessary to remove the influence of systematic errors including reference surface errors in the test process and obtain the absolute surface shape of the surface to be evaluated, which is the absolute testing technology of optical surface shape. The three-sided mutual detection technique, translation rotation method, and conjugate translation difference method are now the most regularly used absolute testing methods for the surface shape of planar optical components. The conjugate translation difference method is widely employed in absolute testing technology because of its short assessment cycle and no need for repeated adjustment. Translation, as a critical parameter in the conjugate translation difference approach, has a direct impact on the accuracy of surface form recognition. The traditional translation value is generally given by experience or the space size corresponding to a pixel of the detector, resulting in the measurement accuracy not reaching the optimal. In this research, the translation selection functions are the difference approximation accuracy and signal-to-noise ratio. We anticipate that the proposed approach may precisely measure the surface shape of planar optical components and enhance the scientificity and credibility of interferometry.MethodsIn this research, Gaussian white noise was added to the calculation of the absolute testing principle of conjugate translation difference surface shape to simulate the random noise introduced by environmental factors or CCD detector electronic noise in the actual measurement process. First, the error model of translation and surface reconstruction under noise was constructed by examining the accuracy and signal-to-noise ratio of differential approximation; subsequently, taking the estimated surface shape of the evaluated surface and the surface shape deviation caused by random noise as a single variable, the optimal translation interval under the allowable error of surface reconstruction was solved by utilizing the differential Zernike algorithm, and the influence of the size of random noise and the distribution of the original measured surface on the optimal translation interval was simulated and analyzed; Finally, the commercial interferometer was utilized to perform four sets of surface absolute testing experiments on the standard mirror at various translation. The measurement results were compared with the traditional three-sided mutual detection method to assess the surface measurement correctness before and after the optimization of translation.Results and DiscussionsThe value of translation affects the accuracy of the differential approximation and the signal-to-noise ratio of the interferogram and then affects the final surface reconstruction result. According to the research on the surface shape measurement error induced by translation, under ideal conditions, the translation is precisely proportional to the surface shape measurement error. The larger the translation is, the larger is the surface shape measurement error (Fig. 3); in the situation of random noise interference, the ideal translation interval varies depending on the measuring environment. The larger the surface shape deviation caused by random noise, the narrower the optimal translation interval (Table 1). According to the research on the optimal translation of the original surface distribution, the broader the best translation interval is under the impact of the same noise, the greater the accuracy of the measured surface is; The surface shape distribution does not affect the value range of the optimal translation (Fig. 6). The comparison results of the conjugate translation difference method’s surface profile and the three-sided mutual inspection method’s surface profile under different translation show that only the surface shape results obtained under the optimal translation interval are consistent with the three-sided mutual inspection results, and the RMS value of the two surface shape deviation is 1.19 nm (Table 3).ConclusionsBased on the inverse optimization strategy, taking the differential approximation accuracy and signal-to-noise ratio as the selected functions of the translation, we establish the translation and surface reconstruction error model under noise conditions, and study the translation and surface reconstruction error under different noise levels and initial surface error, providing theoretical guidance for selecting the appropriate translation for the tested 100 mm diameter mirror. The simulation of surface shape error under different translation shows that when the translation is small, the noise has great interference on the measurement results, that is, the signal-to-noise ratio is too low, resulting in poor surface shape reconstruction accuracy; as translation grows, the noise is efficiently suppressed, and the surface reconstruction error decreases; nevertheless, as translation increases, the surface reconstruction error increases due to the low precision of differential approximation. After the translation is optimized and determined by the random noise, initial surface shape accuracy and measurement allowable error in the actual measurement, the conjugate translation difference surface shape absolute testing technology has higher accuracy and the measurement accuracy deviation is 1.19 nm. The results of the experiments reveal that the inverse translation optimization approach improves the surface shape measurement accuracy of planar optical components. The study content fits the needs of the precision optical testing industry for fast measurement cycles and high optical element measurement accuracy.
Jan. 01, 1900Vol. 49 Issue 18 1804003 (2022)
Hongxia Cui, Xueying Wang, Ziwei Zhao, and Fangfei Zhang
ObjectivePanoramic imaging technology has been extensively employed in traffic supervision, robot navigation, mobile measurement, etc. Several panoramic systems have been developed by combining numerous cameras to offer a horizontal field of view of 360° and a vertical field of view ranging from decades degrees to 180°, with the development of sensors and computing abilities. The panoramic images can be created from the combined panoramic systems using two approaches. The first solution may be transformation, registration, and blending only based on the feature points. The approach often has a strong dependence on the feature points in the surrounding environment. Alternatively, the panoramic stitching approach depends on the direct or indirect transformation between the cylindrical or sphere and perspective projection. The second approach is more robust and effective than the first approach because of its independence of the feature points. However, the panoramic imaging would experience the mosaic error and geometric inconsistency of vision due to the surrounding environment’s unknown depth. To solve the difficulties of panoramic mosaicking, empty pixels, and multiple pixel projection in one pixel caused by the traditional panoramic stitching approaches, a multicylinder projection-based mosaicking approach is proposed to ensure that panoramic images are produced effortlessly.MethodsIn this study, we proposed an indirect panoramic cylindrical stitching approach based on multicylinder projection optimization to reduce the visual stitching error of overlapping regions while improving the panoramic images’ stitching accuracy. We hope that our study approach can be beneficial in computer vision and other related fields. First, we developed a panoramic camera system combined with eight low-cost network cameras. A set of indirect mapping equations between panoramic planar and perspective projections of subcameras were developed according to the rigorous imaging model for a multicamera panoramic system. Particularly, a cost function was developed that employs the minimizing projection error based on the projection constraint of homonymy points on the cylinder. Furthermore, the optimal solution of multiple cylinder radius was solved using the gradient descent approach. Thus, the approach of one cylinder projection is extended to numerous cylinder projections.Results and DiscussionsTable 1 shows the high-precision relative orientation elements between combined cameras. The panoramic indirect stitching imaging model was fabricated based on the precalibration findings. The experimental findings show that the multicylinder panoramic stitching approach offers a better visual effect than the traditional single-cylinder stitching approach (Fig. 5). In this manner, the corresponding points’ projection error in the panoramic images formed from the proposed approach was about 1/7th of the traditional single-cylinder stitching approach. The projection error of single-cylinder and multicylinder panoramic stitching approaches were calculated (Table 2). Furthermore, compared with the traditional direct approach, the difficulties of empty pixels and accumulation of pixels are solved (Fig. 6). The stitching speed of a panoramic image generated from the proposed approach is 10 times that of the traditional SIFT feature-based approach and 55 times that of the mosaicing approach in the OpenCV package (Table 3).ConclusionsThe proposed multicylinder projection-based mosaicking approach is effective in solving the difficulty of panoramic mosaicking errors due to traditional single-cylinder panoramic imaging equation in a 360° panoramic environment with inconsistent object distances. Additionally, the indirect projection approach is employed to solve the difficulties of empty and multiple pixel projections in one pixel due to the direct panoramic stitching approach. The approach proposed in this study exhibits higher stitching accuracy and visual consistency and is suitable for the panoramic systems combined with multiple cameras, which are designed with eight cameras arranged cylindrically. Indeed, it can also be extended to the sphere panoramic camera system.
Jan. 01, 1900Vol. 49 Issue 18 1804004 (2022)
Shuqin Jia, Ying Huai, Tingting Liu, Xi Chen, Tianliang Zhao, Wenbo Shi, Benjie Fang, Yuelong Zhang, and Yuqi Jin
Jan. 01, 1900Vol. 49 Issue 18 1816001 (2022)
Sensen Li, Yu Zhang, Guangli Xu, Yingqiang Xu, Zhichuan Niu, and Xiusheng Yan
Jan. 01, 1900Vol. 49 Issue 18 1816002 (2022)
Yanshan Wang, Wanjing Peng, Jue Wang, Xiaobo Yang, Yinhong Sun, Yujun Feng, Yao Wang, Tenglong Li, Yi Ma, Qingsong Gao, and Chun Tang
Jan. 01, 1900Vol. 49 Issue 18 1816003 (2022)
Ge Yan, Lei Zhang, Ling Yu, Fang Song, Chuantao Zheng, and Yiding Wang
ObjectiveMethane (CH4) is the primary component of natural gas, accounting for more than 90% of it. CH4is a colorless, odorless, flammable, and explosive gas. It is a safety hazard during the production and transportation of natural gas, coal, and oil. CH4 leakage is difficult to detect and can result in suffocation or even death. When the CH4 concentration(volume fraction) in the air reaches a certain limit (5%-16%), it can cause combustion and explosion in the presence of a heat source or open fire. According to the data from the U.S. Environmental Protection Agency in 2020, CH4 is a strong, short-term greenhouse gas with a rapid warming effect, accounting for 20% of global emissions, ranking second only to carbon dioxide (CO2). Although CH4 exists in the atmosphere for only approximately 12 years, its heat storage capacity in the atmosphere is 28-34 times that of CO2. Therefore, the development of a CH4 sensor system for real-time monitoring of CH4 concentration is essential for mitigating climate change, finding the sources of natural gas leakage quickly, and minimizing the loss of life and property.MethodsThe selection of gas detection technology is essential for detecting trace concentrations of CH4 in the atmosphere. In terms of time resolution, size, and cost, optical methods based on mid-infrared laser spectroscopy are advantageous for CH4 sensing. Tunable diode laser absorption spectroscopy (TDLAS) is demonstrated to be an excellent tool for trace gas detection because of its high sensitivity, selectivity, and real-time performance. In this paper, a mid-infrared CH4 sensor system is developed based on TDLAS. The light source is an interband cascade laser that is used to target the absorption line of CH4 at 3038.5 cm-1. For gas absorption enhancement, a multi-pass gas cell with an effective optical path of 26.4 m is used. To increase detection range and sensitivity, the wavelength modulation spectroscopy (WMS) scheme is used. The optical structure is simple, stable, and compact, making it ideal for vehicle-borne movement measurement. A mobile natural gas leakage source location method based on the LabVIEW data processing platform along with the gas turbulence model and particle swarm optimization algorithm is developed. Vehicle-borne movement measurement and leakage source location experiments are performed on Jilin University campus using the CH4 sensor system to validate its practical applicability.Results and DiscussionsThe modulation depth optimization experiment is performed to optimize the sensor's performance, and the optimal modulation depth is 0.235 cm-1 (Fig.5). To evaluate the stability of the CH4 sensor, pure N2 is measured for approximately 16 min using the WMS scheme. The Allan variance is used to calculate the detection limit of the CH4 sensor based on the measured data. The detection limit is 4.1×10⁻⁹ with the average time of 0.5 s, and the optimal detection limit is 6.2×10⁻¹⁰ with the average time of 54 s (Fig.7). The CH4 sensor has the response time of 1.92 s (Fig.8). The results of the vehicle-borne movement measurement experiment show that the atmospheric CH4 concentration range is 2.04×10⁻⁶-2.16×10⁻⁶ (Fig.9). The field testing is conducted to validate the effectiveness of the mobile natural gas leakage source location method. The localization error is 3.43 m.ConclusionsThis study demonstrates a promising method for detecting trace CH4 concentrations in the atmosphere and identifying the source of natural gas leakage for field applications. The experimental results demonstrate that the proposed method has promising future application in the detection of natural gas leakage.
Jan. 01, 1900Vol. 49 Issue 18 1810001 (2022)
Rufei Liu, Fei Wang, Hongwei Ren, Minye Wang, and Jiben Yang
ObjectiveThree-dimensional point clouds of urban areas are easily acquired using a mobile laser scanning (MLS) system. Due to the comprehensive influence of Global Navigation Satellite System (GNSS) positioning error, an inertial measurement unit (IMU) attitude fixing the error, scanner angle measurement and ranging error, and the location accuracy of the MLS point cloud varies greatly in the same direction and in different periods, which need to be registered to complete the correction of data position deviation. However, the difference between MLS point clouds from various sections is a nonrigid change, thereby making follow-up high-precision registration correction processing challenges. The field of view of the vehicle-borne platform scanner is limited, and there is mutual occlusion between ground objects and motion elements involving cars and pedestrians. This will result in the incompleteness of scene data. A terrestrial laser scanning (TLS) system is needed to make up for the deficiency of MLS system data coverage and scene expression by resurveying key areas and data holes. The MLS point cloud is the global coordinate system, and the TLS point cloud is the station’s local coordinate system, both of which must be registered to complete the unification of the coordinate datum. To address those issues, a registration method of road scene laser point cloud based on geographical object features was proposed.MethodsFirstly, the data characteristics of the laser point cloud in the road scene were analyzed, and the MLS point cloud was segmented by combining the elevation error trend and the distribution characteristics of ground objects in the road scene. A continuous small-range segmented point cloud was created from the MLS point cloud with a continuous distribution in the strip. Secondly, in the registration data, the height of low-lying vegetation was determined. The elevation of low-lying plants was used as the threshold value, and pass-through filtering was used to separate the near-surface point cloud from the non-near-surface point cloud. For the near-surface point cloud, curbstone was extracted using the moving window discriminant method, and the road guardrail and isolation belt were extracted interactively. The rod-shaped objects were extracted from non-near-ground point clouds based on the rod-arc feature. To minimize scene complexity, the registration primitives were derived from the artificial geographic entity target characteristics. Then, the multi-scale key points of the registration primitives were retrieved using a combination of eigenvalues and Local Surface Patches (LSP). Finally, under the constraint of key points, 4-points congruent sets (4PCS) and the improved iterative closest point (ICP) algorithm were employed to finish the registration of multi-stage MLS point clouds and the registration of TLS and MLS point clouds.Results and DiscussionsFor multi-stage MLS point cloud, we first created wheel track vector lines along the direction of the lane wheel track and then extracted one road point every one meter along the vector lines to analyze the relationship between the maximum deviation of elevation direction error and road length (Fig. 5). Based on the analysis findings and the features of the road scene, segmentation was performed using suitable thresholds (Table 3) to keep the nonrigid variation degree within a particular range, thereby facilitating data processing and reducing the influence of nonrigid error on registration. For road scene geographic entity objectives with different structures, a multi-scale keypoint detection method combining eigenvalue and LSP was proposed. Multi-scale key point descriptors were constructed via the analysis of octree voxel index, weighted covariance, curvature, and other attributes of different neighborhoods (Fig. 2) and compared with ISS, 3D-SIFT, and other feature point extraction methods. The findings suggest that the strategy used to extract key elements in this study is appropriate for road scenes (Fig. 7, Table 2). To complete the registration of multi-stage road vehicle-mounted laser point cloud and the registration of fixed stations and vehicle-mounted point cloud, a progressive registration mechanism integrating 4PCS and ICP algorithm was examined (Fig. 3). The registration accuracy of the multi-stage vehicle point cloud is within the range of 5 cm, and the maximum registration accuracy of fixed stations and the vehicle-mounted point cloud can reach 4.2 cm.ConclusionsThis paper takes multi-stage and multi-platform urban road point clouds as the research object, analyzes the characteristics of road scene laser point cloud, and proposes a road scene laser point cloud registration method based on the characteristics of geographical entities. The vehicle point cloud was divided on the basis of association between the difference in elevation deviation of multi-stage vehicle point cloud data and road length. To increase the accuracy and efficiency of the registration method, the geographical entity of the road was used as the registration primitive, and key locations with uniform distribution without losing a representative were extracted by integrating the eigenvalue and shape index. The registration of laser point cloud data of road scenes was completed. The multi-stage vehicle point cloud registration accuracy was within 5 cm, and the highest registration accuracy of fixed stations and vehicle-mounted point cloud was up to 4.2 cm.
Jan. 01, 1900Vol. 49 Issue 18 1810002 (2022)
Lin Jiang, Qi Liu, Bin Lei, Jianpeng Zuo, and Hui Zhao
ObjectiveMap construction is crucial to simultaneous localization and mapping (SLAM) technology and the foundation for robot positioning and navigation tasks. The environment map constructed using the traditional SLAM approach only provides the environment’s topological and geometric information; it fails to provide the object’s semantic information, thereby resulting in the poor understanding of the environment. When global positioning is performed in a complicated environment, obtaining faster positioning using only the environmental scale information in the map is a challenge. A semantic map can realize a more intelligent human-computer interaction function of the robot and accelerate the robot repositioning. In the indoor environment, there is rich and fixed wall corner information. The distinction of wall corners aids the mobile robot in performing higher-level positioning and navigation work. An approach of incrementally constructing a semantic map based on the fusion of laser and vision to determine the semantic information of wall corners and objects is proposed. The findings reveal that using a semantic map can enhance the positioning performance of robots.MethodsFirst, the laser lidar hit point was fitted linearly. Concave and convex wall corner information in the environment was extracted. The camera and electronic compass were employed to judge several wall corner categories to achieve rich wall corner category information. Then, the concave and convex wall corner information was used to determine and remove the cabinet objects, and the depth value achieved by the depth camera was corrected using the depth information of lidar, to obtain a more accurate semantic information of the surrounding object. Finally, the robot pose was synchronized, Bayesian estimation was employed to update the wall corner category and the object’s occupancy probability, and a semantic map was incrementally constructed.Results and DiscussionsIn the indoor environment, the category information of concave and convex wall corners is extracted. Green represents the concave wall corner and blue represents the convex wall corner (Fig. 4). Then, wall corners are identified via target detection. The electronic compass and laser lidar are integrated to judge the direction of wall corners to obtain wall corner category information in four directions. The identification findings are accurate in the actual environment (Fig. 9). Errors are prone to occur when obtaining semantic information about cabinet objects via semantic segmentation. Therefore, concave and convex wall corner information is employed to remove the false detection of semantic segmentation. The camera depth is corrected using lidar depth information (Fig. 12). Finally, the constructed object semantic map, grid map, and wall corner information are combined to obtain the final semantic map (Figs. 18 and 19). The object’s outline is consistent with the grid obstacle area, and different wall corner categories correlates with the correct wall corner position. The semantic map represents the semantic information in the environment. The success rate of repositioning using the proposed algorithm is 95% (Table 5), and the speed of repositioning is three times faster than that of the approach without a semantic map (Fig. 24).ConclusionsLaser lidar sensors were used to linearly fit the laser lidar hit point. Concave and convex wall corner information from the environment was extracted. The vision and electronic compass were employed to distinguish the concave wall’s directional corners, and four concave wall corners with various orientations were obtained. Furthermore, concave and convex wall corner information was employed to remove camera misidentification. First, the camera depth value was corrected using the laser depth value to achieve the correct semantic information of the cabinet object. Then, the semantic information was converted to coordinates and the object’s semantic map was incrementally constructed using Bayesian estimation. Finally, the semantic and grid maps were combined to obtain a final semantic grid map. Experiments in the simulation and real environment can prove the proposed method’s effectiveness. The semantic map is employed for relocation experiments to validate the semantic map’s practicality.
Jan. 01, 1900Vol. 49 Issue 18 1810003 (2022)
Wang Cai, Dongliang Wang, Wei Feng, Fanpeng Dong, Yaming Wei, Lecheng Jia, Wenjie Tian, and Bin Xue
ObjectiveThe traditional acoustic wave sensing method mainly relies on the piezoelectric effect. Although this technology is relatively mature, there have been several inherent problems. First, the acoustic phase resolution of the piezoelectric transducer has a high phase resolution threshold mainly due to the unclear start and end points of the acoustic signal of the mechanical vibration. In underwater target detection applications, this problem leads to the loss of some details of target motion information hidden in the phase. Second, the piezoelectric effect sensing of acoustic waves requires a piezoelectric transducer to "contact and collide" with the acoustic wave. Consequently, some acoustic information is destroyed while sensing the acoustic wave, resulting in a loss of some phase information. Third, the "collision" between the piezoelectric transducer and the acoustic wave is accompanied by the reflection, diffraction, scattering, and other physical phenomena of the acoustic wave. Combining these physical phenomena and the target acoustic wave leads to phase loss, which is also a manifestation of the baffle effect. Fourth, the traditional piezoelectric transducer composed of an array is more difficult to use in engineering due to its volume and mechanical structure. This affects the quality of acoustic sensing since large array systems are inconvenient to install and use. Furthermore, the regular maintenance cost of the equipment is high, and the detection and calibration are difficult. Therefore, in this paper, we proposed an acousto-optic effect laser array method for high-quality sensing of acoustic signals.MethodsWe proposed a Raman-Nath detection acoustic signal using laser sensing for the hydro-acoustic signal detection method. Here we focused on the colinear problem of levels zero and one diffracted light, respectively. A performance analysis of relevant influencing elements was conducted. Furthermore, we derived the underwater target tracking method using the principle of mutual correlation to solve the acoustic field localization. Subsequently, we analyzed the quality and characterization of the acousto-optical signal. An experimental setup was built for principle verification (Fig. 4). We compared the time- and frequency-domain characteristics of the acousto-optical effect with those of the piezoelectric effect (Fig. 5), focusing on the phase information of the acousto-optical signal. Finally, we built an underwater target tracking system, designed and fabricated a laser sensing device (Fig. 11), and constructed and completed the experimental system in an anechoic pool laboratory.Results and DiscussionsBy comparing both the time- and frequency-domain signal characteristics of the laser sensing method and the ultrasonic transducer method (Figs. 6 and 7), we prove that the signal received using the laser sensing method is of good quality with clear starting and finishing points. The phase characteristics show that the laser sensing method achieves an accurate perception of the ultrasonic phase (Figs. 9 and 10). For the tracking experiments of underwater targets, we set the number of moving steps of the ultrasonic transducer target to 20, and the minimum moving steps are 25 mm and 5 mm respectively, in which the shape of the ultrasonic transducer moving trajectory is the Chinese character "Zhong" , and the results are shown in Figure 14. The moving path of the ultrasonic transducer is set as a curve with 31 moving steps with a random moving step length. The detection tracking of the laser sensing device is consistent with the actual motion track. The actual positioning tracking results are shown in Fig. 15, and the positioning results of the three moving methods are shown in Table 1. The results show that the standard deviation of the x- and y-direction measurements are better than 10.42 mm and 1.88 mm, respectively. Moreover, the positioning standard deviation is better than 10.58 mm, and the angular resolution is better than 0.047°. Our laser sensing method outperforms the ultra-short baseline (USBL) device in terms of positioning accuracy and angular resolution index. The performance of our equipment is close to that of fiber optic hydrophones, as shown in Table 2.ConclusionsIn this paper, we propose a novel underwater high-resolution tracking method using laser sensing. Here, we deduce the principle of acousto-optical effect using Raman-Nath diffraction and the target tracking model. Based on these principles, we validate the phase-sensing capability of the acousto-optical effect for underwater acoustic waves and design a new small-aperture laser sensing device. Furthermore, we establish an experimental system for underwater tracking and experimentally verified the target tracking. The experimental results show that the measurement capability of hydro-acoustic phase sensing under the laser sensing mechanism is effectively improved. Laser sensing methods enable truly interference-free detection. Additionally, the angular resolution of underwater target tracking using our method is better than 0.05°. The laser sensing device provides a research reserve for developing new underwater target tracking and positioning technology with high resolution.
Jan. 01, 1900Vol. 49 Issue 18 1810004 (2022)
Zekai Yao, Yaoyi Cai, Shiwen Li, and Yifei Chen
ObjectiveRaman spectroscopy is a non-destructive testing technology. Qualitative and quantitative information of substances can be obtained by Raman spectroscopy based on its fingerprint spectrum characteristics and good performance, so it has been widely used in environmental, chemical, biomedical, and other fields. However, in Raman spectrum measurement, the spectral baseline drift caused by fluorescence scattering signal will make it challenging to identify the characteristic peaks of the Raman spectrum, which will have different degrees of adverse effects on the results of qualitative or quantitative analysis. Various baseline correction methods have been successfully applied to multiple spectral processing. However, the parameters of these methods still need to be set according to the experience of the researchers. In this paper, a baseline correction method based on cubic spline smoothing combined with discrete state transformation algorithm (DSTAspline) is proposed, which can find the best estimation result of fluorescence background globally based on discrete state transformation strategy and obtain the optimal baseline curve based on smooth spline curve fitting, thus completing the baseline fitting of Raman spectra signals. In the experiment, the spectra of two kinds of actual substances are selected, and the baseline correction of the Raman spectra is carried out based on the proposed algorithm. The experimental results show that the proposed method can effectively eliminate the baseline drift of Raman spectra with different intensity fluorescence backgrounds, thereby obtaining the real Raman spectra signals without complex parameter setting and adjustment processes. It provides reliable information for further Raman spectra data to realize the qualitative and quantitative analysis of substances.MethodsIn our proposed method, cubic spline smoothing is used to fit the baseline drift for Raman spectra. A binary vector V with the same dimension as the number of wavenumber points in the Raman spectrum is initially generated by the algorithm. The element in vector V is coded as either 1 or 0 to represent the corresponding point in the Raman spectrum whether it belongs to the fluorescence background region. Then discrete state transformation algorithm is used to generate new values of the vector V. The cubic spline smoothing method fits the estimated spectral baseline according to the wavenumber points in the fluorescence background region. The root mean square error (RMSE) between the fitted spectral baseline and the number of estimated background points is used to terminate the iterative process. Finally, once the iterative process is terminated, the accurate spectral baseline is fitted with the optimal vector V.Results and DiscussionsThe performance of the proposed DSTAspline baseline correction method was tested and verified by simulated and real Raman spectra (Fig. 1). The airPLS, IAsLS, ASWF and DSTAspline baseline correction methods were applied to the simulated and real Raman spectra for comparing their performances. For the simulated Raman spectrum, it is evident that the baseline drifts in the simulated Raman spectra (without noise or with strong noise) were well estimated by our proposed DSTAspline method, and real Raman signal could be extracted from the original Raman spectrum [Fig. 2(a) and Fig. 3(a)]. More importantly, the RMSE of the proposed DSTAspline method was the smallest among these four methods, even for the simulated Raman spectrum with intense noise [Fig. 2(b), Table 1 and Fig. 3(b)]. For real Raman spectra of the rhodamine B and tricyclazole, the proposed DSTAspline method can precisely estimate the severely drifting baselines and obtain the best performance among the four baseline correction methods (Fig. 4 and Fig. 5). Finally, the proposed DSTAspline method was applied to detecting and quantifying the rapeseed oil adulterated in peanut oil by combining Raman spectroscopy and chemometrics (Fig. 6). The result shows that the proposed DSTAspline method can improve the prediction accuracy of the calibration model (Fig. 7).ConclusionsThe proposed DSTAspline method provides an adaptive and effective way for estimating and correcting the baselines with various curvature curve backgrounds and multiple overlapping peaks. Based on the discrete state transformation algorithm, the spectral wavenumbers in the background region were chosen and the cubic spline smoothing algorithm smoothly fitted the estimated background. The experiment results with the simulated spectra demonstrate that the DSTAspline method provides better results of baseline correction and peak intensity estimation than airPLS, IAsLS, and ASWF. The proposed DSTAspline method avoids the complicated and artificial process of choosing numerous parameters for obtaining optimal performance. Moreover, based on the cubic spline smoothing algorithm, the proposed DSTAspline method is not sensitive to noise. The baseline correction results of experimental Raman spectra also show that the DSTAspline method could handle various types of backgrounds in real Raman spectra. Moreover, the proposed DSTAspline method was used to correct the baseline of the peanut oil samples adulterated with rapeseed oil, and the excellent results have proven that the DSTAspline method can improve the prediction accuracy. The DSTAspline algorithm which was applied in the MATLAB platform and the related data have been made publicly available, free to use for anyone at https: ∥github.com/skyworth0103.
Jan. 01, 1900Vol. 49 Issue 18 1811001 (2022)
Xiaoyu Chen, Yaxin Du, Yaru Liu, and Deming Kong
ObjectiveRecently, overexploitation of oil resources has become a major problem, attracting extensive attention. Thus, alternative new fuels are needed to alleviate the problem. Biodiesel is usually mixed with diesel as an alternative to diesel because of its similar properties and excellent environmental benefits, thereby reducing the actual consumption of diesel. However, the proportion of diesel in mixed oil containing diesel and biodiesel greatly affects the power transformed. A low diesel proportion will cause problems, such as poor oil atomization, insufficient oil-gas mixing, insufficient engine pressure, and increased nitrogen dioxide emission. Although several countries have different specifications for the proportion of diesel in mixed fuel, the proportion of diesel should be more than 50%. Therefore, the rapid and effective identification of the proportion of diesel in the mixed oil of diesel and biodiesel is greatly significant for the qualitative detection of imported diesel.MethodsIn this paper, the peak pick-up method was used to detect the proportion of diesel in the mixed oil. Since there were many hydrocarbons in the mixed oil, the fluorescence spectrum of the sample was complex. Thus, selecting the appropriate fluorescence peak was difficult. The sample was projected directly on the two-dimensional plane using two-dimensional principal component analysis (2DPCA), and the first three principal components were selected to reconstruct the fluorescence spectrum. Observe that the reconstructed fluorescence spectrum retained the fluorescence peak with more principal component information. Using this peak intensity to predict the proportion of the diesel oil will greatly improve the prediction accuracy. However, no linear relationship between the retained fluorescence peak intensity and the proportion of diesel oil exists, thus, introducing a neural network for further analysis is necessary. Furthermore, we selected a generalized regression neural network (GRNN) to predict the proportion of diesel oil because of its advantages in dealing with nonlinear relationships. Additionally, three sparrows of the small slope approximation (SSA) method were used to search the parameters of the GRNN-spread, and the GRNN was established using the best spread to accurately detect the proportion of diesel in the mixed oil.Results and DiscussionsFor the oil mixture sample of diesel and biodiesel (Table 1), we divided the sample into test and training sets, respectively. It can be found from Fig. 1 that the fluorescence spectrum of the sample was complex, with more fluorescence peaks and less difference in fluorescence intensity; thus, accurately identifying fluorescence peaks containing more principal components was difficult. In the Fig. 1, the best fluorescence peak of diesel oil was at 450/480 nm and that of biodiesel was at 370/410 nm. With the decrease in diesel proportion, the fluorescence intensity at the best fluorescence peak position of diesel failed to satisfy the linear relationship with the proportion of diesel, as shown in Fig. 3. Furthermore, the fluorescence spectrum of biodiesel greatly affected that of diesel. It was impossible to simply extract the strongest fluorescence intensity and establish a neural network for prediction. The three-dimensional fluorescence spectrum of the sample was reconstructed using 2DPCA, as shown in Fig. 5. Since the remaining fluorescence peaks of the reconstructed fluorescence spectrum contain more principal components, selecting the spectral information with strong fluorescence intensity for prediction reduced the error. According to Fig. 4, the reconstructed emission spectrum of the sample matched the original diesel sample. Therefore, the strong part of the reconstructed fluorescence spectrum (9×6) was selected as the training set. The GRNN optimized using SSA was established to predict the test set and the prediction results are shown in Table 3. The results revealed that the prediction effect of the 2DPCA-SSA-GRNN model is good, with an average recovery of 98.39% and a mean square error of 0.90%, which is about 1/2 the mean square error predicted by SSA-GRNN alone.ConclusionsThe intelligent algorithm was used to optimize the neural network, which realized the quantitative analysis of substances. However, its accuracy was low considering the complex situation of the fluorescence spectrum. In this paper, we proposed 2DPCA to reconstruct the fluorescence spectrum of the sample. Our method retains the original fluorescence characteristics of the spectrum, simplifies the redundant information in the spectrum, improves the quantitative analysis results of diesel in mixed oil, and provides a new idea for the quantitative analysis of substances. With the progress in science and technology, more additives can be used to optimize the performance of substances, even with more complex spectra. 2DPCA can screen out the main fluorescence information in the spectrum and improve the peak picking method to analyze substances. In future work, 2DPCA can be combined with other spectral analysis methods to further improve the accuracy of fluorescence information extraction for serious spectral overlap and realize the quantitative and qualitative analysis of complex substances.
Jan. 01, 1900Vol. 49 Issue 18 1811002 (2022)
Weirong Yang, Yongqiang Pan, Huan Liu, Zhiqi Zheng, Dong Li, and Zelin Zhou
ObjectiveFor high-precision optical thin film devices, the scattering of optical surfaces has attracted widespread attention. When the beam enters the optical surface, the particles on the optical surface scatter the incident light and the scattered light deviates from the specular reflection direction, resulting in the loss of the effective optical signal of the system. Furthermore, when the scattered light reaches the detector surface through the optical system, it increases the stray light of the optical system, so that the influence of noise on the signal cannot be ignored and reduces the detection sensitivity of the optical system. In a high-energy laser system, even very weak light scattering influences the thermal absorption level and laser damage threshold of the film. In the reflective astronomical telescope system, the pollutants on the surface of optical elements reduce the optical performance of the devices and make the optical devices completely unusable.Presently, commonly used methods for reducing the scattering of particulate pollutants on the surface of optical elements mainly require keeping the optical surface clean and reducing pollutants on the optical surface. However, improper cleaning may fail to remove pollutants from the optical surface, damage the optical surface and increase additional light scattering. Furthermore, the material cost of pollution control for the environment where the optical elements are located is also huge. In the optical thin film evaporation process, the film particles are evaporated to the substrate surface together with the film molecules, and dot protrusions are formed on the substrate surface. This results in increasing scattering on the surface of the optical element. Here, the scattering of surface particles cannot be eliminated by cleaning and environmental maintenance. From the thin film vector scattering theory, this paper reduces the scattering amount of particulate pollutants on the optical surface by optimizing the film design, which does not require keeping the optical surface clean and can effectively reduce the frequency of optical surface cleaning to maintain the optical performance of the optical surface.MethodsThis study is based on the vector scattering theory. First, we theoretically calculate the electric field intensity at the center of the spherical particle on the surface of SiO2 film with different thicknesses on Al film surface. Second, we obtain the SiO2 film thickness corresponding to the minimum value of electric field intensity at the spherical particle center and set it as the optimized thickness of the SiO2 film protective layer. Then, the bidirectional reflection distribution function and total scattering loss of spherical particulate pollutants on the Al film surface without a protective layer and with an optimized SiO2 film protective layer are analyzed. Next, we compare the scattering amount of spherical particle pollutants on the surface of aluminum film without a designed protective layer and with an optimized SiO2 protective layer. Finally, we conduct experiments to verify the effectiveness of this method.Results and DiscussionsTo reduce the optical scattering of particulate pollutants on the surface of metal with highly reflective films, first, we analyze the electric field intensity at the center of spherical particulate pollutants on the surface of SiO2 protective film with different thicknesses on the surface of the metal aluminum film (Fig. 3). Next, we take the physical thickness (125 nm) of the SiO2 film corresponding to the minimum value of electric field intensity as the optimized thickness of SiO2 film. Then, we theoretically calculate the bidirectional reflection distribution function (BR) of the aluminum film coated with the optimized SiO2 protective film when the beam is normally incident (Fig. 4). The results show that in the scattering angle of -90°-90°, the pollutant scattering on the surface of the optimized coating is effectively reduced, and BR×cos θs in the reflected light direction without and with the optimized coating is 0.00855 and 0.00048, respectively, where θs is the scattering angle. Furthermore, the total scattering losses of pollutants on the surfaces of the original and optimized membrane systems are calculated as 0.018609 and 6.09264×10⁻⁴ (Fig. 5), respectively, and the total scattering of particles on the surface of the optimized membrane system is reduced by 96.73%. Finally, four coatings are prepared experimentally, and the scatterings of pollutants on the surfaces of the four coatings are measured under the same pollution conditions. The results also confirm the effectiveness of the optimized SiO2 film protection layer in reducing the scattering of particulate pollutants (Fig. 7).ConclusionsThe conclusions drawn from this paper are as follows. 1) The electric field intensity of particulate pollutants can be changed by changing the thickness of the SiO2 film protective layer on the surface of the metal Al film. Compared with that without coating on the Al film surface, the square of the normalized electric field intensity at the center of the particle is effectively reduced using the optimized thickness of the SiO2 film protective layer. 2) Taking the square of the normalized electric field intensity at the center of the spheroidal particle pollutant as the evaluation index and the physical thickness of SiO2 film corresponding to the minimum value of this index as the optimized thickness of SiO2 film, the light scattering of the pollutant with radius of 100 nm can be reduced significantly. 3) When plating a metal Al high reflector, the thickness of the SiO2 protective film is a physical quantity that cannot be ignored and is related to the scattering amount of the metal reflector surface. The appropriate thickness of the SiO2 protective film is greatly significant to reduce the surface scattering of metal mirrors, whereas improper thickness increases the surface scattering of metal mirrors.
Jan. 01, 1900Vol. 49 Issue 18 1803101 (2022)
© Copyright 2018-2021 | Chinese Laser Press.
All Rights Reserved 沪ICP备15018463号-20