


Please enter the answer below before you can view the full text.

Yubo Xue, Haisu Li, Yajing Liu, Lu Jie, Yu Zhang, Youchao Jiang, Guobin Ren, and Li Pei
ObjectiveWith the emerging social media age, mobile communications, and cloud computing, the ever-increasing consumer demand for network capacity has exploded, which has brought enormous challenges to optical fiber communication systems. To enhance data transmission and all-optical network switching capabilities, an upgrade of the optical fiber is imperative. Multiplexing technologies like wavelength-division multiplexing and time-division multiplexing are currently being employed to expand the capacity of traditional single-mode fiber (SMF) based optic-transmission systems. However, the SMF has merged all degrees of freedom of light (including amplitude, phase, frequency, and polarization), achieving the nonlinear Shannon limit’s maximal capacity. To solve the capacity barrier, space-division multiplexing (SDM) transmission has been studied in the recent decade. SDM technology has two efficient solutions: multicore fiber (MCF) and few-mode fiber (FMF). The MCF integrates numerous independent cores into a single fiber for parallel transmission and the multicore design increases manufacturing costs. Due to the intermode coupling, it is challenging to attain high core density. For FMF, each mode is a channel for independent signal transmission, which increases the single fiber’s transmission capacity. In particular, polarization-maintaining FMF supporting several orthogonally polarized modes with a large separation of effective indices would realize low-crosstalk high-capacity communications. In this study, we report an air hole-assisted polarization-maintaining FMF, where high birefringence is attained using air holes assisted structure. The numerical simulation results revealed that a low-index core fiber can realize 10 polarization-maintaining modes. In the future, the proposed fiber can find applications in large-capacity SDM communication technology.MethodsThe numerical model, i.e., the FMF’s cross-sectional structure, was established by exploiting COMSOL Multiphysics based on the complete vector finite element approach. The perfectly matched layer, which matched the fiber cladding’s wave impedance was placed to the periphery of the fiber to absorb electromagnetic waves at a boundary, simulating an infinite cladding size. In determining the size of the grid unit for a fiber cross-sectional structure’s discretization, comprehensive consideration of factors like solution accuracy, calculation time, and hardware conditions were required. To achieve accurate simulation results, the fiber cross-sectional area was divided into triangular mesh units with the maximum size of the mesh unit of one-fifth of the wavelength. Furthermore, Sellmeier’s dispersion formula was included in the numerical model to analyze the proposed fiber’s frequency-dependent performance, like, the dispersions over S, C, and L communication bands.Results and DiscussionsAn air hole-assisted FMF model was proposed (Fig.1), in which an elliptical air hole was inserted in the center of the elliptical ring core, and four circular air holes of various sizes were placed in the horizontal and vertical directions, respectively. When appropriate values for structure parameters (the size and position of circular air holes, the size and ellipticity of ring-core, and the size and ellipticity of elliptical air hole) are selected at 1550 nm, numerical simulations shows that 10 modes can be transmitted with effective refractive index differences between two adjacent modes up to 10-4, resulting in polarization-maintaining (Fig.3-Fig.10). Regarding the transmission performance in the S, C, and L communication bands (Fig.12), the dispersions for 10 modes range from 17.6 ps/(nm·km) to 51.3 ps/(nm·km), and the effective refractive index differences between 1520 nm and 1600 nm are no less than 10-4 (the bandwidth is 80 nm). Furthermore, compared with other fibers reported in relevant literatures (Table 1), the proposed fiber has a larger bandwidth and the same level of dispersion. Further simulations showed that the high refractive index core would inevitably lead to a significant increase in the core doping cost while having less influence on the effective refractive index differences in the low-order modes (Fig.13). Consequently, to balance the number of modes and the manufacturing cost, a low refractive index core is employed.ConclusionsIn this study, an air hole-assisted polarization-maintaining FMF was proposed. The influences of the size (d1,d2) and position (dx,dy) of circular air holes, the size (cx) and ellipticity (cx/cy) of ring-core, and the size (ax/cx) and ellipticity (ax/ay) of elliptical air holes on transmission performance were investigated exploiting numerical model. According to the simulation results, when d1=7 μm, d2=7.6 μm, dx=14.5 μm, dy=13 μm, cx=7.2 μm, cx/cy=1.4, ax/cx=0.36, ax/ay=1.4, the proposed FMF supports 10 mode transmission between 1520 nm and 1600 nm (the bandwidth is 80 nm), and the effective refractive index differences between two adjacent modes are greater than 10-4 to attain polarization-maintaining transmission. Meanwhile, the dispersions for 10 modes range from 17.6 ps/(nm·km) to 51.3 ps/(nm·km). The proposed FMF may find applications for large-capacity SDM communication technology in the future.
Jan. 01, 1900Vol. 49 Issue 17 1706001 (2022)
Download Type Electro-Optic Modulator with Reflective Wall Based on Photonic Crystal Nanowire Cavity
Wening Zhu, Heming Chen, Wenkai Xu, and Yuchen Hu
ObjectiveWith the development of optical interconnection and high-speed optical communication, electro-optic modulators have become a research hotspot. Silicon insulator materials have the advantages of compatibility with the complementary metal oxide semiconductor process, high integration, low power consumption and high temperature resistance. There are many electro-optical modulators based on silicon materials. Electro-optic modulators with high modulation rate, small size and easy integration have been studied. The study about electro-optic modulators is of great significance. Therefore, we design a electro-optic modulator with reflective wall based on one-dimensional photonic crystal nanowire cavity. It has a high extinction ratio, large modulation bandwidth and modulation rate. The device has a compact and simple structure and is easy to cascade other silicon photonic devices. The cascade of silicon photonic devices has huge application prospects in the development of integrated optical devices and high-speed and large-capacity communication systems.MethodsThis paper proposes a download type electro-optic modulator with reflective wall based on silicon-on-insulator (SOI) one-dimensional photonic crystal nanowire cavity. The main line waveguide, one-dimensional photonic crystal nanowire cavity and download type waveguide are used to form a download type structure with reflective wall. The duty cycle of the nanowire cavity decreases linearly from the center of the waveguide to the two ends, and the doping at both sides of the modulator is introduced to form PN junctions. The finite difference time domain( FDTD) model in the optical simulation software Lumerical is used for simulation analysis. According to the free carrier dispersion effect in the silicon material, when the modulation voltage applied at both ends of the electro-optic modulator changes, the dielectric constant of the nanowire cavity material also changes. The refractive index of the nanowire cavity produces a slight difference, so that the resonant frequency of the cavity changes, that is, the central wavelength of the electro-optic modulator shifts. That is, corresponding to the wavelength of 1550.01 nm, the addition or non-addition of the modulation voltage is equivalent to the "off" state or "on" state of the modulator.Results and DiscussionsBased on the SOI one-dimensional photonic crystal nanowire cavity (PCNC), an electro-optic modulator with reflective wall is proposed. The incident light is coupled into the one-dimensional photonic crystal nanowire cavity after passing through the main line waveguide, and then coupled again to output through the download type waveguide. The adjustments of the position and number of reflective circular holes in the main line waveguide and the download type waveguide are beneficial to improve the overall transmittance of the device. The nanowire cavity adopts a cylindrical tapered aperture, which makes the beam better confined in the cavity. At the same time, doping is introduced on both sides of the nanowire cavity to form a PN junction, and a low bias voltage is applied to adjust the resonant wavelength of the nanowire cavity, so as to realize the "on" and "off" modulation of the optical signal at the working wavelength. The 3D-FDTD is used to analyze the optical characteristics and electrical performance of the modulator. The results show that the electro-optic modulator can modulate the optical signal with the wavelength of 1550.01 nm, and the transmittance under the "off" and "on" states are 0.0037 and 96.34%, respectively (Fig.14). The modulation voltage is only 1.2 V, the insertion loss is 0.2 dB, the extinction ratio is 24 dB and the size is only 54 μm2. The modulation frequency is 8.7 GHz and the modulation bandwidth can reach 122 GHz, which show that the proposed device can be applied in integrated photonic devices and high-speed optical communications field. In addition, after comparing the performances of the photonic crystal electro-optic modulators (Table 1), one knows that the device proposed here has excellent performances.ConclusionsThis paper proposes a download type electro-optic modulator with reflective wall based on SOI one-dimensional photonic crystal nanowire cavity. The main line waveguide, download type waveguide and one-dimensional photonic crystal nanowire cavity are used to form a download type structure with reflective wall. The doping method is introduced to form PN junctions at both sides of the modulator. Under the action of the modulation voltage, the refractive index of the silicon in the nanowire cavity changes, which causes the migration of defect modes in the nanowire cavity, and the "on" and "off" state modulations of the electro-optic modulator are realized. The electro-optical modulation is simulated and analyzed by the 3D-FDTD model in the Lumerical commercial simulation software. The simulation results show that compared with other electro-optical modulators based on nanowire cavity, the proposed electro-optical modulator has higher extinction ratio, higher modulation bandwidth, higher modulation rate, compact and simple structure, and being easy to cascade other silicon photonic devices. The proposed electro-optical modulator has huge application potential in the development of integrated optical devices and high-speed and large-capacity communication systems.
Jan. 01, 1900Vol. 49 Issue 17 1706003 (2022)
Jia Shi, Aiping Huang, and Linwei Tao
ObjectiveAt present, underwater wireless optical communication (UWOC) is widely concerned in underwater communication because of its high transmission efficiency and excellent transmission capacity. For underwater acoustic communication, the transmission delay is large because of the limited bandwidth of sound wave in kilohertz frequency region. UWOC technology can achieve the data transmission rate of Gbit/s, while maintaining low transmission delay. In addition, UWOC can carry more data because of the shorter wavelength of light. However, light wave propagation in UWOC channel is affected by absorption, scattering and other factors. The absorption effect is irreversible, and the light energy is converted into other forms of energy, causing the signal to decay. In scattering, the direction in which each photon is emitted varies randomly, so that the energy captured by the receiver is reduced. In order to accurately evaluate the complex UWOC channel information, many scholars have studied the absorption, scattering and turbulence effects in different water areas and characterized these effects. This greatly improves the accuracy of UWOC channel modeling and channel estimation. However, due to the complexity of underwater environment, the channel state information estimated by traditional methods is usually not accurate enough and the recovered signals have high bit error rate (BER). Based on the above research, this paper designs a scheme of underwater optical communication channel estimation (CE) and signal detection (SD) aided by deep learning method.MethodsThis paper presents an end-to-end solution to the challenging CE and SD problems in UWOC systems using a deep neural network (DNN). Firstly, the scheme uses optical orthogonal frequency division multiplexing (OOFDM) system as the system model, and classical UWOC channel as the channel model. Then the DNN model is built according to the channel characteristics of UWOC and the DNN is trained off-line using the simulated data under different UWOC channels. The scheme combines CE and SD in UWOC system and uses DNN, and it can directly estimate and detect the transmitted signal. Finally, the performance of DNN scheme is compared with those of traditional methods including least squares (LS) and minimum mean square error (MMSE) in different water areas, and the influence of pilot number, cyclic prefix (CP) and transmission distance on the detection performance of DNN scheme in OOFDM system is discussed.Results and DiscussionsIn this paper, the following simulations are carried out to prove the performance of the proposed DNN method CE and SD scheme. The DNN model proposed is trained and tested using two types of water body data, and the BER performance of DNN under different signal-to-noise ratios (SNRs) is compared with those of traditional LS and MMSE estimation methods. When the number of pilots is 64, the BER performance of the proposed DNN method is better than that of the traditional LS method and comparable to that of the MMSE method. However, when the pilot number is reduced to 8, in order to improve the spectral efficiency, the performance of the MMSE method is significantly reduced, and the performance of DNN method is better than those of the two traditional methods (Fig. 5). In OOFDM system, CP is usually added to eliminate the inter-symbol interference, but it also increases the bandwidth and energy loss. In the following simulation, we remove CP and compare the performance of DNN method with traditional methods in different water areas. The simulation results show that the traditional LS and MMSE methods cannot evaluate the channel effectively any more, while the DNN method is still effective (Fig. 6). In the underwater environment, with the increase of the transmission distance, the energy loss of the optical signal is caused by the absorption and scattering effects. In order to characterize the performance of the DNN method at different transmission distances, the transmission distance is set to 12 m and 15 m respectively in simulation. When the transmission distance is 12 m, the performance of DNN method is much better than LS method but slightly worse than MMSE method. When the transmission distance is 15 m, the DNN method outperforms the MMSE method (Fig. 7). It is shown that DNN-based CE and SD scheme has high research value in long-distance UWOC.ConclusionsIn this paper, a CE and SD scheme of OOFDM system based on DNN is designed for UWOC system. After the DNN model is trained off-line under several classic water types, it can be deployed in OOFDM system to estimate and restore the received signal. Simulation results show that the DNN method presented in this paper performs well in CE and SD under different UWOC channels. In addition, DNN method has advantages in detection accuracy, and it is also more robust in comparison with traditional LS and MMSE methods. The DNN model is proven powerful in dealing with CE and SD in UOWC system. The proposed method is a new approach to studying CE and SD in UWOC, and its feasibility is verified by simulation.
Jan. 01, 1900Vol. 49 Issue 17 1706004 (2022)
Nanqi Chang, Xiaodi Huang, and Haibin Wang
ObjectiveHigh sensitivity, large dynamic range, and anti-electromagnetism interference are advantages of interferometric fiber-optic hydrophones. In the fields of marine resources exploration and seabed geological exploration, it has a good application potential. Phase generated carrier (PGC) modulation and demodulation technology have the advantages of high sensitivity, easy multiplexing, and good linearity. Interferometric optical fiber hydrophones commonly employ this signal detection technology. PGC demodulation approach includes internal and external modulation. PGC demodulation results can be affected by laser intensity modulation and laser phase excursion caused by directly modulating laser, fluctuations in direct-current laser intensity, alternating-current laser intensity, phase modulation depth, and phase delay due to laser transmission delay, circuit transmission delay, etc. Several viable approaches to eliminating these factors’ influence have been researched by numerous previous studies. However, most of them only focus on some of the abovementioned nonlinear factors and one case of PGC internal or external modulation. We hope to propose an approach to eliminate the effects of the abovementioned nonlinear factors. Furthermore, we hope that this approach can be employed in both PGC internal and external modulations.MethodsTo eliminate these effects, a PGC demodulation approach based on extended Kalman filter parameter estimation (PGC-EKF) is proposed in this study. The traditional PGC demodulation process is modified in this study using the characteristics of the PGC demodulation model that considers the influence of nonlinear factors. In the modified PGC demodulation process, the PGC demodulation problem can be transformed into the estimation of four demodulation model parameters D, Ex/Ey,sin(θx-θy) and cos(θx-θy). In this study, an ellipse fitting algorithm based on an extended Kalman particle filter is introduced to estimate the model’s parameters. An ellipse fitting algorithm can be employed to map the four demodulation model parameters into five elliptic equation coefficients a, b, c, d, and e to obtain the four demodulation model parameters. Furthermore, the EKF algorithm is employed to estimate the elliptic equation coefficients. After obtaining the five elliptic equation coefficients, we use the undetermined coefficient approach to obtain the mapping from the five elliptic equation coefficients a, b, c, d, and e to the four demodulation model parameters D, Ex/Ey,sin(θx-θy) and cos(θx-θy). The existing relational expression between the coefficients of the general equation of an ellipse and the parameters in its corresponding parameter equation is simplified using the undetermined coefficient approach, the incorrect part of the existing derivation results is corrected, and further derivation is performed in combination with the model’s characteristics used in this study. After obtaining the demodulation model parameters, the acoustic signal to be measured can be obtained using the PGC arctangent (PGC-Atan) approach.Results and DiscussionsThe simulation experiment is conducted under the conditions that the acoustic signal’s frequency to be measured is 500 Hz, the sampling frequency is 250 kHz, and the carrier frequency is 25 kHz. The simulation experimental results show that the EKF-based ellipse fitting estimation algorithm fits the estimation result curves of the four demodulation model parameters well with the actual values set in the simulation and can track the fluctuations of the four demodulation model parameters well (Fig. 4). The relative estimation errors of estimation results of four types of demodulation model parameters D, Ex/Ey,sin(θx-θy) and cos(θx-θy) are 0.07%, 0.39%, 0.59%, and 0.28%, respectively (Table 2). The mean square errors of the estimation results of four types of demodulation model parameters D, Ex/Ey,sin(θx-θy), and cos(θx-θy) are 1.00×10⁻¹⁰, 3.80×10⁻⁹, 5.70×10⁻¹⁰, and 2.69×10⁻¹⁰ (Table 2). The experiment is conducted under the conditions that the laser’s center wavelength is 1550 nm, the linewidth is 1.9 kHz, the output power is 15 mW, the acoustic signal’s frequency to be measured is 100 Hz, the sampling frequency is 500 kHz, and the carrier frequency is 31.25 kHz. The experimental findings are as follows: the signal demodulated directly according to the traditional PGC-Atan approach has significant waveform distortion and AC interference, which is reflected in the spectral lines of low-frequency and high-order harmonic components with high intensity in its frequency spectrum (Fig. 10). The waveform distortion and AC interference in the time domain are suppressed in the PGC-EKF approach’s demodulation results proposed in this study, and the intensity of the low-frequency component and high-order harmonic component in the corresponding frequency spectrum is considerably reduced (Fig. 12). In the PGC-Atan approach, the signal-to-noise ratio (SNR), total harmonic distortion (THD), and signal-to-noise and distortion (SINAD) of the demodulation results are 21.29 dB, -9.56 dB, and 9.28 dB, respectively (Table 4). Additionally, in the PGC-EKF approach, the SNR, THD, and SINAD of the demodulation results are 30.13 dB, -28.81 dB, and 26.44 dB, respectively (Table 4). The SNR, THD, and SINAD of the PGC-EKF approach’s demodulation results are better than those of the PGC-Atan approach.ConclusionsIn this study, the traditional PGC demodulation process is modified to eliminate the effects of laser intensity modulation, laser phase excursion, fluctuations in DC laser intensity, AC laser intensity, phase modulation depth, and phase delay on PGC demodulation results. An ellipse fitting algorithm based on EKF parameter estimation is applied to the modified demodulation model, and a PGC demodulation approach based on EKF parameter estimation is proposed in this study, which can be used for both PGC internal and external modulations. The existing relational expression between the coefficients of the general equation of an ellipse and the parameters in its corresponding parameter equation is simplified, the incorrect part of the existing derivation results is corrected, and further derivation is performed in combination with the model’s characteristics employed in this study. The experimental results show that the PGC-EKF approach proposed in this study improves the demodulation results’ SNR by 8.84 dB, reduces the THD by 19.25 dB, enhances the SINAD by 17.16 dB, and significantly improves the system performance compared with the traditional PGC-Atan demodulation approach. This demonstrates that the PGC-EKF can efficiently demodulate the signal to be measured, suppress the AC interference and waveform distortion of the demodulated signal caused by the abovementioned nonlinear factors, and eliminate the low-frequency and high-order harmonic components in the demodulated signal frequency spectrum.
Jan. 01, 1900Vol. 49 Issue 17 1709001 (2022)
Zifen He, Guangchen Chen, Junsong Chen, and Yinhui Zhang
ObjectivePoor lighting conditions lead to a high accident rate during night driving. In order to reduce the incidence of night traffic accidents, various auxiliary driving technologies such as ultrasonic ranging, millimeter wave radar and visual auxiliary driving are widely used. Infrared thermal imaging technology based on the thermal radiation of object and reflection imaging with certain penetrability is less affected by the weather and light conditions at night. Human targets within the vision field can be accurately captured by infrared thermal imaging technology, which is convenient for pedestrian detection. In addition, the cost of infrared imaging equipment has been decreased in recent years, making it possible to be mounted on vehicles. Therefore, the fusion of infrared thermal imaging technology and pedestrian target detection algorithm based on deep learning is of great research significance and with a broad market application prospective in vehicle auxiliary driving. In this paper, a pedestrian detection model based on night infrared image is proposed for night driving, which can detect pedestrians on the night road in real time. This study can be applied to the field of auxiliary driving for early warning and active braking provided to drivers, reducing the probability of night driving accidents and providing higher security for vehicles and pedestrians.MethodsAiming at the problems of low accuracy in infrared pedestrian detection for small targets at night, large committed memory of network model, and the difficulty of real-time detection in auxiliary driving due to the low model detection speed, a lightweight pedestrian detection neural network called YOLO-Person is proposed for night infrared images. Firstly, the MobileNetV3 lightweight network is used as the backbone network, while the multi-scale fusion target detection layer is used as the prediction module to solve the problem of large model size and slow inference speed, which greatly reduces the amount of model calculation and obtains a preliminary lightweight network model. Furthermore, by adding the spatial pyramid pooling module and the detection layer with smaller receptive field in the network, the representation ability is enhanced to solve the problem of unbalanced pedestrian target scale in the dataset and improve the infrared pedestrian detection accuracy. Finally, channel pruning is used to reduce the number of channels in the feature map, and the final network model YOLO-Person is obtained. The lightweight model YOLO-Person is verified on the pedestrian dataset of night infrared images based on Jetson Nano mobile development platform.Results and DiscussionsA lightweight model YOLO-Person is proposed for night infrared pedestrian detection (Fig. 1). Firstly, MobileNetV3 lightweight network is used as the backbone network, and the multi-scale fusion detection layer is used as the prediction module. Although the accuracy is reduced by 1.2%, the speed is increased by 34 frame/s, and the model size is reduced by 151 MB (Table 1), which indicates that the lightweight of the night infrared pedestrian detection model is preliminarily realized. Secondly, aiming at the problem of unbalanced pedestrian target scale in dataset, spatial pyramid pooling module (Fig. 2) and small receptive field detection layer are added in the network, through which the accuracy is improved by 3.3%, the speed is reduced by 23 frame/s, and the model size is increased by 5.1 MB (Table 2). Moreover, the model is pruned (Fig. 3) to reduce a large number of redundant channels (Fig. 6). When the pruning rate is 95%, the number of model channels, accuracy and model size achieve balance and optimization (Table 3). In addition, the model is fine-tuned to obtain the final lightweight model YOLO-Person, which reaches the accuracy of 92.2%, the speed of 69 frame/s, and the model size of 11.7 MB (Table 4). Finally, the model is deployed on the Jetson Nano mobile development platform to verify the detection effect (Fig. 7), and the test results of three networks are compared. The lightweight model YOLO-Person gets the best results: the accuracy of 92.2%, the speed of 12 frame/s, and the model size of 11.7 MB (Table 5).ConclusionsA lightweight model YOLO-Person for night infrared pedestrian detection is proposed in this paper. Firstly, MobileNetV3 lightweight network is used as the backbone network, and the multi-scale fusion detection layer is used as the prediction module to achieve the preliminary model lightweight. Secondly, spatial pyramid pooling module and small receptive field detection layer are added to improve the detection accuracy of small targets. Finally, the model parameters are greatly reduced through channel pruning, and the final lightweight model YOLO-Person is obtained. The experimental results show that the detection accuracy and speed of YOLO-Person model reach 92.2% and 69 frame/s, respectively, meeting the requirements of real-time pedestrian detection. The YOLO-Person network model is deployed on the Jetson Nano mobile development platform, where the detection speed of 12 frame/s exceeds that of YOLOv3 and approaches that of YOLOv3-tiny, which further verifies the superiority of the proposed method. By optimizing the network structure and increasing the effective functional network layer, the detection accuracy of the model will be further improved in the future research.
Jan. 01, 1900Vol. 49 Issue 17 1709002 (2022)
Zhenyu Jiang, Jinxia Feng, Jingke Sun, Yuanji Li, and Kuanshou Zhang
ObjectiveAn important resource for realizing long-distance quantum communication is the 1560 nm nonclassical state light field because it produces a low loss window for optical fiber transmission. The most effective method to generate a 1560 nm nonclassical state light field is to pump an optical parametric amplifier using a 780 nm laser. Additionally, 780 nm lasers correspond to the D2 line of 87Rb used in scientific fields, such as atomic cooling, frequency standard, and quantum storage. Therefore, methods for obtaining a highly efficient and stable 780-nm laser have become a widespread concern. With the rapid development of quasi-phase-matching technology, the high-efficiency frequency conversion of multiple lasers with different wavelengths is realized using the external cavity resonance frequency doubling technology based on periodic polarization nonlinear crystal. The external cavity-resonant frequency doubler with a high efficiency based on customized high-quality frequency doubling cavity mirrors and low loss periodically poled potassium titanyl phosphate (PPKTP) crystals are used. However, the PPKTP crystal relies heavily on imports, which restricts the development of native relevant technologies, thereby making it difficult to realize large-scale industrial applications. A periodically poled lithium niobate (PPLN) crystal has a highly effective nonlinear coefficient, especially because manufacturing PPLN crystal is relatively easy. Many native companies can produce high-quality PPLN crystals. However, PPLN crystals need to operate above 90 ℃ to avoid photorefractive damage effects, which inconvenience practical application. MgO-doped PPLN (MgO∶PPLN) crystals have the same nonlinear coefficient as PPLN, but can greatly improve the photorefractive damage threshold. To develop a practical external cavity-resonant frequency doubler using the MgO∶PPLN crystal, studying the external cavity-resonant frequency doubling process systematically using domestic MgO∶PPLN crystal and cavity mirror is necessary.MethodsFirst, we theoretically analyze the frequency doubling efficiency of external cavity using the MgO∶PPLN crystal with different lengths, which is affected by the mode-matching efficiency of the frequency doubling cavity caused by the change of the periodically polarized tolerance, crystal absorption loss, and crystal thermal lens effect. For a definite fundamental wavelength and polarization period of the nonlinear crystal, the phase matching of a nonlinear crystal and the highly efficient frequency doubling conversion can be realized by accurately adjusting the crystal temperature. However, the polarization period of the nonlinear crystal deviates due to the polarization processing technology, leading to phase mismatch and reducing the efficiency of the frequency doubling conversion. Additionally, due to the increase of the cavity power, the thermal lens effect intensifies and the waist of the cavity mode changes, whereas the size of the waist of the fundamental light does not change. This results in the reduction of the mode-matching efficiency and the efficiency of the frequency doubling. Then, an external cavity-resonant frequency doubler composed of the domestic MgO∶PPLN crystal and cavity mirror is built experimentally (Fig. 1). The frequency doubling cavity is composed of the MgO∶PPLN crystal and two flat-concave mirrors. Next, the MgO∶PPLN crystal with a polarization period of 19.6 μm is temperature-controlled using an oven and a temperature controller. The length of the frequency doubling cavity is locked using the PDH(Pound-Drever-Hall) technique. Then we experimentally measure the frequency doubling conversion efficiency and output characteristics of the resonant frequency doubling using MgO∶PPLN crystals with different lengths. By optimizing the length of MgO∶PPLN crystal, we obtain the optimal resonant frequency doubling output. Finally, based on the optimal cavity parameters obtained from the experiment, we design a miniaturized external cavity-resonant frequency doubler with a size of 9 cm×6 cm×7 cm.Results and DiscussionsWhen the fundamental frequency optical injection power is 100 mW, the single-pass frequency doubling efficiency of MgO∶PPLN crystals with different lengths are measured (Fig. 3). Short crystal lengths produce large polarization period tolerance. Notably, the effect of the polarization period tolerance on the efficiency is limited. The efficiency increases with the increase of crystal length. However, large crystal lengths produce a sharp decline in the efficiency of the single-pass frequency doubling due to the polarization period tolerance. When the fundamental frequency optical injection power is 1 W, the efficiency of the external cavity-resonant frequency doubling of MgO∶PPLN crystals with different lengths are measured (Fig. 4). When the crystal length is short, the fundamental frequency light loss in the inner cavity is small, and the efficiency increases with the increase in crystal length. However, when the crystal length is large, the polarization period tolerance decreases, and the absorption loss of the crystal increases, thereby reducing the efficiency. In the theoretical calculation, the polarization period error is set to 3 nm. The theoretical calculation is consistent with the experimental value. Furthermore, the optimal crystal length with the best resonant frequency doubling efficiency of 85% is 18 mm. For a crystal length of 10 mm, the corresponding frequency doubling cavity length is 59 mm, and the temperature of the MgO∶PPLN crystal is controlled to be 53.45 ℃. The variation curve of the frequency doubling efficiency with the injected fundamental frequency optical power is measured (Fig. 5). With the increase in fundamental optical power, the frequency doubling efficiency of the external cavity increases and tends to saturation. When the injected fundamental optical power is 1.7 W, we obtain the highest efficiency of 84.1%. The stability of the output power of the miniaturized resonant frequency doubler for 3 h is measured (Fig. 6); when the output power is 1.64 W, the power fluctuation is ±0.17%.ConclusionsIn this paper, we design a 1560 nm laser external cavity resonant frequency doubler using MgO∶PPLN crystals. Based on the theoretical analysis of the influence of the mode-matching efficiency change of frequency doubling cavity caused by the change of polarization period tolerance, the absorption loss, and thermal lens effect of MgO∶PPLN crystals with different lengths on the external cavity resonant frequency doubling efficiency , we experimentally build an external cavity resonant frequency doubler composed of domestic MgO∶PPLN crystal and cavity mirrors. The effects of MgO∶PPLN crystals with different lengths on the frequency doubling efficiency are experimentally studied. Furthermore, we design a miniaturized external cavity resonant frequency doubler. The results show that when the temperature of the MgO∶PPLN crystal is controlled to be 53.45 ℃ and the injected 1560 nm fundamental frequency light power is 1.7 W, the optimal resonant frequency doubling efficiency is 84.1% using a 10 mm MgO∶PPLN crystal and the output power stability of the frequency-doubled laser is better than ±0.17% in 3 h. The miniaturized external cavity resonant frequency doubler with stable output at 780 nm can be used to prepare a 1560 nm nonclassical light field and to research the quantum storage based on rubidium atoms, which promotes the industrialization of quantum technology.
Jan. 01, 1900Vol. 49 Issue 17 1701001 (2022)
Nanyu Chen, Xiaolong Chen, Wansheng Liu, Yibo Liu, He Wang, Bing He, and Jun Zhou
ObjectiveThe laser power requirement is becoming higher and higher in the industrial and medical fields. It is an effective way to improve the output power of the 1018 nm fiber laser using the tandem-pumped technology. Compared with the conventional direct pumping technology for the 976 nm semiconductor laser, this technology has the advantages of high brightness and low quantum loss, resulting in the high output of pump power and the low influence of thermal effect from fiber and device. However, the main difficulty in the 1018 nm fiber laser is that the absorption cross-section of Yb3+ at 1018 nm is larger than that at a longer wavelength. This leads to fierce competition between lasing at 1018 nm and amplified spontaneous emission (ASE) at 1030 nm. Based on the continuous wave rate equation model, the effects of gain fiber length, output grating reflectivity, and bandwidth on the output characteristics of a 1018 nm laser are analyzed. We hope that the methods and results of our research can be helpful to the design of stable and efficient tandem-pumped sources.MethodsIn this paper, first, we divide the ASE spectrum into the K equally spaced regions based on the rate equation model of a laser. The central wavelength of each region is λi,and the bandwidth is Δλi,where i =1, 2, 3, …, K. A rate equation model with an ASE term is established for a continuous wave. Second, the above model is used to simulate the output powers and output spectra of the laser under different pumping modes, and the appropriate pumping mode is selected. Third, the output characteristics of the output couplers with different reflectivity and bandwidths are simulated to screen out the appropriate range of reflectivity and bandwidth for the output coupler. Fourth, the effect of gain fiber length on the output characteristics of the laser is quantitatively described. According to the results of numerical simulation, we optimize the parameters of the laser system and conduct the experiments. Finally, the experimental results are compared with the simulated results, and an efficient and stable laser scheme is founded.Results and DiscussionsAccording to the physical model established above, it is found by calculation that the output power under forward pump is 2.1% higher than that under backward pump when the total pump power is the same [Fig. 2(a)]. Therefore, the forward pump is more reasonable. When we adopt forward pump and use a 3 m gain fiber, only the reflectivity and bandwidth of the output coupler are changed. The results of numerical simulation are shown in Fig. 3(a). The bandwidth range of the output coupler is 0.2-1.0 nm, and the reflectivity is 0.05-0.15, which are a reasonable choice for the laser. We increase the ytterbium doped fiber (YDF) length from 3.0 m to 4.0 m, and the laser output power grows slowly [Fig. 4 (a)]. At the same time, the power proportion of the 1018 nm laser in the output power decreases, while the power proportion of ASE increases rapidly from 0.2% to 7.5%. Finally, we use a 2.7 m 30 μm/250 μm double-clad Yb3+ fiber with an output grating reflectivity of 9.5% and a 3 dB bandwidth of 1 nm. A 447 W 1018 nm laser output with a central wavelength of 1018.38 nm and a 3 dB bandwidth of 0.19 nm is achieved with a 531 W pump input. The maximum optical to optical efficiency is 84.2% and the slope efficiency is 82.8%. The beam quality factor (M2) indicating beam quality is 1.85[Fig. 5(c)].ConclusionsIn this paper, a 1018 nm high power fiber laser is reported. Based on the continuous wave rate equation model, the influence of gain fiber length on the output characteristics of the 1018 nm laser is analyzed. It is found that when the gain fiber length reaches 4 m or more, the power of ASE is up to 40 W and accounts for 7.5% of the total output power. Therefore, in order to suppress the strong ASE, a 2.7 m gain fiber is used after theoretical calculation and experimental optimization. Meanwhile, as the absorption peak of Yb3+ at 976 nm is very narrow, a wave-locked semiconductor pump source is used to maximize the absorption of pump light. The maximum power output of 520 W is obtained. It has the maximum optical to optical efficiency of 84.2% at 447 W. To our knowledge, it is one of the highest efficiencies for the 1018 nm fiber laser oscillators with a core diameter larger than 30 μm. In order to make the laser stable, the structure of the laser is further optimized. The pump source with less power fluctuation and the water cooler with high stability are used. In addition, the laser operation at 21 ℃ is kept. The power instability is 0.7% at 520 W, which indicates that it can be used as a reliable pump source for tandem pumping of high power fiber lasers.
Jan. 01, 1900Vol. 49 Issue 17 1701002 (2022)
Shiwei Lv, Zhanda Zhu, Dapeng Liu, Yongling Hui, Hong Lei, and Qiang Li
ObjectiveLaser diode (LD)-pumped neodymium-doped yttrium aluminum garnet (Nd∶YAG) Q-switched laser has the advantages of small volume, lightweight, long service life, and high conversion efficiency. It is widely used in material processing, lidar, and laser ranging. Recently, the development of laser technology has necessitated an increase in the efficiency and output energy of Nd∶YAG Q-switched laser. Presently, the output optical-to-optical conversion efficiency of LD-pumped Nd∶YAG electro-optical Q-switched laser has been maintained at ~20%. Improving the optical-to-optical conversion efficiency of the laser can effectively reduce the volume and weight of the laser under the same energy output conditions. Various approaches to improve the optical-to-optical conversion efficiency have been reported. One way is to enhance the pump energy absorption. Another way is to reduce energy loss by suppressing amplified spontaneous emission (ASE) and parasitic oscillation to enhance the output optical-to-optical conversion efficiency of Q-switched laser. In this study, we propose a high-efficiency LD corner-side-pumped Nd∶YAG electro-optical Q-switched laser using a composite slab laser crystal. By improving the pump light absorption efficiency and suppressing ASE, we improve the output optical-to-optical conversion efficiency of the Nd∶YAG electro-optical Q-switched laser. We hope that our research can be helpful in improving the output energy and efficiency of Q-switched solid-state lasers.MethodsThis study is based on a composite slab laser crystal. First, the gain medium is a Nd∶YAG crystal with atomic fraction of 0.1% and cross section size of 4 mm×4 mm. Four pieces of Sm: YAG crystals with atomic fraction of 3% and thickness of 1 mm are thermally bonded around the side surfaces of the Nd∶YAG crystal to inhibit ASE and parasitic oscillation. Next, undoped YAG bulk crystals are sequentially bonded to the Sm: YAG crystal. Then, we determin the size of the composite slab laser crystal. Note that using an improved corner-side hybrid pump structure achieves a high absorption efficiency for the pump light by crossing through the active media Nd∶YAG 13 times. Next, from the ray-tracing method, we analyse the absorption efficiency and pump uniformity of the pump light using the non-sequential mode of ZEMAX simulation software. The electro-optical Q-switched system is used to study the output of the Q-switching experiment. Furthermore, the variation between free output and Q-switched output energy versus input current is studied. The optical-to-optical conversion efficiency of Q-switched output at different input currents and the dynamic-to-static ratio at the highest output efficiency are calculated. Finally, the pulse width, beam quality, and far-field spot of the laser are measured.Results and DiscussionsThe free-running and Q-switched pulse outputs of the laser are measured when the pump pulse width is 230 μs and the repetition rate is 5 Hz. When the pump current is 180 A, the laser operates freely and obtains the maximum output single pulse energy of 124 mJ. With the increase in pump current, the output optical-to-optical conversion efficiency of the Q-switched pulse laser increases and then decreases. At the pump current of 170 A, we obtain the highest optical-to-optical efficiency which is 30.1%. Furthermore, the dynamic-to-static ratio is as high as 94.64% (Fig. 4). We detect the Q-switched pulse waveform using a photodetector at an output energy of 106 mJ and the detected pulse width is 15 ns [Fig. 5 (a)]. Additionally, we use a wedge prism to sample the output laser beam with repetition rate of 5 Hz and a single pulse energy of 106 mJ, and the output beam is focused by a lens with a focal length of 150 mm. Also, a charge-coupled device beam analyzer is used to measure the beam quality factor. After the measurement, the beam quality factors of Mx2=4.43 and My2=4.79 are obtained [Fig. 5 (b)].ConclusionsIn this paper, we investigate and experimentally design an LD corner-side-pumped Nd∶YAG electro-optical Q-switched laser, and we realize a high-efficiency 1064 nm pulse laser output. The use of a novel corner-side hybrid pump structure gives high absorption efficiency of pump light. Furthermore, four pieces of Sm: YAG crystals are bounded around the active medium Nd∶YAG to suppress parasitic oscillation and effectively reduce ASE. Finally, we obtain a single pulse energy of 106 mJ and pulse width of 15 ns in the Q-switching mode under conditions of a pulse repetition rate of 5 Hz and a pump width of 230 μs. Also, the optical-to-optical conversion efficiency is 30.1% and the dynamic-to-static ratio is 94.64%. The experimental results show that the composite slab laser crystal structure realizes high-efficiency absorption of pump light and effectively suppresses ASE and parasitic oscillation. Thus, our proposed method provides an effective method for high-efficiency 1064 nm Q-switched pulse laser output.
Jan. 01, 1900Vol. 49 Issue 17 1701004 (2022)
Bing Han, Ginman Ge, Xinyi Ren, Xiaojun Li, jia Liu, Ming Yan, and Heping Zeng
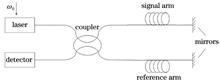
ObjectiveMicrowave and terahertz (THz) devices, such as antennas and reflectors, are useful in communication, navigation, and remote sensing. The laser tracking and measuring technology plays an important role in characterizing microwave/THz devices, such as surface measuring. Laser tracking and measuring, which is based on laser interferometry, provides high spatial resolution and accuracy for precise surface topography measurements. However, it has limitations such as a limited dynamic range, a low update rate, and difficulty measuring absolute distance. A coherent light source with significantly advanced laser sensing and ranging is provided by an optical frequency comb, which is made up of a large number of equally spaced optical frequency lines (or comb teeth). Dual-comb-ranging interferometry, which uses two asynchronous optical combs to measure absolute distance, provides high precision, large ambiguity range, and high speed. This method, which does not use moving mirrors, demonstrates significant advantages in laser ranging and holographic imaging. The measurement process, however, can be time-consuming due to a camera’s limited frame read-out speed. As a result, the benefits of dual-comb technology have not been fully exploited in imaging applications. Furthermore, dual-comb interferometry is yet to be used to characterize THz devices. In this paper, the dual-comb technique, combined with high-speed two-dimensional scanning mirrors, is applied to the surface measuring of THz devices. The measurement time per pixel for a three-dimensional (3D) image with 2.5×105 pixel is about 8 μs. The longitudinal measurement error is 1.3 μm (reduced to 5 nm at 0.1 s integration time), and the ambiguity range can reach 300 m. The experimental results show that dual-comb imaging is a useful and reliable tool for measuring the surface of microwave/THz devices with high precision.MethodsTwo near-infrared electro-optic combs (EOC 1 and EOC 2) are used for constructing a dual-comb interferometer (Fig. 1). Each EOC contains a Fabry-Perot phase modulator driven by a radio frequency (RF) signal generator. The repetition frequencies of the two combs are set to fr1=25 GHz and fr2=fr1+ Δf=25 GHz+ 0.5 MHz. Thus, the frequency of the nth comb line of the two combs can be expressed as fcw+ n·fr1 and fcw+ n·fr2,respectively, where fr2=fr1+ Δf, fcw is the repetition rate of the continuous laser, and n is an integer, ranging from -N to N. Here, 2N+ 1 are the total number of comb lines for a single comb. The spectral coverage of the two combs is similar, spanning from 1542 nm to 1568 nm at -20 dB (Fig.1), corresponding to 3.22 THz in spectrum width and 129 comb lines. The EOC 1 has an output power of 11 mW, while the EOC 2 has a power of 2.7 mW. The detection light is sent to a high-speed scanning galvanometer (GM) after passing through a fiber optic circulator (Cir) and a collimator (Col), and then hits the surface of a sample (S) that is placed on a 3D translation platform for adjusting the longitudinal (z-axis) displacement and expanding the imaging view. The reflected light propagates along the original beam path and then combines the local oscillator light (EOC 2) with a 50/50 fiber beam splitter (BS). The common-mode noise is then suppressed using the balanced photo-detector (BPD 1, bandwidth of 1.6 GHz). A data acquisition card (DAC) records the detection signal at a sample rate of 2.5×10⁸ Sample/s. Note that, to avoid frequency aliasing in dual-comb measurement, an acoustic-optical modulator (AOM) is used to introduce a frequency offset at fAOM( 40 MHz) to the local comb (EOC 2). Thus, the beat frequency signal in the RF domain can be expressed as fAOM+ n·Δf. It should also be noted that the optical fibers of the reference and measuring arms have similar lengths when placed in the same environment to minimize the fluctuation introduced by the fibers.Results and DiscussionsAn ellipsoidal THz reflector’s imaging results (sample 1) are shown (Fig. 7). The sample projection plane has a diameter of 100 mm and a depth of 6 mm. The mean signal-to-noise ratio of each pixel is about 2000±400, and the measurement error in the z-axis direction is about 1.3 m, depending on the smoothness and shape of the sample surface (Fig. 7). We perform 3D surface fitting based on the data and the results (Fig. 7) show that the sample surface flatness is 34.78 μm with a fitting error of 19.84 μm2.Another sample, a planar THz antenna (sample 2), with a diameter of 80 mm and a concave pit in the center with a diameter of 20 mm and a depth of 0.3 mm, is measured (Fig. 8). A flat area of the surface is fitted, yielding the line smoothness of 11.2 μm, the plane flatness of 5.85 μm, and the fitting error of 0.02 μm2 (Fig. 8), which are consistent with the results obtained by a contour measuring system, e.g., plane flatness of (7.1±2.0)μm. The uncertainty of a single-point measurement in the experiment is within ±10 nm (measurement time of 0.1 s), but the scanning motion of the galvanometer introduces additional fluctuations into the measurement, resulting in a measurement error of (1.3±0.2)μm (acquisition time of 8 μs) for 3D imaging. Nonetheless, the dual-comb method holds great promise for the surface measuring of microwave/THz devices due to its high data update rate (125 kHz) and micrometer-level precision.ConclusionsThe dual-comb time-of-flight method is used in this paper to measure the three-dimensional shapes of small aperture terahertz antennas and reflectors. The measurement time for a single pixel in the experiment is 8 μs, and the longitudinal measurement error is 1.3 μm. When compared to the traditional laser interferometry, the dual-comb method has the advantages of a large ambiguity range, high measurement accuracy, and a fast data update rate, making it promising for surface measurements of terahertz reflectors and microwave antennas.
Jan. 01, 1900Vol. 49 Issue 17 1704001 (2022)
Huanlong Liu, Dafa Li, Jianyi Zhou, and Tao Wei
ObjectiveBolster spring is usually installed in the inner space of the narrow bogie side frame. It is one of the important components of the vibration damping device of railway freight cars, and it requires regular repair. During the repair of the bolster spring, the inner and outer spring groups need to be removed from the side frame and reinstalled in their original positions after the repair. Presently, the bolster spring is disassembled by manually tilting and pulling out. The highly limited side frame space causes the bolster spring to easily collide with or possibly block the locating pin above the inner cavity of the side frame, thereby preventing the smooth removal of the bolster spring. Based on manual operation experience, the gap position of the upper-end surface of the outer spring is usually determined by human eyes and manually turned directly below the locating pin to prevent a collision. However, this process requires high labor intensity and owns low operational efficiency. The key technical difficulty to be solved urgently is positioning the end gap of the bolster spring in a narrow space with uncertain lighting conditions to develop a set of intelligent disassembly equipment for the bolster spring in a narrow space to replace manual operation. After analysis, it was observed that there is no relevant literature to conduct positioning research on the bolster spring object with complex geometric properties in a narrow space. This research proposes a visual indirect positioning method of bolster spring gap based on a line laser to solve the problem of automatic positioning of bolster spring gap in a narrow space, aiming at the new research object of bolster spring, based on line laser, machine vision, and image processing technologies.MethodsIn this research, a line laser vision system, an object detection algorithm based on deep learning, and an image processing algorithm were used. Firstly, the variation law between the height of the spring coil and orientation of the end gap was derived by analyzing the structural characteristics of its outer spring and collecting the height data of the first and second layers of the spring coil, aiming at the new research object of bolster spring. Then, the vision system based on a line laser was applied to the new field of bolster spring gap positioning. The adaptive solution method of spring coil height was studied with YOLOv3-tiny object detection, threshold segmentation, and bounding box fitting algorithms. Finally, the visual indirect positioning method of bolster spring gap suitable for a narrow space was analyzed using the adaptive solution method of spring coil height and mathematical model of the relationship between spring coil height and end gap. The accuracy, efficiency, and illumination resistance of bolster spring end gap positioning using this method in different orientations were analyzed experimentally.Results and DiscussionsThe mathematical model based on the least square method represents the corresponding relationships between the spring coil height and gap orientation of the two types of bolster springs. The ratio Htotal/H2 of the two kinds of bolster springs shows a good piecewise linear relationship with the gap orientation, with the increased division degree (Figs. 6 and 7). The positioning experiments under different gap orientations show that the spot imaging quality under the line laser vision system is better. In this research, the adaptive threshold segmentation method is separated by the laser spot on the surface of the outer and inner springs (Figs. 14 and 15). The calculated orientation error of the bolster spring gap is kept within -5°~+ 5°, and the single positioning time is less than 0.15 s, thereby meeting the requirements of system positioning efficiency (Tables 3 and 4). The positioning experiments under different illumination intensities show that the positioning method proposed in this research has strong resistance to the change in illumination intensity (Table 5).ConclusionsThis research proposesd a visual indirect positioning method to bolster spring gaps based on the spot features of a linear laser. The variation law between the height of the spring coil and orientation of the end gap was derived by analyzing the structural characteristics of the outer spring and height data collection of the first and second layers of the spring coil. The collected height data were fitted, and the mathematical models of the corresponding relationships between the height of the spring coil and gap orientation of the bearing and damping springs were derived with the least square method. The YOLOv3-tiny object detection algorithm based on deep learning was used to detect the bolster spring in a complex background, and then, the region of interest segmentation, including the laser spot image, was produced. An adaptive solution method of spring coil height was proposed based on threshold segmentation and bounding box fitting algorithms, which significantly improves the flexibility and adaptability of the algorithm. Multiple sets of bolster spring gap positioning experiments have been performed on the bolster spring test platform. The results show that the proposed method can accurately and efficiently position the two types of bolster springs in a narrow space. The positioning accuracy is within -5°~+ 5° while the single positioning time is no more than 0.15 s. Meanwhile, the proposed method has strong resistance to changes in illumination intensity, thereby meeting the gap positioning requirements of the bolster spring intelligent disassembly equipment.
Jan. 01, 1900Vol. 49 Issue 17 1704002 (2022)
Liang Hu, Huixian Duan, Haodong Pei, Dianqi Sun, and An Shu
ObjectiveDue to the intensive space launches, the operation of spacecrafts on orbit has been seriously threatened. The on-orbit service has gradually become a hot spot in the field of space research and major aerospace countries have an increasing demand for on-orbit services at present. On-orbit services include tasks such as rendezvous and docking, equipment maintenance and refueling. Non-cooperative spacecrafts refer to the kind of artificial satellites without the design of supporting services in the space environment. In order to tackle the technical difficulties, the key is to continuously obtain the relative position and attitude of the spacecraft so as to complete the tracking and acquisition of non-cooperative target. While the target cannot provide any measurement information, optical measurement can obtain the relative position and attitude information without contacting the target, so that it is the main method of non-cooperative spacecraft measurement. Aiming at the technical difficulties such as poor real-time performance in space non-cooperative target measurement, this paper proposes a binocular position and attitude measurement method for key features of non-cooperative target.MethodsThis paper proposes a binocular position and attitude measurement method for key features of non-cooperative spacecraft. Firstly, two visible light cameras are used to obtain high-resolution target images. The satellite and rocket docking ring on the target surface is extracted based on the improved arc-support line segment method. Optical flow assisted tracking in collaboration with dual thresholds is used to determine whether the docking ring ellipse is detected incorrectly. Secondly, a line detection method based on short line feature is proposed to extract reticles of the heat shield. Finally, the target coordinate system is established by using the related features of the docking ring and reticles. The relative position and attitude are calculated in the coordinate system yielded. In order to ensure the consistency of target coordinate system during tracking spacecrafts, a method of switching straight line and docking ring intersection is proposed. The ultimate goal of this paper is to realize the measurement of non-cooperative spacecraft on the embedded hardware platform.Results and DiscussionsThe ground verification system in this paper mainly includes: binocular vision camera, binocular vision processing platform, space robot controller, non-cooperative target satellite model and solar simulation light source, etc. It can be seen from the result images of the candidate ellipse of arc segment combination that the number of candidate ellipses generated by the improved satellite and rocket docking ring method is significantly reduced (Fig. 2), which shortens the time of the ellipse verification step and increases the calculation speed by 74.5% (Table 1). The method of extracting reticles of the heat shield improves the calculation speed by 42% compared with the Hough transform, shortening the running time from 0.558 s to 0.3237 s. Due to the limited shared memory between DSP6678 cores, a complete memory management and allocation mechanism is established in the process of binocular vision algorithm transplantation. For 2048 pixels×2048 pixels input images, the algorithm data update rate can reach 1 Hz. The approaching experiment of the binocular camera system in ultra-close range and the rotation experiment of the non-cooperative spacecraft model are conducted in the darkroom environment. The standard deviation of the three-axis relative position and attitude between the neighbouring image frames is 3σ=(0.058 cm, 0.015 cm, 0.017 cm), and the standard deviation of the three-axis relative attitude is 3σ=(0.680°, 0.116°, 0.101°) in the approaching experiment (Fig. 7). The average value of the measured moving distance is 2.003 cm, which is only 0.03 mm away from the control distance of the robotic arm (Fig. 7). The precision of position is better than 0.7 cm and attitude better than 0.9° in the experiment of rotating the target model around the X, Y, and Z axes (Tables 2-4). The changing rates of position and angle of the three axes are consistent with the actual motion speed, which meets the requirements of space missions.ConclusionsFocusing on the complicated problem of the position and attitude measurement of unstable non-cooperative spacecraft, this paper proposes a binocular vision position and attitude measurement method for key features of non-cooperative spacecraft. According to the characteristics of the non-cooperative spacecraft, the improved arc-support line segment method is used to extract the ellipse of the satellite and rocket docking ring. The reticles feature extraction of the heat shield is completed by statistical analysis of the main direction and similarity. This method has the advantages of high measurement accuracy and good real-time performance. In the approaching experiment of the binocular camera system, the relative error of the three axes is less than 0.6 mm and the relative angle error is less than 0.7°. In the target model rotation experiment, the relative error of the three axes is less than 6.2 mm and the relative angle error is less than 0.9°. The experimental results demonstrate that this method can output the position and attitude of the target spacecraft in real time during the service in ultra-close range. It is necessary to further optimize the binocular vision algorithm, carry out comprehensive ground verification work and improve the adaptability and stability of the system.
Jan. 01, 1900Vol. 49 Issue 17 1704003 (2022)
Shuaishuai Kong, Xiaoyan Xu, Hao Sun, Yidong Fang, Mingxu Su, and Huinan Yang
ObjectiveThe evaporation of refrigerant films is common in aviation and aerospace, refrigeration and air-conditioning, and other industries. Film thickness measurement helps understand the heat transfer mechanisms of liquid films during the formation, flow, and evaporation processes. Several researchers have worked on numerical simulations of refrigerant films. However, because numerical simulations are often based on simplified assumptions, the simulation results are less credible. Meanwhile, a large number of experiments on the measurement of liquid film thickness have been performed using various methods, including electrical, acoustic, and optical methods, but the work relevant to refrigerant films is relatively limited. The capacitive method, optical interferometry, and imaging method have been used to investigate the refrigerant liquid film. However, the above-mentioned methods have certain limitations. Measurement of refrigerant film thickness cannot be performed with high accuracy. Therefore, a novel refrigerant film thickness measurement system based on absorption spectroscopy is proposed. It demonstrates that high-accuracy thickness measurement is possible. This system can provide scientific guidance for the design and optimization of relevant industrial devices and processes.MethodsIn the study, R1233zd is used as the refrigerant. The absorption spectra in the near-infrared region (5800.0-6300.0 cm-1) of R1233zd at different temperatures (11.8, 13.5, 15.2, 16.5, 18.0 ℃) below the boiling point are measured using a self-designed temperature control device with high precision and a Fourier-transform infrared spectrometer with high resolution (Fig. 2). Based on the Beer-Lambert law, two wavenumber positions (υ1 and υ2) are chosen to eliminate the influence of light intensity attenuation caused by other factors. The absorption coefficient is significant at υ1 and close to zero at υ2. The absorption coefficients at these two wavenumber positions should be nearly temperature independent. An inversion model is developed, which is also applicable to other refrigerants.Results and DiscussionsThe measurement system is developed based on absorption spectroscopy. The system’s measurement accuracy is validated using a calibration tool with known film thicknesses (0-800 μm). Eight different film thicknesses (100, 200, 300, 400, 500, 600, 700, 800 μm) are measured ten times. The largest standard deviation of film thickness for the ten repeated experiments is 0.5 μm when the known thickness is 800 μm. Moreover, the average relative deviation between the measured and known thickness is 1.0%. This demonstrates that the system can achieve high accuracy in measuring refrigerant film thickness. Furthermore, the processes of R1233zd film evaporation on a horizontal transparent quartz plate are investigated. In this case, the imaging method is used as a comparison method. To ensure clear images, the distance between the measuring point of the absorption spectroscopy and the camera is kept at 110 mm (i.e., the focal length of the camera). The obtained liquid film image is processed, and the liquid film thickness can be accurately determined. The initial film thicknesses obtained using absorption spectroscopy and imaging method are 410.8 μm and 409.7 μm, respectively. The relative deviations in thickness measured using the two methods are 0.26%. It is discovered that the film thickness variations measured using the two methods are similar during the evaporation processes, with average relative deviations of 1.1%. The absorption spectroscopy can also be used to track the changes in film thickness throughout the evaporation process. However, the imaging method is not available due to its contrast ratio limitation when the film thickness is less than 50 μm. The liquid film evaporates slowly at the beginning of the evaporation process and the film thickness changes little. The effect of liquid evaporation is more significant than that of liquid shrinkage at the measuring point in the middle of the evaporation process. The thickness of the liquid film decreases rapidly later in the evaporation process. There is no excess liquid converging to the liquid film’s central position.ConclusionsIn this work, a novel refrigerant film thickness measurement system is developed by absorption spectroscopy. An inversion model is established to determine film thicknesses. The measurement accuracy of the system is validated by a calibration tool. Furthermore, the R1233zd film evaporation processes are investigated. The system can measure liquid film thicknesses noninvasively and with high accuracy, and it is also suitable for other refrigerant types. It has the advantages of a compact structure and simple operation. Wide-band spectral information can be obtained using this system, which will be useful for determining temperature and other parameters in future research.
Jan. 01, 1900Vol. 49 Issue 17 1704004 (2022)
Wei Huang, Junfeng Hou, Jiaben Lin, Yang Zhang, Yuanyong Deng, and Haifeng Wang
ObjectiveThe nematic liquid crystal variable phase retarder (LCVR) has the advantages of a large aperture, fast modulation speed, low driving voltage, wide spectral range, lightweight, low power consumption, and no rotating structure, and it is the only low-voltage polarization modulator that can realize fast imaging and spectral observation in the solar physics research area. LCVR develops quickly in ground-based observation equipment but slowly in space applications. Alvarez-Herrero, Hou Junfeng, and others have studied the performance changes of LCVR before and after various space irradiation, as well as mechanical and thermal tests, but its performance in the spaceborne environment is still unknown. Thus, it is critical to validate its space adaptability via satellite-carrying and ground process monitoring tests. This paper describes the design and ground environment monitoring test of a set of spaceborne liquid crystal phase retardation testing instruments (hereinafter referred to as liquid crystal tester). The liquid crystal tester will carry a specific type of satellite to test the phase retardation modulation stability of the LCVR.MethodsLCVR consists of liquid crystal (LC) molecules, a glass substrate with an LC holding cavity, an indium tin oxide (ITO) conductive film attached to the glass substrate’s inner surface, and an oriented film (Fig. 1). The retardation of the LCVR can be continuously adjusted by changing the voltage on the ITO film (Fig. 3). The light intensity method was used to measure the retardation-voltage curve for the LC tester, considering volume, power consumption, and reliability (Fig. 2). The light source generated incident light in this optical path, which was received by the detector after passing through the collimating mirror, optic filter, polarization modulation system, and imaging mirror in turn. The normalized intensity-voltage curve can be calculated and converted into a retardation-voltage curve using polarization optics theory.Results and DiscussionsAfter the design of the flying part of the LC tester was completed (Fig. 4), the ground environment test was carried out. Before and after the mechanical test, the retardation-voltage curve of the LCVR did not change significantly (the average standard deviation (STD) ConclusionsIn this paper, a set of minimized liquid crystal carrying test systems is designed to validate the stability of LCVR retardation modulation in space. The flying part of the LC tester passed all mechanical and thermal tests, and the entire thermal test process was monitored. The monitoring data show that the retardation-voltage curve has good temperature repeatability when the LC tester is in the same temperature environment. The retardation-voltage curve changes linearly with ambient temperature when in different ambient temperatures, which can be used for on-orbit data calibration. After 9 months of longterm stability testing, the change in retardation is about 1°, and the mean value of retardation STD is 0.27°, indicating that both the liquid crystal tester and the LCVR perform well.
Jan. 01, 1900Vol. 49 Issue 17 1704005 (2022)
Fanchun Tang, Yang Bu, Fang Wu, and Xiangzhao Wang
ObjectiveWave plates are critical components in several fields, including precision measurement, singularity optics, and optical communication. A wave plate's phase retardation and fast axis azimuth are two key parameters. The precise measurement of these two parameters is of great significance for the use of a wave plate. The methods including photoelastic modulation method, laser frequency division method, rotating device method, heterodyne interference method, and finite element simulation method are used to measure the two parameters. These methods are effective; however, they are not without drawbacks. Vector beams have a spatially inhomogeneous polarized distribution compared to common linearly and circularly polarized beams. The polarization state of radially polarized vector beams, for example, is distributed along the radial direction at any point in the cross-section. Furthermore, all linear polarization states can simultaneously be very useful for measuring the parameters of a wave plate, and as a result, vector beams are gaining popularity in the field of polarimetry.MethodsFirst, the measurement principle of the proposed method based on the Muller matrix and Stokes vector is described in Fig. 1. Second, formulas for calculating the measured wave plate's phase retardation and fast axis azimuth are developed. Finally, the effects of the vortex retarder (VR) zero-degree fast axis error, charge-coupled device (CCD) noise, and other factors on measurement accuracy are investigated. The experimental setup is constructed based on the measurement principle. The light source in the experiment is a white-light emitting diode, which is transformed into a collimated uniform red light field of 633 nm after passing through a plane-convex lens and a bandpass filter. When the red light passes through the horizontal linear polarizer and the vortex retarder, it produces a radially polarized beam. The radially polarized beam is then passed through a measured wave plate and a vertical linear polarizer. Finally, the intensity distribution is captured by a CCD. The intensity distribution image in Fig. 3(a) shows an hourglass distribution. Since the edges and center of the intensity distribution are typically poorly modulated, the ring area of interest region is intercepted from the image in Fig. 3(a), as illustrated in Fig. 3(b). The Radon transform is adopted to obtain the intensity curve I′(θ) varying along with the azimuth θ. To reduce the influence of noise from CCD on the measurement results, the intensity curve I′(θ) is fitted by the least-square fitting method to obtain the intensity curve I(θ). By using Fourier analysis of the normalized intensity curve I(θ), the phase retardation and fast axis azimuth of the wave plate can be measured.Results and DiscussionsThe error analysis shows that a minor error in the vortex retarder's zero-degree fast axis can affect phase retardation measurements; however, it has little effect on the measurement results of fast axis azimuth. Using the nominal fast axis direction of the measured wave plate as a reference, the nominal fast axis azimuth (NFAA) is defined as the angle between the nominal fast axis direction and the horizontal direction . From the error analysis, we can see that measurement results for the phase retardation tend to be inaccurate if measuring a wave plate with phase retardation of 0° or a multiple of 180°. Furthermore, for the same reason, phase retardation measurement results are sensitive to errors when the NFAA of the wave plate is 0° or a multiple of 180°. Before inserting the wave plate to be measured, an experiment is performed without any sample to calculate the deviation of VR's zero-degree fast axis, which can greatly improve measurement accuracy. An achromatic quarter-wave plate is measured in the experiment. The experimental results show that it has the highest measurement accuracy when the NFAA of the measured achromatic quarter-wave plate is in the range near 45° and 135°, but the measured value fluctuates greatly when the NFAA is near 0°, 90°, and 180°. When the NFAA of the measured achromatic quarter-wave plate is in the range of 30°-60°and 120°-150°, the measured average value and standard deviation of the phase retardation are 87.30°and 0.26°, respectively. The average value and standard deviation of the deviation between the measured value and the nominal value of the fast axis azimuth are 3.20° and 0.68°, respectively. To further confirm the accuracy and stability of the measurement scheme, the NFAA is set as 45°, and it is measured 10 times. The measured average value and standard deviation of the phase retardation are 87.33°and 0.01°, respectively, and those of the fast axis azimuth is 48.01° and 0.01°, respectively. To further verify the practical value of this measurement method, a zero-order quarter-wave plate at 808 nm is also measured. When the NFAA of the measured zero-order quarter-wave plate is in the range of 30°-60°and 120°-150°, the measured average value and standard deviation of the phase retardation are 116.60° and 0.59°, respectively. Moreover, the average value and standard deviation of the deviation between the measured value and the nominal value of the fast axis azimuth are 0.85° and 0.26°, respectively. Multiple measurements are performed when the NFAA is 45°. The measured average value and standard deviation of phase retardation are 117.04° and 0.03°, respectively, and the measured mean value and standard deviation of fast axis azimuth are 45.64° and 0.01°, respectively.ConclusionsThis paper proposes a method for simultaneously measuring phase retardation and fast axis azimuth of a wave plate using a radially polarized vector beam. In this method, the phase retardation and fast axis azimuth of the measured wave plate can be calculated by Fourier analysis of the intensity modulation curve obtained by the Radon transform and least-square fitting of the recorded light intensity with a snapshot baesd on the spatially variant polarized distribution characteristics of radially polarized beams. The theoretical analysis shows that when the phase retardation of the measured wave plate is 0° or a multiple of 180° or the angle between the fast axis direction of the measured wave plate and the horizontal direction is 0° or a multiple of 90°, the measurement results are sensitive to errors. Two wave plates are measured in the experiment. The experimental results demonstrate that when the angle between the fast axis and the horizontal direction of the evaluated wave plate is in the range of 30°-60° and 120°-150°, particularly near 45°, the parameters of the wave plate can be measured by a single snapshot, and the measurement results have good accuracy and stability. The advantages of this method are as follows: first, the error source is reduced since the measuring device is simple; second, the measurement is rapid and convenient since only a single imaging is used in the measurement process and there is no need to rotate the device; and finally, the fast axis distribution error of the vortex retarder is calibrated, and the influence of noise of the CCD camera on the measurement results is reduced by the least-square fitting. However, some aspects require further investigation, such as the measurement of the measured wave plate's global birefringence distribution and the effects of the linear polarizer's extinction ratio and the uniformity of the light source on measurement results.
Jan. 01, 1900Vol. 49 Issue 17 1704006 (2022)
Mengyu Wang, Jiyang Liu, Yuansong Li, Lekang Fan, Wencheng Ai, Yufan Huang, Jingyu Liu, Tao Wu, Chengfeng Xie, Zhuang Guo, Shengpeng Wan, and Yanjun Fu
ObjectiveDue to their ultra-high quality (Q) factor and extremely small mode volume, optical microcavities supported whispering gallery modes are becoming increasingly popular in photonic devices such as micro-lasers, optical filters, nonlinear effects, and optical sensors. However, the external environment, such as changes in environmental pressure, mechanical vibration, dust, and temperature fluctuations, has a considerable impact on the resonance characteristics of this type of microcavity system. The material loss and surface roughness are two important factors that affect the Q value of the microcavity and should not be overlooked. If the silica microcavity is exposed to normal environment, it will adsorb water molecules in the air, reducing the Q factor; therefore, the external environment's interference with the microcavity must be eliminated. To make it suitable for outside applications, the packaging method based on the microcavity must be examined further. Furthermore, the packaging technology must be updated to improve the stability of the coupled microcavity system.MethodsThe silica microsphere cavity is fabricated by using arc discharge to melt the tip of a single-mode optical fiber. When the end of a standard single-mode fiber is melted and solidified, it forms a sphere with an ultra-smooth surface. The tapered fiber, created using the heat-and-pull technique, serves as a waveguide to excite the microsphere's whispering gallery modes. Subsequently, we propose a whispering gallery mode microcavity and fiber tapered waveguide coupling system that is indirectly packaged. The adjusted coupling state before packaging is not changed during the packaging process, and the silica microcavity is fixed in a sealed and clean transparent glass box. The packaging method has the advantages of ensuring a good coupling state, being isolated from the external environment, portability, and long-term stability of the ultra-high-Q factor. The stability of the transmittance, resonant wavelength point, and full width at half maximum are calibrated and analyzed using the Allan variance. Finally, the proposed packaged devices are compared to other packaging methods.Results and DiscussionsThe resonance spectrum of the packaged microsphere cavity is measured using an experimental setup. The Lorentz function is used to fit the resonant peak at 9.29 GHz. A typical Q factor after packaging is still approximately 5.1×10⁷ (Fig. 4). The stability of the resonance performance is evaluated to test the stability of the packaged microcavity. The Allan variance is used to describe the variation of the transmittance, resonant wavelength point, and full width at half maximum(Δf) with time. The results indicate that the transmittance is basically constant (0.4 nm), indicating that the resonant state is very stable for up to 1000 s. (Fig. 6). Furthermore, the resonant wavelength point shows a rising trend, implying that the resonant point appears in a red-shifted state (Fig. 7). The minimum value of Allan variance of the resonant point is near 1 s and the minimum value of Allan variance of Δf is near 23 s. In this experiment, the Q factor of the packaged microcavity device reaches 5.1×10⁷, which is five times higher than the Q factor of the spot-packaged silica microsphere, and one to two orders of magnitude higher than the Q factors of wholly-packaged silica microsphere, microbottle, microbubble, and As2S3 microsphere (Table 1). The Q factor of our packaged silica microcavity is four orders of magnitude greater than that of the indirectly packaged polymer microcylindrical cavity. The ultra-high Q factor contributes to the high application value for micro-lasers, optical filters, optical gyroscopes, and high sensitivity sensors.ConclusionsIn this study, we propose a novel indirectly packaged whispering gallery mode optical microcavity device. A photodetection system is used to analyzed the resonance characteristics of the packaged device, and the Q value reaches 5.1×10⁷, which is higher than the Q values of other spot-packaged and wholly-packaged devices. The packaging method not only has excellent characteristics such as strong robustness, stability, interference immunity, and portability, but also guarantees an ultra-high Q factor. The stability of the packaged microcavity is thoroughly examined, and Allan variance is used to assess the stability of the resonant mode. The result demonstrates that the resonant state is stable for up to 1000 s, but the resonant point drifts due to the thermal effect. In the following work, a temperature control system and a frequency locking system are being considered to solve this problem. Our research provides a solid foundation for the practical use of microcavity devices and contributes to the advancement of microcavity technology. The evaluation method introduces a novel idea for analyzing the stability of microcavity devices. The packaged devices are highly promising in many applications including micro-lasers, optical filters, optical gyroscopes, and high sensitivity sensors.
Jan. 01, 1900Vol. 49 Issue 17 1713002 (2022)
Jing Zhang, Wenrui Xue, Chen Zhang, Yuting Chen, and Changyong Li
ObjectiveAn electromagnetic absorber is a device that converts incoming electromagnetic waves into other forms of energy. Since Landy et al. (2008) proposed a metal-insulator-metal-based narrow-band absorber, a wide range of absorbers have emerged. Because the broadband electromagnetic absorbers are widely used in photodetector, solar cells, cooling coolers, and photochemical devices, they have been a hot spot of research in recent years, and the broadband electromagnetic absorbers worked in visible light, infrared, terahertz, microwave, and other bands have been widely reported. UV absorbers have important applications in ultraviolet-related fields such as ultraviolet photocatalyst, but there are few reports on this type of absorber. Although most absorption bands of previously designed absorbers involve the ultraviolet band, they don’t completely cover the ultraviolet band, and the absorption effect of the ultraviolet band is not better than that of the other bands, with an average absorption rate of only about 60%. In terms of material and performance, most applications of the absorbers are focused on fields such as energy collection, but ultraviolet protection is less explored. It is critical to design a broadband efficient absorption device that fully covers the ultraviolet band in order to improve the absorption performance and give full play to the performance of the ultraviolet band, combined with its adopted material characteristics and design structure, and to understand the physical mechanism behind it.MethodsA multigroove ultraviolet absorber was designed using Bi1.5Sb0.5Te1.8Se1.2(BSTS) material. First, modeling was done with COMSOL software. The incident and reflection ports were assigned to port 1, while the transmission port was assigned to port 2. To account for the diffraction effects of levels 0 and ±1, two diffraction levels were set under each port. Periodic boundary conditions were set on the left and right sides to ensure the structure’s periodic setting. The grid was then finely divided to ensure the accuracy of the calculation and the results. The field distribution of this absorber was then simulated, and the simulation results showed that the physical mechanism of the absorber was surface plasma resonance and optical cavity resonance. Finally, a frequency domain parameterized solution is used to calculate the effect of different structure parameters and incidence angles on absorption performance.Results and DiscussionsAfter numerous simulations, relatively optimized structural parameters were obtained: number of grooves N is 10, BSTS thickness t1 is 100 nm, SiO2 width t2 is 145 nm, groove width W is 600 nm, minimum depth hmin is 1225 nm, and maximum depth hmax of grooves is 1800 nm. The diagrams show the absorber’s absorption rate, reflectance, and transmission rate at zero incidences (Fig. 4). As can be seen in Fig. 4, the absorption curve maintains a good absorption effect, up to more than 90%, allowing for high broadband absorption across the entire ultraviolet band range. To illustrate the absorption characteristics of the absorber at different angles, the contour diagram of the absorption at 0° to 85° is given in Fig. 5, which shows that absorption of about 90% can be achieved at 0°-60°. The overall absorption effect in the 0°-70° range can reach over 80%, achieving a wide-angle high absorption in the ultraviolet band range. The normalized magnetic field distributions at 210 nm, 250 nm, 320 nm, and 360 nm in the zero incident case were showed in Fig. 6 to analyze the physical mechanism of this absorber absorption. This absorber’s absorption mechanism is the surface plasma resonance effect and the optical cavity resonant effect, as shown in Fig. 6. The groove region of the structure is the grating region, because surface plasma resonance occurs at the surface of the BSTS material, causing strong absorption at different wavelengths. When the incident electromagnetic wave meets the resonance conditions, the field is localized within this region, resulting in strong absorption. Furthermore, in order to analyze the dependence between the absorption performance of the absorber and the structural parameters, in the case of zero incidences, combined with the field distribution at a specific wavelength, the effects of changing the width of air groove W, thickness t1 of BSTS, width t2 of SiO2,minimum depth hmin of groove, maximum depth hmax of groove and number N of air groove on absorption performance were analyzed respectively. The results are shown in (Figs.7-12).ConclusionsThis article describes the design of a multigroove-type ultraviolet absorber with absorption conditions spanning the entire ultraviolet band, from 200 to 400 nm. The finite element method was used to investigate the relationship between the absorption mechanism or the absorption characteristics and the incident wavelength, angle of incidence, and structural parameters. The structure is intended to benefit from the combination of both materials and structures, with the BSTS material exhibiting good plasma properties in the ultraviolet band and the dielectric constant of the medium layer silica changing with wavelength. The absorber achieves high absorption in the ultraviolet band due to the effective combination of the two materials and the reasonable structural design. Through extensive simulation calculations, the absorptivity can reach the range of over 80% between 200 to 400 nm at 0°-70°, and at 0°-60°the absorptivity of about 90% is basically achieved with optimized structural parameters, realizing the broadband wide-angle absorption in the ultraviolet band. With zero incidences, the overall absorptivity exceeds 90%. The absorption mechanism of the zero-degree incidence case is highlighted when combined with the magnetic field distribution under the optimization parameters. Broadband and efficient absorption were caused by the interaction of the surface plasma resonance and the optical cavity resonance. A reasonable absorber size design provides a theoretical foundation for the actual production of the ultraviolet absorber. Furthermore, the absorber’s design is expected to have important applications in ultraviolet sensing, ultraviolet photoelectric detection, ultraviolet protection, and other fields.
Jan. 01, 1900Vol. 49 Issue 17 1713003 (2022)
Zengqiang Wang, Dongjian Zhou, Liucheng Li, Yuanhu Wang, Haijun Yu, Jing Cao, Shukai Tang, Jian Wang, Liping Duo, Gang Li, and Yuqi Jin
Jan. 01, 1900Vol. 49 Issue 17 1716002 (2022)
Wenzhen Li, Yang Chen, Xiongwei Hu, Yingbo Chu, Nengli Dai, and Jinyan Li
Jan. 01, 1900Vol. 49 Issue 17 1716003 (2022)
Zusi Mo, Lingbing Bu, Qin Wang, Xuefei Lin, Samuel A. Berhane, Bin Yang, Chen Deng, and Zhi Li
ObjectiveAtmospheric particulate matter is regarded as one of the most serious air pollutants that endanger human health. Lidar detection is a viable method for achieving high-precision particle distribution measurements. To some extent, the aerosol extinction coefficient reflects the relative size of aerosol mass concentration. Meteorological elements, such as temperature, relative humidity, wind speed, and surface pressure, have a significant impact on the extinction coefficient and mass concentration. In this study, a dataset of PM2.5 and PM10 was created by combining the extinction coefficient obtained from lidar and surface meteorological elements such as temperature, relative humidity, wind speed, and surface pressure. The data characteristics were calculated using principal component analysis. The mass concentration of PM2.5 and PM10 were estimated using the generalized regression neural network (GRNN) model. The results show that the correlation coefficients between the estimated mass concentrations obtained by the GRNN model and the true values collected from environmental monitoring stations for PM2.5 and PM10 were 0.86 and 0.85, respectively. Moreover, the root mean square errors (RMSEs) were 2.58 μm/cm3 and 10.84 μm/cm3, and the mean absolute deviations (MAEs) were 0.81 μg/m3 and 1.53 μg/m3 for PM2.5 and PM10,respectively. The GRNN model was applied to lidar scanning mode to evaluate the horizontal distribution characteristics of particle over Pukou District of Nanjing. The estimated mass concentrations of PM2.5 and PM10 were consistent with the measured values, demonstrating the GRNN model’s effectiveness in particle mass concentration evaluation.MethodsThe aerosol extinction coefficient, wind speed, temperature, relative humidity, and surface pressure were used as input variables in the GRNN, and the PM2.5 and PM10 mass concentrations were used as output variables for model training and verification. First, principal component analysis was used to calculate the characteristics of sample data, and the effects of various meteorological factors on aerosol mass concentration were fully considered. Furthermore, the better evaluation model was continuously trained by adjusting parameters. The GRNN evaluation model was used to evaluate the temporal and spatial changes of particulate matter mass concentration in the Pukou District of Nanjing. Simultaneously, it was verified and analyzed in conjunction with ground meteorological elements and data from environmental monitoring stations.Results and DiscussionsThe GRNN model was used to establish and validate an evaluation model of PM2.5 and PM10 mass concentrations based on the extinction coefficient obtained from lidar and surface meteorological factors. The correlation coefficients between the estimated mass concentrations obtained by the GRNN model and the measured values were 0.86 and 0.85, the RMSE were 2.58 μg/m3 and 10.84 μg/m3, and the mean absolute errors (MAE) were 0.81 μg/m3 and 1.53 μg/m3 for PM2.5 and PM10,respectively. The GRNN model was also used to estimate and analyze particulate matter mass concentration using lidar horizontal scanning. The trend of the model’s evaluation values were consistent with the measured values from the environmental monitoring station.ConclusionsThe aerosol extinction coefficient was calculated using the GRNN model and the lidar inversion result. The correlation model was constructed using the hourly mean value of mass concentration. The model variables were screened using principal component analysis, and K-fold cross-validation was performed on the training data. The optimal sliding factor was chosen using the minimum mean square error index. The output model’s results were reliable, with correlation coefficients between predicted and actual values of 0.86 and 0.85 for PM2.5 and PM10 mass concentrations, respectively. Moreover, the RMSEs were 2.58 μg/m3 and 10.84 μg/m3 and the average absolute errors were 0.81 μg/m3 and 1.53 μg/m3, for PM2.5 and PM10 mass concentration, respectively. The Pukou District in Nanjing was observed horizontally using lidar, combined with local temperature, relative humidity, wind speed, surface pressure, extinction coefficient, the GRNN model was employed to estimate the mass concentrations of PM2.5 and PM10. The correlation analysis results between the estimated mass concentration of PM2.5 and PM10 and the measured values collected from the environmental monitoring station further validated the GRNN model’s accuracy. The results demonstrated that the model could be used to monitor PM2.5 and PM10 mass concentrations using lidar, and it provided a new method of monitoring particulate matter pollution over a wide range with high temporal and spatial resolutions.
Jan. 01, 1900Vol. 49 Issue 17 1710001 (2022)
Ding Han, Ziyin Ma, Junlin Wang, Xin Wang, and Suyalatu Liu
ObjectiveIt is of great significance to develop and design terahertz metamaterials with superior sensing characteristics, since such metameterials can be widely used in the sensing fields of biology, medicine and so on. Traditional metamaterial design is mainly based on impedance matching and equivalent circuit theory. It is designed through model design, parameter scanning and manual optimization. It needs hundreds of parameter scanning operations and consumes a lot of computer resources. This design method has high requirements for the designers’ electromagnetic theory and simulation experience, and it depends heavily on the designers’ metamaterial design experience and intuition. In recent years, the metamaterial inverse design method based on artificial intelligence technology has developed rapidly. However, it is difficult for this method to deal with the design of different sizes, the optimization is easy to fall into the local optimal state, and there is no special design method for metamaterial absorber. To solve the above problems, a rapid design method of metamaterial absorber based on improved particle swarm optimization algorithm is proposed in this paper. The absorption characteristics of metamaterial absorber are automatically calculated by using automatic peak seeking technology, so as to realize the optimization and inverse design of metamaterial metal resonance layer.MethodsIn this paper, the metamaterial metal resonance layer is expressed as a matrix, and the key parameters of the absorptivity curve of metamaterial are read by using the automatic peak seeking algorithm. The rapid design of metamaterial absorber is realized based on CST-MATLAB joint simulation technology and particle swarm optimization algorithm with linearly decreasing weight. During the use of the software, the designer inputs the design parameters such as the period, thickness and dielectric constant of metamaterial structural unit, and uses the particle swarm optimization algorithm to automatically carry out optimization iterative calculation, so as to output the qualified "optimal" metamaterial absorber design results. In order to further improve the sensing performance of metamaterials, taking the metamaterial structure designed by the method proposed in this paper as an example, a new scheme of metamaterial absorber based on microcavity structure is proposed, and in-depth simulation research is carried out.Results and DiscussionsCompared with other design methods, the metamaterial rapid inverse design method proposed in this paper saves a lot of time and reduces manual participation (Table 1). The design results show that using the metamaterial rapid design method based on particle swarm optimization algorithm can design results similar to manual design (Fig. 4), and achieve almost perfect absorption of incident electromagnetic wave at 0.3122 THz (Fig. 5). It has high sensing performance (Fig. 6). By replacing the original intermediate dielectric layer with the analyte to be measured, the coupling between the analyte to be measured and the resonant magnetic field can be effectively strengthened, and the sensing characteristics of the metamaterial absorber are improved (Table 2).ConclusionsIn this paper, a rapid inverse design method of metamaterial based on particle swarm optimization and automatic peak seeking algorithm is proposed. Taking the metamaterial structure designed by the method proposed in this paper as an example, the design scheme of metamaterial absorber based on microcavity structure is proposed, and in-depth simulation research is carried out. The results show that the rapid design method can not only save the design time of metamaterial metal resonance layer and simplify the design process, but also design a metamaterial structure similar to manual design results. Compared with the traditional design method, the inverse design method of metamaterial absorber based on particle swarm optimization avoids the requirements of designers’ knowledge and experience. The metamaterial rapid design method studied in this paper provides a technical basis for the subsequent application of artificial intelligence technology in metamaterial design, and has guiding significance for the mechanism analysis and sensor design of metamaterial absorber in the future. Compared with the traditional structure metamaterials, although the absorptivity, resonant frequency, full-width at half-maximum and several other parameters are somewhat worse, the microcavity metamaterials have better sensing characteristics, simplify the metamaterial design process, and better meet the sensor design requirements. The metamaterial structure of microcavity structure provides a new solution to the application design of metamaterial absorber.
Jan. 01, 1900Vol. 49 Issue 17 1714001 (2022)
Xiuhua Fu, Xingyu Chen, Chengqi Tan, Zhongyao Zhu, Jing Zhang, Gong Zhang, Zhongju Ren, and Guoshui Ma
ObjectiveThe vehicle-mounted laser radar acts as the car’s eyes, transmitting radio waves to the target object, and comparing the transmitted signal to the target reflection signal to achieve the detection and ranging function of the target object. The infrared Lidar window, as the vehicle-mounted radar’s outermost layer, also participates in optical imaging. People are increasingly demanding that filters filter light at a wide-angle. And because the optical window is prone to frost and fog in cold and humid weather, which affects the transmittance, the filter must also have heating and conducting functions. According to information, domestic research on Lidar window components has begun in recent years. However, current research typically cannot simultaneously increase the transmittance, increase the working angle, and reduce the square resistance of the film. Therefore, the primary research focus of the near-infrared conductive filter is the improvement of multiple indicators. In this paper, SiHx and SiO2 are selected as high and low refractive index materials. Adjusting the amount of hydrogen changes the optical constants of SiHx. A 905 nm filter is designed and prepared, and the outermost layer is plated with a single layer of indium tin oxide (ITO). The square resistance of the film is reduced under the premise of spectral performance.MethodsAccording to the index requirements, the filter cannot produce a large shift in the spectrum at a large angle of incidence. SiHx,which has a large absorptivity in the visible wavelength band and a small absorptivity in the near-infrared band, is selected as the high-refraction filter material and the low-refraction material SiO2 is superimposed on each other to prepare a filter. The filter is made using radio frequency magnetron sputtering technology. First, the optical constant of SiHx is investigated, and the gradient test on the inductively coupled plasma (ICP) hydrogen charge is performed to validate the theoretical experimental calculation results (Figs. 1 and 2). Then, using the material’s optical constants, a filter that meets the requirements is designed (Fig. 3), and the error analysis of the designed film is performed (Fig. 4). Select the best sputtering process to match the refractive index of SiHx with that of SiO2(Table 1), and test the spectral curve with spectrophotometers (Fig. 5). A layer of ITO transparent conductive film is plated on the filter to achieve the function of defrosting and anti-fogging in a low-temperature environment. First, perform square resistance tests on ITO single-layer films with different thicknesses (Fig. 6), and then use ITO with a thickness of 250 nm to perform gradient tests on the oxygen charge of the plasma source and the argon charge of the target material (Tables 2 and 3). Determine the best process for ITO (Table 4). First, prepare the filter as described above, then add a layer of ITO to the outermost layer after the standby device has been cooled, measure the spectrum (Fig. 8), and use a low impedance analyzer to measure the square resistance.Results and DiscussionsAfter testing, when the incident angle of the filter is 0°, the average transmittance in the 400-700 nm band is 0.09%, the average reflectance is 6.17%, and the average transmittance at (905±30)nm is 93.53%. When the incident angle is 30°, the average transmittance in the 400-700 nm band is 0.09%, the average reflectance is 6.77%, and the average transmittance at (905±30)nm is 92.43%. After adding 250 nm thick ITO to the outermost layer, the average transmittance under the incident angle of 0°at (905±30)nm is 92.58%, and the average transmittance at the incident angle of 30° is 91.9%; the average transmittances at the incident angles of 0° and 30° in the visible light band are both 0.1%, which meets the design requirements, and the final square resistance of the prepared near-infrared conductive filter is 24 Ω/square. While the ITO film has no effect on the filter’s transmittance, the square resistance of the film is significantly reduced by adjusting the process. The film is subjected to high and low-temperature cycle tests, stretched films tests, and hundred-grid tests, and there is no film peeling, cracking, etc.ConclusionsUsing SiHx and SiO2 as the high and low refractive index materials, a large-angle near-infrared filter for automotive ranging lidar is developed, and a low square resistance ITO film is coated on the outermost layer of the film to facilitate shield electromagnetic interference and energize heating to achieve the function of defrosting and anti-fogging. The film has a very good anti-reflection effect in the (905±30)nm band. To reduce the reflectivity of the film, the Macleod and Optilayer softwares are used for design and calculation. SiHx is used as the high refractive index material to absorb the visible light wave to achieve the effect of black film. The developed (905±30)nm conductive filter has an average transmittance of 92.58% at the incident angles of 0°, 91.9% at the incident angles of 30°, and a square resistance of 24 Ω/square. It is suitable as the window of vehicle radar and has important reference significance for the black film required by augmented reality/virtual reality, face recognition, etc.
Jan. 01, 1900Vol. 49 Issue 17 1703101 (2022)
© Copyright 2018-2021 | Chinese Laser Press.
All Rights Reserved 沪ICP备15018463号-20