


Please enter the answer below before you can view the full text.

Yinfei Wang, Hao Zhu, Zhaoyang Zhang, Tianshuai Zhang, Yucheng Wu, and Wenwu Du
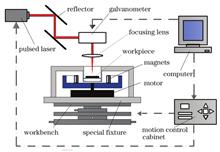
ObjectiveWith the advancement of science and technology in the aerospace sector, the micro-hole laser processing tools have become increasingly important. Compared to traditional machining and electric spark processing of micro-plates, laser drilling has high processing efficiency, high speed, low cost, and wide application range, and a lot of high sensitive holes can be processed. An ultrashort laser pulse has gradually become the preferred one for high-quality micro-hole processing due to its high processing accuracy, but the existing studies have found that an ultrashort pulse laser still has defects such as recast layers, micro-cracks, and slags, and at the same time, the processing efficiency is far less than that for a traditional long laser pulse. Magnetic field assisted laser drilling can further reduce the defects of ultrashort laser processing to improve the micro-hole morphology, increase the etching depth, and reduce the hole taper. In order to further improve the geometry for laser drilling, improve the etching depth, and reduce the hole taper, the 304 stainless steel is used as the test material and the magnetic field rotation assisted laser drilling and machining is adopted.MethodsThis paper discusses the mechanism and experimental study of magnetic field rotation assisted laser drilling of 304 stainless steel. First, the effect of magnetic field rotation on the quality of microporous processing is studied. The variations of micro-hole etching depth, the surface spatter, the hole-wall geometry, and the oxygen content of inner wall are investigated under the action of different magnetic field rotation speeds. The microporous surface splatter and the inner-wall morphology are observed by the scanning electron microscope. The inner-wall removal amount is described with surface splatter, and the inner-wall quality is described with inner wall smooth flatness. Then, the inner-wall oxygen content is measured by the energy spectrometer, and it can reflect the inner-wall slag and the recast layer of the micro-holes. The inner-wall regional scanning and line scanning are studied at different magnetic field rotation speeds, which can infer the variation of inner-wall oxygen content (inner-wall slag and recast layer) with magnetic field rotation. The micro-hole etching depth is measured by the ultra-depth-of-field microscope, the micro-hole etching depth is quantified, and the etching depths under different rotation speeds for 5 s and 10 s are compared. Finally, the effect of magnetic field rotation on the micro-hole taper is studied under different single pulse energies. It can be evaluated from the micro-hole inlet size, outlet size, and inner-wall taper.Results and DiscussionsAfter applying a rotating magnetic field, the Lorenz force generated by the rotating magnetic field accelerates the motion of the charged particles in plasma and simultaneously the molten metal has a certain agitation and splash, so the inner-wall melt distribution is more uniform and the removal uniformity of the through-hole is further improved (Fig. 5). When the rotating magnetic field is applied, the surface splash is increased. The surface splatter is increased more significantly as the magnetic field rotation speed is increased to 250 r/min (Fig. 6). The application of the rotating magnetic field can accelerate the flow of the inner-wall molten metal. Therefore the inner-wall morphologies of the recast layers are smoother, and it can also accelerate the discharge of the slags in the micro-hole inlet and outlet. The oxygen content reflects the residues of inner-wall slags, indicating that the micro-hole slags are reduced after applying a rotating magnetic field (Fig. 7). As the magnetic field rotation speed increases, the micro-hole etching depth also increases. When the magnetic field rotation speed is 350 r/min and the processing time is 10 s, the increase of etching depth reaches the maximum of 24.7 μm (Figs. 8, 9, and 10). Compared those with and without a rotating magnetic field when the single pulse energy becomes large, the diameter of the micro-hole inlet under the rotating magnetic field is significantly reduced and the outlet diameter is slightly increased, so the micro-hole taper is reduced more significantly under a larger energy. When the single pulse energy of the laser is 85 μJ, the micro-hole taper difference between the two processes is the largest, and the micro-hole taper under a rotating magnetic field is reduced by 1.17° compared with that by laser direct processing (Figs. 11 and 12).ConclusionsThe variations of micro-hole etching depth, the surface spatter, the hole-wall geometry, and the inner-wall oxygen content are investigated under the action of magnetic fields with different rotation speeds. The effect of single pulse energy on the micro-hole taper is studied with and without the action of a rotating magnetic field. Experiments show that with the increase of magnetic field rotation speed, the micro-hole etching depth increases, the surface splashing becomes more pronounced, and the oxygen content further decreases. The introduction of a rotating magnetic field makes the geometric shape of the hole-wall smooth and can effectively reduce the micro-hole taper. The higher the energy of a single pulse, the more significant the decrease in micro-hole taper.
Jan. 01, 1900Vol. 49 Issue 16 1602001 (2022)
Enlan Zhao, Qingqing Wang, Haifeng Yang, and Yuxing Peng
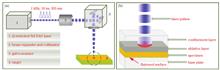
ObjectiveElectronic copper foil is an important material for circuit boards and plays an essential role in interconnecting circuits and electronic components. Ultrasmooth electronic copper foils are a crucial for manufacturing high-end circuit boards. However, traditional polishing methods have some limitations in the high-efficiency polishing of large-area ultrathin metal foils. Laser shock peening and forming is a manufacturing technology that uses ultrahigh pressure and high-speed shock force generated by a short-pulse laser to achieve a high strain rate plastic deformation of materials. The laser shock peening can improve the material's comprehensive mechanical properties by inducing grain refinement and residual compressive stress on its surface. Through shock wave pressure, the laser shock imprinting causes plastic deformation to form a metal foil, allowing for fabricating micro and nanostructures on the metal foil surface, which can be used in electronic and plasma sensing. Because the laser shock technology can cause plastic deformation on the metal foil surface, it can enable the surface polishing of electronic copper foils. It has been reported that a shock wave generated by a high-energy pulsed laser strikes the metal foil with the bottom plate to duplicate the smooth surface of the bottom plate and obtain less surface roughness of the metal foil. However, because of the large pulse energy and spot size, large plastic deformation occurs, causing profile fluctuation of the spot transition zone. Therefore, studying the microscale laser shock flattening (MLSF) of electronic copper foils using a low-energy pulsed laser is important.MethodsThe MLSF experimental device comprised a pulsed laser, beam expander and collimator, galvanometer system, and target. The pulse width, wavelength, and repetition frequency of the laser were 10 ns, 355 nm, and 1 kHz, respectively. The collimated laser beam was scanned using a galvanometer and was focused on the surface of an electronic copper foil, with a focusing diameter of 20 μm. The morphology and roughness of the electronic copper foil were measured before and after the MLSF using an atomic force microscope (CSPM5500). The samples were scanned in the contact mode. The scanning frequency and area were 0.3 Hz and 30 μm×30 μm, respectively. After performing the roughness test, the data was processed using the CSPM imager 4.60 software. The roughness value of the electronic copper foil is the average value of three measurements. The samples with a diameter of 3 mm were cut and subsequently prepared using double jet polishing. A transmission electron microscope (TEM) JEM2100 with a working voltage of 200 kV was used to perform the surface transmission analysis of the copper foil. The Gatan 1.2.44 software was used to perform the inverse fast Fourier transform (IFFT) and filtering of high-resolution TEM images.Results and DiscussionsThe surface roughness of the annealed copper foil is approximately 22.7 nm, and the height distribution of microprotrusions is concentrated in the range of 39.2-227.5 nm. When the laser pulse energy is 100 μJ, the surface roughness of the flattened copper foil is approximately 8.1 nm. After performing MLSF three times, the surface roughness of the copper foil is 5.0 nm. The surface roughness of the electronic copper foil gradually decreases with increasing MLSF. When the laser-induced stress wave passes through the Al/Cu interface, it amplifies and acts on the copper foil. Thus, the copper foil collides with the base plate (K9 glass) under the high pressure of the stress wave. Finally, a surface roughness closing to that of the K9 glass is obtained in the shock area of the copper foil surface (Fig. 7). There are no obvious fluctuations at the spot overlap zone on the surface of the electronic copper foil according to the surface morphology and cross-sectional profile of the foil after the MLSF (Figs. 4 and 5). According to the microstructure analysis of the electronic copper foil before and after the MLSF, laser shock only induces numerous dislocation entanglements, dislocation cells, and lattice distortions in the electronic copper foil. However, it does not lead to the formation of deformation twins and grain refinement. This phenomenon primarily occurs due to the use of small laser pulse energy and the propagation form of the two-dimensional ellipsoidal shock wave in MLSF. Thus, the peak pressure of the shock wave is small, which cannot cause large plastic deformation of the copper foil and is insufficient to induce deformation twins and dynamic recrystallization of the copper foil that has a medium stacking fault energy. The MLSF of the electronic copper foil is primarily caused by the plastic deformation of microprotrusions on its surface.ConclusionsThe MLSF of electronic copper foils is studied. The effects of laser pulse energy and shock times on the MLSF as well as the surface deformation mechanism of the MLSF are studied. The MLSF can effectively reduce the surface roughness of the electronic copper foil, reaching a minimum of 5.0 nm. The MLSF leads to the formation of numerous dislocation structures with different configurations, such as dislocation entanglements and small dislocation cells. The small plastic deformation inside the metal foil and the large plastic deformation near the bottom surface are the surface deformation mechanisms of the MLSF.
Jan. 01, 1900Vol. 49 Issue 16 1602002 (2022)
Xiankai Meng, Yaomin Zhao, Jianzhong Zhou, Shu Huang, Xumin Leng, and Li Li
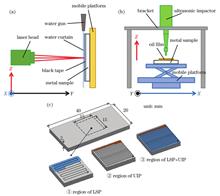
ObjectiveWith the increasing lightweight requirements of aviation equipment, thin-walled structural parts have become an indispensable key part of aerospace. These parts are generally made of light alloys such as aluminum alloy. However, the structural strength of aluminum alloy aviation thin-walled parts is low and the fatigue crack propagation resistance is weak. The fatigue life is the key to restricting the service life of aerospace vehicles. The fatigue crack sources are generally concentrated on the surface of parts, so many surface deformation strengthening technologies including laser shock peening have attracted much attention in recent years. However, the action time of laser shock wave is very short, the induced microstructure is mainly a dislocation structure, the stabilities of the microstructure and stress are poor, and the surface plastic deformation is serious, which all reduce the quality of laser shock peening. Therefore, it is necessary to explore new processes to improve the surface quality of machined parts, except to use the advantages of laser shock peening. Because the ultrasonic impact peening technology uses high-frequency vibration to impact the material surface, produce an ultrasonic shock wave, refine the grains on the material surface, and form residual compressive stress field, it can obtain more stable microstructures and residual stress than laser shock peening. However, the shock wave pressure is low in the process of ultrasonic impact peening, and thus a long time is generally needed to obtain a better strengthening effect, which results in a low strengthening efficiency. The laser ultrasonic composite shock peening technology uses the composite effect of an ultrasonic shock wave and a laser shock wave to regulate the microstructure and surface residual stress, so as to improve the surface integrity and mechanical properties of metal materials. However, there are only few reports on the exploration of the laser ultrasonic composite shock peening technology at present. Taking the 2024-T351 aluminum alloy as the research object, this paper experimentally studies the influence of laser ultrasonic composite shock peening (LSP+ UIP) on the surface morphologies and microstructures of materials, analyzes the relationship between microstructures and mechanical properties, and explores the evolution mechanism of microstructures and the change law of mechanical properties under the action of LSP+ UIP.MethodsThe 2024-T351 aviation aluminum alloy plate with a thickness of 2 mm is selected as the experimental material. The rectangular sample is cut and polished. The sample surface is strengthened by laser ultrasonic composite shock peening. The surface morphology and surface linear roughness in the treatment area of the strengthened sample are measured. First, the surface micro-hardness of the sample is tested by the micro-hardness tester and the surface residual stress of the sample is tested by the residual stress tester. Second, the sample is cut along its section direction by wire cutting, the cross section is ground and polished, the sample's section is soaked with the Keller's corrosive agent for corrosion, and the sample's section is observed by the scanning electron microscope after treatment. Third, the surface layer of the sample is subject to wire cutting, grinding, and ion thinning until the thickness is ≤200 nm, and the microstructure of the sample's section is observed by the transmission electron microscope.Results and DiscussionsThrough surface morphology observation and roughness measurement, it can be seen that the surface quality of the LSP+ UIP area is significantly improved compared with that of the LSP area (Fig. 3). Compared with LSP, LSP+ UIP reduces the surface roughness of the sample by 34.19% (Fig. 4). The scanning electron microscope shows that the surface hardened layer depth of the LSP+ UIP sample reaches 20 μm. The depth of the grain refinement layer is about 50 μm. The average grain size is about 7 μm. Compared with those of the LSP and UIP samples, the average grain size of the LSP+ UIP sample is reduced by 53.3% and 50.0% (Fig. 5), respectively. It is observed by the transmission electron microscope that many nanometer-sized sub-crystals are formed on the surface of the LSP+ UIP sample, and the dislocations with a certain density are gathered around some sub-crystals, indicating that the LSP+ UIP strengthened structure effectively combines the structural response characteristics induced by plastic deformation of LSP at a high strain rate and UIP at a low strain rate and the microstructure of "nanocrystalline+ stacking dislocation" is formed (Fig. 6). The surface micro-hardness of the LSP+ UIP strengthened sample is up to 189.0 HV, increased by 12.9% and 6.4% compared with those of the LSP and UIP samples, respectively (Fig. 7). Because LSP+ UIP can obtain higher plastic deformation than LSP or UIP, the induced residual compressive stress is significantly higher than those for LSP and UIP. Compared with those by LSP and UIP, the residual compressive stress induced by LSP+ UIP is increased by 25.8% and 18.2%, respectively (Fig. 8).ConclusionsThe effects of laser ultrasonic composite shock peening on the microstructure and surface properties of the 2024-T351 aluminum alloy are studied, and the evolution and strengthening mechanism of the microstructure under laser ultrasonic composite shock peening are analyzed. Laser ultrasonic composite shock peening can effectively solve the phenomenon of surface quality reduction after the LSP treatment, reduce the material surface roughness, and improve the surface flatness of the material. In terms of microstructure, LSP+ UIP can further refine the grains and form the microstructure of "nanocrystalline+ stacking dislocation" . In terms of micro-hardness, LSP+ UIP significantly increases the surface hardness of the material, increased by 12.9% and 6.4% respectively compared with those by LSP and UIP. In terms of residual stress, LSP+ UIP introduces a large amplitude of residual compressive stress on the material surface. Compared with those by LSP and UIP, the residual compressive stress induced by LSP+ UIP is increased by 25.8% and 18.2%, respectively. Our research shows that with a reasonable experimental design, laser ultrasonic composite shock peening can make 2024-T351 aluminum alloy obtain better surface properties.
Jan. 01, 1900Vol. 49 Issue 16 1602003 (2022)
Binxin Dong, Yanmei Zhang, Gang Yu, Shaoxia Li, Xiuli He, Zhiyong Li, and Baohua Liu
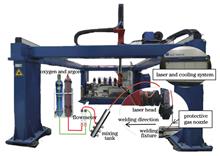
ObjectiveLaser welding of dissimilar metals is an important welding method, which is widely used in aerospace, automobile manufacturing, electronics, battery energy, and other industries. In laser welding, the active element oxygen in air is inevitably absorbed by the weld pool, but in some welding technologies, specific quality adjustments can be made by adding oxygen to wires. Some scholars have studied the effects of oxygen on the weld pool flow, weld pool size, and laser welding properties. However, the effects of oxygen on laser welding of dissimilar metals are reported, especially the effects of oxygen on the weld morphology, microstructure, and properties of dissimilar metal with large different thermal-physical parameters, chemical compositions, and mechanical performances. Here, 304 stainless steel (304SS) and nickel are selected for the experiments of laser welding of dissimilar metals. The effects of oxygen content in the shielding gas on weld pool morphology and dimension, solidified microstructure, alloy element dilution, and mechanical properties are analyzed. This research provides useful references for the utilization and protective effect of active element oxygen in laser welding of dissimilar metals and the performance regulation of welded joints.MethodsThe experiments are conducted on a five-axis numerical control machining robot, using a continuous fiber laser with a wavelength of 1060 nm. A protective gas mixing device is designed to realize the quantitative mixing of oxygen and argon. The 304SS and pure nickel plates (40 mm×30 mm×1.3 mm) are used as the experimental materials. The welding experiments are first conducted under the mixed shielding gas of oxygen and argon, and the volume fraction of oxygen changes from 0, 8%, 16% to 21% (volume fraction) in the parametric study. Then, the weld pool morphology, solidified microstructure, and alloy element distribution of the obtained metallographic samples are observed by optical microscopy, scanning electron microscopy (SEM), and energy dispersive spectrometer (EDS), respectively. Finally, the material testing machine is used to test the tensile strength.Results and DiscussionsThe cross-sectional morphology of weld has the obvious geometric asymmetry, in which the melted area and melted depth at the 304SS side are large. With the increase of oxygen content, the weld width decreases, but the weld depth and melted area increase (Fig. 5). Besides, the weld surface is oxidized seriously due to the increased oxygen content (Fig. 4). When oxygen is mixed into the shielding gas, the surface tension coefficient changes from negative to positive, resulting in the change of the flow mode of the weld pool. As a result, the energy absorbed by the liquid metal from the laser is transported to the bottom of the weld pool, which reduces the width and increases the depth of the weld pool. The smaller thermal conductivity and liquidus temperature of 304SS lead to a deeper and larger weld pool as well as a larger melted area at the 304SS side. The value of the morphological parameter G/R [the ratio of temperature gradient (G) to solidification rate (R)] at the bottom of the weld pool is larger, and the columnar dendrites exist in the cases of 21% oxygen and pure argon. From the bottom to the top of the weld pool, the G/R decreases slowly in the case of pure argon, and the top is the mixed dendrites of columnar dendrites and equiaxed dendrites. In the case of 21% oxygen, G/R decreases rapidly, and the top is the equiaxed dendrites (Fig. 6). The cooling rate GR in the case of 21% oxygen is also large, and the microstructure is fine. Due to the smaller scale of microstructure, the microhardness (Fig. 8) and tensile strength (Fig. 9) are high in the case of 21% oxygen. Additionally, the presence of oxygen might produce metal oxides to further improve the microhardness of the weld. Due to the concentration gradient, the alloy elements diffuse from the matrix at both sides to the middle of the weld pool. In the case of 21% oxygen, the convection flows from the fusion boundary to the center of the weld pool, which is consistent with that for the element diffusion, and promotes the dilution of different elements to the center. Thus, the element mixing in the case of 21% oxygen tends to be more uniform. In the case of pure argon, the results are opposite (Fig. 7).ConclusionsIn present study, laser welding experiments are conducted on the 304SS and nickel plates under mixed protective atmosphere with different oxygen contents and the effects of oxygen content on weld morphology, microstructure, and properties are analyzed. Because of the active element oxygen, the direction of Marangoni convection changes to be opposite, the shape of weld pool also changes from shallow and wide to deep and narrow, and the area of weld pool extends. In the case of 21% oxygen, the distributions of alloy elements are more uniform. The solidified microstructure is mainly the equiaxed dendrites on the top of weld pool and the columnar dendrites at the bottom. In the case of pure argon, the microstructure in the top area is the mixed crystal of equiaxed dendrites and columnar dendrites, in contrast, and that at the bottom is columnar dendrites. Due to the fine microstructure of the weld, the microhardness in the case of 21% oxygen is higher than that in the case of pure argon. However, with the increase of oxygen content, the weld surface quality becomes worse. Therefore, the welding quality can be controlled to a certain extent by adjusting the oxygen content in the shielding gas. With the increase of oxygen content in the shielding gas, the driving force and flow mode of liquid metal convection in the weld pool change, which increases the depth and melted area of weld pool and makes the asymmetry of weld pool at both sides more obvious. Furthermore, when the oxygen content increases, the metal elements are mixed more uniformly, and the microstructural morphology is almost unchanged. However, the microstructural size decreases, and the microhardness and tensile strength increase.
Jan. 01, 1900Vol. 49 Issue 16 1602004 (2022)
Shasha Zhang, Baopeng Zhang, Wenqi Zhang, Huanqing Yang, Wei Zheng, Yun Wang, Dongjian Peng, and Haihong Zhu
ObjectiveHigh strength and high conductivity copper alloy has high thermal conductivity and high strength simultaneously. Its complex parts are widely used in aerospace, petrochemical engineering, weaponry, oceanographic ship, and other fields. In the past decades, additive manufacturing such as selective laser melting (SLM) has gained increasing attention to fabricate metal parts due to the abilities of design freedom, near-net or net shape production, efficient use of materials, and fabrication of complex geometries. Due to the extremely high laser reflectivity and thermal conductivity, there are a few researches on high strength and high conductivity copper alloy fabricated by SLM. In this paper, a high power fiber laser with the maximum power of 2000 W is used to the SLM QCr0.8 copper alloy. The influence of process parameters on the densification behavior of the SLM QCr0.8 alloy is first studied. Then, the optimal process parameters are obtained. Finally, the microstructure and properties of the SLM QCr0.8 alloy are investigated.MethodsGas atomized QCr0.8 copper alloy powders with spherical shape are chosen as the starting material. The SLM system at Wuhan National Laboratory for Optoelectronics, Huazhong University of Science and Technology (HUST) is used to manufacture the QCr0.8 alloy samples. The post-heat-treatment condition of the samples is annealing at 480 ℃ for 4 h followed by furnace cooling. The samples are made by the standard metallographic process and their densities are measured by the image method. The microstructures of the samples are characterized by the optical microscope, the scanning electron microscope, and the transmission electron microscope. The phase structures are tested using X-ray diffraction. The samples are examined using the tester to evaluate the tensile properties at room temperature. After the tensile test, the fracture morphologies are characterized by the scanning electron microscope. The electrical resistances are taken using the resistance tester.Results and DiscussionsWith the increase of scanning speed, the density of samples first increases slightly and then decreases (Fig. 2). When scanning speed is too low, the defect type is round pores. When scanning speed is too high, the defect type is irregular pores (Fig. 3). With the increase of hatching space, the density of samples increases and then decreases (Fig 4). The optimal process parameters are laser power of 2000 W, scanning speed of 600 mm/s, hatching space of 0.20 mm, and layer thickness of 0.05 mm. By using these optimal process parameters, a density of 99.9% can be achieved for the SLM QCr0.8 alloy. The microstructure in the XOZ plane is columnar crystal growing along the building direction. The microstructure in the XOY plane can be divided into a fine grain region and a coarse grain region (Fig. 7). The fine cellular crystal structure can be observed by scanning electron microscope (SEM). The main phase observed by X-Ray diffractometer(XRD) is α-Cu (Fig. 6). However, Cr phase and Cr2O3 phase can be observed by the TEM micrographs. The average size of precipitates is 30 nm (Fig. 10). For the annealed samples after forging, the microstructures are equiaxed crystals with a grain size of 4060 μm. A large number of granular or long strip precipitates can also be observed in the microstructures, and the size of precipitates is 230 μm (Fig. 8). The tensile strength, yield strength, elongation, and electrical conductivity of the SLM QCr0.8 samples are 234.7 MPa, 173.9 MPa, 26.0%, and 37.8% of international annealed copper standard (IACS), respectively. After the aging treatment, the tensile strength, yield strength, elongation, and electrical conductivity are 468.0 MPa, 377.3 MPa, 19.2%, and 98.3% of IACS, respectively (Table 2). The fracture morphologies show that the tensile samples are ductile fractures (Fig. 12).ConclusionsWhen the process parameters are not suitable, the round pores and irregular pores coexist. The former appears when the input laser energy is too high, while the latter appears when the input laser energy is insufficient or the hatching space is too small. After optimizing the process parameters, the optimal density is 99.9%. Because the forming process and the cooling rate of SLM are different from those of forging and annealing. The microstructures of the SLM samples are different from those of the annealed ones after forging. The microstructures of the SLM samples are columnar crystals growing along the building direction, while those of the annealed samples after forging are equiaxed crystals. For the SLM samples, the size of precipitates is about 30 nm. For the annealed samples after forging, the size of precipitates is 230 μm. The tensile strength and yield strength of the SLM samples are higher than those of the annealed samples after forging. However the elongation and electrical conductivity of the SLM samples are lower than those of the annealed samples after forging. After the aging treatment, Cr phases precipitate from the Cu matrix and the strength and conductivity are improved, however the elongation is reduced. This study can promote the development of the SLM copper alloys with high strength and high thermal conductivity. A new method to fabricate the high strength and high thermal conductivity copper alloy parts with complex shapes can be developed.
Jan. 01, 1900Vol. 49 Issue 16 1602005 (2022)
Xin Du, Baixin Qi, Zhenjia Zhao, Tong Zhang, Qiang Wu, Jianglin Zou, and Rongshi Xiao
ObjectiveAs a refractory alloy, Ta-10W has the advantages of high melting point, good high temperature strength, and low linear expansion coefficient. It has a good application prospect in the manufacturing of components under high thermal service conditions in the aerospace field. However, the traditional welding methods such as electron beam welding and argon arc welding have high costs and large heat input, so it is difficult to obtain high-quality Ta-10W joints with them. In contrast, this material has a high absorptivity and the fiber laser can be implemented in the atmospheric environment, but the relevant work has not been reported. In this paper, the effect of fiber laser welding parameters on weld morphology is studied, the butt-welding process test is carried out, and the structure and properties of the joint are analyzed.MethodsThe welding equipment adopts a YLS-6000 fiber laser with focusing parameter of Kf=8 mm·mrad, wavelength of 10601070 nm, transmission fiber core diameter of 200 μm, collimating lens focal length of 200 mm, focusing lens focal length of 300 mm, and focusing spot diameter of 0.3 mm. The Ta-10W refractory alloy sheet is selected as the test material. The size of the plate scanning sample is 50 mm×20 mm×4 mm, and the thickness of the butt-welding sample is 3 mm. In the welding process, argon gas is used as the shielding gas, and the back protecting tool and the protective nozzle are used as the two-way protection. When the plate is scanned, the welding speed and laser power are also changed. The welding parameter is 4 kW, the welding speed is 2 m/min, and the defocusing amount is 0 mm. The changes of the molten pool and the welding spatter are observed with a high-speed video camera. In the high-speed photography, an 808 nm band light source is used as the molten pool illumination light. The microstructure of the welded joint is analyzed, and the micro-hardness of the welded joint is tested. The tensile specimens are prepared to test the mechanical properties at room temperature and high temperature. The microstructure of the joint is observed by the metallographic microscope and the cross section of the tensile fracture specimen is observed by scanning electron microscope (SEM). The micro-hardness of the joint is tested by the hardness tester. The load is 1.96 N and the loading time is 15 s. The tensile testing machine is used to test the tensile properties of welds.Results and DiscussionsThrough the scanning welding of the Ta-10W alloy plate, it is found that the weld depth is negatively correlated with the welding speed under the same power, while the weld penetration depth is positively correlated with the welding power under the same speed. With the increase of welding power, the weld shape gradually changes from a shallow arc shape in heat conduction welding to a nail head shape in deep penetration welding. The penetration depth is about 3 mm when defocusing amount is 0 mm, the welding speed is 2 m/min, and the laser power is 4 kW. There is no obvious oxidation on the surface of the butt joint, which is bright white and well formed. However, due to the high melting point of the base metal, the short weld pool length, the serious spatter phenomenon, and the little spatter on the plate surface, the spatter is solidified before falling back to the base metal. The grain shapes and sizes at different positions in the weld center are quite different. The grains at the upper position are fine equiaxed grains with a diameter of tens of microns, a length of hundreds of microns, and a width of tens of microns perpendicular to the thickness direction of the plate. The micro-hardness test of the joint shows that the micro-hardness of the weld zone fluctuates greatly, and the average hardness is about 294 HV, slightly higher than that of the base metal (280 HV). This is related to the heating condition and the grain size refinement near the fusion line. The results of the tensile test at room temperature and high temperature show that the average tensile strength of the joint is 506.5 MPa, 92.1% of that of the base metal, the average tensile strength of the upper part of the weld at 1500 ℃ is 140.1 MPa, and the average tensile strength of the lower part of the weld is 141.6 MPa. The fracture analysis shows that the fracture is an intergranular and cleavage mixed fracture at room temperature, and an inter-granular fracture at high temperature.ConclusionsIn the focused state, the critical power of deep penetration for multimode fiber laser welding of Ta-10W alloy is in the range of 1.52.0 kW when the welding speed is 23 m/min. In the deep penetration state, the weld shape is a nail head shape. There is large splash and it is difficult to adhere to the plate surface. When the power is 4 kW and the speed is 2 m/min, the 3 mm thick Ta-10W butt joint is well formed. Along the weld depth direction, there is a large gap in the grain morphology at the weld center, the upper part is slender grains, and the middle and lower parts are equiaxed grains. The micro-hardness of the butt joint is slightly higher than that of the base metal, and the butt joint has good mechanical properties at room temperature and high temperature. The fracture at room temperature is a mixed fracture, and the high temperature port has an inter-granular fracture.
Jan. 01, 1900Vol. 49 Issue 16 1602006 (2022)
Jia Liu, Xiaowei Lei, Zhaowei Ma, Chengxue Fu, Zhanbo Fu, and Zhibo Du
ObjectiveThe excellent comprehensive mechanical properties of Ti-6Al-2Zr-3Nb-Mo titanium alloy have obvious advantages in ship and marine engineering. The research on high-power fiber laser welding of Ti-6Al-2Zr-3Nb-Mo titanium alloy is still in its infancy, and it is of great theoretical and practical significances on improving the development of marine titanium alloy equipment. The research on high-power laser welding of Ti-6Al-2Zr-3Nb-Mo titanium alloy is carried out, and high power fiber laser welding can achieve good results of one-time penetration and one-side welding or two-side forming. It belongs to the leading level in China. The morphology, microstructural distribution and properties of laser welded Ti-6Al-2Zr-3Nb-Mo joints are studied in detail, which provides a theoretical basis for subsequent engineering applications.MethodsThe high-power laser welding of Ti-6Al-2Zr-3Nb-Mo titanium alloy is studied by using high-power fiber laser equipment. The welded joints with excellent quality and beauty are obtained. The residual stress on the surface of the welded joint is tested by using the XL2118A16(U) static resistance strain gauge with the blind hole method. The round bar tensile test is carried out on the STNTECH20/G material testing machine. The side bending test is carried out on the BHT5106 electro-hydraulic servo bending tester. The standard V-shaped impact test is carried out on the ZBC2302-C pendulum impact tester. The microhardness test is carried out on the automatic Vickers hardness tester with a load of 5 kg and the loading time of 30 s. The microstructure of the joint is analyzed by the OLYMPUS GX71 optical microscope. The microstructure of the joint is analyzed under the Quanta650 scanning electron microscope. The fine microstructure of the welded joint is observed by the JEM-2100 transmission electron microscope.Results and DiscussionsFor the 16 mm thick Ti-6Al-2Zr-3Nb-Mo titanium alloy sheet, high power fiber laser welding can achieve good results of one-time penetration and one-side welding or two-side forming. The overall surface morphology of the welded joint is good with silver white or light yellow. And there are no pores, slag, unmelting, incomplete penetration, cracks, and other defects in the weld (Table 4). The microstructure of the base metal is a typical α and β duplex structure, which is composed of primary α phase and lamellar α transformed β phase. The microstructural distribution is uniform (Figs. 5-7). The weld has a columnar crystal structure. The coarse original grain boundary of β phase is retained. The internal metallographic structure is composed of acicular martensite α′ phase and a small amount of intergranular α phase. The acicular martensite α′ phase is cluster-like and arranged in a certain direction. The microstructure is fine and dense. The spacing is small, which is characterized by "Widmanst?tten structure" or "basketweave" (Figs. 8-10). The metallographic structure of the heat affected zone is mainly composed of coarse block α and lamellar α transformed β phase. The lamellar structure is composed of needle-like α phase, lamellar β phase, and a small amount of needle-like martensite α′ phase. The lamellar structure is cut and interlaced with each other, which shows the characteristic of "basketweave" (Figs. 11 and 12). The residual stress of the welded joint is far lower than the yield strength of the material, mainly concentrated in the range of 5 mm near the weld and the heat affected zone. Its distribution characteristics are in line with the characteristics of high energy density and low deformation of laser welding (Fig. 14). The welded joint has stable mechanical properties, ductile fracture, and tensile strength of up to 936 MPa, higher than that of the base metal (Table 4 and Fig. 15). The microhardness of the weld root is slightly low, and those at other positions are almost the same. There is little difference in room temperature impact properties (the maximum difference of 6 J), where the weld impact energy absorption followed by that of the heat affected zone is the highest, and that of the base metal is the lowest (Table 5 and Fig. 19).ConclusionsThe laser welding of Ti-6Al-2Zr-3Nb-Mo alloy is studied. The single-side penetration welding and double-side forming welding process of 16 mm thick Ti-6Al-2Zr-3Nb-Mo alloy test plate is obtained. The microstructure, mechanical properties and process properties of the laser welded joint of Ti-6Al-2Zr-3Nb-Mo alloy are tested. The results show that the surface of laser welded joint of Ti-6Al-2Zr-3Nb-Mo alloy is well formed. The surface is silver white or light yellow, and there is no defects in the weld. The weld seam has a columnar crystal structure, and the original grain boundary of the coarse β phase is retained. The internal metallographic structure is composed of the acicular martensite α′ phase transformed by the whole lamellar β phase and a small amount of intercrystalline α phase. The acicular martensite α′ phase is arranged in a certain direction and has a cluster shape. The microstructure is fine and the spacing is small. The microstructure of the heat affected zone is mainly composed of coarse block α and lamellar α transformed β phase. The lamellar microstructure is composed of needle-like α phase, lamellar β phase, and a small amount of needle-like martensite α′ phase. The lamellar microstructure is cut and crisscrossed with each other. The residual stress distribution of welded joints is mainly concentrated in the weld and the heat affected zone. The mechanical properties of welded joints are stable, and the tensile strength is higher than that of the base metal. The tensile fractures are ductile rupture. The impact absorbing energy of the weld and the heat affected zone are higher than that of the base metal. High power laser welding of titanium alloy has a good application prospect.
Jan. 01, 1900Vol. 49 Issue 16 1602007 (2022)
Chenyang Wang, Qin Lin, Chao Lü, Fangwei Wang, Liu Lü, Feng Wang, and Xiao Yuan
ObjectiveDue to the dependence of absorption on wavelength and temperature as well as the high thermal conductivity of copper, the laser welding of copper with a 1 μm infrared (IR) laser beam generally shows clear instability, splashes, and poor surface morphology. Thus, blue and green lasers were used to weld copper and excellent welding quality were obtained for the high absorption of copper in short wavelength. Currently, the cost of the red and green lasers is significantly high. Hence, considering the cost and welding quality, we employed an IR nanosecond MOPA fiber laser with a power and wavelength of 120 W and 1.07 μm, respectively, to weld the copper sheets using a fiber-coupled blue diode laser with a power and wavelength of 100 W and 450 nm, respectively. The function of the blue laser is to preheat the surface of the copper sample to increase the effective absorption of the IR laser and slow the cooling process to help the expulsion of bubbles. As expected, surface morphology and tensile force of welded copper sheets are improved, and almost no splashes and microholes can be observed inside the pool in the welding area.MethodsA dual-wavelength coaxial beam-welding system was designed. Two collimated beams from an IR MOPA fiber laser and a fiber-coupled blue diode laser were coaxially combined using a dichroic mirror, and further were focused on the workpiece using a galvanometer scanner and a dedispersive telecentric f-θ lens. The weld position on the workpiece was controlled by scanner 2. Another galvanometer scanner, scanner 1, was inserted between the collimator of the IR MOPA beam and the dichroic mirror to control the movement of the MOPA beam inside the blue spot to achieve different welding modes, such as swing and spiral. In the experiments related to the tensile test, each workpiece sample was welded to four spots in a square-like pattern with a 2 mm pitch. The diameter of each welding spot is about 350 μm. Copper sheets with a thickness of 100 and 200 μm were welded onto a copper sheet with a thickness of 250 μm, which were marked as samples 1# and 2#, respectively. The welding process is as follows. (1) Turn on the blue laser to start the preheating process. (2) After the preheating time (T1), turn on the IR MOPA laser to start the welding process. The MOPA beam was scanned along a spiral line to form a 350 μm welding spot, which was then turned off. (3) Keep the blue laser on a warm-holding time, T2,to maintain the molten pool at a relatively high temperature, and cool it down naturally further. The preheating and warm-holding time dependencies and the blue and IR laser power dependencies of the joint tension were measured. The IR power dependency of the joint tension with and without blue-assistant welding was also compared. Finally, the surface quality of the weld spots and the microstructure of the molten pools were observed, compared, and explained.Results and DiscussionsThe optimal preheat time, T1,is approximately 20 and 30 ms for samples 1# and 2# at the blue laser power of 50 and 60 W, respectively; the optimal warm-holding time, T2,for both samples 1# and 2# is 50 ms. A proper warm-holding time is essential for expelling bubbles from the molten pool, which increases tension. However, an excessive preheating or holding time will slightly decrease the welding tension due to the coarsening of grains in the molten pool. A 30 W blue laser-assisted 70 W IR MOPA laser welding process achieves the best tensile force (76.5 N), whereas a 110 W MOPA laser welding process achieves a tensile force of only 58.6 N. The blue-assisted MOPA laser welding shows higher welding strength and laser efficiency than the only IR MOPA laser welding. Moreover, the blue-assisted welding significantly improved the splash and surface quality (Fig. 6). From the observation of the cross-section of the blue-assistant welding molten pool using metallographic and scanning electron microscopy (Figs. 7 and 8), we can obtain the following results: (1) the zigzag shape of the molten pool of the blue-assisted welding is not obvious; (2) the internal holes of molten pool are significantly reduced; and (3) the grains in the molten pool are slightly coarsened.ConclusionsThe blue laser assists the IR MOPA fiber laser to weld pure copper sheets through the preheating and warm-holding processes. The welding quality is significantly improved compared with the only IR MOPA fiber-laser welding. The welding strength is increased to 1.31 times. There are no splashes and obvious surface voids on the weld spot surface, and the surface granularity is considerably improved, which benefits from the effective preheating using blue light. The multi-sawtooth molten pools tend to fuse, and the widespread and numerous micropores in the interior are eliminated, which is attributed to the exhaust effect during the warm-holding process using the blue light. The blue laser-assisted IR MOPA laser welding can significantly improve the welding quality of copper sheets.
Jan. 01, 1900Vol. 49 Issue 16 1602008 (2022)
Jing Li, Juping Cong, Nan Guo, Xin Du, Jingran Zhang, and Feng Du
ObjectiveSuperhydrophobic surfaces are corrosion-resistant and have excellent anti-icing, anti-fogging, and anti-fouling properties. They have the potential for broad applications in machinery manufacturing, industrial production, electronic information, and other fields. However, while in use, the material surface is easily affected by dust and other pollutants so that its performance decreases. Therefore, it is necessary to develop superhydrophobic surfaces with self-cleaning and low adhesion properties. At present, this kind of composite functional surface is mainly realized by constructing micro-nano structures combined with low surface-energy chemical modifications. These processing methods greatly improve the hydrophobic performance of metal surfaces; however, they limit the working conditions because of the need for terminal low-energy modification conditions. Therefore, it is urgent to adopt simple and efficient methods for preparing high-performance composite metal surfaces. Laser processing methods have advantages such as a wide range of applicability, convenient operation, and non-contact implementation; moreover, they are highly adjustable and yield high processing accuracy for the micro-nano processing of materials. In this study, a biomimetic micron-scale structure was constructed on the surface of an aluminum alloy by a laser ablation method, and a superhydrophobic low viscosity self-cleaning surface was obtained by adjusting the laser processing parameters (Fig.1).MethodsIn this work, the unique structure of butterfly wings was used as the model for a biomimetic grid; the grid groove structure was prepared on the surface of a sandblasted, coarse-grained aluminum alloy by laser processing. The surface structure of the biomimetic metal sample was optimized by adjusting the laser processing spacing. The surface morphology, chemical composition, and surface wettability of the materials were characterized by scanning electron microscopy (SEM), laser scanning confocal microscopy (LSCM), X-ray photoelectron spectroscopy (XPS), optical contact angle measurements, and high-speed imaging.Results and DiscussionsThe results show that: (1) After coarsening by sandblasting, the surface of the specimen formed a micron-grade sheet structure. To obtain a controlled roughness, the primary structure was formed by a high-energy laser beam that transformed the sample surface into a complex grid structure composed of a coarse basement and grooves forming the secondary structure. With the increase of separation between the laser processing paths, metal spatter accumulated at the edge of the gridded groove, forming an integrated, interconnected, three-stage structure with staggered grooves (Fig.2). (2) The experimental contact angle measurement results show that the maximum static contact angle of the biomimetic sample surface reached 162.6° when the laser processing interval was 50 μm. The hydrophobicity of the biomimetic sample surface occurs because the microstructure formed by laser processing increases the gas-phase proportion of the solid surface. The dynamic contact angle test on the surface of the biomimetic sample shows that the best rolling angle (less than 5°) was achieved when the laser machining distance was 50 μm. The droplet slide test and droplet bounce test show that the sample has good low adhesion properties (Fig.3 and Table 1). (3) Two different pollutants, solid-phase dust and solid-liquid mixed mud, were selected for the self-cleaning tests of the sample surface, and the sample surface showed a good self-cleaning effect (Fig.4). (4) The samples were analyzed by XPS before and after the laser processing. Comparing these results shows that the number of nonpolar groups (i.e., C—C bonds) on the surface of the biomimetic sample increased compared to the polished sample. Since the nonpolar groups play an important role in improving the hydrophobicity, these results suggest that the compounds adsorbed from the air after laser processing are mainly nonpolar compounds. Therefore, the surface hydrophobicity of the biomimetic sample is greatly improved (Fig.5). (5) The mechanism of adhesion force was analyzed in detail by mechanical modeling, and it was found that the adhesion force was proportional to the contact area of the droplet-solid interface. When the laser processing interval was 50 μm, the contact area of the droplet-solid interface on the surface of the biomimetic sample was the smallest, and the adhesion force was the lowest (Fig.6).ConclusionsIn this study, a multi-layer grid structure similar to the scales of a butterfly wing was constructed on the surface of an aluminum alloy by laser ablation of a surface that had been previously roughened by sandblasting; a functional surface with superhydrophobicity, low adhesion, and self-cleaning properties was obtained. It appears that a surface with appropriate multistage structural characteristics can retain more air in close proximity to the surface of the aluminum alloy material surface; this "air effect" is responsible for the superhydrophobicity, low adhesion, and cleaning effect. The adhesion properties of the laser ablated biomimetic surface were studied by analyzing the bouncing behavior of droplets on different surfaces under the same conditions and by observing the sliding phenomenon as a function of inclination angle; the laser ablated surfaces have significantly lower adhesion than the polished surface. In addition, the experiment using dust and mud to simulate environmental pollution shows that when the biomimetic sample was placed at a 5° tilt angle, water droplets falling on the surface rolled along the tilt direction under the action of gravity without wetting the surface and removed the dust impurities attached to the surface. The sample was also placed into homemade mud, and the surface of the sample was found to be clean after removal, showing a very good non-wetting and self-cleaning effect. The mechanical analysis of the droplet on the surface of the inclined sample shows that, in the multistage structure with 50 μm separation between laser ablation lines, the droplet had the minimum adhesion force and could roll easily, thereby removing pollutants; this verifies that the sample has low adhesion and good self-cleaning performance. This biomimetic composite surface has the potential to contribute in the areas of desorption, drag reduction, and self-cleaning.
Jan. 01, 1900Vol. 49 Issue 16 1602009 (2022)
Chang Liu, Changrong Chen, Qianting Wang, Guofu Lian, Xu Huang, Meiyan Feng, and Jicheng Dai
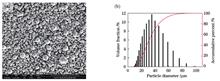
ObjectiveTo prevent damage caused by stress-shielding effect, the Young’s modulus of a designed implant must be controlled at 3-30 GPa. Therefore, a porous structural design is necessary to adjust the Young’s modulus (110 GPa) of selective laser melted Ti-6Al-4V and to satisfy the mechanical properties of implants. The porous structure is necessary for appropriate Young’s modulus, extremely high strength and toughness, tissue growth, and biocompatibility. To obtain optimal mechanical properties, controlling the gradient porosity and gradient cell distribution is important. Gradient porosity was introduced in the model design. The stress concentration among the cells with different porosity gradients, powder flowability, and compressive mechanical properties were determined using the variant porosity gradients. Low-porosity units were used to optimize the porosity and mechanical properties, which were arranged in a high shear-strength zone located at 45°-53° and perpendicular to the Y-Z plane.MethodsThe macroscopic morphology and particle-size distribution of powders were assessed using scanning electron microscopy and analyzed using ImageJ, as shown in Figs. 1(a) and (b). The chemical compositions of the powders provided by the supplier are listed in Table 1. The substrate plate was made of Ti-6Al-4V to enhance the bonding strength. Two types of porous cells, i.e., primitive (P) and gyroid (G) cells, with 40%, 45%, and 50% porosity, were designed and built. The compressive samples was set to 6×6×6 cells according to according to the ISO 13314—2011 standard. The gradient porosity was distributed at a position perpendicular to the Y-Z plane and at 45° from the X-Y plane to improve the mechanical properties. The phase composition of the powders and printed samples were detected using X-ray diffraction. The stress concentration was calculated using the CAE-STANDARD solver. The optimal gradient porosities were determined based on the position of the stress concentration and strain. The powder-flowability analysis of each porous cell was simulated using Fluent. We assumed that the Ti-6Al-4V powder was in a discrete phase that would be bounced back from the wall, and air was solved using the STANDARD k-ε turbulence model. Subsequently, the gas-solid mixed flow model was obtained.Results and DiscussionsP scaffolds with a 5% gradient porosity are best for subsequent model design and compressive testing. Simultaneously, G scaffolds with uniform porosity provide the best stress and strain distribution (Figs. 8-10). Because of the strut distribution and extremely strong connectivity of the porous structure, the G cell exhibits a uniform air-pressure distribution and stable powder-discharge speed when the porosity reaches 50% and 45%, respectively (Figs. 11 and 12). Each mechanical property of the P scaffolds is considerably superior than the G scaffolds (Fig. 20). According to the simulation results (Figs. 8-10), few stress concentrations occur in the P scaffolds, and the plastic-strain distribution caused by the deformation is uniform, which corresponds to better mechanical properties of the P scaffolds during the actual compression process because of the influence of the cell-strut type, degree of bending of the minimum strut size [Fig. 14(b)], and effective strut size (Fig. 8). We can observe that the yield strength is completely consistent with the minimum strut size [Figs. 14(b) and 20(b)], indicating that the minimum strut size of the support shaft considerably affects the yield strength.ConclusionsStatic simulation of the porous structure with a 5% gradient porosity shows that a even stress distribution occurs in the P and G scaffolds, which can well satisfy the implant requirements of internal printing quality and mechanical properties. Simultaneously, the larger pore size of the P cell makes the powder-discharge capacity stronger. From the analysis of the mechanical properties of each gradient porous structure, we find that a larger effective strut size of the P scaffolds leads to a uniform stress distribution, which greatly promotes the mechanical properties. From the compression test of the P and G cells, because of the reasonable stress concentration and increased density of the cell at the 45° position, the 45%-50% gradient porosity structure demonstrates a substantial improvement in the mechanical properties compared with the 50% uniform porosity structure. When the porosity gradient continues to increase, a serious stress concentration owing to unit dislocation causes the overall mechanical property to decrease.
Jan. 01, 1900Vol. 49 Issue 16 1602010 (2022)
Xiuhang Liu, Yuhui Huang, Yanxi Zhang, and Xiangdong Gao
ObjectiveFor decades, laser-arc hybrid welding has gained remarkable attention as a reliable technology for material joint processing. It has been applied to various fields of the manufacturing industry due to several characteristics, such as deep penetration, high welding speed, and high-quality shaping. In the laser-arc hybrid welding process, the change in parameters may deeply influence the weld formation. To detect weld defects or monitor the quality of welding beads, several scholars have studied and explored the correlation between welding features and quality. Thus, numerous studies have investigated the relationship between metallic vapor features and molten pools. Among these features, weld width is a crucial evaluation criterion for welding quality and stability. It is commonly acknowledged that high-speed cameras are widely used to capture all types of features during laser-arc hybrid welding. This study presents an online detection of weld width based on the Kalman filter algorithm (BP-KF), which is compensated by a back-propagation neural network and can detect accurate weld width in a strong noise laser-MIG hybrid-welding environment. We assume that our innovative approach can provide the basis for online detection of a laser-arc hybrid-welding process.MethodsThe laser-MIG hybrid-welding detection system was established using a high-speed camera, arc welding machine, power fiber laser, and an image processing personal computer. During laser-arc hybrid welding, a high-speed camera was used to collect an image of a molten pool outline. Note that image processing is crucial for obtaining the width of the molten pool from an image. First, a molten pool area was defined and extracted by processing the sequential images emerging from the camera. Next, the end of the molten pool was identified by the difference of gray value in the image, and the keyhole was used to mark the position of the molten pool. After segmenting the image using a watershed algorithm, the width of the molten pool can be measured using the conversion from the pixel to the unit of distance. A high-precision laser scanner was used to scan the three-dimensional contour of the weld, and the width of the weld contour was obtained using the second-order difference method, which was used as the approximate true value of the weld width. According to the state and measurement equations of the laser-MIG hybrid welding width detection system, the weld width was estimated using visual sensing and colored measurement noise Kalman filter (KF) algorithm. Finally, the Kalman filter gain, new information, and difference between the predicted value and the Kalman optimal estimation were taken as the inputs. After obtaining the difference between Kalman optimal estimation and true weld width, the Kalman optimal estimation of the weld width was compensated by the BP neural network to improve the accuracy of weld-width detection.Results and DiscussionsBased on the comparison of the measured weld width and true values, both values with observable differences had the same variation tendency (Fig. 6). To decrease the errors between the measured and true weld width values, the colored measurement noise Kalman filter algorithm was adopted to restrain errors from noise. However, the Kalman filter algorithm could not further eliminate these errors. Therefore, to enhance accuracy, the BP neural network was used to predict nonlinear errors caused by the fluctuation of the molten pool. After comparing the weld width values with true weld width, KF, and BP-KF, we observed that the values from BP-KF were generally closer to the true values than those from KF (Fig. 7). The absolute errors between the true values and values from KF or BP-KF were calculated, BP-KF absolute errors were less than that of KF, which indicates that BP-KF can further decrease the errors between measurements and true values (Fig. 8). Based on the abovementioned difference, the errors from the molten pool measurement, KF, and BP-KF were analyzed. It was crucial to demonstrate that weld width errors from BP-KF were less than others, such as max, mean-absolute, root-mean-square, and mean-absolute percentage errors (Table 1). Particularly, the weld width detected by BP-KF can satisfy the demands of manufacturers.ConclusionsThis study successfully adopts the watershed image segmentation approach to extract weld width in a strong noise laser-MIG hybrid-welding environment. Based on the relationship between the width of a molten pool and true weld width, colored measurement noise is recognized as a source of errors, and the Kalman filter algorithm is suitable for eliminating noise errors. In addition, complex fluxion of a molten pool leads to the nonlinear variation between the width of the molten pool and that of the welding bead, which is another source of errors during laser-MIG hybrid welding. Therefore, a BP neural network is chosen to predict the nonlinear difference between the width of Kalman optimal estimation and the true weld width, so that the errors caused by the fluctuation of the molten pool can be further restrained. Experimental results demonstrate that using a compensating colored measurement noise Kalman filter algorithm, which is compensated by the BP neural network, can reduce weld width detection errors better than other methods and can improve the detection accuracy. Compared with the Kalman filter algorithm, the BP neural network has a good nonlinear mapping ability, which can effectively improve the Kalman filter accuracy for weld width detection.
Jan. 01, 1900Vol. 49 Issue 16 1602011 (2022)
Xingzu Ming, Binrui Fan, Chuying Li, Lei Yuan, Tao Wu, and Rui Ming
ObjectiveFace gears have complex tooth profiles, are difficult to manufacture, demand a high level of technical expertise, and traditional machining accuracy cannot meet production requirements. Therefore, femtosecond laser fine correction face gear was proposed as a new processing technology. In this study, we investigated the multifactor optimization of laser and correction parameters during the femtosecond laser ablation of face gear and presented theoretical guidance for the production field.MethodsFemtoYL-100 all-fiber laser produced an 828 fs femtosecond laser to ablate 18Cr2Ni4WA, a three-dimensional digital video microscope observed the depth of ablation pits, and Hommel profilerHommel T8000 detected tooth surface roughness. First, a single-factor femtosecond laser right-angle S-type scanning was performed to machine the face gear material, and the influence degree and trend of laser correction parameters on the scanning track ablation depth and tooth surface roughness were obtained by combining the theoretical and experimental results. Based on the results, we analyzed and selected the value range of each factor and designed a factor-level table. According to the factor-level table, we performed multiple orthogonal experiments and tested the results of scanning track ablation depth and tooth surface roughness. The results were extremely poor. Furthermore, in the analysis of variance, after combining the two methods, the optimal laser parameters and combination of correction parameters were selected. A regression analysis model was established using the results of orthogonal experiments, and the power function was selected as the criterion model for modeling. After substituting the optimized parameter combination, the prediction results of the scanning track ablation depth and tooth surface roughness were obtained. A simulation model based on the ablation threshold and energy accumulation was established, and the predicted value of the scanning track ablation depth was obtained using MATLAB to solve the problem. Using optimized parameter combination to process the opposite gear material, measuring the scanning track ablation depth and tooth surface roughness, and comparing them with the regression and simulation models' results, the maximum relative error was within a reasonable range, verifying the feasibility of the orthogonal result.Results and DiscussionsAccording to single-factor experiments, the influence trends of laser power, repetition frequency, scanning speed, scanning track spacing, and defocusing distance on scanning track ablation depth and tooth surface roughness are obtained, and the parameter range is reduced. The results show that the energy density of the material increases and gradually reaches the ablation threshold as the laser power increases. Part of the material is vaporized, and the continuous decrease in temperature causes the material to melt into a liquid state, resulting in a pressure difference at the pit bottom, and the liquid material is difficult to discharge from the pit. The ablation depth and tooth surface roughness continue to increase (Fig. 6). As the repetition frequency increases, the number of times the pulsed laser acts on the material surface increases, the energy absorbed by the material increases, and the ablation depth and tooth surface roughness increase (Fig. 7). As the scanning speed increases, the spot overlap rate decreases, the contact between the femtosecond laser and material per unit area decreases, the energy obtained from the material decreases, and the ablation depth and tooth surface roughness decrease (Fig. 8). As the scanning track spacing increases, the lateral cumulative effect of the laser within a certain range intensifies, the ablation depth decreases, the scanning track spacing continues to increase, the energy accumulation degree is greater than the lateral accumulation, the ablation depth approaches linear growth, and the tooth surface roughness continues to increase (Fig. 9). An increase or decrease in the defocus will cause laser scattering, which will reduce the scanning track ablation depth, and the ablation will be incomplete, so when the defocus is 0, the tooth surface roughness is the smallest, and as the defocus amount increases or decreases, the tooth surface roughness will increase (Fig. 10). According to the single-factor results, we narrowed the range of parameters, designed orthogonal experiments (Tables 2 and 3), and used range and variance analyses to obtain optimal parameter combinations (Tables 4 and 5). We established a regression analysis model, used the least-squares method to calculate the orthogonal results, obtained the regression expressions (Tables 6 and 7), and substituted the optimal parameter combination to predict the value of scan channel ablation depth and tooth surface roughness. We also established a simulation model, calculated a material ablation threshold value of 0.1189 cm-2 according to the empirical formula, and used MATLAB to predict the value of scan channel ablation depth after substituting the optimal parameter combination. Experiments were performed according to the optimal parameter combination, and the experimental values of the scanning track ablation depth and tooth surface roughness were obtained. The maximum relative errors of ablation depth and tooth surface roughness from predicted value of regression model were 8.4% and 9.5%, whereas the maximum relative error of ablation depth from predicted value of simulation model was 5.7%, indicating the feasibility of the optimized results within a reasonable range.ConclusionsThe influence trend and degree of laser correction parameters on the ablation depth and tooth surface roughness of a scanning track are determined, and an orthogonal analysis table is established to obtain the optimal parameter combination. We establish a regression model, substitute the optimal parameters to predict the scan channel ablation depth and tooth surface roughness. We also established a simulation model, and use MATLAB to predict the experimental values of the scanning track ablation depth. The optimized parameter combination processing experiment is performed, and the maximum relative errors obtained after comparing the experimental value with predicted values of regression and simulation models are within a reasonable range, proving the rationality of the parameter optimization.
Jan. 01, 1900Vol. 49 Issue 16 1602012 (2022)
Jiaqi Zhang, Yunqi Liu, Shaoxiong He, Ben Liu, and Zongtao Zhu
ObjectiveSteel/aluminum is a widely used lightweight composite material. However, because the difference in the physical and chemical properties between these two metals is large, cracks are prone to appear after welding due to stress concentration, and there exist brittle and hard Fe-Al intermetallic compounds (IMCs) at the joint interface. The mechanical properties of welded joints are seriously influenced by the thickness and grain size of IMCs. It is difficult to obtain high-quality and stable welded joints for the steel/aluminum dissimilar metal connection. Therefore, to obtain high-quality steel/aluminum welded joints is a general demand of the society. The application of ultrasonic waves can increase the flow performance of the molten pool during the welding process and improve the temperature field and flow field of the molten pool. The formation of IMCs is mainly related to the temperature field during the welding process. Therefore, to regulate the temperature field of the molten pool is a powerful tool to improve the mechanical properties of the joints. This experiment investigates the effect of ultrasonic power on the IMCs at the steel-aluminum interfaces of the weld brazed joints.MethodsLaser and melt inert gas (laser-MIG) hybrid welding is used to perform the butt welding of 2 mm thick 6061 aluminum and 304 steel combined with fusion-brazing welding, and ultrasound is introduced in the welding process. The ultrasonic powers set in the experiment are 0 W, 130140 W, 200210 W, and the welded joints under different parameters are obtained. After welding, the metallographic phase is cut, the scanning electron microscope and the built-in energy dispersive spectroscopy (EDS) are used to observe the micro-interfacial structures and micro-area compositions, and the ultra-depth-of-field metallographic microscope is used to observe the grain sizes of the steel/aluminum welded joints. The microcomputer-controlled electronic universal tensile testing machine is used to test the tensile strengths of joints after removing reinforcement, and the experimental results are compared and analyzed to explore the effect of ultrasonic usage on the steel/aluminum fusion brazed joints.Results and DiscussionsComparing the welded joints under three ultrasonic powers, it can be seen from Fig. 3 that as the ultrasonic power increases, the pores in the welded joints appear to gather, grow, and float, and the porosity value in the weld first decreases and then increases, which is mainly caused by the cavitation effect of ultrasound. The effect of ultrasonic breaking can increase the nucleation rate of the molten pool, which in turn refines the grains in the weld (Fig. 4). It is found that ultrasound can significantly reduce the thickness of the IMCs layer and change the composition contents of the IMCs (Fig. 5). As the ultrasonic power increases, the thickness of the IMCs layer decreases, the content of FeAl3 with poor mechanical properties in IMCs decreases, and the content of Al8Fe2Si with a better performance increases, which improves the tensile performance of the joints (Fig. 7). The analysis shows that the samples are all broken on the IMCs layer, and as the ultrasonic power increases, the Al8Fe2Si phase in the section increases and the FeAl3 phase content decreases (Fig. 8). This is because the ultrasound changes the temperature field of the weld pool and subsequently the compositions and thicknesses of IMCs are changed, which improves the performance of joints.ConclusionsThe ultrasonic-assisted laser-MIG hybrid welding can realize the connection of steel/aluminum dissimilar metals, and the ultrasonic power has a significant effect on the porosity of the welded joints. When the ultrasonic power increases from 0 W to 130140 W, the porosity decreases from 0.25% to 0.21%. When the power increases to 200210 W, the weld porosity increases to 0.93% instead. When the ultrasonic vibration is not applied, the average diameter of weld grains is 5.2 μm. When the ultrasonic power is 130140 W, the average diameter of crystal grains is reduced to 4.1 μm. When the ultrasonic power is 200210 W, the average diameter is reduced to 3.4 μm. With the increase of ultrasonic power, the mechanical stirring effect of ultrasound is gradually strengthened, and its effect on the refinement of weld grains is more obvious. With the increase of applied ultrasonic power, the content of FeAl3 phase in IMCs gradually decreases, which in turn increases the tensile strength of welded joints. When the applied ultrasonic power is 130140 W, the tensile strength of the welded joint reaches 172 MPa, which is 12% higher than that of the joint without ultrasound.
Jan. 01, 1900Vol. 49 Issue 16 1602013 (2022)
Rongchao Fang, Jun Zhang, Junhe Zeng, Zhike Song, Yu Fan, Wenbin Peng, and Ze An
ObjectiveThe welding technology that uses lasers as a heat source has advanced quickly in recent years as laser applications have become more popular. Laser welding has various advantages over traditional welding techniques, including minimal heat input, high efficiency, and good quality. Narrow gap laser (NGL) with filler wire will replace existing traditional welding methods as a new thick plate welding method. However, many challenges [hardening of the heat-affected zone (HAZ) and interlayer structure, lack of fusing of the sidewall and interlayer, porosity, and so on] hinder its further development. This study investigated the welding of shaft parts for real construction machinery to address the problem of high groove and machining accuracy requirements in NGL. The wobbling laser process was used to improve the groove gap tolerance and promote sidewall fusion. This study examined and discussed the dissimilar joint between Q355B steel and 35 steel tubes welded using NGL.MethodsTo weld the dissimilar joint of Q355B steel and 35 steel tubes with 22 mm thickness, 1 pass self-melting and 6 passes filling wire were used. According to relevant national standards, the tensile test, bending test, impact test, and microhardness measurement were conducted to evaluate the mechanical properties of joints. The cross-sections of the welded joints were ground, polished, and etched with 4% nitric acid alcohol solution. Weld seams microstructures were examined using an Olympus-GX53 optical microscope and a Quanta 250 field emission scanning electron microscope. The Wilson VH1102 semi-automatic tester was used to measure the microhardness distributions at the welded joints with a load of 0.5 N and a dwell time of 10 s. The YNS 1000 universal testing machine was used to perform tensile and bending tests. The impact test was performed using a Jb-500b pendulum impact testing machine.Results and DiscussionsThere are no detects, such as penetration pores and cracks, lack of fusion for sidewall, and so on, inside the samples after non-destructive testing. The width of HAZ near Q355B has a wider breadth than that of the HAZ near 35 steel. Zone A is the fusing zone of the filling wire around 35 steel, as shown in Fig. 4. This region is mainly made up of a large number of fine acicular ferrite, proeutectoid ferrite, and tempered martensite. The interlayer area is designated as zone B. The top section of the previous weld bead is remelted, and the interlayer fusion line is not visible after cooling. The narrow area outside the fusion line is subjected to the additional heat treatment by next pass welding, which is equivalent to a normalizing treatment and results in grain refinement. Zone B has a lower heating degree than the upper welding wire-filled area, and the cooling rate is slow (Fig. 4).The properties of tensile, impact, and bending specimens have superior qualities to those of basic metal.The microhardness difference of welded joint section is larger, and the hardness of the rear welding zone is greater than that of the weld zone.The actual shaft parts were welded relying on the accumulation of previous experiments. The NGL with wire filling welding method was used to weld the shaft components without pausing by matching the welding parameters with the chuck speed (Fig. 10).ConclusionsIn this study, through the use of ER50-6 welding wire for NGL with filler wire butt welding of 35 steel and Q355B steel, the mechanical properties and microstructure can be analyzed, and the following conclusions can be drawn: (1) By optimizing the process parameters, the 35 steel and Q355B steel pipes were welded using the wobbling laser filler wire welding method, a total of 7 welding passes, the mechanical properties of the welded joints are great, and the tensile, bending and hardness properties are all up to the relevant national standards; (2) The wobble laser welding process is adopted to fully stir the molten pool throughout the welding process to promote and increase pore escape and sidewall fusion. Reduced linear heat input refines the heat-affected zone martensite and increases the content of acicular ferrite and granular bainite. The heat-affected zone structure in the middle layer undergoes a second thermal cycle, the coarse grains are refined, and the hardness is significantly reduced; (3) The narrow gap wobbling laser welding method successfully overcomes the shortcomings such as small groove tolerance and unstable processing, resulting in excellent sidewall and interlayer fusion of the welded joint, and a laser welding process for the narrow gap on the shaft components is proposed.
Jan. 01, 1900Vol. 49 Issue 16 1602014 (2022)
Mengfei Wang, Jie Liu, Yong Peng, and Kehong Wang
ObjectiveThe intermetallic γ-TiAl-based alloy, as a new type of lightweight high-temperature structural material, has the advantages of low density (3.9-4.2 g/cm3), high melting point, high strength, good oxidation resistance, and excellent creep at elevated temperature, and has gained wide attention in the application of high-temperature structural parts for aerospace vehicles and automobile engines. Since in practical applications, such as turbine blades, automotive turbochargers, and exhaust valves, the TiAl-based alloy needs to be connected to its own components or dissimilar metals and the research and development of the connection technology have become the key to the promotion and application of TiAl-based alloy. Diffusion bonding, argon-arc welding, infrared brazing, friction welding, laser beam welding and electron beam welding have been investigated with the aim of producing sound TiAl joints. However, the intrinsic brittleness of TiAl-based alloy often results in cracks, high residual stress, and poor mechanical properties of welds, limiting its more widespread applications in industry and commerce. Considering the poor plasticity of TiAl alloy, the control of welding cracks of TiAl-based alloy has become the keystone of the corresponding research.MethodsThe γ-TiAl based alloy with a chemical composition of Ti-42Al-2.5Cr-1Nb-0.7Si-0.5B is investigated here. The Ti42 is prepared using plasma arc melting in the form of button ingot. The button ingot has been melted for 4 times to improve its homogeneity. The 20 mm×20 mm×2.5 mm plates are taken from the ingot by electro-discharge machining (EDM) and subsequently cleaned and ground with the 800# SiC paper to remove oxides and machining remnants. The welding process is carried out with an IPG Ytterbium fiber laser, and a KUKA robot is used to control the laser beam movement in the x-y-z coordinate system. All plates have gone through three processes: pre-heating, welding, and post-weld heat treatment. The laser welding equipment and the welding process are shown in Fig. 1. The laser power used in the welding process is 5 kW, and the welding speed is 6 m/min. In order to prevent oxidation during welding, nitrogen and argon gases are used as shielding gases, and the effect of shielding gas on welding is investigated. The welds are visually inspected and investigated by X-ray radiographic inspection to detect cracks and porosity. The as-welded specimens are first sectioned, ground, and polished, and then mechanically polished with a vibrating polisher. The microstructure of the welded joint is observed using the FEI Quanta-200 field emission scanning electron microscope in the backscattering (BSE) mode, and the orientation relationship of its microstructure is analyzed using electron backscatter diffraction (EBSD).Results and DiscussionsThe joints welded under nitrogen shielding gas have obvious penetrating cracks inside the joints and the weld surface is poorly formed [Fig. 2(a)]. The use of argon gas as the shielding gas makes a crack-free welded joint realized. The weld surface is well formed, and the weld is in an "X" shape as a whole [Fig. 2(b)]. When nitrogen gas is used as the shielding gas, the TiN phase exists in the top area of the weld. The phase compositions in the bottom area of the weld are α2-Ti3Al phase and γ-TiAl phase when argon gas is used as the shielding gas (Figs. 5 and 6). According to the Ti-Al binary phase diagram, there exists a transformation, β→α, in the alloy with Al concentration (atomic fraction) of 42% (Fig. 3). During the transformation from β to α, the α phase (hexagonal close-packed) and the β phase (body-centred cubic) maintain a specific crystal orientation relationship. This special orientation relationship is called the Burgers relationship, {0001}α∥{110}β and 〈112ˉ0〉α∥〈111〉β (Figs. 7 and 8). The results indicate that when there is no TiN phase in the weld zone, the welded joint is formed well without defects, and the weld zone is composed of Burgers α2 phase. The complete solidification path of the weld zone is L→L+ β→β+ α→α+ γ→α2+ γ. When there is TiN phase in the weld zone, the welded joint produces penetrating crack defects. The main reason is that TiN is a brittle intermetallic compound, which can easily cause cracks during laser welding. The weld zone is mainly composed of TiN dendritic phase and non-Burgers α2 phase. Moreover, there exists a certain orientation relationship between TiN phase and α2 phase: {111}TiN//{0001}α2(Fig. 10). The formation of TiN phase has a grain refinement effect on the weld structure. The complete solidification path of the weld zone is L→TiN+ L→TiN+ β→TiN+ α+ γ→TiN+ α2+ γ.ConclusionsA study on laser welding under different shielding gases is carried out with the Ti-42Al-2.5Cr-1Nb-0.7Si-0.5B alloy as the research object. A laser welding experiment is carried out with this alloy, and the effect of TiN on the phase transformation, texture, and grain refinement of laser welded joints is analyzed and studied. During laser welding of the TiAl-based alloy, the use of nitrogen and argon gases as shielding gases can have a great impact on the microstructure and properties. When using the argon gas, the welding process is stable, and a well-formed and crack-free welded joint is obtained. In contrast, when the nitrogen gas is used, nitrogen enters the melt pool to form the TiN dendrites, and penetration cracks can be easily produced in the joint because TiN is a brittle ceramic phase. The use of nitrogen gas as the shielding gas changes the traditional solidification path of the molten pool liquid metal. During the welding process, nitrogen enters the molten pool and the TiN dendrites are generated. In the subsequent cooling process, the β→α transformation is centered on the TiN dendrites, thus breaking the traditional Burgers orientation relationship and forming the orientation relationship of {111}TiN//{0001}α2. At the same time, the generation of TiN has a grain refining effect on the weld organization. The complete solidification path of liquid metal cooling during the welding process is L→TiN+ L→TiN+ β→TiN+ α+ γ→TiN+ α2+ γ.
Jan. 01, 1900Vol. 49 Issue 16 1602015 (2022)
Lianfu Wang, Yanchao Guan, Ye Ding, Jingyi Li, and Lijun Yang
ObjectiveWith the rapid development of equipment, smart textiles, electric vehicles, and renewable energy generators in flexible electronics, the electrochemical energy storage devices have attracted extensive attention. How to obtain an efficient, stable, and safe energy storage system has become an urgent problem to be solved at present. As a new type of energy storage device, the super-capacitor can provide a high power density and a long service life (> 100000 cycle), so it has become the key research direction in the field of energy storage. However, the application of a super-capacitor is limited by its low energy density. In recent years, the application of the laser direct writing technology to the preparation of energy storage electrodes has become a new research hotspot. Laser-induced graphene (LIG) electrode based on polyimide (PI) films has gradually attracted extensive attention due to its advantages of simple preparation and strong expandability, but its further application is limited by its low energy density.MethodsIn order to improve the electrochemical performance of LIG electrodes, the influence of laser power and scanning speed on the carbonization effect of the PI film is first studied, and the appropriate processing parameters of LIG electrodes are determined. Then, the RuCl3 crystal is sprayed onto the surface of the PI film by ultrasonic spraying, and the LIG/RuO2 composite electrode is prepared by the femtosecond laser direct writing technology. Finally, the super-capacitor is assembled. By means of scanning electron microscope (SEM), energy dispersive spectroscopy (EDS), Raman spectrum, and X-ray photoelectron spectroscopy (XPS), the micro-nano structure and composition of the electrode are analyzed, and the influence of interdigital spacing on the electrode capacitance is studied. By comparing the electrochemical performances of the LIG/RuO2 electrode and LIG electrode, the influence of the combination of RuO2 and LIG on the performance of the super-capacitor is clarified.Results and DiscussionsThrough the single-line scanning experiment, it can be found that the line resistance per unit length decreases with the increase of laser power and the decrease of scanning line speed. Because the laser energy deposited per unit area increases with the increase of laser power and the decrease of scanning line speed, the carbonization degree and depth deepen and the line resistance decreases. The SEM and EDS characterizations show that the electrode surface is a neat laser ablation groove, and the surface structure is still relatively flat. The inner walls of the grooves are all porous structures, which are porous carbon net structures formed after laser-induced carbonization of the PI film. The EDS analysis of the flocculent structure in the LIG/RuO2 composite electrode shows that the main component is C, and the atomic fraction ratio of Ru to Cl is 7.73. Therefore, it can be judged that RuO2 is generated in the flocculent structure by removing a small amount of RuCl3 residues (Fig. 4). The EDS mapping analysis results on the surface of LIG/RuO2 composite electrode are basically the same as those in flocculent structure, but the Ru content decreases, which may be due to the fact that the thermal deposition on the surface is less than that inside the electrode, and the generation of RuO2 is decreased (Fig. 5). The Raman spectral analysis and the XPS analysis of the LIG electrode and LIG/RuO2 composite electrode show that the electrode has a good carbonization degree, and the tetravalent Ru in the XPS peak splitting curve indicates the existence of RuO2 (Fig. 6). Comparing the cycle voltammetry (CV) curves under different interdigital spacings, it can be found that with the decrease of interdigital spacing, the electrode capacitance gradually increases (Fig. 7). Except for the electrode with a 200 μm interdigital spacing, it can be found that the specific area capacitance of the LIG/RuO2 composite electrode is more than 4.5 times that of the LIG electrode (Fig. 8). Through different voltage sweeping CV tests, it can be found that the rate performance of the LIG/RuO2 composite electrode is obviously better than that of the LIG electrode (Fig. 9). In addition, the galvanostatic charge-discharge (GCD) test and the electrochemical impedance spectroscopy (EIS) test of the LIG/RuO2 composite electrode show that it has reversible charge-discharge characteristics and obvious pseudo-capacitance characteristics (Fig. 10).ConclusionsThrough the femtosecond laser direct writing technology, the RuCl3 crystals on the surface of the PI film are transformed into RuO2 nanoparticles and anchored to the surface of porous carbon mesh structure while preparing the LIG electrode, thus the one-step preparation of LIG/RuO2 composite electrode is realized. The SEM and EDS show that RuO2 is formed in the micro-nano structure on the electrode surface after femtosecond laser irradiation, and the Raman spectral test shows that the LIG electrode has a good carbonization effect. With the decrease of interdigital spacing, the specific area capacitance of the electrode gradually increases. Compared with the unmodified LIG electrode, the LIG/RuO2 composite electrode shows good rate performance and ion reaction kinetics. At a voltage sweeping speed of 10 mV/s, the specific area capacitance of the LIG/RuO2 composite electrode super-capacitor is 4.9 mF/cm2, 4.85 times that of the LIG electrode, and the energy density of 0.173 μW·h/cm2 at a current density of 0.1 mA/cm2 is superior. In addition, the constant current charge-discharge test and the impedance spectrum show that the LIG/RuO2 composite electrode has good charge-discharge performance and conductivity. This laser direct writing technology does not need any mask design or auxiliary gases, so it is suitable for simple and scalable preparation of planar miniature super-capacitors.
Jan. 01, 1900Vol. 49 Issue 16 1602016 (2022)
Xuepeng Chen, Lingfeng Zhang, Yi Xiong, Gaoli Luo, and Yongli Wu
ObjectiveTC4 titanium alloy is widely used in the aerospace industry due to its high specific strength and good heat and corrosion resistance. Laser additive manufacturing has the advantages of digital design and manufacturing integration, which can greatly improves the utilization rate of raw materials and is particularly suitable for manufacturing the structural parts of titanium alloy. It has become one of the core technologies to enhance the design and manufacturing capability of high-performance complex components. However, during laser additive manufacturing of titanium alloy, there exists a large temperature gradient between the melt pool and the substrate, which results in the poor comprehensive mechanical properties of formed parts. Therefore, it is very important to find a suitable method to improve the comprehensive mechanical properties and extend the service life. Laser shock peening (LSP) is an important method for the post-treatment of metal parts, which uses a high-power short-pulse laser on the surface of the material to produce compressive residual stresses and work hardening layers, and thus it possesses the outstanding advantages of controllability and significant strengthening effect. In this paper, the effect mechanism of LSP on the microstructure and properties of laser additive manufactured TC4 (LAM-TC4) titanium alloy is systematically investigated by adopting the LSP surface treatment. It is expected to first improve the mechanical properties of the surface layer of the LAM-TC4 titanium alloy, then improve the comprehensive mechanical properties, and finally provide an experimental basis for optimizing the microstructure and mechanical properties of LAM-TC4 titanium alloy.MethodsIn this work, LSP is first applied to the surface of the LAM-TC4 titanium alloy. Then, the physical phases of block samples before and after LSP are analyzed by the X-ray diffractometer (XRD), and the microstructures of block samples before and after LSP are observed by the optical microscope (OM). The block samples before and after LSP are manually ground to 50 μm thick ones with different types of sandpapers and punched into ?3 mm discs. Then they are thinned by the Gatan 691 ion thinning instrument, and the microstructure is further investigated using the JEM-2010 transmission electron microscope (TEM). Finally, the mechanical properties and fracture morphologies of the samples before and after LSP are characterized by the X-ray stress analyzer, the microhardness tester, the tensile testing machine, and the scanning electron microscope (SEM).Results and DiscussionsThe original microstructure of the LAM-TC4 titanium alloy consists of a large number of thick α laths and a certain volume fraction of inter-lath β phases [Fig. 4(a)]. After the LSP treatment, the microstructure of the surface layer is broken and refined by the action of high-energy shock waves [Fig. 5(b)], and a large number of dislocations [Fig. 5(bd)] and deformation twins [Fig. 5(d)(f)] are formed. The LSP treatment changes the tensile residual stress of the LAM-TC4 titanium alloy into the compressive residual stress (Fig. 7). After the LSP treatment, the surface of the LAM-TC4 titanium alloy has the maximum compressive residual stress (-190 MPa) (Fig. 7), the microhardness is increased by 16.5% (Fig. 8), and the microhardness decreases with the increase of depth. In addition, after the LSP treatment, the yield strength and tensile strength of LAM-TC4 titanium alloy are increased by 46.3% and 32.3%, respectively, compared with those of the original sample, and the plasticity remains basically unchanged (Fig. 9). The fracture morphologies of the LAM-TC4 titanium alloy before and after LSP are mainly composed of deep equiaxed dimples, and the fracture mechanism is typical of ductile fracture (Fig.10).ConclusionsThe effect of LSP on the microstructural evolution and properties of the LAM-TC4 titanium alloy is systematically investigated by the surface treatment based on LSP. It is shown that the LSP treatment causes severe plastic deformation in the surface layer of the LAM-TC4 titanium alloy, generates a large number of deformation twins in the surface matrix, the dislocation density increases significantly, and the interaction among various dislocation structures develops to form (sub)grains resulting in grain refinement. The maximum compressive residual stress (-190 MPa) exists on the surface of the LAM-TC4 titanium alloy after the LSP treatment, and the surface microhardness value of the specimen increases significantly, reaching the maximum value of 380.7 HV. Both the residual stress and microhardness decrease with the increase of depth, and the corresponding values decrease with the increase of distance from the surface layer. The yield strength and tensile strength of the LAM-TC4 titanium alloy after the LSP treatment are increased by 46.3% and 32.3%, respectively, compared with those of the original sample, while the plasticity remains basically unchanged. The fracture morphology is still dominated by deep equiaxial dimples, and the alloy obtains a better match between strength and plasticity.
Jan. 01, 1900Vol. 49 Issue 16 1602017 (2022)
Jie Yu, Chuang Cai, Jia Xie, Ying Liang, Jiasen Huang, Zhijie Liu, and Yonghong Liu
ObjectiveLow-carbon bainite steel has the advantages including high toughness and high specific strength, and has become the main material for the manufacture of high-speed train bogies which have increasingly stringent requirements for light-weighting. There are many butt joints and T-joints in bogies, which urgently need the high efficiency and quality welding technologies. Compared with MAG welding (MAG welding, metal active gas arc welding), the laser-arc hybrid welding with the combination of laser with arc improves the welding efficiency and reduces the welding defects. The laser-arc hybrid welding has a greater prospect of application in the welding of low-carbon bainite steel for high-speed train bogies. However, the parameter optimization for laser-arc hybrid welding is costly and time-consuming. The changes in the welding parameters and the interaction among the welding parameters cause the change in the weld formation. The response surface methodology (RSM) is used to study the influence of various parameters and the interaction among parameters on the response indexes, which is beneficial to achieve the parameter optimization for the laser-arc hybrid welding process. However, most studies have focused on the application of the response surface optimization analysis in the optimization of the single heat source welding process. Few studies have focused on the response surface optimization analysis for the hybrid heat sources. Here, the influence of various parameters and the interaction among parameters on the welding morphology is studied for laser-MAG hybrid welding of 6 mm thick low-carbon bainite steel butt joints based on the response surface methodology. The welding process parameters are optimized and tested. It is verified that the process optimization for laser-MAG hybrid welding of new low-carbon bainite steel is realized.MethodsA new type of low-carbon bainite steel plate with a size of 350 mm×175 mm×6 mm is used as the base metal, and the welding wire with a diameter of 1.2 mm is adopted as the filler wire. The 10 kW fiber laser and the arc from welding machine are used as the heat source. A robot and an integrated operation control cabinet are equipped in the welding system. A laser leading mode is adopted for laser-MAG hybrid welding, the I-shaped groove with a butt gap of 1.0 mm is adopted in the experiment, and single-sided formation and double-sided welding formation are obtained. The welding test plate is placed on a horizontal workbench. In order to prevent laser reflection from damaging the internal structure of the laser, the angle of laser beam relative to the vertical direction is set as 10°. The angle of welding torch relative to the test plate is set as 40°. The distance between laser and filler wire is 2 mm. The laser defocused distance is 0 mm during welding. The shielding gas of Ar+ CO2 mixture with a gas flow rate of 25 L/min is used. (Fig. 1). The microscope is used to observe and photograph the morphologies of welded joints. The weld width (W), penetration depth (H), arc zone area (S1), and laser zone area (S2) are first measured by the Image-Pro software. Then the weld forming coefficient (ψ) and the laser zone area ratio (R) are calculated to characterize the shape and size of the weld and the proportion of laser energy in the total energy, respectively. The test results are arranged, counted, and analyzed by the Design-Expert software.Results and DiscussionsThe mathematical models for the weld formation coefficient ψ and the laser area ratio R are established based on the experimental factors and response statistics. According to the F test, the reliabilities of the ψ and R models are excellent. With the increase of laser power (P), ψ first increases and then decreases. With the increase of welding speed (Vw), ψ gradually decreases. With the increase of wire feeding speed (Vf), the formation coefficient ψ increases slowly. As shown in the response surface diagram of ψ versus P and Vw,ψ is high due to the large volume of molten metal, the big weld penetration depth and width caused by the low laser power and welding speed. ψ=1.1-1.2 is first determined by the experimental parameters of joints with well formation, and then the optimized parameter interval P=4000-4300 W and Vw=15.1-16.3 mm/s are obtained. The response surface diagram of ψ versus P and Vf illustrates that the optimized parameter range is P=3970-4370 W and Vf=10.9-14.5 m/min. The response surface diagram of ψ versus Vw and Vf indicates that Vw has a significant impact on ψ, while Vf has a relatively small impact on ψ. The optimization interval is Vw=15.3-16.6 mm/s and Vf=12.3-13.6 m/min (Fig. 3). In the R model, R first increases and then decreases with the increase of P and Vw. R has a gradual upward trend with the increase of Vf. The response surface diagram of R versus P and Vw illustrates that R is high when the welding speed is low. According to the 6th and 16th tests, R=0.2-0.3 is determined, and the corresponding optimization interval is P=4120-4300 W and Vw=14.8-16.4 mm/s. The response surface diagram of R versus P and Vf shows that both P and Vf have little impact on R, and the optimization interval is P=4100-4320 W and Vf=10.6-13.9 m/min. According to the response surface diagram of R versus Vw and Vf,the optimization interval is Vw=13.9-16.4 mm/s and Vf=11.5-13.6 m/min (Fig. 4). Based on the above analysis, the final optimization interval is P=4120-4300 W, Vw=15.3-16.3 mm/s, and Vf=12.3-13.6 m/min. P=4250 W, Vw=16 mm/s, Vf=13 m/min, and P=4200 W, Vw=15.5 mm/s, and Vf=13 m/min are selected for test verification, respectively. The obtained weld is well formed and the accuracies of ψ and R models are 95.0% and 92.3%, respectively.ConclusionsBased on the response surface methodology, two statistical models of the appearance quality of the low-carbon bainite steel welded joints by laser-MAG hybrid welding under different laser powers, welding speeds, and wire feeding speeds are established. In the models, wire feeding speed has a significant influence on ψ and P. Welding speed is negatively relative to ψ and P. The interaction between laser power and welding speed has a significant influence on ψ. The interaction between wire feeding speed and welding speed has a significant influence on R. When ψ=1.1-1.2 and R=0.2-0.3, the process parameters of laser power, welding speed, and wire feeding speed are optimized as P=4120-4300 W, Vw=15-16 mm/s, and Vf=12-14 m/min. The parameters of P=4250 W, Vw=16 mm/s, Vf=13 m/min, and P=4200 W, Vw=15.5 mm/s, and Vf=13 m/min are selected for the experimental verification, respectively. The obtained weld is well formed. The accuracies of the ψ and R models are 95.0% and 92.3%, respectively.
Jan. 01, 1900Vol. 49 Issue 16 1602018 (2022)
Jiajie Yu, Jianping Zhou, Ruilei Xue, Yan Xu, and Lei Xia
ObjectiveVisual inspection method based on structured light has the advantages of simple structure, low-cost, and high-precision, so it is widely used in weld seam tracking and quality inspection. This method can be used to realize the automatic detection of weld surface quality, in order to improve the welding quality and realize the intelligent production of the welding industry. Currently, the research on weld quality detection based on structured light mainly focuses on single frame image detection. It is still a difficult problem to realize weld quality detection and automatic classification of defects in a three-dimensional state. Compared with the two-dimensional image information, the three-dimensional model information is more sufficient and intuitive, so the quality test results based on it have the characteristics of credibility, higher accuracy, and better stability. Additionally, the weld toe points of a two-dimensional image have the defects of low extraction accuracy and are prone to deviation. Given the above problems, this paper proposes a weld surface quality detection method that combines a K-means clustering algorithm and an illumination model. The proposed method can enhance welding automation production.MethodsTo eliminate the noise interference in the image, Gaussian filtering, threshold segmentation, and region-of-interest extraction were used to preprocess the weld image (Fig. 2), and the centroid method was used to extract the centerline of the structured light weld. The template line was fitted by the iterative least square method, and the height feature points were calculated to correct the installation error of the base metal. Considering the change of pixels in the weld centerline as the sample of the K-means algorithm, three class sets were set, and the distance between the sample and the clustering center was used to cluster. The center of gravity of the class set was calculated as a new clustering center, which was iterative until the clustering center remained unchanged. The coordinate points on both sides of the middle-class set of the final result were used as the preset weld toe feature points, and then, the sample density and absolute value of the slope at the feature point were calculated to verify the weld toe feature point pair results. The weld width and height were calculated according to the obtained feature points and the parent plate straight line. The three-dimensional model of the weld was constructed based on the centerline data of the continuous weld, and then, the light intensity of the weld model was calculated according to the illumination algorithm to obtain the illumination model of the weld. The characteristics of the dark area plaque and the related eigenvalues were established according to the intensity and distribution of the brightness value of the weld under directional illumination. The eigenvalues were used to classify whether the weld had defects and specific defects (undercut and porosity).Results and DiscussionsDuring the extraction of weld toe feature points, the accuracy of feature points extraction is improved by the extraction method of weld toe feature points based on K-means clustering. The width error is less than 0.2 mm, the height error is less than 0.1 mm, and repeated measurement errors of the width and height are less than 0.02 mm (Table 1). Compared with the gradient method, the weld toe feature points extracted based on K-means clustering are more accurate and stable (Fig. 6), which can meet the accuracy error in practical application. When the defects are classified based on the illumination model, the following properties are set: the number characteristic value N of the dark block, the roundness characteristic value Ra of the dark block, and the undercut characteristic value S. The characteristic value N of the defect-free weld is equal to 1, the characteristic value N of the defect weld is greater than or equal to 2, the roundness characteristic value Rc of the porosity weld is greater than 0.7 (area without defects) or between 0.3 and 0.5 (area with porosity defect), the undercut characteristic value S is between 0.5 and 0.8 (area with undercut defect) or 0 (area without defects). For the classification of defects, the accuracy of the weld classification is 1. When classifying specific defects, the classification accuracy of undercut weld and porosity weld is above 0.95 (Table 2). Our method has a good classification effect.ConclusionsThe K-means clustering algorithm was used to extract the weld toe feature points, which improved the extraction accuracy of weld toe feature points and extracted the welding parameters, including height and width of the weld. Furthermore, a three-dimensional illumination model was established according to the centerline data of the weld. Additionally, the characteristics and eigenvalues of the dark block were calibrated, and the automatic classification of the weld with or without defects and specific defect types (undercut and porosity) was realized according to the illumination brightness data of the illumination model.
Jan. 01, 1900Vol. 49 Issue 16 1602019 (2022)
Wei Wang, Xiangjin Li, Weijun Liu, Fei Xing, and Hongyou Bian
ObjectiveThe 7075 aluminum alloy material is widely used in stress structural parts such as the spacer frame and wing beams of a large passenger aircraft. The surface of these structural parts is coated with a protective anodic oxidation film. However, with the increase of the service life of the passenger aircraft, this anodic oxidation layer is worn or partially peeled off. Therefore, it is necessary to remove the anodic oxidation layer on these structural parts to facilitate the damage detection or apply a new anodic oxidation layer. Laser cleaning can improve the cleaning quality of aircraft structural parts because of its friendly environment, wide application, high cleaning precision, and good cleaning effect. At the same time, the process parameters for laser cleaning have an important impact on the cleaning effect and surface quality. However there is little research on the process for cleaning the anodic oxidation film of the 7075 aluminum alloy by an Yb-doped pulsed fiber laser. Therefore, the influence of process parameters on the surface morphology, elemental content, and surface roughness of the 7075 aluminum alloy after cleaning is explored here. The process parameters for cleaning the anodic oxidation film on the sample surface are obtained without influencing the surface roughness, which provides process guidance for ensuring the safety of aircraft structural parts after laser cleaning.MethodsThe 7075 aluminum alloy plate coated with an anodic oxidation film is used here. First, the IPG Yb-doped pulsed fiber laser is used, and the anodic oxidation film on the 7075 aluminum alloy surface is cleaned under different average powers, scanning speeds, and pulse frequencies. Then, the surface morphology of the 7075 aluminum alloy after cleaning is observed by optical microscope, scanning electron microscope (SEM), and laser confocal microscope, and the elemental content of the sample surface is analyzed by X-ray energy spectrum (EDS). Finally, the effects of pulsed laser cleaning average power, scanning speed, and pulse frequency on the surface morphology, microstructure, roughness, and elemental content of the 7075 aluminum alloy are analyzed. At the same time, the removal mechanism of the anodic oxidation film on the 7075 aluminum alloy surface by laser cleaning is also studied.Results and DiscussionsWith the increase of the average power, the energy density increases, the molten pool formed by single laser pulse cleaning deepens, and the cleaning depth of the oxidation film increases (Fig. 5). When the average power increases from 175 W to 225 W, the energy density increases and the cleaning depth of the oxidation film becomes deeper. When the average power is 250 W and the energy density reaches 4.44 J/cm2, laser cleaning can make the morphology of the sample surface more uniform (Fig. 6). Scanning speed influences the spot bonding rate. When the scanning speed is too small, the spot bonding area is too large, the energy is too dense, and the sample surface remelts seriously and produces secondary oxidation [Fig. 7(a)]. When the scanning speed is too high, the spot overlap rate is too small, only the oxidation film in the spot lap area is cleaned, and the residual oxidation film increases [Fig. 7(d)]. When the scanning speed is 2500 mm/s, the spot overlap rate is 33.3%, and the oxidation film can be cleaned with good surface quality [Fig. 8(c)]. Pulse frequency influences the spot overlap rate and the energy density. When the pulse frequency increases, the overlap rate increases, the energy density decreases, and the cleaning rate of the oxidation film on the sample surface decreases (Fig. 9). When the pulse frequency is 2.5 kHz, the energy density is 4.44 J/cm2, and the spot overlap rate is 33.3%. The laser energy distribution is uniform, no large ablative pit appears after cleaning, and no obvious oxide film remains on the sample surface [Fig. 10 (a)]. Combined with the microscopic morphology of the sample surface after laser cleaning and the EDS analysis, the laser cleaning of the 7075 anodic oxidation film has the gasification mechanism and the elastic vibration peeling mechanism (Fig. 12). When the average power is 250 W, the scanning speed is 2500 mm/s and the pulse frequency is 2.5 kHz, the oxygen content on the sample surface is nearly close to 0. Therefore, it is considered that the anodic oxidation film on the sample surface has been cleaned (Figs. 1315). When the average power is 250 W, the scanning speed is 2500 mm/s, and the pulse frequency is 2.5 kHz, the three-dimensional topography of the sample surface fluctuates a little, and the roughness of the sample surface reaches 0.450.6 μm. Compared with that of the original sample, the roughness of the sample surface does not change significantly (Fig. 19).ConclusionsThe effects of laser cleaning process parameters on the microstructure, element content and surface roughness of the 7075 aluminum alloy are studied. With the increase of the average power, the energy density increases gradually, and the cleaning rate increases. With the increase of the scanning speed, the spot overlap rate decreases gradually, and the cleaning rate first increases and then decreases. With the increase of the pulse frequency, the spot overlap rate increases, the energy density decreases, and the cleaning rate decreases. With the increase of the average power, the roughness of the sample surface decreases gradually. With the increase of the scanning speed, the roughness of the sample surface decreases first and then increases. With the increase of the pulse frequency, the surface roughness increases first and then decreases. When the average power P=250 W, the scanning speed v=2500 mm/s, and the pulse frequency F=2.5 kHz, the energy density is 4.44 J/cm2 and the spot overlap rate is 33.3%. The highest cleaning rate is 98.7% and the minimum surface roughness is 0.45 μm. The removal mechanism of anodic oxidation film on the 7075 aluminum alloy surface is mainly the gasification mechanism and the elastic vibration stripping mechanism.
Jan. 01, 1900Vol. 49 Issue 16 1602020 (2022)
Jie Zhang, Qunli Zhang, Jianhua Yao, Zhisheng Wu, and Ke Li
ObjectiveThe IN718 alloy is a kind of nickel-based superalloy with excellent corrosion resistance and mechanical properties, which has been widely used in aerospace, chemical and petroleum fields. However, due to its harsh service environment, IN718 alloy parts usually fail due to wear, corrosion and fatigue cracking, resulting in serious economic losses. The emergence of laser cladding technology can not only efficiently restore the size of failed parts, but also obtain controllable microstructure and properties on its surface, which greatly reduces the economic loss of enterprises. The interfacial area between the cladded layer and substrate usually is the weakest area of remanufactured parts. This is because the interface of cladded layer experiences multiple reciprocating processes of rapid heating and rapid cooling which is easy to cause complex metallurgical reaction and phase transformation. It can not only promote the metallurgical combination between the cladded layer and substrate, but also produce a heat affected zone, resulting in performance degradation. At the same time, the poor component matching between powder and substrate and the insufficient laser energy input are easy to lead to a series of defects such as inclusions and pores near the repaired interface. The microstructure and properties of this area are very important to the service life of repaired IN718 alloy parts, but there is few research on the repaired interfacial characteristics and properties of laser cladded IN718 alloy. Therefore, it is of great significance to study the microstructure evolution and properties of the interface of IN718 laser cladded layer.MethodsThe aged-IN718 alloy plate and IN718 spherical powder are used in this study. First, the laser cladding process of IN718 alloy is optimized based on the orthogonal experimental design and the effect of process parameters on the forming size of cladded layer is studied. Then, the interfacial microstructure characteristics are observed by an optical microscope (OM) and scanning electron microscope (SEM), and the elemental content of precipitates is detected by an energy disperse spectroscopy (EDS). The micro-hardness near the interface between cladded layer and substrate is tested by a hardness tester. The bonding strength of cladded layer/substrate interface is quantitatively analyzed by the shear test, and the fracture behavior of cladded layer interface is also analyzed.Results and DiscussionsThe width (W), height (H) and W/H of the cladded layer increase with the increase of the laser power, while the dilution ratio of the cladded layer increases first and then decreases with the increase of the laser power [Figs. 3(a1)(a4)]. The scanning speed has a negative effect on the width and height of the cladded layer, while it has a positive effect on the W/H and dilution ratio [Figs. 3(b1)(b4)]. The increase of powder feeding rate is helpful to improve the height of the cladded layer, but it is not conducive to the improvement of width, W/H and dilution ratio [Figs. 3(c1)(c4)]. The optimized laser cladding process parameters of aged-IN718 alloy are as follows: the laser power of 900 W, the scanning speed of 6 mm/s, and the powder feeding rate of 10 g/min. From top to bottom, the interface includes cladded layer (CL), fusion zone (FZ), heat affected zone (HAZ) and substrate which is not affected by heat [Fig. 4(a)]. The microstructure of the cladded layer is dendritic crystal with directional epitaxial growth, the fusion zone is located between the cladding zone and the substrate [Fig. 4(b)]. The upper side is connected with the cladded layer and presents obvious crystallization characteristics, and the other side is connected with the substrate and presents element diffusion characteristics [Fig. 4(c)].The heat affected zone is located below the fusion zone, where the grains grow unevenly and are obviously different from the grains in the original substrate [Fig. 4(d)]. This is because the energy input leads to the partial dissolution of precipitates in this region and diffusion into austenite. However, due to the short action time at high temperature, only the precipitates with smaller size are completely dissolved, while the carbides with larger size are not fully dissolved and continue to remain at the grain boundary [Fig. 4(e)]. The element distribution from the cladded layer to the substrate is relatively uniform, and there is no macro-segregation (Fig. 5). This is because the cladding layer and substrate are similar in composition and there is no obvious chemical element transition between them. In addition, there is no plane crystal at the interface between the cladded layer and the substrate. This is because the powder composition is similar to the substrate composition and both have a face centered cubic (FCC) crystal structure (Fig. 6). The micro-hardness of the IN718 cladded layer is about 280 HV. The micro-hardness of the substrate is about 475 HV. The micro-hardness of the heat affected zone gradually increases from the cladded layer to the substrate (Fig. 7). The average interfacial shear strength of the laser cladded IN718 alloy is 608.87 MPa (Fig. 8). The shear fracture at the interface of the laser cladded IN718 alloy basically includes three parts: fiber region, radiation region and shear lip region (Fig. 9).ConclusionsLaser cladding process parameters have a significant impact on the IN718 alloy coating. Increasing power and reducing scanning speed are helpful to improve the width and height of the cladded layer. Increasing the powder feeding rate and reducing the scanning speed are helpful to improve the height of the cladded layer, but not conducive to improving the width, dilution ratio and W/H. The interface of IN718 cladded layer is surrounded by the cladded layer zone, fusion zone, heat affected zone and substrate from top to bottom. The cladded layer presents typical dendrite morphology. The fusion zone shows metallurgical bonding with the substrate, which is different from the cladding layer and substrate in morphology, and there is no plane crystal. The heat affected zone is located below the fusion zone, and the internal grains are coarsened. The element distributions at the interface are uniform and there is no macro-segregation, but the residual Laves phase will lead to the mutation of Nb or Mo element in the cladded layer and the fusion zone. The micro-hardness of the cladded layer is lower than that of the aged substrate, while the micro-hardness of the heat affected zone increases gradually from the cladded layer to the substrate. The average shear strength of IN718 coating interface is 608.87 MPa. Subsequent heat treatment is needed to improve the micro-hardness and shear strength near the interface.
Jan. 01, 1900Vol. 49 Issue 16 1602021 (2022)
Xiaoming Xi, Lingfa Zeng, Huan Yang, Hanwei Zhang, Zhiping Yan, Baolai Yang, Liangjin Huang, Peng Wang, Zilun Chen, Xiaolin Wang, Zhiyong Pan, Zefeng Wang, and Xiaojun Xu
Jan. 01, 1900Vol. 49 Issue 16 1616001 (2022)
Hu Xiao, Zhiyong Pan, Zilun Chen, Xiaoming Xi, Liangjin Huang, Meng Wang, Huan Yang, Zhiping Yan, Jinyong Leng, Xiaolin Wang, Zefeng Wang, Pu Zhou, Xiaojun Xu, and Jinbao Chen
Jan. 01, 1900Vol. 49 Issue 16 1616002 (2022)
© Copyright 2018-2021 | Chinese Laser Press.
All Rights Reserved 沪ICP备15018463号-20