


Please enter the answer below before you can view the full text.

Silue Zeng, Liangjian Liu, Tao Chen, Chihua Fang, Chengbo Liu, and Hairong Zheng
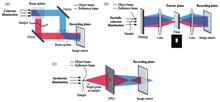
ObjectivePhotoacoustic imaging (PAI) is an emerging biomedical imaging technique with a high contrast of optical imaging and high resolution and deep penetration of acoustic imaging, which has shown broad application prospects in the field of clinical disease diagnosis. An important implementation for realizing PAI is using acoustic-resolution photoacoustic microscopy (AR-PAM). Conventional light illumination methods have the problem of uneven light distribution, optical thermal noise, large energy loss, and decreased imaging sensitivity. Additionally, for the samples of complex biological tissues with irregular shapes, such as tumor and brain tissues, single-sided illumination methods have imaging limitations such as incomplete coverage of the target area and difficulty in obtaining accurate deep tissue information. In this paper, we report a dual-sided illumination method for AR-PAM. When compared with conventional methods, this method has higher imaging contrast in complex biological samples and can more accurately present the complete boundary of sample tissue. More comprehensive information was obtained, demonstrating the method’s promising potential in both clinical and preclinical research.MethodsA polarization splitter was used in this study to divide the laser beam into two beams and they were coupled into the multimode optical fiber through fiber couplers. After being shaped with a planoconvex lens on both sides of an imaging probe, the emitted beams were irradiated to the imaging sample at a 45° angle. A high-frequency ultrasonic transducer received the photoacoustic signals generated by the sample. First, the feasibility of imaging was verified by creating two phantoms mimicking blood vessels at different depths. The imaging of popliteal lymph nodes, brain vasculature, and tumors in living mice with two illumination methods was then performed and compared, and their imaging performance with dual-sided illumination was more excellent than that with single-sided illumination method, proving the advantages of dual-sided illumination method in PAI of complex biological samples.Results and DiscussionsWhen the PAI results of the two tissue phantoms under different illumination schemes are compared, the overall signal-to-noise ratio and contrast of the images in the dual-sided illumination method are found to be better than those in the single-sided illumination method and more complete contour and depth information can be obtained for the imaging of complex samples (Fig. 3). In in vivo imaging experiments, the advantages of dual-sided illumination in improving imaging quality are also verified. Through imaging of indocyanine green traced (ICG-traced) mouse popliteal lymph nodes, the signal intensity of lymph nodes using dual-sided illumination method was approximately three times higher than that using the single-sided illumination method (Fig. 4). Noninvasive imaging of cerebral cortical blood vessels showed that the dual-sided illumination method can present more abundant microvessels in the marginal region with higher contrast (Fig. 5). Unlabeled in vivo imaging of mouse tumors was performed to evaluate the differences in peripheral vascular imaging between the two illumination methods, and the results showed that the blood vessels observed in the same area using the dual-sided illumination method were more abundant and tumor nourishing vessels were visible (Fig. 6). In addition, three-dimensional reconstruction of the tumor image showed that the dual-sided illumination method can image tumor edges more accurately and completely.ConclusionsIn this study, the imaging quality is improved by reconfiguring the light illumination method of AR-PAM from single-sided illumination to dual-sided illumination to achieve the homogeneous coverage of a laser beam for imaging complex biological tissues. The results show that the dual-sided illumination method improves contrast and signal-to-noise ratio for PAI in complex biological samples such as tissue phantoms, popliteal lymph nodes, brain vasculature, and tumors. Our study provides a new method for photoacoustic microscopy and has the potential to improve diagnosis accuracy in clinical and preclinical practices.
Jan. 01, 1900Vol. 49 Issue 15 1507201 (2022)
Tianlong Man, Yuhong Wan, Mengjing Jian, Wenxue Zhang, Minghua Zhang, Teng Ma, and Qin Zhang
SignificanceTo minimize the physical damage, phototoxicity, and photobleaching of the biological samples, microscopic imaging methods for the visualization of cells and tissues need to have the ability of noncontract and fast measuring of the three-dimensional (3D) sample information. Far-field optical microscopy, which has been widely applied for biomedical imaging, is one of the most direct and indispensable ways of capturing the dynamic 3D architecture of biological samples. In the optical imaging system, both the intensity and phase distribution of the illumination light field will be quantitatively modulated by the sample and finally transmitted to the detector plane. The demodulation of all the obtained information enables quantitative reconstructions of the samples’ 3D spatial structure, morphology profile, and refractive index distribution. However, the existing photon detectors are only sensitive to the intensity distribution of the input light signal. The phase of the light field, which cannot be directly measured by the detector, can be quantitatively coded and decoded from the two-dimensional intensity distribution of the interference pattern using the interference characteristic of light. These basic ideas enable, in principle, fast 3D imaging, tomography, and quantitative phase-contrast imaging and hence benefit the visualization of the dynamic structural and biophysical characteristics of the samples. Furthermore, the details of the fine structures inside the sample can be obtained with improved imaging performance through super-resolution imaging and nonscanning 3D imaging, which are enabled by fluorescent self-interference imaging techniques. All these potential advantages in biological imaging have promoted the rapid development of interference microscopic techniques in the past decades. The interference imaging methods are classified according to the coherence properties of the light source used. The interference microscopic techniques using different light sources enable quantitative phase-contrast imaging, nonscanning 3D imaging, and tomographic imaging to practically benefit the structural and functional visualization of 3D complex biological samples. The advantages, limitations, and potential applications of different interference imaging techniques are shown in Table 1.ProgressDifferent optical systems and numerical methods have been designed to improve the spatial resolution, imaging speed, signal-to-noise ratio, and robustness to extend the application and modalities of the interference microscopic techniques. Among them, research is mainly focused on the applications of digital holography in quantitative phase-contrast imaging (Fig. 4) and nonscanning 3D imaging (Fig. 6) of the sample. Parallel phase shifting (Fig. 8) and compressive sensing (Fig. 9) methods have been combined with digital holography to improve temporal and spatial resolution. Digital holography’s large field-of-view, high speed, high resolution, and multidimensional imaging abilities have benefited both functional (Fig. 5) and structural (Fig. 7) imaging of biological samples. With optical sectioning imaging ability and less speckle noise, partially coherent digital holography has been applied for high accuracy phase-contrast imaging of cells (Fig. 10) and, more importantly, for the visualization of the structure behind the tissues (Fig. 11). Because of its 3D tomographic imaging ability, optical coherence tomography (OCT) has become one of the most important tools for ophthalmic imaging (Fig. 13). With extended imaging modalities, polarization sensitive OCT has provided proof-of-principle results in the diagnosis of bronchial disease (Fig. 14). Incoherent holography can considerably improve the temporal resolution of the existing 3D laser scanning fluorescence microscope. Nonscanning 3D imaging of the fluorescence sample has been demonstrated (Fig. 15) with inherent super resolution (Figs. 18 and 19). While some of the major limitations of incoherent holography, such as the low axial resolution, have been addressed and improved (Fig. 16), the potential of this technique for high-resolution, high-speed 3D fluorescence imaging is still being explored. Successes have been achieved, e.g., by optimizing the 3D imaging performance of fluorescence holography via computational adaptive optics (Fig. 17). In localization-based super-resolution microscopy, the basic idea of interference microscopy has also been used as a point spread function modulation method. Therefore, the system’s 3D resolution and imaging depth have been improved (Figs. 21 and 22).Conclusions and ProspectsIn this paper, we have reviewed the basic principles, recent progresses, advantages, limitations, applications, and potential future directions of the techniques. The system’s 3D spatial resolution, imaging speed, and signal-to-noise ratio have been considerably improved during the past decades. Based on the multidimensional (3D spatial+ phase) imaging ability of interference microscopy, the applications of the methods for the structural and functional imaging of biological samples have been demonstrated. Further, the imaging modalities have been extended to provide even more data dimensions by combing the interference microscopic techniques such as OCT with polarization imaging method. In conclusion, in interference microscopy, the concurrently obtained structural and functional information of the sample is important for understanding the biological and biophysical mechanisms of the life processes. Interference microscopic techniques have benefited specific research in biological society by providing a powerful 3D imaging tool for both coherent and incoherent light sources. While several efforts have been made to improve system spatial resolution, another important direction in the future is to further develop functional imaging methods by exploring the potential of superior multidimensional data acquisition ability.
Jan. 01, 1900Vol. 49 Issue 15 1507202 (2022)
Shuting Ke, Minghui Chen, Zexi Zheng, Yuan Yuan, Teng Wang, Longxi He, Linjie Lü, and Hao Sun
ObjectiveOptical coherence tomography (OCT) imaging shows great potential in clinical practice because of its noninvasive nature. However, two critical issues affect the diagnostic capability of OCT imaging. The first problem is that the interferential nature of OCT imaging produces interference noise, which reduces contrast and obfuscates fine structural features. The second problem is caused by the low spatial sampling rate of OCT. In fact, in clinical diagnosis, the use of a lower spatial sampling rate is a method to achieve a wide field of vision and reduce the impact of unconscious movement. Therefore, most OCT images obtained in reality are not optimal in terms of signal-to-noise ratio and spatial sampling rate. There are significant differences in the texture and brightness of the retinal layer in patients, as well as in the shape and size of the lesion area, so traditional models may not be able to reliably reconstruct the pathological structure. To obtain high peak signal-to-noise ratio (PSNR) and high-resolution B-scan OCT images, it is necessary to develop sufficient methods for super-resolution reconstruction of OCT images. In this paper, an improved OCT super-resolution image reconstruction network structure (PPECA-SRGAN) was proposed.MethodsIn this paper, a PPECA-SRGAN network based on generative adversarial network (GAN) was proposed. The network model includes a generator and a discriminator. A PA module was added between the residual blocks of the generator to increase the feature extraction capability of OCT retinal image reconstruction. In addition, a PECA module was added to the discriminator, which is an improvement of the pyramid split attention network (PSANet) and can fully capture the spatial information of multi-scale feature maps. First, we used two data sets to test a training set of 1000 images and a test set of 50 images, respectively. The data set was imported into the preprocessing module, and the low-resolution image was obtained through four down-sampling processes. Then, the generator was used to train the model to generate high-resolution images from low-resolution images. When the discriminator could not distinguish the authenticity of the images, it indicated that the generation network generated high-resolution images. Finally, the image quality was evaluated using the structural similarity index measure (SSIM) and PSNR.Results and DiscussionsThe super-resolution index evaluation results of PPECA-SRGAN and the other three models were compared, as well as the final reconstruction effect images. In general, PPECA-SRGAN’s reconstruction effect was better than SRResNet; however, for the restoration of the image details, the image quality of the PPECA-SRGAN network reconstruction was more in line with the satisfaction degree of human vision. Compared with SRResNet, SRGAN, and ESRGAN, the SSIM indexes of PPECA-SRGAN were 0.090, 0.028, and 0.016 higher and the PSNR indexes were 2.15 dB, 0.71 dB, and 0.47 dB higher, respectively. The good reconstruction effect of PPECA-SRGAN was due to the addition of the attention mechanism called path aggregation network (PANet) and the proposed attention mechanism named PECA, both enhancing the capture of OCT retinal image features and the reconstruction of details. The PECA module was composed of pyramid splitting and extracting features, with the use of ECANet to fuse multi-scale information. PANet can effectively reduce image noise, such as compression artifacts. This makes our model better than the SRGAN network and other traditional networks. Therefore, the application of the proposed model in OCT image super-resolution reconstruction has been verified, and its performance has been improved compared with other reconstruction algorithms.ConclusionsThe PPECA-SRGAN network structure proposed in this paper is an improved model of the SRGAN network for super-resolution reconstruction of retinal OCT B-scan images. We conducted training and verification on MICCAI RETOUCH data set and data collected by Wenzhou Medical University to solve the problems of low-resolution and few details of images collected by OCT. We used advanced GAN to improve the super-resolution reconstruction of OCT images, and the SRGAN network was improved due to the difference in reconstruction between medical images and natural images. Firstly, a PANet module was added between the residual blocks of the generator to extract multi-scale feature relations by pyramid structure and suppress unnecessary artifacts. Then, the PECA module was inserted into the discriminator to effectively combine spatial and channel attentions to learn more image details for the discriminator and obtain richer image pair feature information. The experimental results show that this model is effective and stable in improving the resolution of medical images. Compared with SRResNet, SRGAN, and ESRGAN, the PSNR and SSIM indexes of the reconstructed images were improved by about 3.5% and 5.6%, respectively. In clinical diagnosis, the proposed algorithm can overcome the inherent limitations of low-resolution imaging systems and reconstruct various details lost in the process of image acquisition; the algorithm is easy to integrate and implement. In the future, if higher-quality data sets and lighter algorithms can be obtained, it is possible to further improve the quality of super-resolution reconstruction medical images and make them more applicable in clinical practice.
Jan. 01, 1900Vol. 49 Issue 15 1507203 (2022)
Jie Huang, Yizhi Liang, Xiaoxuan Zhong, Long Jin, and Baiou Guan
ObjectivePhotoacoustic imaging (PAI) has been a fast-growing biomedical imaging modality in recent years. Absorbers are imaged in biological tissue by detecting laser-induced ultrasound waves via PAI. This provides hemodynamic information for the diagnosis of tumors, strokes, and other critical diseases. A typical photoacoustic microscope uses piezoelectric ultrasonic transducers to detect the photoacoustic signals. However, owing to the tradeoff between sensitivity and sensor size, building a miniaturized photoacoustic microscope with superior imaging capability is highly challenging. Therefore, the applications of PAI in wearable and endoscopic applications are limited. Our research group has developed a new optical ultrasonic sensor using a self-heterodyne fiber laser as the acoustically sensitive element. However, the laser, optical amplifier, photodetector, and signal demodulator may all cause noise and limit the detection capability. This study analyzes the noise characteristics and constructs a high-performance fiber-based photoacoustic microscope. This imaging probe can be used as a gastrointestinal endoscope for tumor screening or as a head-mounted microscope for brain imaging in a free-moving state.MethodsWe exploited a compact fiber laser as the ultrasound sensor. Ultrasound waves can deform the sensor and induce a change in the lasing frequency. To measure the acoustic response, we used both x- and y-polarized light and beat them at the photodetector to generate a radio-frequency. The variation in lasing frequency was then measured at radio frequency using modern electronics with high resolution. Here, we theoretically analyzed the noise of the fiber sensor, optical amplifier, photodetector, and signal demodulation acquisition module in the ultrasonic detection system. By measuring the noise n0,beat signal power Prf,and frequency noise Δfnoise with different input optical powers, we examined the dependence of the noise on the input power. Further, we implemented a photoacoustic microscope using an optical sensor for ultrasound detection and imaged the blood vessels in a biological sample. The signal-to-noise ratios (SNRs) were also measured while varying the input power of the sensing light.Results and DiscussionsFirst, we calculated the noise levels of the fiber laser and optical amplifier, shot and thermal noises of the photodetector, and the noise of the signal demodulation acquisition module (Fig. 2). We found that when the input optical power is less than 8.5 mW, the noise from the data-acquisition system accounts for a large proportion of the total system noise and has a main contribution to the noise; when the input optical power exceeds 8.5 mW, the noise of laser and optical amplifier dominates. We then measured the system noise n0,beat signal power Prf,and image frequency noise Δfnoise as the functions of input optical power (Fig 3). When the input optical power increases to more than 10 mW, the frequency noise Δfnoise approaches its minimum and the root-mean-square of Δfnoise is ~44 kHz. In photoacoustic microscopy, the optical ultrasound sensor was used to detect laser-induced ultrasound waves. We imaged a mouse ear in vivo with different input powers (Fig 5). When the input optical power is 1.7 mW, the peak-to-peak frequency noise is 185 kHz. When the input optical power increases to 15.7 mW, the noise is reduced to 110 kHz and the imaging SNR is enhanced by 4.5 dB.ConclusionsThis paper studies the noise characteristics of a laser-based optical ultrasound sensor. We determine the dependence of noise n0 of the optical fiber ultrasonic sensor system and that of the beat signal frequency noise Δfnoise on the input optical power Prf of the signal light. By increasing Prf,the frequency noise can be considerably reduced, yielding an enhancement in the SNR. The frequency fluctuation is reduced from 185 to 110 kHz when the input power is increased to 15.7 mW. The corresponding noise equivalent pressure (NEP) is reduced from 32.9 to 19.5 Pa, and the imaging SNR is enhanced by 4.5 dB.Optical fiber is thin, flexible, and suitable for both endoscopy and wearable instrumentation. This study demonstrates that optical fiber technology opens new possibilities to implement small high-performance photoacoustic imaging modalities. Here, we have considerably improved the sensitivity of the optical ultrasound sensor, thus providing better imaging results. With the improved sensor, we aim to implement a photoacoustic endoscope for gastrointestinal cancer diagnosis and a head-mounted photoacoustic microscope for free-state neuroimaging.
Jan. 01, 1900Vol. 49 Issue 15 1507204 (2022)
Xuanjun Liu, Lili Liu, Kezhou Fan, Xunsheng Ji, and Ya Guo
ObjectiveThe propagation of light in turbid media is affected by the optical parameters of the media including absorption coefficient (μa), scattering coefficient (μs), isotropic coefficient (g), and refractive index (n). These optical parameters are related to the chemical properties, the internal structures, the physical properties of the media, and the boundary difference and speed of light transmission, including the shape, size, and concentration of different scattering components in the turbid media. By measuring the optical parameters of the turbid media, the material properties, physiological states and pathological changes can be determined, which is very important in various applications including biomedical diagnosis and food safety inspection. However, there is a lack of algorithms that can be simultaneously used to identify these four parameters (μa,μs,g, and n) because the measurement instruments cannot be easily installed. To solve this problem, a method based on a residual neural network is proposed here to determine the four parameters of the turbid media from the diffuse reflection light intensity profiles.MethodsFirst, the diffuse reflection light intensity profiles under different incident excitation light angles are obtained through the Monte Carlo simulation. The incident light spot diameter and the divergence angle are considered in the simulation process. Second, the diffuse light intensities excited under multiple angles are used to enhance the information richness. Third, a residual neural network is used to establish the machine learning mapping model between the diffuse light intensity profiles and the optical parameters of the turbid media, and the prediction of optical parameters is realized. The extracted light intensity values along the long axis are used as the input of the residual neural network, and the output is the optical parameters. Before training and testing, noise is added to the diffuse reflection data in order to simulate the optical measurements under real conditions. The input data is normalized to ensure the consistency of data range and make the network converge quickly.Results and DiscussionsIn the Monte Carlo simulation, different incident angles are initialized. Seven incident angles ( 24°, 30°, 36°, 42°, 48°, 54°, and 60° ) are applied in this work (Fig. 4). The position projected by each photon on the medium surface is initialized as (x′, y′, z′) and the photon directional cosine is set as (μx,μy,-μz). The diffuse light intensity profiles under different excitation light angles are validated to be linearly independent (Fig. 6). Thus they may provide extra effective independent constraints for the estimation of the four optical parameters. The concept of using more diffuse reflection light intensity profiles to enhance data richness is further proved by the full rank of diffuse reflective light intensity vectors along the long axis. The relative error decreases with the increase of the number of diffuse reflection light intensity profiles used here (Fig. 7). When only the diffuse reflection light intensity at one angle is used to identify the optical parameters of the media, the errors can be several times larger than those when the 7 sets of diffuse reflection light intensity profiles are used. The recognition errors of the four optical parameters have little change when the SNR is changed in the range of 40 dB-80 dB. The results show that the prediction errors for the four optical parameters (μa,μs,g, and n) are 8.6%, 4.6%, 1.7%, and 0.9%, respectively, when the noise level is 40 dB. Compared with the existing prediction methods, the proposed residual neural network method has high prediction accuracy and short computation time.ConclusionsA method based on a residual neural network is proposed to estimate the anisotropic coefficient, absorption coefficient, scattering coefficient, and refractive index of a turbid medium. The diffuse light intensities excited under multiple angles are proved to be effective for enhancing the information richness and improving the estimation accuracy of optical parameters. The incident light spot diameter and the divergence angle are considered, and the different levels of noise are added to the diffuse light intensity signals and the generalization ability and anti-noise performance of the network are improved. The results show that the proposed method can estimate the anisotropic coefficient, absorption coefficient, scattering coefficient, and refractive index of the turbid medium accurately with a high noise level and a high efficiency. The diffuse light intensities under seven angels are enough for the determination of the four optical parameters. This work is expected to be useful for various applications including biomedical diagnosis, food safety inspection, and material property detection.
Jan. 01, 1900Vol. 49 Issue 15 1507205 (2022)
Zhenqi Dai, Xiuli Bi, and Junchao Fan
ObjectiveReducing excitation intensity or exposure time is employed to decrease the phototoxicity and photobleaching in structured illumination microscopy (SIM). However, the raw images obtained under this condition have a low signal-to-noise ratio, resulting in an error estimation of parameters and reconstruction artifacts. To improve the accuracy of parameter evaluation, some modified parameter evaluation algorithms have been proposed, including the prefiltering approach and iterative and noniterative parameter evaluation approaches. However, these approaches can only enhance the accuracy of the estimated parameters, but do not demonstrate how precise they are. In other words, these algorithms cannot assess whether there is a considerable deviation from the true value. However, to suppress the reconstruction artifacts in the reconstructed image, some reconstruction algorithms have been proposed, such as spectrum filtering, TV-SIM, and Hessian-SIM. These approaches usually reconstruct the super-resolution (SR) SIM image at the beginning, and then remove the artifacts. However, this reconstruction process will change the Poisson-Gaussian noise distribution in the images.To address the above two issues, we first proposed a parameter evaluation approach based on empirical mode decomposition (EMD) in this research, which can precisely evaluate the initial phase and modulation depth. Measured with the proposed dispersion index, the accuracy of the estimated parameter can be given synchronously. Next, a denoising algorithm based on similar blocks was employed before SIM reconstruction in this study, which maintains the illumination pattern while suppressing the noise in the raw images. This predenoise process before reconstruction can enhance the accuracy of parameter evaluation and remove the artifacts.MethodsThis study employs empirical modal decomposition (EMD) to smooth out the frequency distribution of the estimated initial phase and modulation depth. The specific process is as follows. First, the distribution curve of the parameter estimate was decomposed with each inherent mode function component. Next, only the mode component below 4 was accumulated, which can be superimposed as a smooth fitting curve. Finally, we evaluated the initial phase and modulation depth by this superimposed smooth curve.The dispersion index was proposed as a quantitative index that can be used to measure the evaluated initial phase and modulation depth accuracy in this study. This index primarily characterized the degree of concentration of the curve from the global and local aspects.This study also suggested a new process of denoising the raw images first and then conducting SR reconstruction, which can enhance the accuracy of the parameter estimation and reduce the artifacts. First, we obtained the average of the raw images and concatenated it with the raw images. Next, a VST transformation was performed on the concatenated images, followed by a VBM3D-based denoising process. Finally, the denoised findings were subjected to a VST inverse transformation. After the complete denoising process, we performed the subsequent SR reconstruction.Results and DiscussionsWe first imaged actin with 20 groups for comparison experiments. Each group contained 9 raw images, with three phases in every three directions, for a total of 180 images with 486 ms. These 20 groups of raw images can be directly reconstructed into 20 SR images by the Wiener reconstruction algorithm. Thereafter, we averaged the 20 SR images to one image that serves as the ground truth.For the parameter evaluation, the frequency distribution of the parameter estimates is ideally similar to the shape of the impulse function [Fig. 1(b)]. However, because of the effect of noise, the actual distribution is a smooth curve with local jitter [blue solid line in Fig. 1(c)]. The EMD algorithm was then employed to fit this curve to make parameter estimation easier [Fig. 1(c) red dashed line].To evaluate the accuracy of the estimated initial phase and modulation depth, we proposed a dispersion index and confirmed its effectiveness. First, we averaged the first 1, 3, 5, 7, 9, and 11 groups of the raw images to obtain six groups of images with various SNR. These six group images were employed as experimental data for the evaluation of the dispersion index. The experiment reveals that with the enhancement of the raw images' SNR, the EMD curve [Fig. 4(d)-(e) red dashed line] is more similar to the shape of the impulse function. Moreover, the dispersion index gradually decreases [Fig. 4(c)]. Therefore, the dispersion index characterized the relationship between the SNR of raw images and parameter evaluation accuracy.The two benefits of the proposed denoising algorithm are also confirmed. First, we found that the EMD curve is more concentrated [Fig. 6(b)-(c)] and the dispersion index is low (Table 1 and Table 2), implying that the calculated parameters are more accurate when using the VST-VBM3D denoising algorithm. In the meantime, we discovered that the artifacts are suppressed [Fig. 7(d)] and the PSNR and SSIM values were high (Table 3) when using the proposed denoising algorithm.ConclusionsThis study proposes a parameter evaluation algorithm based on the EMD algorithm and corresponding dispersion index, which can accurately evaluate the initial phase and modulation depth from the raw images and simultaneously analyze the evaluation accuracy. Simultaneously, this study also proposes a VST-VBM3D-based denoising algorithm for SIM raw images, which may suppress the noise in the raw images before the SR reconstruction procedure. This predenoise approach not only enhances the accuracy of parameter evaluation but also reduces the artifacts in reconstructed SR images.
Jan. 01, 1900Vol. 49 Issue 15 1507206 (2022)
Houxiang Xu, Bin Xu, Jichuan Xiong, and Xuefeng Liu
SignificanceIn 2009, influenza A (H1N1) broke out in Mexico and the United States, influencing 214 countries and killing at least 14000 people. The novel coronavirus epidemic which broke out in 2020 has still been raging all over the world for two years as the results of the huge difficulty in the rapid and real-time epidemic prevention detection and the other reasons. In addition, the spread of other viruses including dengue virus (DENV) and human immunodeficiency virus (HIV) is also threatening human health significantly. Virus detection is the key to curb the spread of the viruses.At present, enzyme-linked immunosorbent assay (ELISA) and polymerase chain reaction (PCR), as the gold standard in the field of virus detection, can be used to detect and trace virus samples with a high sensitivity. But these samples need to be collected to the laboratory, and the viruses must be isolated and determined using the sophisticated lab equipment operated by professionals in order to get accurate results. Surface plasmon resonance (SPR )and local surface plasmon resonance (LSPR) biosensors may be an effective alternative, as their structures are simple and easy to be miniaturized. Especially, the LSPR-based device only needs a light source and some sensing elements. Once the sensing elements successfully capture the virus, the detection process will be quickly, sensitively, and selectively finished. These characteristics of the SPR and LSPR techniques show their great application potential in the field of virus detection, especially for the point-of-care testing with limited conditions.With the rapid development of SPR and LSPR-based virus detection researches, researchers have reviewed the progress of materials and structures of sensors, methods for plasmonic virus detection, and their characteristics of signal amplification, and so on. According to the four general virus detection methods and starting from the four kinds of target analytes captured by the sensor, this paper systematically outlines the latest researches of the SPR and LSPR techniques for detecting viruses, which are of great significance for their clinical application (Fig. 1).ProgressFirst, according to the four methods for virus detection, the application progress of SPR and LSPR in the fields of antibody, antigen, nucleic acid, and virus particle detection is reviewed successively. For the SPR or LSPR sensors based on the binding principle of specific antigen-antibodies, the detection limit is further optimized by modifying the appropriate antigens or antibodies. More stable and inexpensive aptamers and molecularly imprinted polymers are expected to replace antibodies as sensor recognition elements to detect virus antigens or particles. Because the number of virus genomes in clinical samples is usually very small, the detection of nucleic acid by SPR or LSPR alone is limited. However, the detection of virus samples with the concentration at the femto scale can be realized by combining SPR or LSPR with DNA amplification and fluorescent substances. Second, the problems of biological medium contamination and repeatability encountered by biosensors as well as their solutions are introduced (Fig. 13). As for the contamination of biological media, self-assembled monolayers (SAM) can be synthesized on the surface of sensor elements to alleviate this problem. Riedel et al. further reduced or even completely inhibited the biological contamination of plasma and serum by synthesizing polymer brushes. In order to ensure the repeatability of sensing elements, Yoo et al. used magnetic beads replaced under the control of magnetic field as the sensing element, allowing that the sensor chip could still work stably after many repeated measurements. Third, the configurations and parameters of the SPR and LSPR sensors for virus detection in the past 15 years are listed (Table 1), and the advantages of the SPR and LSPR techniques are described. Finally, the optimization strategies of the SPR and LSPR techniques and the present existing problems are summarized. Moreover, the application prospect is also forecasted.Conclusion and ProspectAccording to the current research progress, the optimization strategy of the SPR sensor mainly focuses on film material sensitization and metal particle coupling sensitization. The former includes the application of 2D materials and molecular imprinting through the construction of surface films to enhance practicality and applicability. In contrast, the latter uses nanoparticles to form sandwich structures. The LSPR sensing strategies are concentrated on the design and optimization of nanoparticles or nanostructures, which are often combined with fluorescent substances such as quantum dots (QDs) to form sensing probes for virus detection by the light absorption peak shift or the fluorescence intensity change. The LSPR biosensors are normally easier to be miniaturized than the SPR counterparts. In a word, the SPR and LSPR sensors show great application prospects in the field of virus detection. Predictably, owing to the diversity of the SPR and LSPR virus sensor modifiers, it may be possible to detect specific viruses for multiple target analytes at the same time through the integration of sensor recognition elements, which enables the multi-dimensional evaluation of virus infection in a short time to avoid false negative and false positive cases.
Jan. 01, 1900Vol. 49 Issue 15 1507401 (2022)
Fei Hu, Yanfei Liu, Xichen Li, Minghang Cao, Niancai Peng, and Zhenxi Zhang
ObjectiveClustered regularly interspaced short palindromic repeats (CRISPR) has shown significant promise as an emerging nucleic acid detection technology. However, it still requires improvement in terms of sensitivity, detection automation, and anti-pollution. Furthermore, CRISPR technology lacks simple and portable professional equipment to meet the high demand of rapid point-of-care testing. Therefore, this study proposes a CRISPR/Cas12a detection reaction system for SARS-CoV-2. This detection response system and innovative tube-in-tube consumables aid in developing a portable compact device for simultaneous automatic detection of several samples and a coaxial fiber-based fluorescence detection system. Finally, we developed a single-sample user-friendly nucleic acid detection APP based on smartphone recognition and detection results for the manual detection mode.MethodsThe target in this study was severe acute respiratory syndrome coronavirus-2 (SARS-CoV-2), which was detected using the CRISPR method and enhanced via the reverse transcription-recombinase polymerase amplification (RT-RPA) technique; the feasibility was assessed using the reverse transcription-polymerase chain reaction (RT-PCR) amplification method in the early stages. Various companies customized the required reagents and the designed sequences. In the detection process, first, with the tube-in-tube consumables developed by our team in the early stage, which comprised the reaction outer and inner tubes, the amplification reagents and detection reagents were loaded into the inner and outer tubes, respectively. The temperature was regulated to 37-42 ℃ to complete the amplification. The reagents in the inner and outer tubes were then mixed by shaking or centrifugation, and the temperature was adjusted to complete the CRISPR reaction. Finally, it was possible to observe if there was any fluorescence occurrence under the illumination of a blue light. The detection instrument was composed of an optical cassette and a base, and automatic detection was realized through a printed circuit board (PCB), a human-computer interaction display screen, etc. In addition, this study also used the fluorescence image recognition algorithm to process the detection images, compared with the international standard polymerase chain reaction (PCR) technology to explore the detection limit, and increased the target types to test the specificity strength.Results and DiscussionsThe lower part of the detection instrument designed by our team integrates the printed circuit board and the human-computer interaction display screen. In the automatic detection mode, the fluorescence recognition circuit was designed with the help of a 470 nm light-emitting diode (LED), an optical filter, a complementary metal oxide semiconductor (CMOS) camera, a collimating lens, and a coaxial fiber. At the same time, the specificity of the theoretical experiment was verified through comparative experiments on several different targets. In addition, to verify the accuracy of this method for detecting actual samples, we compared each actual sample through PCR detection and the method based on the combination of RT-RPA and CRISPR proposed in this study. The detection results showed that the two were perfectly consistent.ConclusionsThe current study proposed a CRISPR/Cas12a-based anti-pollution portable nucleic acid detection technique. Furthermore, a simple model was proposed based on the naked eye or smartphone to recognize results; additionally, a downsized portable device based on fluorescence detection that can simultaneously detect numerous samples was constructed. The portable device can detect numerous samples simultaneously, and it has a constant heating mechanism and fluorescence stimulation detection optical channel to enhance the detection system’s accuracy and stability. The nucleic acid of SARS-CoV-2 was verified using the proposed method and detection system. The minimum detection limit was
Jan. 01, 1900Vol. 49 Issue 15 1507402 (2022)
Jing Liu, Xiaofeng Fang, Zhen Yuan, and Changfeng Wu
ObjectiveDiabetes mellitus is a chronic and noncommunicable disease with complications in the retina, heart, kidney, and neural system. The effective monitoring of blood glucose level is crucial in the prevention, diagnosis, and management of diabetes. Compared with single-point detection, a continuous glucose monitoring system can track the blood glucose fluctuation and help in predicting the trend of blood glucose change. Recently, various continuous glucose monitoring systems have been developed. The most widely used monitoring modality is electrochemical sensors, which collect glucose information in the interstitial fluid using an implanted enzyme-immobilized electrode. However, electrochemical sensors have some issues, including the limited glucose monitoring time and the risk of infection. Conversely, transdermal detection-based optical sensors exhibit prolonged service time and decreased risk of infection. Luminescent nanoparticles have shown great potential in biological applications because of their high brightness, high photostability, and good biocompatibility. Here, we developed a continuous glucose monitoring system based on a visible-light-excited nanoparticle transducer. We experimentally demonstrated that the nanoparticle transducer is promising for sensitive glucose detection. The visible-light-excited transducer shows potential in long-term and high-frequency monitoring in practical applications with reduced side effects compared with ultraviolet radiation.MethodsThe nanoparticles were prepared using a visible-light-excited fluorescent molecule and the oxygen-sensitive phosphorescent dye via the reprecipitation method. The resulting nanoparticles were characterized via UV-Vis absorption spectra, transition electron microscopy (TEM), and dynamic light scattering (DLS) measurements. The glucose-sensitive nanoparticle transducer was formed by modifying glucose oxidase onto the surface of nanoparticles via EDC-catalyzed bioconjugation. The successful bioconjugation of oxygen-consuming enzyme onto the nanoparticle was characterized by the change in hydrodynamic diameters and zeta-potentials. The biocompatibility of the nanoparticles was characterized through cytotoxicity experiment. The glucose sensitivity of the nanoparticle transducer was examined by measuring the emission spectra under different glucose concentrations (0-20 mmol/L). The intracellular glucose sensing of the nanoparticle transducer was performed on MCF-7 cells. The MCF-7 cells were incubated with the nanoparticle transducer first in a sugar-free medium. Additional glucose solution was introduced with the final concentrations at 20 mmol/L. The luminescence images under different glucose concentrations (0 and 20 mmol/L) were captured.We investigated the in vivo glucose monitoring performance of the nanoparticle transducer. The nanoparticle-GOx transducer (50 μg/mL) was subcutaneously implanted in the lower back of mice under anesthesia. The blood glucose concentrations of the mice were elevated by the intraperitoneal injection of glucose solutions (1 mol/L, in Milli-Q water). Subsequently, blood samples were collected from the tail of mice, and the blood glucose concentrations were tested using a commercial glucometer. Using a small animal biophotonic imaging system, the luminescence images of the subcutaneously implanted nanoparticle-GOx transducer were collected. The luminescence intensity of the implanted nanoparticle transducer was measured and compared with blood glucose concentrations. The mice with the intraperitoneal injection of PBS were adopted as the control group.Results and DiscussionsThe oxygen-sensitive nanoparticle comprises a fluorescent molecule DPBF, an oxygen-sensitive phosphorescent dye PdTFPP, and a functional polymer PSMA. The resulting nanoparticles have a hydrodynamic diameter of 18 nm, as indicated by the TEM and DLS results. The successful bioconjugation of glucose oxidase onto the nanoparticle surface was characterized by the increased hydrodynamic diameters and zeta-potentials. According to the spectroscopic experiments, the phosphorescence intensity (~672 nm) of the nanoparticle-GOx transducer increased as the glucose concentration increased, whereas the fluorescence intensity (~490 nm) remained unchanged. The designed ratiometric sensing system can help in eliminating the luminescence fluctuations caused by the variation in excitation intensity and environmental conditions. The nanoparticle-GOx transducers exhibited a fast response time to distinguish different glucose concentrations. The luminescence spectra of the nanoparticle-GOx transducers under different glucose concentrations were measured within 10 min after adding glucose to the solution. A good correlation was exhibited between the luminescence intensity of the nanoparticle-GOx transducers and glucose concentrations.The cell viability of the MCF-7 cells did not change considerably after incubating with the nanoparticles at different concentrations. The results indicated that the nanoparticles are biocompatible for the following intracellular glucose sensing experiments and in vivo glucose monitoring experiments. The nanoparticle-GOx transducer exhibited a reversible response to glucose, and the monitoring performance remained unchanged for more than 10 repetitive tests. The nanoparticle-GOx transducer exhibited excellent photostability against hydrogen peroxide and free radicals. The reversible response and excellent photostability enabled the stable and long-term continuous glucose monitoring. After adding glucose, the luminescence intensity of the internalized nanoparticle transducers by the cells was obviously enhanced, indicating that the nanoparticle transducer has the potential for intracellular glucose sensing. For in vivo glucose monitoring, we collected the luminescence images of subcutaneously implanted nanoparticle transducers. The transdermal detection of the nanoparticle transducers was achieved because of its high brightness. After the intraperitoneal injection of glucose solution, the luminescence intensity of the subcutaneously implanted transducers increased with the increased blood glucose concentrations, whereas in the control group, the luminescence intensity and blood glucose concentrations remain unchanged after the intraperitoneal injection of PBS. These results indicate that the luminescent nanoparticle transducers are promising for in vivo continuous glucose sensing.ConclusionsWe developed a continuous glucose monitoring system based on a visible-light-excited luminescent nanoparticle transducer. The nanoparticle transducer can be used for the transdermal detection of blood glucose because of its high luminescence brightness. We demonstrated in vitro cellular glucose sensing and in vivo glucose monitoring in animal models. With the ratiometric sensing system, the signal fluctuations caused by the variation in excitation intensity and environmental conditions would be eliminated. The visible-light-excited transducer can also avoid the side effects induced by ultraviolet radiation, indicating the potential for long-term and high-frequency monitoring in practical applications.
Jan. 01, 1900Vol. 49 Issue 15 1507403 (2022)
Guangying Xu, Jinbao Wang, and Dawen Xue
ObjectiveThe success of laser hyperthermia techniques depends on precise prediction and control of temperature in the tissue. The study of time-domain analytical solutions can not only verify the results of the numerical models but also contribute to the implementation of technical solutions with few technical errors. Because the excitation time of a laser source is very short compared to tissue equilibrium time, non-Fourier models have become important in theoretical research. Currently, constant heat flux is regarded as a time-dependent physical quantity, which is inconsistent with experiment results in the literatures. In this study, based on modified constant heat flux, a corrected non-Fourier boundary condition is established, and the analytical solution is obtained by integration transformation. The temperature rise and distribution curves obtained using a modified model are consistent with the experimental results in the literatures. In addition, the time-independent non-Fourier boundary condition is inconsistent with the thermal equilibrium. Furthermore, the different heat transfer mechanisms of the single-phase lag model (SPLM) and double-phase lag model (DPLM) under modified non-Fourier boundary conditions are analyzed, and their differences from those of existing models are discussed. The result shows that the time factor should be considered in constant-heat-flux models of biological tissues, otherwise the predicted results will be inconsistent with the experiment results.MethodsBased on the delayed non-Fourier law, which includes non-Fourier single- and two-phase lag equations, non-Fourier heat conduction equations of biological tissue in one-dimensional space were established, including an SPLM, a DPLM, and the classical Peens biological model (PBM). Considering the strong scattering biological surface, the time-dependent non-Fourier boundary condition of constant-heat-flux irradiation was established, and the theoretical solution was obtained via integration transformation under a quasi-static initial condition. Also, a theoretical solution of the time-independent constant-heat-flux irradiation problem was obtained.Results and DiscussionsBased on the obtained analytical solutions, the heat transfer mechanism among PBM, SPLM, and DPLM are discussed and compared to some results in the literatures. The obtained results are as follows:1) When constant-heat-flux is treated as time-independent, the temperature distribution at any time does not obey the law of energy conservation, and among PBM, SPLM, and DPLM, the temperature distribution predicted by PBM is the highest at any time, whereas that of SPLM is the lowest. Also, the temperature variation of SPLM has no jump in wavefront at any position [Fig. 2(a)].2) The temperature distribution of a closed solution with a corrected boundary condition at any time obeys the law of energy conservation, and among PBM, SPLM, and DPLM, the temperature distribution predicted by SPLM at any time is the highest, whereas that of PBM is the lowest, and that of DPLM prediction is between them near the surface. It is worth noticing that only SPLM predicts a sudden rise in wavefront, while DPLM and PBM do not. [Fig. 2(b)].3) Under the corrected non-Fourier boundary condition, SPLM predicts a rapid jump in the temperature change at all positions, which is consistent with the experimental results in the literatures (Fig. 3). Under the wrong non-Fourier boundary condition of time-independent heat flux, PBM predicts a faster change in temperature than SPLM and DPLM, whereas the temperature is the highest, which is in contrast to the experimental results in the literatures.4) Space-time temperature fields were compared. The corrected wavefront of SPLM is like a vertical cliff [Fig. 5(a)], which differs from the existing wavefront [Fig. 7(b)]. Besides, due to the wrong boundary conditions, the corresponding temperature predicted by PBM (Fig. 4) is higher than that of DPLM and SPLM (Fig. 7).5) Under the corrected non-Fourier boundary condition, the bigger the heat-flux lagging time τq,the lower the thermal velocity, and the higher the rising amplitude when the lagging time of the temperature gradient is fixed (Figs. 8 and 9). At a constant lagging time of heat flux τq,with an increase in the temperature gradient time τT,the temperature predicted by DPLM decreases at all positions (Fig. 11), and the lower temperature at any time less than that of the SPLM near the surface (Fig. 10). These results are consistent with the experimental results in the literatures, but the existing constant-heat-flux boundary conditions are very different, and many conclusions are opposite.ConclusionsBased on the results, we conclude that:1) When constant-heat-flux is regarded as time-independent, the temperature distribution at any time is inconsistent with the law of energy conservation. Thus, time-independent boundary conditions cannot satisfy the heat balance equation on the boundary.2) With a corrected boundary condition, the temperature distribution at any time obeys the law of energy conservation. Thus, the corrected boundary condition is energy conservation and satisfies the non-Fourier biological heat transfer equation.
Jan. 01, 1900Vol. 49 Issue 15 1507404 (2022)
Yong Yang, Hao Dong, Shu Wang, Yaosuo Sang, Zhigang Li, Long Zhang, Chongwen Wang, and Yong Liu
ObjectiveInfectious diseases caused by foodborne pathogenic bacteria are always one of the most severe public health problems. Accurate detection of pathogenic microorganisms in food is necessary to guarantee food safety and to contain bacterial infection. Microbial culture-based methods and biochemical tests are still the golden standard in bacterial detection; however, these methods are time-consuming, taking about 2-3 days to carry out, and follow more than ten operation steps. In addition, new diagnostic technologies, such as conventional polymerase chain reaction, mass spectrometry, and DNA sequencing, suffer from many disadvantages including long processing time, laborious operation steps, limited sensitivity, and high cost; thus, they still cannot meet the requirements for clinical diagnosis and point-of-care testing. In recent years, bacterial detection methods based on surface enhanced Raman scattering (SERS) have achieved significant success and performed excellently on high-sensitivity, easy-to-operate, and fingerprint-based detection methods. In this paper, four major foodborne bacteria, namely, Staphylococcus aureus (S. aureus), Escherichia coli (E. coli), Vibrio parahaemolyticus (V. parahaemolyticus), and Listeria monocytogenes (L. monocytogenes), are used as research objects. Furthermore, a novel SERS method, which combines positively charged Ag nanoparticles (AgNPs+ ) and convolutional neural networks (CNN), is proposed in this paper for accurate and rapid detection of the above four bacteria.MethodsClinical isolates including 10 strains from each of S. aureus, E. coli, V. parahaemolyticus, and L. monocytogenes are collected from the laboratory department of the Affiliated Hospital of Xuzhou Medical University. First, AgNPs+ are prepared via reduction method of NaBH4 and are fabricated in a buffer solution as substrate for SERS. Then, AgNPs@bacteria complexes are formed via electrostatic interactions, and high-quality SERS signals in a shift range of 400-1800 cm-1 of pathogenic bacteria are measured from the forming complexes. Finally, a residual network consisting of 11 one-dimensional convolutional layers (ResNet11) is established and trained on these signals as the spectral classifier. In the spectral identification process, while a SERS spectrum collected from unknown samples is inputted to the trained classifier, the classification probability corresponding to the above four bacteria is calculated, and the label of the maximum value is taken as the predicted label. Based on this strategy, the accurate and precise laboratory testing of bacteria is realized by a high-performance optical analysis technique.Results and DiscussionsIt can be observed from the transmission electron microscope images that AgNPs+ are closely binding onto the cell walls of S. aureus and E. coli in mixed solution. Zeta potential measurement results of AgNPs+ and four bacteria represent the mechanism of the closely combined strong electrostatic attraction between bacteria and AgNPs+ . The spectral measurement results of four types of AgNPs@bacteria complex show that AgNPs+ are an excellent SERS substrate. Mainly in bands of 624 cm-1, 730 cm-1, etc., obvious Raman peaks of the four pathogens with strong intensity are enhanced. By comparing and identifying the functional groups corresponding to the main Raman peaks in SERS fingerprint spectrum, it is confirmed that the SERS measurement results are consistent with the reported literature. In addition, the average relative standard deviation of SERS measurements of ten times is about 7%, which presents well reproducibility. Meanwhile, the differences between SERS spectra from the four bacteria are studied and identified. For these four types of approximate spectra, the trained classifier ResNet11 achieves average accuracies of 99.30% for SERS fingerprints, with bacteria solution molecular concentration of 107 mL-1, and also achieved average accuracies of 98.00% for low-intensity SERS fingerprints with the molecular concentration of 103 mL-1. ResNet11 performs better accuracy and stability compared with other commonly used classification methods, such as Logistic regression, SVM, random forest, and KNN. Furthermore, ResNet11 may promote the practical application level of SERS technology.ConclusionsSERS technology can promise sensitive and label-free detection for bacteria and antibiotic susceptibility testing in single steps. However, achieving practical application remains challenging due to the unstable signal intensity and similar spectral curve. In addition, due to the large size of bacteria (0.5-10 μm), which is far beyond the nano gap that can produce stable SERS hot spots, the SERS enhancement effect of bacteria has always at a lower level. There are two ways to improve the quality of bacterial SERS signal: 1) by improving the stability of the substrate in the experiment; 2) by exploring the excellent combination between the substrate and bacteria. In this paper, AgNPs+ are prepared as SERS sensing substrate. The close and dense combination with bacteria that are negatively charged in solution can provide high-quality signal with high intensity and good reproducibility. On the other hand, novel algorithm of CNN based on residual structure can guarantee the identification accuracy of SERS spectra. It can reduce the opposite impact caused by spectral quality indirectly and can promote the practicability of SERS in bacterial detection. In summary, we propose an accurate and sensitive method for foodborne bacteria detection by using AgNPs+ and CNN. Considering the other advantages including good stability and easy operability, we believe that our approach will become a promising tool for bacterial detection in the laboratory.
Jan. 01, 1900Vol. 49 Issue 15 1507405 (2022)
Haisheng Ou, Pengfei Zhang, Xiaochun Wang, Ying Chen, Junxian Liu, and Guiwen Wang
ObjectiveBioethanol is an important renewable and clean energy source. Much effort has been put into selecting and constructing ethanol-tolerant yeast strains to improve ethanol yields. However, previous studies have often been limited to screening and obtaining tolerant mutants, with a little in-depth investigation of the phenotypic changes during fermentation. Most studies have been conducted at the population level, which masks intercellular heterogeneity. Microbial cells in a population may exhibit heterogeneity, i.e., individual cells respond differently, under stress conditions. Therefore, developing a phenotypic analysis strategy based on single-cell techniques is imperative for better understanding the stress resistance mechanisms of yeast cells. In this study, Raman tweezers are used to collect single-cell spectra of different yeast strains at different times of ethanol fermentation. Data mining technique using the multivariate curve resolution-alternating least squares (MCR-ALS) method is performed to extract spectra and spectral intensity profiles associated with specific biomolecules and gain insights into the metabolic fermentation processes and adaptation mechanisms of yeast cells.MethodsThree Saccharomyces cerevisiae strains, Bp1, INVSc1, and W303a, are used. After activation in a solid YEPD medium, the yeast strains are transferred to a liquid YEPD medium and incubated overnight at 30 ℃ and 220 r/min. Then, they transfer to a fermentation medium (i.e., 300 g of glucose, 5.0 g of peptone, 0.06 g of CaCl2,0.06 g of MgSO4·7H2O, 1.5 g of KH2PO4,1000 mL of distilled water, and pH 4.5) at 5% inoculum for ethanol fermentation. The optical density at 600 nm (D600) of the culture is measured to estimate the growth of yeast cells. The content of glucose and ethanol in the fermentation broth are determined using Raman spectroscopy.The Raman tweezers are used to acquire the Raman spectra of individual yeast cells. The laser tweezers randomly capture individual cells. The Raman signals of the cells are collected with an acquisition time of 30 s. A self-programmed MATLAB program is used to preprocess the data. The raw spectra are subtracted from the background spectra and then smoothed using the 17-point Savitzky Golay method and baseline corrected using the alternating least squares (ALS) algorithm. MCR-ALS, a chemometric method for resolving the individual, pure components within an unknown mixture, is run using the MATLAB toolbox MCR-ALS GUI 2.0. First, multiple single-cell Raman spectra from different periods are formed into column-increasing matrices. Then, the spectral intensity profiles of the components are initially estimated using evolving factor analysis. To reduce the ambiguity of the resolution results, non-negativity constraints are used for the concentrations and spectra.Results and DiscussionsThe Bp1 strain shows the best fermentation performance, followed by the INVSc1 strain and the worst by the W303a strain. Five or three different biomacromolecules’ spectra and spectral intensity profiles are resolved for each strain, mainly lipid-related substances (phospholipids, triglycerides, and lipoproteins), polysaccharides, or proteins. The content of lipids in W303a strain does not increase significantly during the fermentation. In contrast, INVSc1 and Bp1 strains, which have a higher ethanol production capacity, increase with ethanol volume fraction, showing the prominent role of lipids in the resistance of yeast cells to ethanol toxicity.The Bp1 and INVSc1 strains have high phospholipid content in the late fermentation stage, showing that yeast cells increase ergosterol content to adapt to the accumulating ethanol. It is hypothesized that in strains with high ethanol-producing capacity, yeast cells may increase the synthesis of triacylglycerol, consequently increasing the fluidity of the cell membrane to mitigate the damage by ethanol, thus making the endogenous ethanol flow out more easily. In addition, the cells will also increase the synthesis of ergosterol to maintain the integrity of the cell membrane and therefore have greater stress tolerance and better fermentation performance.The content of major biomacromolecules is relatively homogeneous between cells in the Bp1 strain under the same fermentation conditions (Fig. 3). Simultaneously, cellular heterogeneity is high in the less ethanol-tolerant strains, INVSc1 and W303a (Figs. 4 and 5). This indicates that cell heterogeneity affects the strains’ ethanol fermentation performance and fermentation efficiency.ConclusionsWe apply single-cell Raman spectroscopy combined with MCR-ALS to rapidly obtain information on the variations in the spectral intensity of major biomacromolecules (i.e., phospholipids, proteins, polysaccharides, and triglycerides) in yeast cells during ethanol fermentation at the single-cell level without any a priori information. We find that lipids (i.e., phospholipids, triglycerides, and lipoproteins) and cell heterogeneity have an imperative role in the strain’s fermentation performance and efficiency. Therefore, the method is consistently outstanding in exploring resistance mechanisms in yeast cells and has wide application prospects.
Jan. 01, 1900Vol. 49 Issue 15 1507406 (2022)
Zhibin Zhao, Cheng Cheng, Yinghong Jin, Wenbo Zeng, Qinlong Jin, Quan Li, Jiaojiao Li, Yi Qu, and Baoxue Bo
ObjectiveThe ongoing coronavirus pandemic has propelled the need for new approaches to disinfection, especially for airborne viruses. The 254 nm emission of low-pressure vacuum lamps is known for its antimicrobial effect; however, its radiation is harmful to human health, causing skin cancer and cataracts. Some studies have shown that short-wavelength ultraviolet (UV) light in the spectral region of 200-230 nm (far-UVC) can inactivate pathogens without harming human cells. Thus, it has great prospects for many applications. Sufficient studies have proved the antibacterial performance of far-UVC band range in an excimer lamp emitting a peak wavelength of 222 nm light. Furthermore, laser light sources can realize long-distance transmission and complement the deficiency of excimer lamps in remote sterilization and disinfection. This study investigates the antibacterial effect of a self-developed far-UVC laser with a peak wavelength of 228 nm and hopes to provide a new technical approach for the inactivation of the novel coronavirus and other microbial pathogens.MethodsBacterial sample preparation: Escherichia coli (E. coli) widely exists naturally and is a pathogen of major focus in human public health defense. It is also one of the most drug-resistant species in the enterobacterium group. Therefore, it is often used in ultraviolet disinfection and environmental health research. Bacillus cereus (B. cereus), which is closely related to humans, causes food poisoning and cannot be eliminated by pasteurization or normal hygiene procedures due to the heat and acid resistance of its spores. Therefore, the strains used in this experiment are E. coli and B. cereus. E. coli and B. cereus are provided by the Ministry of Education Key Laboratory for Ecology of Tropical Islands, Hainan Normal University, and subsp. Kustaki HD-1, provided by the Environmental Microbial Ecology Laboratory of Hainan Normal University. Both strains are cultured in a nutrient agar medium and placed in an incubator at 35 ℃ for 1 day. Nutrient agar medium is provided by Guangdong Huankai Microbial Technology Co., LTD, China. UV irradiation source: the irradiation source is a self-developed all-solid-state 228 nm far-UVC laser, which provides UV irradiance of up to 35 mW/cm2, and its spectral linewidth is less than 0.1 nm. The laser is realized by LD-pumped Nd3+ laser crystal, Q-switched technology, and nonlinear optical frequency conversion technology. All-solid-state lasers have the advantages of small size, high efficiency, good beam quality, high reliability, long life, and portability. 228 nm far-UVC laser sterilization: we input a certain concentration of 1 mL bacterial suspension sample into a high permeability UVC cuvette. The 228 nm laser irradiance of 0.1 mW/cm2 is obtained by adjusting the laser output power and the placement of the colorimeter. E. coli suspension samples are irradiated for 5, 10, 15, and 20 s [Fig. 1(b)], and B. cereus suspension samples are irradiated for 15, 30, 45, and 60 s [Fig. 1(c)] at 228 nm far-UV light of 0.1 mW/cm2. The experiment is repeated three times for each sample at the same irradiation dose.Results and DiscussionsFigs. 1 (b) and (c) show the distribution of bacteria before and after 228 nm laser irradiation. The concentration of bacterial suspension samples in the control and irradiated groups is determined using the nutrient agar plate counting method. The detection results are shown in Table 1. When the E. coli suspension is irradiated by 228 nm laser for 10, 15, and 20 s (1, 1.5, and 2 mJ/cm2), the inactivation rates are 90.7%, 96.9%, and 100%, respectively. When the B. cereus suspension is irradiated by 228 nm laser for 30, 45, and 60 s (3, 4.5, and 6 mJ/cm2), the inactivation rates are 88.4%, 98.6%, and 100%, respectively.ConclusionsThis experimental study shows that the use of several mJ/cm2 doses of far-UVC 228 nm pulsed laser irradiation can effectively inactivate E. coli and B. cereus, whereas the use of excimer lamps requires dozens of mJ/cm2 doses. Compared with the excimer light source, the far-UVC pulsed laser light source shows a stronger sterilization effect. The next step is to conduct experimental research on the inactivation of the influenza virus using a far-UVC 228 nm pulsed laser.
Jan. 01, 1900Vol. 49 Issue 15 1515001 (2022)
Ziyi Zhang, Chenyang Yu, Yilin Qiao, Lijun Shen, Dan Cheng, and Peng Li
ObjectiveAcute ocular hypertension during ophthalmic surgery may lead to decreased retinal blood perfusion, nerve cell damage, and serious postoperative complications. Thus, in depth intraoperative blood perception is required, which standard surgical microscopes supply limitedly. Fluorescein angiography (FA), a traditional method for evaluating retinal blood flow, necessitates injecting fluorescent markers into the subject, which can be time consuming, invasive, and cause various side effects. Optical coherence tomography angiography (OCTA), as a functional extension of optical coherence tomography (OCT), provides a noninvasive, capillary level, and unmarked three-dimensional (3D) blood perfusion using flowing red blood cells (RBCs) as intrinsic agents. Recent developments in high-speed OCT systems and efficient OCTA algorithms promote the clinical practice of OCTA. Here, several microscope-integrated OCT/OCTA systems have been reported, which suggest that iOCT can improve the quality of posterior and anterior segment surgery. However, directly applying the current design to the commercial surgical microscope is difficult because of the interference with surgical ergonomics, and few studies are available intraoperative angiography because of the low contrast between capillaries and retinal tissue in OCT.MethodsA microscope-integrated intraoperative OCTA (iOCTA) system, based on a commercial surgical microscope (OPMI Lumera 300, Carl Zeiss, Germany), is developed for structural and angiographic imaging. The iOCTA system uses an SLD and a high-speed spectrometer, offering the central wavelength of 850 nm, a full width at half maximum bandwidth of 200 nm, A-scan rate of 120 kHz, range of imaging depth of ~2.6 mm, and axial resolution of ~2.3 μm in air. A simple and reliable adapter is designed to couple the imaging lightpath of the microscope and the OCTA through the assistant microscope port from the side, allowing the OCT and microscope to focus simultaneously. This coupling method maintains the surgical ergonomics design of the surgical microscope and can conveniently upgrade the commercial surgical microscope. A noncontact wide angle observation system is used to achieve fundus imaging. A charge-coupled device (CCD) camera is linked to the surgical microscope to capture images or record videos. The feasibility of the proposed iOCTA system is confirmed by monitoring the blood perfusion of a live rabbit’s eyes during ophthalmic surgery. Acute ocular hypertension during cataract surgery or vitrectomy is simulated by artificially changing the intraocular pressure (IOP) of the rabbit’s eyes. The main stages of the ophthalmic surgery included puncturing the sclera, maintaining IOP at 60 mmHg for 10 min, and recovering IOP to the normal value for 1 h. A series of representative intraoperative angiography of the rabbit’s eyes is obtained in different stages during surgery. With 400 A-scans per B-scan, three repeated B-scans (in the X-direction) per lateral location, and 400 lateral locations (in the Y-direction) per 3D data, an OCTA scan is completed in ~4.8 s. To accurately distinguish dynamic blood flow regions and static surrounding tissues, the inverse signal-to-noise ratio (iSNR)-decorrelation OCTA (ID-OCTA) algorithm is used, where a classification line is set in a 1D space along the 3σ boundary of the distribution of static signals to remove the static tissues. By reconstruction and projection, a two-dimensional en-face image of OCTA containing dynamic signals of the whole 3D data is further achieved. Moreover, quantitative analysis of vessel density is performed to demonstrate longitudinal in-vivo optical imaging of retinal blood during surgery.Results and DiscussionsCompared with the image captured by the CCD camera of the surgical microscope, high-resolution iOCTA obtained by the iOCTA system not only visualizes more capillary details but also improves the contrast of imaging at the capillary level (Fig. 2). The en-face images of OCTA in Fig. 3 reveal that retinal capillary filling is extinguished, and the diameter of the big vessels reduce within the peak IOP (60 mmHg). Capillary filling and the diameter of the big vessels recover within 3 min after the intraocular pressure acutely decreases to the initial value. The vessel density trend in Fig. 4 reveals that the retinal vessel density decreases significantly (reduced to below 20% of the baseline) within 1 min when the IOP increases acutely during surgery, decreases mildly within 10 min of maintaining peak IOP (60 mmHg), and rapidly rises to the initial vessel density within 2 min when the IOP returns to normal. En-face images of OCTA and the trend of vessel density demonstrate the negative correlation between blood perfusion and the value of IOP.ConclusionsThis work presents an iOCTA system based on a commercial surgical microscope, which provides the dynamic monitoring of intraoperative retinal blood perfusion. High-resolution intraoperative blood perfusion imaging of a live rabbit’s eyes is acquired using this iOCTA system during ophthalmic surgery. A series of representative en-face images of iOCTA and the trend of vessel density reveal the spatiotemporal dynamic evolution of blood perfusion. Real-time monitoring of retinal blood perfusion during ophthalmic surgery is expected to be realized using this iOCTA system, which will help surgeons objectively evaluate the surgical procedures and predict postoperative effects.
Jan. 01, 1900Vol. 49 Issue 15 1507301 (2022)
Liu Yang, Huaying Wang, Zhao Dong, Haijun Guo, Jieyu Wang, and Wenjian Wang
ObjectiveChemical staining in biomedicine is used to observe the phase structure of transparent samples; however, it can change the structure of samples and even kill living cells, making it impossible to observe the life process of samples truthfully under a microscope. Phase contrast overcomes this difficulty and provides a microscopy technique for viewing specimens without labeling or staining, but the costs of complex optical configuration and computational time limit its further application. In addition, image self-focusing is a key step in the process of high-quality phase contrast imaging of samples. Multiple focuses are required to obtain sample information of different regions; thus, cell information cannot be obtained in real time. Current auto-focusing methods based on deep learning are faster and more accurate than conventional auto-focusing methods and do not damage living cells. Therefore, an auto-focusing phase contrast imaging method based on deep learning is proposed in this paper. This can realize auto-focusing phase contrast imaging without manual dyeing, focusing, and other steps. Moreover, a deep learning auto-focus phase contrast imaging (DLFP) network framework is designed for this imaging method, which can realize auto-focus phase contrast imaging quickly and accurately.MethodsAiming at the problems of manual focusing and phase plate switching in phase contrast imaging of common microscopic images, we proposed an automatic focusing phase contrast imaging method based on deep learning, and designed a network framework based on this method. Considering that with the increase in the depth of the network, the gradient explosion and gradient disappearance occurred during back propagation, we added a residual block (ResNet) on the basis of U-Net to solve the training difficulty caused by network depth and improved the accuracy and precision of the network. Moreover, intensive modules were used to strengthen the reuse of feature information, and the simple, lightweight, Gather-Excite Net spatial attention mechanism was introduced. It can better mine the context information of images or feature map spaces, so that the network can selectively strengthen the useful feature information and suppress useless information, enhance network performance, and improve image resolution. Image acquisition was mainly divided into two parts. The first part was image acquisition, wherein the microscopic image was obtained by manually adjusting the focal length to 0, ±4, ±8, and ±12 μm. This is followed by the obtainment of the corresponding phase contrast image of the microscopic image by moving the circular Zernike phase plate. The second part involved expansion of the dataset by translation, rotation, and other methods. The network input and output image size was 256×256. Approximately 29561 microscopic images at different defocusing distances were used as neural network datasets for different samples in network training, of which 95% and 5% were used as training sets and test sets, respectively.Results and DiscussionsExperimental test results included random defocused microscopic images of three samples and the corresponding network output results. The high SSIM values of the test output results and real values prove the feasibility of auto-focusing phase contrast imaging method based on deep learning. At the same time, pixel values of DLFP network output images and Ground-truth on horizontal and vertical lines were compared in detail. Three different samples were randomly selected for analysis, and a high degree of coincidence could be achieved in both horizontal and vertical directions, which further proves that the network output image is highly similar to the real one. This also proves the accuracy of the DLFP network. To demonstrate the advantages of the network framework designed in this paper, it was compared with the traditional U-Net structure and the generative adversarial network (pix2pix). DLFP, U-Net, and pix2pix were trained using the same dataset. We found that the pix2pix experimental results contain a lot of noise, whereas those of the U-Net network have lost some details. High SSIM values clearly indicate the advantages of the DLFP network framework. In practical applications, it is difficult to collect a large amount of data, and datasets are very important for deep learning. Therefore, in this paper, the generative adversarial network (pix2pix-GAN), which is often used to complete training with a small number of data sets, is used for experiments to further verify the effectiveness of auto-focusing phase contrast imaging method based on deep learning.ConclusionsA method based on DLFP network framework to transform defocused micrograph into focused phase contrast image was proposed. The experimental results show that this method can not only effectively improve the identification of cell structural features but also help to understand the phase contrast image in cell analysis and reduce the difficulty and cost of obtaining a phase contrast image. In addition, compared with the U-Net and generative adversarial networks, the high SSIM value shows the advantages of the proposed network framework. Finally, considering the fact that there is too little data in practical application, this paper adopts pix2pix-GAN to verify the validity of auto-focusing phase contrast imaging method based on deep learning, and the experimental results further prove its validity.
Jan. 01, 1900Vol. 49 Issue 15 1507302 (2022)
Shaowei Wang, and Ming Lei
SignificancePhotodynamic therapy (PDT) relies on the administration of photosensitizers (PSs) that are activated by light at a specific wavelength to produce cytotoxic reactive oxygen species (ROS) to kill cancer cells and other pathogens. As a result, photosensitizer, light source, and molecular oxygen are three critical components for PDT. When irradiated by light, good photosensitizers should exhibit strong light absorption, high photo-stability, and efficient ROS generation. To ensure effective light energy delivery to deep-seated diseases, the light source should be capable of penetrating biological tissues. Porphyrin derivatives are currently the majority of clinically approved photosensitizers by the Food and Drug Administration (FDA). Although they are activated by red light (~630 nm) in clinical applications to improve light penetration, this is not the wavelength at which they absorb the most. To improve the light penetration, photosensitizers with absorption in the red and near-infrared (NIR) regions, such as methylene blue and indocyanine green (ICG), were developed. ICG exhibits strong NIR absorption, but it suffers from low ROS generation efficiency, fast body clearance, and poor photo-stability. Furthermore, due to the energy threshold of the PS required to ensure efficient energy transfer from the triplet state to oxygen molecules, developing photosensitizers with long-wavelength absorption is extremely difficult. In comparison to the UV and visible light commonly used in traditional PDT, NIR light penetrates biological tissues much better due to the lower scattering effect. Two-photon excitation is one effective strategy of using NIR light as the light source for PDT in which the PSs are activated by the simultaneous absorption of two NIR photons to produce ROS [Fig. 1(a)]. Because the probability of two-photon absorption is very low for a photosensitizer, light with high peak intensity, such as an ultrafast femtosecond pulsed laser, is used for two-photon excitation. Furthermore, the laser is usually focused to increase the efficiency of two-photon excitation. When compared to one-photon excitation, two-photon absorption occurs only at the focal plane, and the out-of-focus signals are suppressed [Fig. 1(b)], which is due to the square dependence of the two-photon fluorescence intensity on the excitation light power. Two-photon excited PDT (2P-PDT) has considerable promise for high-precision deep tissue theranostics thanks to NIR light excitation and high-order nonlinear optical effects.ProgressThe efficiency of ROS generation and the two-photon absorption cross-section are two main factors that determine the therapeutic efficiency of 2P-PDT. Traditional photosensitizers, such as porphyrin derivatives and chlorophyll derivatives, have been adopted in a variety of 2P-PDT applications (Fig. 2). Despite efficient ROS generation, their poor water solubility, small two-photon absorption cross-section, and low photo-stability have limited their performance in practical applications. Over the last two decades, new generation PSs have been developed to improve cancer targeting. PSs are linked with antibodies, proteins, and other molecules that are overexpressed on cancer cells to improve selectivity and therapeutic performance. Furthermore, PSs are loaded onto a variety of nanoparticles, including quantum dots, gold-based nanoparticles, and polymer micelles, to build nano-platforms for efficient drug delivery. The intersystem crossing (ISC) process from the singlet excited state to the triplet excited state is critical in the generation of ROS. By incorporating heavy atoms into photosensitizers, such as iridium, ruthenium, iodine, and bromine, the spin-orbit coupling (SOC) can be enhanced, which favors the improvement of the ISC process. Furthermore, reducing the singlet and triplet energy gaps (ΔEST) can help to improve the ISC process (Fig. 3). Photosensitizers with donor-acceptor (D-A) structures have been developed in recent years to reduce the ΔEST value by separating the highest occupied molecular orbital (HOMO) and the lowest unoccupied molecular orbital (LUMO). Moreover, the D-A structured molecules also favor a large two-photon absorption cross-section. By adjusting the donor and acceptor moieties, and introducing π-conjugated linkers, their two-photon absorption can be improved due to the enhanced strength of the donor and acceptor, and the extended conjugation length (Fig. 4). Most organic photosensitizers are highly hydrophobic and show reduced ROS generation and fluorescence reduction in an aqueous environment due to an aggregation-caused quenching effect. To address this issue, novel photosensitizers with aggregation-induced emission (AIE) properties have been developed (Fig. 6). The AIE nanoparticle-based PSs performed excellently well in two-photon imaging and 2P-PDT, owing to their enhanced ROS generation and fluorescence intensity in aggregate states as nanoparticle formulations. Due to its specific advantages for deep tissue penetration, 2P-PDT has been used in image-guided precise blood vessel closure in vivo (Fig. 7). To improve ROS generation and two-photon absorption in a single photosensitizer molecule, a new concept called polymerization-enhanced two-photon photosensitization was proposed (Fig. 8). Recently, an NIR-II light (1000-1700 nm) activable photosensitizer with greater therapeutic depth than the NIR-I (700-950 nm) excitation was developed (Fig. 9). Even though the action section for 2P-PDT is relatively small, its applications for bulky solid tumor therapy have shown some promise with the advancement of ROS generation and light source (Fig. 10).Conclusion and Prospect2P-PDT is promising for precise cancer therapy in deep tissues due to the advantages of NIR light excitation and high-order nonlinear optical process. Efforts have been made to improve the ROS generation and two-photon absorption of PSs. Traditional PSs suffer from aggregation-caused quenching problems which are addressed by novel AIE PSs. Compared with one-photon PDT, 2P-PDT should not be focused on the therapy of large solid tumors due to its small action section. 2P-PDT has a lot of potential in basic research applications that require high resolution and precision, such as building a stroke model in mouse brain, precise intracellular ROS activation, selective cancer cell killing in vivo, etc. NIR-II excitation should be considered to improve the therapeutic depth of 2P-PDT. However, shifting the absorption of PSs to long-wavelength while maintaining ROS generation efficiency is a challenge. Therefore, future development for 2P-PDT should concentrate on extremely efficient PSs with long-wavelength absorption, NIR-II light excitation, increased two-photon excitation efficiency with a large field, and a single PS molecule capable of both good ROS generation and two-photon absorption capability.
Jan. 01, 1900Vol. 49 Issue 15 1507101 (2022)
Yidi Liu, Defu Chen, Jing Zeng, Haixia Qiu, and Ying Gu
SignificancePort wine stain (PWS), a skin disease with an incidence of 0.3%-0.5% in infants, is attributed to congenital and progressive cutaneous vascular malformations. PWS lesions appear as purplish red or pink patches on skin. PWS commonly occurs on the face and neck, but it can also appear anywhere on the body (e.g., arms or legs). PWS lesions give patients an extremely severe psychological burden about their cosmetic appearance, which may greatly reduce their life quality. The majority of PWS lesions darkens in color and thickens as time goes by. PWS lesions can become aggravated, leading to progressive disfigurement. Thus, early intervention and treatments are urgent to reduce the likelihood and severity of disfigurement and psychosocial morbidity.The key point of treating PWS is to selectively and precisely destroy the abnormal blood vessels that cause the discolored lesions. Vascular-targeted photodynamic therapy (V-PDT) has been introduced and remarked as the golden standard of the therapy for PWS in China since the early 1990s, which destroys the ectatic vessesls by using the double selectivity of light and photosensitizer. Several clinical studies show that V-PDT is safe and effective in the treatment of PWS at all ages. Nevertheless, there are still some patients who have relatively low sensitivity to V-PDT. The unsatisfied therapeutic outcome may result from the heterogeneity and complexity of the PWS morphological parameters. Therefore, mastering the relationship between PWS lesion structure and V-PDT efficacy is beneficial to the development of therapeutic plan and the assessment of prognosis.Skin biopsy is considered as the golden standard of acquiring the information of PWS lesion structure. Nevertheless, it is invasive which may lead to hypersensitivity to local anaesthetic agents, pain of local anaesthesia, bleeding, infection, and scarring. Hence, a painless and non-invasive imaging method for the in vivo assessment of PWS lesion structure will greatly benefit V-PDT treatments. With the development of optical imaging techniques, nowadays, they have showed much potential in obtaining the information of histopathology. Here, the relationship between PWS lesion structure (epidermis thickness, vascular diameter and depth, etc.) and V-PDT efficacy is summarized. In addition, the development of optical imaging techniques for obtaining PWS lesion structure is also reported.ProgressOptical coherence tomography (OCT) called 'optical biopsy’ has been greatly developed in recent 20 years. Conventional OCT is used to visualize the fine structures of skin tissue although it is not an ideal tool for visualizing cutaneous vessels. As a functional modality of OCT, optical Doppler tomography (ODT) and optical coherence tomography angiography (OCTA) with the use of conjunction with sophistic algorism can provide a powerful tool to visualize and quantitatively analyze the cutaneous vascular networks. ODT and OCTA enhance the blood flow contrast by extracting moving particles (red blood cells) from static tissues without dye injection. To sum up, OCT/ODT/OCTA are capable of acquiring the epidermis thickness, the diameter and depth of vessels. Moreover, ODT/OCTA can further image a three-dimensional (3D) vascular system. However, OCT/ODT/OCTA have a relatively shallow imaging depth (less than 1 mm) because it is based on the optical imaging mechanism.Photoacoustic imaging (PAI) combines the optical and ultrasonic merits is used to reduce the tissue scattering of photons with one-way ultrasound detection, while retaining the high optical contrast. Moreover, it can image over a 1 mm depth in skin. As an optical-contrast-based imaging technique, the photoacoustic imaging detects the endogenous skin chromophores, i.e., melanin and haemoglobin. PAI can obtain the content of melanin in epidermis, epidermis thickness, and vascular diameter and depth. Moreover, it can also achieve a 3D image of PWS vessels. However, PAI is a contact technique, in which a coupling medium (such as water and ultrasound gel) is required between the detector and tissue surface. Thus, it is unsuitable for an intraoperative use.Reflectanceconfocal microscopy (RCM) is also a commonly used clinical skin diagnostic device. It uses a low-intensity near-infrared laser to first scan the skin horizontally, and then collects the backscattered light for imaging. RCM is the relatively mature imaging equipment and it can obtain the depth and diameter of skin vessels, nevertheless, it has the drawbacks of two-dimensional (2D) imaging and shallow imaging depth (200-350 μm).Dermoscope is an imaging device that can magnify tens or even hundreds of times and eliminate the reflected light on the skin surface. Skin pigment and blood vessels are the two main elements of its observation, which have been widely used in the clinical practice. Although the dermoscope is convenient to use and fast to image, its imaging depth is limited (~250 μm), which cannot completely reflect the overall structure of PWS lesions, and the PWS manifestations under the dermoscope are irregular. Currently, the clinical application of dermoscope in PWS is still few.Laser Doppler imaging (LDI) and laser speckle imaging (LSI) are able to get the information of blood perfusion, however, they only offer 2D information and the resolution is relatively low.By applying the above techniques to obtain PWS lesion structure or biopsy, the relationship between PWS lesion structure and V-PDT efficacy is obtained as follows. In terms of melanin content in epidermis, it has the negative effect towards the V-PDT efficacy. It locates at the epidermis, absorbs the light, and influences optical absorbance. As for the epidermis thickness, it varies for different individuals and parts of the body, and affects the light penetration depth. Hence, it also has the negative effects towards V-PDT efficacy. In terms of vessels diameter, the larger the vessels, the less light can reach and cover the entire vessel. As for the vascular depth, the deeper the vessels are, the less light energy the vessels can absorb. The vascular morphological parameters also influence the efficacy. If the ratio of perpendicular vessels is higher than that of the curved ones, the efficacy is reduced due to the fact that the perpendicular vessels absorb less light than the curved ones. As for the blood perfusion, it is the mix-information which can be detected by LDI and LSI, and it may contain the information of diameter and depth. It is reported that if it decreases after V-PDT, the efficacy will be decent.Conclusion and prospectThis paper summarizes the current application of the non-invasive in vivo optical imaging technology in the diagnosis and treatment of PWS as well as the relationship between PWS lesion structure and V-PDT efficacy. By mastering the above information, the clinical doctors can develop an accurate and personalized V-PDT treatment of PWS and thus improve the therapeutic effects.
Jan. 01, 1900Vol. 49 Issue 15 1507102 (2022)
Shengsheng Wei, Yong Li, Jing Li, and Zhenxi Zhang
SignificanceFemtosecond lasers are solid-state lasers operating in the form of pulses. By focusing on the inside of a corneal tissue, free electrons and high-temperature plasma are generated to produce photocracking, which vaporizes the tissue near the targeted area, forming high-temperature and high-pressure bubbles. The bubbles expand rapidly to open and cut the corneal tissue. The extreme focusing ability and accurate positioning of a femtosecond laser allow cutting random shapes at any position in the corneal stroma through the use of artificial intelligence, exhibiting high accuracy, good safety, and simple operation. Therefore, femtosecond lasers can be applied in corneal surgeries.In 2000, the Food and Drug Administration approved the clinical application of femtosecond lasers in ophthalmology. The earliest femtosecond laser was mainly used to make a corneal flap in a corneal refractive surgery. Because the femtosecond laser can cut any shape in the corneal tissue with artificial intelligence, a plane parallel cut to the corneal surface in the anterior corneal surface stroma and then a perpendicular cut to the corneal surface after reserving the surrounding corneal pedicle were made to make the corneal flap for refractive surgery.Keratoconus is mainly treated by corneal collagen cross-linking surgery, corneal transplantation, and corneal stromal lenticule transplantation. With the continuous evolution of femtosecond laser technology in corneal surgery, it has become a good auxiliary tool for various surgical treatments of keratoconus, thereby improving the predictability and safety of surgery.ProgressCurrently, the femtosecond laser systems mainly used in clinics include IntraLase iFS150, Femtec 20/10, Femto LDV, Visumax, and WaveLight FS200. Different femtosecond laser systems have varying physical parameters and different advantages in corneal surgery. With the continuous advancement of femtosecond lasers and the sustained improvements in the theoretical model in ophthalmology, the lasers are widely used in other fields of ophthalmology. IntraLase iFS150, Femtec 20/10, and WaveLight FS200 can accurately make corneal flaps and perform penetration keratoplasty (PK), deep lamellar keratoplasty, corneal stromal ring segments, and so on. In 2009, the first commercial femtosecond laser system, LensX™, designed for cataract surgery was applied in clinical practice, opening new applications of femtosecond lasers in the field of ophthalmic cataract surgery. Subsequently, several similar laser systems were introduced, including Optimedica Catalyst, LENSAR®, Victus™, and so on.PK is the main treatment for patients with keratoconus at the last stage. Femtosecond lasers can design various customized incision modes, including top hat, mushroom, and Zig-zag (Fig. 2). Given that the lower width of the top hat corneal incision is larger than the upper width, it is conducive to the adhesion of corneal graft and graft bed and increases the biological stability of the wound under the action of postoperative intraocular pressure. Femtosecond laser-assisted deep anterior lamellar keratoplasty (FS-DALK) can better preserve the integrity of the corneal structure, reduce postoperative corneal rejections, and obtain low long-term transplantation failure rates. Compared with traditional DALK surgery, FS-DALK is less complicated, provides higher interface smoothness, and possesses greater ideal postoperative visual quality. Femtosecond laser-assisted intra-corneal ring segment is widely used in the treatment of keratoconus. Femtosecond lasers are used to make semicircular or circular tunnels in the corneal stroma, and PMMA plastic ring is implanted to reduce the curvature of the anterior corneal surface. With the continuous maturity of small incision lenticule extraction (SMILE), femtosecond lasers can be used to make a corneal stromal lenticule and stromal capsule, realizing femtosecond laser-assisted corneal cross-linking and corneal stromal lenticule covering-assisted corneal cross-linking. By making a capsule in the corneal stroma and then implanting the corneal stromal lenticule that is removed after SMILE operation in hyperopia patients, the thickness and the biomechanics of the cornea can be increased. In addition, by injecting riboflavin into the corneal stromal capsule and performing a corneal cross-linking surgery, the permeability of riboflavin can be increased and the surgical effect can be improved. Thus, the use of femtosecond lasers provides effective surgical schemes for treating keratoconus.However, various defects and risks exist in actual clinical practice, such as designing laser parameters for different surgical methods and different surgical positions; selecting the size and mode of the negative pressure suction in laser corneal refractive surgery; the high risk of surgical infection when patients are being transferred to the operating room during operation; incomplete corneal cutting caused by equipment failure; poor parameter settings, leading to intraoperative and postoperative complications. Therefore, the application of femtosecond lasers in keratoconus treatment necessitates continuous optimal designing, improvements in the surgical processes, and follow-up of long-term clinical results.Conclusions and ProspectsFemtosecond lasers have been used in ophthalmic surgery for over 20 years. The continuous development of laser technology and artificial intelligence control technology has helped achieve a smoother corneal cutting surface, a more regular corneal incision, a more accurate cutting depth, and less tissue damage. Concurrently, femtosecond lasers combined with other surgical methods expands the surgical boundaries of complex corneal diseases, shortens the operation time, improves the operation safety, provides comfortable treatment experience for patients, and introduces new methods for treating keratoconus.
Jan. 01, 1900Vol. 49 Issue 15 1507103 (2022)
Man Lei, Wen Pang, Bo Shi, Chen Wang, Dan Wang, Xunbin Wei, and Bobo Gu
ObjectivePhotodynamic therapy (PDT), which canablate cancer cells or diseased tissue by the generated reactive oxygen species (ROS) once the photosensitizers (PSs) are excited by light with specific wavelength, has attracted various attention in the last decades due to its unique advantages, including non-invasiveness, few side-effects, etc. The advancement of PDT has been significantly restricted by the penetration depth of the excitation light and sub-cellular organelles targeting capability. Here, an effective carbon dots (C-dots) photosensitizer with intrinsic nucleolus-targeting capability is synthesized, characterized, and employed for in vitro photodynamic anticancer therapy with enhanced treatment performance at a low dose of PS and light irradiation.MethodsThe optical system, which included a microscope and femtosecond laser, was designed for two-photon phototherapy. The nucleolus-targeted C-dots were synthesized using microwave heating. The characteristics of synthesized C-dots including particles size, absorption and emission, two-photon fluorescence, photobleaching, biocompatibility, etc., were measured by DLS measurement, UV-Visible spectrophotometer, fluorescence spectrometer, femtosecond laser, CCK-8 kit, respectively. The nucleolus-targeting capability of C-dots was investigated using fluorescence imaging. The HeLa cells were incubated with C-dots and irradiated with a femtosecond laser before cell viability was examined using Calcein-AM/PI staining and fluorescence imaging.Results and DiscussionsThe microwave heating method selects citric acid and ethylenediamine as raw materials to synthesize the C-dots. The synthesized C-dots were studied using dynamic light scattering measurement, and the average size of the C-dots was approximately 1 nm [Fig. 2(a)]. The C-dots absorbed light in various wavelengths from 300 to 700 nm, with the main absorption peak at 360 nm and a shoulder peak at 450 nm [Fig. 2(b)]. The C-dots exhibited excitation-dependent emission [Fig. 2(c)] and significant two-photon fluorescence when exposed to femtosecond laser irradiation [Fig. 2(d)]. The ROS-generation capability of the C-dots in aqueous solutions was investigated using ABDA as the ROS indicator under white light irradiation (400-700 nm, 100 mW/cm2). The ABDA was almost decomposed after 10 min illumination [Fig. 2(e)], indicating the ROS-generation capability of the C-dots. The long-term stability and photostability of the C-dots were characterized by measuring the absorption spectra at different time points [Fig. 2(f)] and after continuous irradiation [Fig. 2(g)], respectively. The experimental results showed that the C-dots had good long-term stability and photostability. CCK-8 kits were used to evaluate the biocompatibility of the C-dots before undergoing in vitro photodynamic therapy. For 24 and 48 h, no significant difference existed between control cells and cells treated with the C-dots in the mass concentration range of 250-750 g/mL, indicating the excellent biocompatibility of the C-dots. The C-dots were treated with HeLa cells to investigate their intracellular position, followed by fluorescence imaging. The fluorescence signal of the C-dots was observed in some round areas, i.e., nucleoli. HeLa cells were co-stained with the C-dots and one commercial nucleolus imaging probe, SYTO RNASelect, to demonstrate the C-dots’ nucleolus-targeting capacity. Figure 3 showed the fluorescence of the C-dots completely overlapped with that of SYTO RNASelect, confirming that the C-dots could specifically stain the nucleolus. HeLa cells were cultured with/without the C-dots (500 g/mL) for 3 h before being exposed to femtosecond laser irradiation to study the two-photon PDT efficiency of the C-dots (740 nm, 28 mW). The treated cells were incubated for 4 h following the irradiation and stained with Calcein-AM and PI. Figure 4 showed that more cells were PI-positive with an increment of irradiation time. When the irradiation time reached 45 s, almost all cells were necrotic, suggesting the excellent cancer cell ablation potential of nucleolus-targeted two-photon photodynamic treatment. The identical irradiation did not result in necrosis in the absence of the C-dots, indicating that laser irradiation had no effect.ConclusionsWe designed and synthesized novel C-dots with intrinsic nucleolus-targeting and ROS-generation capabilities. The nucleolus-targeted two-photon PDT exhibits outstanding cancer cell ablation efficiency at a low dose of the C-dots and light irradiation because the C-dots generated ROS is positioned within the nucleolus, which is an efficient cancer therapy site. Additionally, the developed C-dots possess some unique advantages, including ultrasmall size, long-term stability, and excellent biocompatibility, making them promising for practical two-photon PDT applications.
Jan. 01, 1900Vol. 49 Issue 15 1507104 (2022)
Jianwei Xue, Lingjin Wu, Xiaowei Shi, Jing Huang, Hang Liang, and Xianzeng Zhang
ObjectiveLaser ablation effect can be used to cut and grind the hard tooth tissues, thereby offering several advantages over traditional instruments. As a result, laser ablation technology is applicable to various dental procedures. The ablation effect of lasers on hard biological tissues is highly dependent on wavelength. As is well known, the erbium-doped yttrium aluminum garnet (Er∶YAG) laser is the most frequently used dental laser because its wavelength is close to the strong absorption peaks of water and hydroxyapatite. However, this wavelength laser has a low ablation rate and must be used in conjunction with water spray. According to previous research, the 9.3 μm CO2 laser has a higher absorption coefficient for apatite than the Er∶YAG laser and offers a number of unique advantages when it comes to biological hard tissue ablation. For example, irradiating teeth with a CO2 laser at a wavelength of 9.3 μm can improve their acid resistance, increase the anticaries effect of fluoride on teeth, and strengthen the bond between composite resin materials and teeth. However, there is currently no systematic evaluation report on the ablation characteristics of this wavelength laser on biological hard tissues, and data on the ablation of human dental tissue is also sparse.MethodsExperimental samples were randomly assigned to the A and B groups. In group A (the quantity of samples n=20), without spraying water, a single laser pulse irradiated the dentin and enamel on each sample with energy densities of 4.23, 4.61, 5.05, 5.56, 5.84, 6.14, 6.83, and 7.69 J/cm2 to determine the dentin and enamel laser ablation thresholds. In group B (n=20), to investigate the ablation characteristics of various energy densities, a single laser pulse irradiated the dentin and enamel with energy densities of 9.73, 37.14, 65.43, 88.42, and 106.10 J/cm2 under water spray (water flow rate of 0.25 mL/s) and non-water spray conditions. Following laser irradiation, the experimental samples were observed and photographed using a digital microscope. We defined the ablation threshold as the energy density that corresponds to 80% of the ablation probability, the ablation efficiency as the depth of ablation per unit of energy, and the ablation rate as the volume of ablation per unit time. Due to the relatively large time measurement error associated with a single pulse, the ablation rate in this study was expressed as the ratio of the measured volume to the elapsed time represented by the line scan (line length is 0.9 mm, scan speed is 60 mm2/s, and frequency is 500 Hz).Results and DiscussionsDue to the composition and structure of dentin and enamel, the ablation threshold of the 9.3 μm CO2 laser is greater for enamel (6.07 J/cm2) than that of dentin (5.76 J/cm2) (Fig. 3). Additionally, we discovered that the energy density of the pulse has a significant effect on the ablation characteristics of hard tooth tissues. On the one hand, as energy density increases, both the geometric size of the ablation crater and the rate of ablation increase (Fig. 5, Fig. 7). Moreover, the dentin and enamel laser ablation rates reach their maximum values when the energy density reaches 106.10 J/cm2 and the frequency is 500 Hz, and the maximum values are (0.308±0.026 ) mm3/s and (0.510±0.032) mm3/s, respectively. The crater created by the 106.10 J/cm2 laser energy density is inverted cone-shaped and noncarbonized, but the surface morphologies of dentin and enamel are different (Fig. 4). On the other hand, the mean value of laser ablation efficiency of dentin decreases as the energy density increases, whereas the mean value of laser ablation efficiency of enamel initially decreases and then increases as the energy density increases (Fig. 6).ConclusionsTo the best of our knowledge, this is the first study to investigate the ablation characteristics of hard tooth tissues (enamel and dentin) using a 9.3 μm CO2 laser. In this work, we determined the ablation threshold of enamel and dentin exposed to the wavelength of the laser and subsequently investigated the relationship between ablation crater geometry, ablation efficiency, and ablation rate as a function of energy density. The experimental results indicate that the ablation threshold of 9.3 μm wavelength laser-irradiated tooth enamel is greater than the ablation threshold of laser-irradiated dentin. Additionally, the ablation depth, ablation diameter, and ablation rate of irradiated dentin and enamel increase in direct proportion to the energy density. Moreover, when the energy density is 106.10 J/cm2 and the laser frequency is 500 Hz, the ablation rate reachs its maximum, with no obvious sign of carbonization. The research findings will contribute significantly to a better understanding of the biohard tissue ablation mechanism, and the ablation threshold and photodosimetry characteristic parameters obtained from our study will thereby serve as a foundation for promoting the clinical application of this technology.
Jan. 01, 1900Vol. 49 Issue 15 1507105 (2022)
© Copyright 2018-2021 | Chinese Laser Press.
All Rights Reserved 沪ICP备15018463号-20