


Please enter the answer below before you can view the full text.

Liqi Sun, Dengkui Wang, Dan Fang, Xuan Fang, Zhenzhong Zhang, Dan Yang, Xueying Chu, Chaoqun Li, and Zhipeng Wei
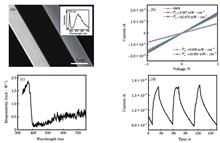
ObjectZinc oxide has attracted extensive interests in the ultraviolet photo-detection field owing to its outstanding optoelectronic properties. In recent years, the ZnO based photodetectors have achieved a fast response speed by different methods. In this work, we develop a simple method to achieve the simultaneous improvement in both response speed and responsivity by CdSe quantum dots (QDs) modified ZnO microwires (MWs). Due to the built in electric field formed between ZnO and CdSe accelerates the separation of photogenerated electron-hole pairs and significantly increases the photocurrent. At the same time, ZnO and CdSe form a type-II band structure, which can accelerate the carrier transport, resulting in a significant reduction in response time. Furthermore, with the increase of temperature, the carriers trapped by ZnO surface states escape from the surface trap states, which reduces the influence of surface states, improves response speed, and has been confirmed by the temperature-dependent current-voltage curves. As a result, the CdSe QDs modified ZnO MWs photodetector exhibits a rise time of 1.4 s, almost one order of magnitude smaller than that of the ZnO photodetector. These excellent optoelectronic properties demonstrate that the modification in the CdSe QDs modified ZnO MWs photodetector is a promising way to achieve fast response.MethodsIn this study, we prepare the CdSe QDs modified ZnO MWs photodetectors. First, the ZnO MWs are grown by chemical vapor deposition at 1050 ℃ in Ar and O2 atmospheres, and the CdSe quantum dots are prepared by the hydrothermal method. Then, the CdSe quantum dots dispersed in toluene are added to the surface of ZnO MWs to prepare the CdSe QDs modified ZnO MWs. An electrode is prepared at both ends of the ZnO MWs to form a photodetector. Finally, the morphologies of the CdSe modified ZnO MWs and the pure ZnO MWs are characterized by scanning electron microscope. The absorption and luminescence properties of CdSe QDs modified ZnO MWs are characterized by the ultraviolet-visible (UV-Vis) and fluorescence spectrometers. The photo-response performance of the ZnO MWs photodetector is characterized by the UV-Vis response system.Results and DiscussionsThe prepared CdSe QDs modified ZnO MWs have excellent photoelectric properties, the photo-response is increased by 3 times, and the rise time and fall time are reduced to 1.4 s and 6.8 s, respectively. A type II band structure is formed between CdSe QDs and ZnO MWs, and a built-in electric field is generated at the interface. Under the action of the built-in electric field, the electrons migrate to the surface of ZnO MWs, and the holes migrate to the CdSe QDs, meaning that the separation of carriers speeds up. The rapid separation of photogenerated carriers increases the lifetimes of electrons and holes, resulting in the increase of photocurrent. At the same time, the CdSe QDs modified ZnO MWs can also enhance light absorption of the detector and significantly increase the photocurrent of the detector (Fig. 3). The type II band structure between ZnO MWs and CdSe QDs also improves the photo-response of the material. Meanwhile, due to the passivation effect of CdSe QDs on the surface of ZnO MWs, the oxygen content adsorbed on the surface of ZnO MWs is reduced, and the interaction between photogenerated carriers and oxygen molecules adsorbed on the ZnO surface is minimized (Fig. 5). Under the combined action of these two factors, the light response speed of the material is significantly shortened.ConclusionsWe have demonstrated a fast speed ultraviolet photodetector based on CdSe QDs modified ZnO MWs. The built-in electric field between ZnO and CdSe promotes the separation of photogenerated electron-hole pairs, which makes photocurrent increase significantly from 1.59×10⁻⁶ A to 4.3×10⁻⁶ A at 1 V bias. Meanwhile, due to the influence of the type-II band structure and surface passivation, the rise time of CdSe QDs modified ZnO MW photodetector decreases from 11.4 s to 1.4 s, and the fall time decreases from 28.6 s to 6.8 s. Finally, after thermal annealing, the materials show high photocurrent and a fast carrier separation rate. The effect of CdSe QDs on the photoelectric properties of ZnO is further confirmed. This work provides an efficient method for the fabrication of ZnO MW photodetectors with a fast photoelectric response.
Jul. 01, 2022Vol. 49 Issue 13 1303001 (2022)
Ziwei Feng, Baosheng Zhou, Tao Zhang, Detian Niu, Xueyan Zhang, Shengming Liang, Xiaoguo Song, and Caiwang Tan
ObjectiveJoining light materials have become an important way to achieve the lightweight of automotive, rail transportation, and other fields. Carbon fiber reinforced nylon composites (CF/PA) are thought to a promising application due to high specific strength and modulus. However, a hybrid joint of lightweight metals and CF/PA is necessary when considering the cost of CF/PA. Moreover, joining aluminum alloys with high thermal conductivity and low price to CF/PA plays a significant role in saving energy and reducing emission. To overcome the shortcomings of traditional mechanical connection and adhesive bonding, various welding methods have been investigated for joining aluminum alloys to CF/PA such as laser welding, friction stir welding, and induction welding. Thereinto, the laser as a heat source possesses a flexible controllability and a less heat affected area to base materials. A high-quality joint can be obtained via optimizing the process parameters and strengthening the interface bonding though some differences in physical and chemical properties exist between two materials. The melting point of CF/PA66 is higher than those of the other PA composites, which causes a narrow process window. So far, few researches are performed to investigate the laser joining of aluminum alloys to CF/PA66. Therefore, in the current study, laser power is chosen as a variable to confirm the possibility of direct joining aluminum alloys to CF/PA66, and the bonding mechanism is finally revealed.MethodsThe 1.5 mm-thick 6061 aluminum alloy and a 3 mm-thick carbon fiber reinforced composite (CFRTP) are selected to perform the laser direct joining. The resin substrate of CFRTP is polyhexamethylene adipamide (PA66). The traveling speed and defocus distance are kept constant, and the laser power is changed from 900 W to 1300 W with an interval of 100 W to investigate the effect of heat input on the interface bonding and the corresponding joint characteristics. Tensile shear tests with a stretch speed of 2 mm/s are adopted to evaluate the mechanical properties. The melting width of CFRTP and the actual contact area between the aluminum alloy and the CFRTP are extracted by ImageJ software. Interface bonding is observed by optical digital microscope (OM) and scanning electron microscope (SEM). Fracture surfaces are also detected by SEM. Chemical bonding is determined by combining the analysis of energy spectrum (EDS) with X-ray photoelectron spectroscopy (XPS).Results and DiscussionsAn excellent weld formation without defects is obtained under the condition of the selected parameters (Fig. 4). The melting width of CFRTP is increased from 9.3 mm to 14.8 mm when the laser power increases from 900 W to 1300 W (Fig. 5), which could expand the contact area between the aluminum alloy and the CFRTP. Interface bonding under different laser powers is comparatively observed (Fig. 6). Enlarged SEM morphologies are also presented to further observe the interface (Fig. 7). Pores occur at the interface when the temperature exceeds the decomposition point of the CFRTP, which is detrimental to improve the strength of joints. Therefore, when the tensile shear force of joints is discussed, a tendency of first increasing and then decreasing is found, and the maximum value is obtained at a laser power of 1100 W (Fig. 8). The tensile shear force is first increased from 2083.9 N (tensile shear strength of 6.4 MPa) to 2571.6 N (tensile shear strength of 10.2 MPa) when the laser power increases from 900 W to 1100 W, and subsequently is decreased to 2114.7 N (tensile shear strength of 7.8 MPa) when the laser power increases to 1300 W. Interface failure is determined by analyzing the fracture surfaces under different laser powers (Fig. 10). A diffusion of Al, C and O elements at the interface is detected (Fig. 12). Based on this result, the XPS analysis is performed to confirm the existence of new chemical bonds including Al—O—C bond and Al—C bond (Fig. 13). This provides the evidence for the direct bonding of aluminum alloys and CFRTP by a laser.ConclusionTo investigate the process and bonding mechanism of aluminum alloys and CFRTP during the laser direct joining, laser power is changed to reveal the macroscopic morphologies of the joints, the melting width of CF/PA66, and interface bonding under different heat inputs. The relationship between laser power and tensile shear properties of joints is thus established. Results indicate that the melting width of CF/PA66 increases as the laser power increases. The bearing capacity of joints is thus improved because of expanded actual contact areas. However, when the heat input is excessively high, some pores will be produced at the interface due to the decomposition of resin, which will weaken the joint properties. The maximum tensile shear force of 2571.6 N (tensile shear strength of 10.2 MPa) is obtained when laser power is 1100 W. The formation of new chemical bonds including Al—O—C bond and Al—C bond is identified during the laser direct joining. A tight metallurgical bonding at the interface between the aluminum alloy and the CF/PA66 forms, and the direct-bonding joints with high quality are thus obtained.
Jul. 01, 2022Vol. 49 Issue 13 1303002 (2022)
Zhongsheng Zhai, Yi Zhang, Qinghua Lü, Xuanze Wang, Wei Feng, and Zhi Xiong
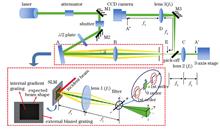
ConclusionsIn this study, a flat-topped beam with good uniformity is obtained using a spatial light modulator and designing a phase hologram composed of a geometric mask and gratings inside and outside of the mask. Among these, the internal grating can be gradient orthogonal grating or gradient binary grating, which can diffract the incident Gaussian beam into multiple nonzero-order beam to change the energy distribution and obtain a flat-topped beam with high uniformity. At the same time, the grating methods are compared to the GS method. Although GS method can obtain high energy efficiency, the uniformity is poor, so it is not suitable for areas requiring high uniformity. The method proposed in this paper can obtain a shaping beam with steep edge and high uniformity, with an energy efficiency of 43.71% and a minimum nonuniformity of 2.12%. It can be used in areas where high uniformity and steepness edge are required, such as scribing and removing films from coating materials (thin films without harming the substrate), and grooving in semiconductor materials (such as Low-K). This method is simple and easy to use, and it will broaden the scope of laser applications in the field of material processing.
Jul. 01, 2022Vol. 49 Issue 13 1305001 (2022)
Wensheng Fu, Xichun Zhang, Shangdian Zhu, Jinguang Lü, Xiaohui Ma, and He Zhang
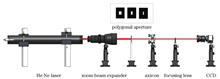
ObjectiveLocalized hollow beam optical tweezers techniques have been widely used in life and nanosciences as physical tools to generate microforces without direct contact and realize the precise manipulation of microparticles. The expanding application needs have created more requirements for the optical tweezers technology, necessitating new optical field regulation techniques for producing various tunable optical traps. In conventional axial cone-lens optical systems, closed localized hollow beams can be generated to capture particles. However, once the localized hollow beams form, it is difficult for the particles to pass through the light wall into the light trap. Furthermore, the size cannot be freely regulated after the conventional localized hollow beams are produced. Therefore, this paper proposes the production of a localized hollow beam that freely opens and closes, allowing the particles to enter through the gap and controlling the particle capture and escape using the change in the gap. This is important for capturing particles and more conducive to such an operation.MethodsWe added a rectangular appendix in a conventional axial cone-lens optical system. We found that by modulating the incident circular Gaussian beam using the axial-cone optical appendix, the localized hollow beam generated after the axion-lens optical system could regulate and had opening properties. We simulated the distribution properties of the local rectangular Gaussian beam by simulating the beam passing through the axis cone and the beam after focusing on the incident lens. Next, we analyzed the causes and influences of localized hollow beam defects and experimentally verified the localized hollow beam from generation to closure. The particles were first analyzed using the beam properties in both longitudinal and transverse directions in localized hollow beams. The longitudinal gradient and scattering forces were calculated in the beam propagation direction, and gravity was claculated in the transverse direction to analyze the particle process from the gap into the stable confinement.Results and DiscussionsThe incident circular Gaussian beam is modulated using a rectangular aperture, and the size and orientation of the gap are adjusted by changing the length-width ratio of the rectangular aperture. This ensures that the localized hollow beam generated after passing the axial cone-lensing optical system freely regulates the size. Furthermore, we increase the localized hollow beam light field gradient using a high numerical aperture lens, and analyze the gradient force, scattering force, and gravity of the particles in a liquid environment. In this paper, the process of particles from entering the bottle beam to stable trapping is recorded by analyzing the lateral and longitudinal forces (Fig.7).ConclusionsWe designed a size-tunable bottle beam. To be more specific, the size of the bottle beam can be changed by adjusting the distance between the axicon and the lens. Besides, the gap can be generated by adjusting the length-width ratio of the rectangular aperture. We use MATLAB to simulate the size change of the bottle beam in the adjustment and the Bessel beam change of the beam after the axicon. Furthermore, we demonstrated the process of the bottle beam from forming to closing with the help of simulation and experiments. Experimental results show that the simulation of gradient, scattering, and resultant forces in size-adjusted localized hollow beams creates a particle passage through the gap and controls particle capture and escape according to the change of the gap.
Jul. 01, 2022Vol. 49 Issue 13 1305002 (2022)
Zhuodong Liao, Ke Li, Haoran Liu, Xiaofeng Duan, Yongqing Huang, and Kai Liu
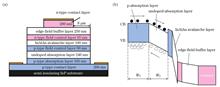
ObjectiveThe rapid development and widespread application of new broadband services such as cloud computing, big data, and mobile internet have led to an explosive growth in data center traffic. Due to the limitations of traditional electrical interconnects, it is difficult to meet the data transmission requirements of the current data centers, and optical interconnect technology has become the main solution for data transmission issues in data centers. In recent years, the trend in the increase of data center traffic and bandwidth is driving the upgrade of optical modules in data centers, and the demand for optical modules is growing at an accelerated rate. As the core component of the optical module, photodetectors play a key role in converting the transmitted optical signals into electrical signals. In this context, the demand for photodetectors in data centers is growing. Avalanche photodiodes (APD) are one of the photodetectors frequently used in optical modules, which have internal gain and can provide higher receiver sensitivity and dynamic range, and are receiving more and more attention from scholars. As data transmission rates move toward 100 Gb/s and 400 Gb/s, single-channel transmission rates increase to 25 Gb/s and beyond, placing higher demands on the bandwidth of photodetectors. APD can play a vital role in high-speed optical interconnection modules for data centers; therefore, it is of great importance to study APD with high bandwidth and high quantum efficiency.MethodsWe use APSYS software to design and optimize the avalanche photodiode with a p-down structure (p-down APD). APSYS is a finite element analysis software that calculates the optical and electrical properties of semiconductor devices by self-consistently solving Poisson’s equation, the carrier continuity equation, and the current density equation with various physical models. The transport mechanism of carriers inside the APD is very complex, and the accuracy and reliability of the results will be affected by the proper choice of physical model. In our simulations, we use the carrier mobility model to describe the variation of carrier mobility with respect to doping concentration, an Shockley-Read-Hall (SRH) model to characterize the process of electron and hole generation and complexation in addition to the diffusion and drift of photogenerated carriers, and the Chynoweth model to characterize the extent of impact ionization accurately.Results and DiscussionsIn this paper, we propose a p-down APD with a hybrid absorber layer, which is designed and optimized to give full play to the advantages of the p-down structure. In the device design process, the hybrid absorber layer structure not only shortens the drift distance of the holes and alleviates the phenomenon of accumulation of holes at the interface but also solves the conflicting relationship between responsivity and bandwidth (Fig. 2). The p-down APD confines the electric field to the central region by using the double-mesa structure (Fig. 3). Due to the limiting electric field at the first mesa, the electric field in the undoped absorber layer and the electric field at the edge of the second mesa are reduced, making the p-down APD with double-mesa structure to have low dark current (Fig. 5), high bandwidth, and gain-bandwidth product (Fig. 6). A triple-mesa p-down APD is obtained by optimizing the mesa and layer structure parameters of the double-mesa p-down APD, which has the advantage of getting stronger electric field limiting effect (Fig. 8), lower dark current (Fig. 10), higher bandwidth (Fig. 11), and being useful in future optical communication systems.ConclusionsThe rapid increase in transmission rate in optical communication systems puts higher demands for the photodetector bandwidth. In this paper, the p-down APD is designed and optimized using the finite element analysis software APSYS. Compared with the conventional structure, the p-down structure can confine the electric field in the central region and reduce the electric field at the edge of the device, which has the advantages of low dark current and high bandwidth. The p-down APD with double-mesa and triple-mesa structures are simulated and compared. The results show that the p-down APD with a double-mesa structure can confine the electric field to the central region and prevent undesirable edge breakdown. The dark current of this APD is about 0.1 nA, the maximum bandwidth is 23 GHz, and the gain-bandwidth product is 276 GHz. A triple-mesa p-down APD with a maximum bandwidth of 31.7 GHz and a gain-bandwidth product of 289.4 GHz are obtained by optimizing the mesa and layer structure parameters of the double-mesa p-down APD, which has the advantage of obtaining stronger electric field limiting effect, lower dark current, and larger bandwidth. Therefore, APD with a p-down structure can play a crucial role in future optical communication systems.
Jul. 01, 2022Vol. 49 Issue 13 1306002 (2022)
Rong Ma, Duorui Gao, Sentao Wei, Zhuang Xie, Wei Wang, Shuaiwei Jia, Zhaofeng Bai, and Xiaoping Xie
ObjectiveDue to its bandwidth advantage, space laser communication has become an effective means to solve the bottleneck of microwave communication, build a space-based broadband network, and realize the real-time transmission of massive amount of earth observation data. The space laser communication terminal has characteristics of small size, lightweight, low power consumption, etc., which are suitable for satellite payload and meet the increasing communication needs of aerospace activities. In future, each communication satellite will carry multiple laser communication terminals that can serve multiple targets simultaneously. Therefore, laser communication terminals are being developed in the direction of miniaturization and integration. Traditional laser communication terminals use external modulation methods to achieve intensity or phase modulation of optical signals. Optical transmitters comprise multiple independent components, such as lasers, modulators, and bias controllers, and the system’s structure is complex. The phase modulation of the optical signal is realized using the direct modulation of the chirp-managed laser (CML), without an external modulator, bias controller, etc., with small size, low power consumption, low equipment complexity, and low cost. In addition, it can adapt to the continuous, high-speed, and integrated development of optical communication networks.MethodsIn this study, the chirp effect of the CML is used for phase modulation to generate a return-to-zero differential phase shift keying (RZ-DPSK) signal. RZ-DPSK has several advantages, such as high sensitivity, good reliability, simple receiver, and its receiving sensitivity is 3 dB higher than that of on-off keying (OOK) modulation method. It has received extensive attention in the engineering field. Using the chirp effect of the laser, the phase shift of the optical field is achieved by controlling the magnitude of the injected current, and the driving signal is simply pre-encoded using MATLAB to generate a three-level signal, thereby accurately controlling the phase change of the carrier signal. The error rate performance of RZ-DPSK estimated using this modulation method was tested and compared with that of the traditional external modulation method. The performance difference between the two methods was analyzed.Results and DiscussionsThis study first uses the binary sequence "1110100" to verify the system principle. The schematic of the transmitter and receiver experimental schemes are shown in Figures 3 and 7, and the signal rate is 2.5 Gb/s. The output wavelength of the CML laser is 1552.544 nm, and the output optical power is 9.14 dBm. The receiving end includes erbium-doped fiber amplifier (EDFA), optical filter, optical delay interferometer, and balanced detector to receive and demodulate RZ-DPSK optical signal and restore the baseband electrical signal. To further reduce the spontaneous radiation noise caused by the amplification process, an optical filter with a bandwidth of 0.05 nm is placed after the EDFA. The signal waveform after demodulation is shown in Figure 8. 27-1 pseudo-random binary sequence (PRBS) is used for bit error rate test. The pseudo-random signal is demodulated by the delay interferometer, and the output signal eye diagram of the balanced detector is shown in Figure 9. As a comparative experiment, the receiving end based on LiNbO3 external modulation and the CML system use the same receiving device. The schematic of the two systems is shown in Figure 10. The bit error rate curves of RZ-DPSK system based on CML transmitter and LiNbO3 transmitter are shown in the Figure 11. When the system error rate is 10-9, the receiving sensitivity of CML and LiNbO3 transmitters is -36.98 and -45.72 dBm, respectively. Compared with the LiNbO3 transmitter, the sensitivity of the CML system is reduced by 8.74 dB. When the error rate of the forward error correction limit is 10-3, the sensitivity of the CML transmitter is -48.1 dBm, which is only 1.8 dB less than the -49.9 dBm of the LiNbO3 transmitter. The error characteristics of the two are the same, and thus, an error-free transmission can be realized. The CML transmitter has a simple structure, small size, and low power consumption, and the performance of the receiver is equivalent to that of external modulation when the limit error rate of the forward error correction is 10-3, which shows a significant development prospect.ConclusionsThis study introduces the principle of signal coding and modulation of CML laser and realizes the direct modulation of 2.5 Gb/s RZ-DPSK signal based on the CML laser without differential coding and external modulator. The performance index of the modulation signal is analyzed. At the same time, the bit error rate performance of the transmission system based on the CML laser and the system based on the LiNbO3 transmitter are compared. The results show that the sensitivity of the transmitter based on the CML is -48.1 dBm when the limit bit error rate of forward error correction is 10-3. Compared with the sensitivity of LiNbO3-based transmitter system (-49.9 dBm), the difference of the sensitivity of CML-based transmitter system is only 1.8 dB and the error characteristics are basically the same. Further, the CML-based transmitter system has a good transmission performance. In terms of hardware, the CML-based transmitter system has a simpler structure, low power consumption, small size, and lightweight, which can better adapt to the continuous high-speed and integrated development of space optical communication networks.
Jul. 01, 2022Vol. 49 Issue 13 1306001 (2022)
Chao Lin, Yanli Han, Shuli Lou, Pei Liu, Wenlong Zhang, and Zikang Yang
ObjectiveWith the advent of the big data and intelligence eras, information systems require considerably enhanced performance and low energy costs. Optical computing may become the next-generation computing platform owing to its parallel processing capability and high bandwidth with low energy consumption. In pattern recognition applications, large amounts of image data must be rapidly processed. Two types of optical approaches have been investigated for pattern recognition: optical neural network, which comprises two subclasses including silicon photonic-based neural networks, and free-space-based optical network. The former has undergone considerable advancements recently owing to improved fabrication capability and novel network components based on optics such as microring resonators and Mach-Zehnder interferometers. The latter (e.g., diffractive neural networks) is also important, particularly for computational imaging-based applications. However, optical neural network-based pattern recognition approaches are immature owing to the implementation of nonlinear functions. Pattern recognition approaches founded on free-space-based optical networks are hybrid optoelectronic correlators, far more mature than optical neural network-based ones. The correlator can be codesigned with a neural network to serve as a coprocesser to prefilter some image features for ultrafast processing. However, in conventional optical correlators, both the spatial and spectral bandwidths of systems have not been efficiently used when performing the correlation operation. Hence, the inherent parallel processing capability of optics cannot be fully exploited.MethodsIn our previous work, a multichannel joint transform correlation method is proposed based on the compression and translation of joint transform power spectrum to fully utilize spatial and spectral bandwidths and enhance the parallel processing efficiency and recognition accuracy of optical correlation systems. In the input plane of this scheme, the scene image and N numbers of reference images are uploaded on different zones of the input spatial light modulator; then, the phase maps optimized using the iterative algorithm are superimposed onto the images. In the Fourier plane, interference between the Fourier spectra of scene images and those of every single reference image occurs in different zones of the Fourier plane. When the restriction parameter in the phase optimization algorithm is appropriated adjusted, no interference of the Fourier spectra of the reference images is observed. Consequently, the parallel processing of N channels is achieved without crosstalk. The relation between the localized peak clutter mean of the Fourier spectra of the preferred phase and the standard deviation of the correlation peak position is analyzed and used as a criterion for preferential preferred phase mask selection. Furthermore, the standard deviation of the correlation peak position is obtained for recognition tasks. In this study, we focus on distortion-invariant pattern recognition by integrating the multichannel joint transform correlator and the synthetic discriminant function. First, the feasibility of the local peak to clutter mean as a constraint for preferential phase selection is analyzed; results indicated that this factor is not appropriate when the synthetic discriminant function is used. Hence, a new phase selection criterion—known as the variation in the correlation peak position—is proposed to obtain the public preferred phase for targets with a specific distortion range. Furthermore, the selected phase is used in the multichannel joint transform correlator with the synthetic discriminant function to achieve distortion-invariant pattern recognition. Then, to determine the system performance in terms of the distortion level, the tolerance of our system on the scaling-down of the size of target and the increase in the number of training images for the synthetic discriminant function are analyzed. Finally, considering that the background may vary in real applications, we take successive video frames as varied input backgrounds and analyze the feasibility of our proposal.Results and DiscussionsResults indicate that under the considered image file size and background complexity, the proposed method can achieve nine-channel parallel recognition (Fig. 8). For correct recognition, the minimum scaling down factor is 0.6 (Fig. 11). When the number of rotated training images is increased to 9 in the synthetic discriminant function, a correct recognition can be guaranteed (Fig. 13). The relation between the minimum threshold of phase the optimization constraint and the synthesized image numbers of SDF is obtained for calculating the preferred phases (Table 1). Furthermore, a correct recognition can be guaranteed when the values of half the pixels in the background have changed (Fig. 16).ConclusionsHerein, a novel distortion-invariant pattern recognition method based on multichannel joint transform correlator is proposed. The local peak to clutter mean is shown to be unsuitable, and we propose a new optimization criterion known as the variation in the correlation peak position, which is feasible in this proposal. We achieve nine-channel pattern recognition within 0.6-1.0 times of the scaling of the image size and rotation ranges of 0°-30°, 70°-100°, 140°-170°, 210°-240°, and 280°-310°. The upper limit of the number of synthesized training images is analyzed, which is nine in this study. Moreover, the proposed method can maintain its performance when the background is varied within the values of half its pixel, indicating robustness to background changes. The recognition speed and accuracy on distortion of the system are considerably improved with our proposal, which will benefit the development of practical multichannel optical correlators.
Jul. 01, 2022Vol. 49 Issue 13 1309001 (2022)
Huaying Wang, Jialiang Lei, Xue Wang, Wenjian Wang, Zijian Zhang, Jieyu Wang, and Zhao Dong
ObjectiveThe digital holographic microscopy technology can perform real-time quantitative imaging and visual measurement of phase objects and various microstructures under non-contact, non-staining experimental conditions. It plays an important role in life, medicine, environment, materials, manufacturing, and other fields. As the object and the reference beams pass through the same optical elements, the same phase noises are introduced into them. The structure makes the common path off-axis digital holographic microscopy (CO-DHM) more stable. However, the contrast of the hologram fringes recorded by the traditional CO-DHM system is often poor, and the utilization of the space bandwidth product of the recording device is insufficient. These defects seriously influence the filtering process and the quality of the reconstructed images. In this paper, a novel CO-DHM based on a beam splitter is proposed. The intensity ratio of the object and reference beams can be adjusted. The separation distance of three spectral terms in the hologram can also be flexibly controlled by this structure. The feasibility of adjusting stripe-contrast and spatial-frequency is analyzed theoretically and experimentally, and the imaging performance of the system is verified by the experimental analysis.MethodsThe setup of the proposed CO-DHM can be referred to Fig. 1. In order to analyze the system ability to separate and regulate the object and reference beams, the lateral offset distance range of the incident beam splitter is calculated (Fig. 2). In addition, the ability to adjust the fringe contrast is introduced. The polarization states of the object and reference beams when interference occurs are analyzed by the Jones matrix. The intensity of each light and the change in the contrast of the interference fringe are analyzed in different principal-axis azimuths of the polarizer (Fig. 3).Results and DiscussionsIn the control performance of the system, we use (9.8±0.2) μm highly dispersed polystyrene microsphere (refractive index n=1.593) as the sample. The separation distance between the object and reference beams is modulated by laterally moving the beam splitter (Fig. 4). When the separation distance between the object and reference beams is 5 mm, the spectrum is aliased. If the spectral filter area including the zero-order center is too large, the fringe information is introduced in the phase diagram. Even if the filtering area is reduced, the low-frequency information of the 0 order is still introduced, which brings noise interference to the reconstructed phase diagram. When the separation distance between the object and reference beams is 9 mm, the spatial-frequency is separated fully, which avoids the above situation. It is helpful for the reconstruction of digital holography. In order to analyze the influence of interference fringe contrast on the experiment, we modulate the light intensity ratio of the object and reference beams to 1∶1, 6∶1, and 34∶1 by rotating the polarizer (Fig. 5). It can be seen that the fringe contrast of the hologram is significantly reduced as the light intensity ratio increases and the ±1 orders bandwidths are also reduced. The noise carried by the object beam is more obvious, and the quality of the reconstructed image becomes worse. Therefore, adjusting the contrast of interference fringes is an important part of digital holographic recording. In this system, the light intensity ratio of the object reference beams can be adjusted flexibly, which can effectively avoid the occurrence of the above situation. In the imaging performance of the system, the same polystyrene microsphere sample is used to perform a quantitative imaging test (Fig. 6). It can be seen that the reconstructed microsphere thickness is about 9.75 μm. In order to ensure the reliability of the experiment, the thickness of 100 microspheres is measured and analyzed, and the values are all within the range of (9.8±0.2) μm, which satisfies the nominal diameters of the microspheres and verifies that the quantitative phase measurement is accurate. We test the capability of the resolution by imaging the standard USAF1951 resolution plate (Fig. 7). It can be seen that the system can clearly image the sixth element of the 7 groups, which means that the resolution can reach 2.19 μm. It is suitable for the imaging of biological samples, which fully proves that the system has excellent imaging resolution. Onion epidermal cells are used as the experimental object (Fig. 8). The experimental results show that the thickness of onion cells is about 4.2 μm and the size of individual cells is about 190.0 μm, which fully proves that the system has excellent imaging performance for biological samples.ConclusionsThe experimental results show that the effect of arbitrarily adjusting the contrast of the hologram interference fringe is achieved by rotating the polarizer, the flexibility of the system is effectively improved. In addition, the degree of separation between the object and reference beams is controlled by rotating the beam splitter. The separation distance between the 0 order and ±1 orders in the Fourier transform is increased to extend a filterable region and avoid spectral aliasing. The method in this paper provides a technical support for the production of digital holographic microscopes.
Jul. 01, 2022Vol. 49 Issue 13 1309002 (2022)
Jingchong Wang, Chen Guan, Zhaojun Liu, Zhenhua Cong, Shiwu Wang, Yi Nie, Yang Liu, and Zhigang Zhao
Objective700800 nm lasers at the border of visible light and near-infrared light have been used in many fields such as nonlinear optics, remote sensing detection, laser jamming, and laser medicine. They including many different types of lasers such as dye lasers, Ti: sapphire lasers, and Alexandrite lasers. Dye lasers are developed very early, but their gain media are toxic and the maintenance of laser systems is difficult. The development of Ti: sapphire lasers is relatively mature. Because of the broad gain bandwidth of Ti: sapphire, it is mostly used in the field of ultrafast lasers. The pump source of Ti: sapphire is mainly expensive green lasers, such as 532 nm frequency-doubled Nd∶YAG laser. In addition, the thermal effect of the gain medium is serious. In contrast, Alexandrite lasers can be pumped by more economical red laser diodes (LDs) because of its broad absorption spectrum. Wavelength tuning can be achieved at room temperature and the laser performance of Alexandrite increases at elevated temperatures due to its unique spectroscopic properties. Alexandrite has a long fluorescence lifetime of about 262 μs at room temperature, almost 85 times longer than that of Ti: sapphire (about 3 μs). This causes tremendous advantages of energy storage at the upper level to achieve Q-switched operation and obtain a high peak power output. Although the emission cross section is only 0.7×10⁻²⁰ cm2, the high damage threshold (270 J/cm2) provides the possibility for an Alexandrite laser to work with a high pump power. An Alexandrite laser is an ideal choice to obtain a laser output at 700800 nm. In addition, a high power red LD is developing in recent years, and it is an excellent pump source to obtain an Alexandrite laser with high power and high pulse energy.MethodsElectro-optical Q-switched operations are used in our experiments. First, a V-shaped cavity is obtained and the length of the cavity is about 33 cm. A fiber-coupled red diode laser emitting at 638 nm with a maximum pump power of 40 W is used as the pump source. The size of an Alexandrite crystal is 3 mm×3 mm×10 mm with c-axis-cut, and it is wrapped with an indium foil and mounted in a water-cooled heat sink. By controlling the β-BaB2O4 (BBO) Pockels cell, a pulsed laser with a multi-kHz repetition rate is obtained. Wavelength tuning is demonstrated with birefringent filters. Then, the output power, pulse duration, pulse energy, and peak power at the wavelength corresponding to the maximum output power are analyzed. Based on the Q-switched rate equations, the variation of pulse duration at a high pump power is predicted. To obtained shorter pulse duration, cavity dumping is considered. In addition, the performances of an Alexandrite laser at different repetition rates are analyzed in our experiments.Results and DiscussionsThe schematic of an Alexandrite laser and its photograph are shown in Fig. 1. At the repetition rate of 10 kHz, a watt-level laser output is obtained with a pulse duration of 961 ns and a pulse energy of 116 μJ. Wavelength tuning outputs from 728 nm to 793 nm are obtained at repetition rats of 5 kHz and 10 kHz [Fig. 2 (a)] with the combination of birefringent filters (BRFs) in different thicknesses, and the wavelength corresponding to the maximum output power is 755 nm. The pulse characteristics including output power, pulse duration, pulse energy, and peak power at 755 nm with 10 kHz and 5 kHz repetition rates are analyzed (Fig. 3). Based on the Q-switched rate equations, a well-matched numerical simulation is obtained. The variation of pulse duration with absorbed pump power is simulated (Fig. 4). The predicted shortest pulse duration at a high enough pump power is about 50 ns. Furthermore, a short pulsed laser of 10 ns is achieved by cavity dumping [Fig. 5 (b)], whose peak power is over 3 kW.ConclusionsThis paper presents a red LD pumped Q-switched Alexandrite laser. A watt-level pulsed laser is obtained in a V-shaped cavity. The corresponding repetition rate is 10 kHz, the pulse duration is 961 ns, and the pulse energy is 116 μJ. Wavelength tuning from 728 to 793 nm is demonstrated with BRF. Based on the Q-switched rate equations, a well-matched numerical simulation is obtained, and the effect of pump energy on pulse duration is analyzed. A shorter pulse laser of 10 ns is also achieved by cavity dumping and the peak power is over 3 kW. In the future work, we will continue to optimize the design of the cavity and the experimental parameters. Based on the need of specific applications, we will try to achieve higher-energy, higher-efficiency, shorter pulse duration, and narrower linewidth Alexandrite lasers pumped by red LDs.
Jul. 01, 2022Vol. 49 Issue 13 1301001 (2022)
Guangwei Sun, Guofeng Xin, Ren Zhu, Dijun Chen, Pan Feng, Xia Hou, Haiwen Cai, and Weibiao Chen
ObjectiveSince the advent of lasers, a single-frequency laser has always been a key research direction of lasers. A single-frequency all-solid-state laser has the advantages of narrow linewidth and stable frequency, which is widely used in lidar, gravity wave detection, coherent communication, and so on. Many research institutions and enterprises have studied the tunable performance, frequency performance, and noise characteristics of nonplanar ring oscillator (NPRO) single-frequency lasers. However, most researches are based on the cavity structure to develop a desktop test system. And commercial products are difficult to meet the requirements of narrow linewidth, small volume, and high reliability, and thus difficult to meet the requirements of space field. The greatest particularity of space laser is the particularities of test environment and operation environment. The laser has to experience not only vibration and shock, but also the rapid changes of atmospheric pressure and temperature in the process of laser emission. These raise high requirements for the performance and reliability of the laser. Therefore, it is necessary to develop a laser with characteristics of miniaturization, high performance, and high reliability, which can adapt to the extreme space environment and ensure the normal operation in orbit.MethodsIn this study, we design a new structure of an NPRO crystal with a dimension of 12 mm (length)×8 mm (width)×3 mm (height). First, to achieve a single frequency output and high slope efficiency, the transmission of the coupling coating is optimized to 97% for s-polarization and 85% for p-polarization. Then we develop a small all fiber coupled nonplanar ring cavity solid-state laser. The device is mainly composed of pump fiber assembly, Nd∶YAG NPRO crystal, and coupled fiber assembly. The beam from the pump fiber is first focused by lens and then injected into the NPRO crystal. The beam from the NPRO crystal is focused into the coupled fiber. The core diameter of the pump fiber is 105 μm with a numerical aperture of NA=0.22. The coupling fiber is a panda polarization maintaining fiber and its core diameter is 6 μm with a numerical aperture of NA=0.12. Semiconductor cooler, thermistor, and laser crystal are integrated in the laser housing by metal welding. The pump optical fiber assembly and the coupling optical fiber assembly are fixed outside the laser housing by laser welding. The permanent magnet is fixed on the cover plate by adhesive. Finally, the cover plate is welded on the laser housing by the parallel seam welding technology.Results and DiscussionsTo satisfy the needs of high reliability, miniaturization, and air tightness in the space field, a compact all fiber coupled NPRO solid-state laser is developed. The output power of the single-mode polarization maintaining fiber is nearly 600 mW under a 1.5 W pump power (Fig. 4). The power stability and frequency stability of the laser are tested. The power stability is 0.16%@2 h(Fig. 5) and the frequency drift is less than 20 MHz@3 h(Fig. 7). The linewidth is about 182.87 Hz(Fig. 6), and the polarization contrast is better than 20 dB. The temperature tuning coefficient is about -2.8 GHz/℃, and the 9 GHz mode hopping free tuning is obtained(Fig. 8). The PZT mechanical tuning coefficient is 2.7 MHz/V(Fig. 9). The output power tuning coefficient is -4.96 kHz/mW(Fig. 10). The tuning coefficient is between PZT mechanical tuning coefficient and temperature tuning coefficient, which can be used in the actual frequency stabilization process. The laser passes the mechanical test (the root mean square accelerated speed of random vibration is 19.8g, where g is the accelerated speed of gravity) and the temperature test (-20-65 ℃), and the output power change is less than 5% before and after the test(Fig. 11).ConclusionsA compact all fiber coupled NPRO solid-state laser is developed. The laser has a linewidth of around 100 Hz. The temperature tuning coefficient is about -2.8 GHz/℃, and 9 GHz mode hopping free tuning is obtained. The PZT mechanical tuning coefficient is 2.7 MHz/V. The output power tuning coefficient is -4.96 kHz/mW. The laser passes various environmental routine tests, and the output power change is less than 5% before and after the tests. The solid-state laser is very suitable for high working temperature and mechanical environment. It has the advantages of narrow linewidth, low noise, small volume, low cost, and mature manufacturing. It has a great application potential in high-precision gravitational wave detection, lidar, frequency conversion and others.
Jul. 01, 2022Vol. 49 Issue 13 1301002 (2022)
Yangshuai Li, Yanfeng Zhang, Zhigang Liu, Shenlei Zhou, Mingying Sun, and Jianqiang Zhu
ObjectiveTransport mirrors are critical components in the high-power laser device that connects the main amplification system and the shooting range. Achieving surface cleanliness control is imperative. Particles, particularly those dominated by organic matter, metals, and minerals, are the most important factors influencing the surface cleanliness of transport mirrors. Particles with sizes >30 μm are the primary cause of transport mirrors damage. Thus, they should be removed. Manual wiping and air knife purging are common methods for controlling the surface cleanliness of transport mirrors. The air knife purging method is used in many situations due to its high removal efficiency and stable purging effect, especially in a closed environment that is not easy to operate manually. The removal efficiency of the air knife purging method is highly dependent on various process parameters, including the air knife’s air inlet pressure and the distance between the air knife outlet and the upper surface of the transmission mirror. Consequently, research on particle removal technology on the surface of transport mirrors based on wind knife purging is being conducted to reveal the influence law of working pressure, installation distance, purging time, purging times, and other factors on particle removal efficiency. The trajectory of particles in the purge removal process is studied and experimentally collected to reduce secondary pollution in the purge removal process. Finally, this research is critical for the final formulation of a low-risk and practical on-line particle cleaning control scheme for transport mirror surfaces.MethodsIn this study, alumina, stainless steel, and dust particles were employed. Changing the air knife purging process parameters obtained the particle removal efficiency for each process parameter. Finally, the impact of each process parameter on removal efficiency was determined. Simultaneously, the trajectory of particles in the removal process was experimentally captured. The entire procedure was as follows. First, the transmission mirror’s surface was divided into three sections: near, middle, and far ends. Each area had four measurement points that were densely packed with particles. The surface of the transmission mirror was then purged by adjusting process parameters such as air inlet pressure, installation height, outlet gap, and air knife purging times; the number of particles after purging was then measured off-line under various process parameters. Finally, the impact of process parameters on particle removal efficiency was quantified by calculating the particle change rate before and after purging. Video recording and slow-motion pictures were used to obtain the moving trajectory of particles during the removal process.Results and DiscussionsThe closer to the air knife’s outlet side, the greater the particle removal efficiency, and the larger the particle size, the greater the removal efficiency (Fig. 4). This is primarily because the closer to the air knife, the greater the wind speed. The mechanical model of particle removal method states that the smaller the particles, the greater the dynamic pressure required for removal, i.e., the greater the fluid velocity required. When the installation height of the air knife is 4 mm for Al2O3, the removal effect is good. When the inlet pressure is 1.2 MPa, the transport mirror’s overall removal efficiency exceeds 90%. If the inlet pressure is increased further, the removal efficiency improves even more (Fig. 5). Stainless steel particles have a lower removal efficiency than Al2O3 particles (Fig.6), and humidity has a significant impact on dust removal efficiency. When the inlet pressure is less than a certain threshold, increasing the number of purging cycles has no effect on removal efficiency (Fig. 7). When the inlet pressure is 1.5 MPa, the air knife’s two inlet gaps (0.05 and 0.1 mm) achieve the same removal effect (Fig. 10). This is primarily due to the fact that the wind speed obtained at the end of the transmission mirror surface is essentially the same (Fig. 9). Finally, during the removal process, the particles move horizontally and quickly along the air flow direction (Fig. 11).ConclusionsThe effect of process parameters on the particle removal efficiency of various types of particles is investigated, and the particle movement track in the removal process is recorded. The results show that the air knife purging method is an effective way to control the surface cleanliness of transport mirrors. When the air knife outlet width is 0.1 mm, the inlet pressure is 1.5 MPa, and the air knife installation height is 4 mm, a high removal efficiency of Al2O3, stainless steel, and dust particles can be obtained. Increased purging times cannot improve particle removal efficiency at low inlet pressures (≤1.2 MPa); the particles move rapidly and horizontally along the blowing direction of the air flow. Furthermore, the dust samples must be dried and purified to reduce the influence of the surrounding environment, such as humidity, on the experimental results. Obviously, this experiment is being conducted in an open environment. Consequently, more research in a controlled environment is required to fundamentally realize the surface cleanliness control of transport mirrors. For example, active control measures are implemented based on previously obtained good process parameters and particle trajectories.
Jul. 01, 2022Vol. 49 Issue 13 1301003 (2022)
Wenzhen Li, Yang Chen, Yibo Wang, Dingchao Xu, Yingbo Chu, Nengli Dai, and Jinyan Li
ObjectiveWith the advent of the industrialization 3.0 era, a 1.5 μm laser has been focused due to its "eye-safe" and low atmospheric transmission loss, which can be widely used in lidar, laser ranging, optical fiber communication and other fields. An erbium-doped fiber (EDF) with a small absorption cross section at 900-1000 nm is difficult to be used for high-power laser amplification. Moreover, concentration quenching is triggered with the increase of the concentration of erbium ions. Previous reports found that ytterbium ions in the erbium-ytterbium co-doped fibers could effectively absorb pump light and transfer energy to erbium ions. Therefore, the pump conversion efficiency and output power are greatly enhanced. Moreover, the number of ytterbium ions in an erbium-ytterbium co-doped fiber is much higher than that of erbium ions, so that the concentration quenching effect is effectively inhibited. In view of these, an erbium-ytterbium co-doped fiber has been the main gain medium for a 1.5 μm laser. A large mode area erbium-ytterbium co-doped fiber is fabricated based on the modified chemical vapor deposition (MCVD) process and the solution doping technology, and its laser amplification performance is also investigated.MethodsIn the paper, an erbium-ytterbium co-doped fiber is prepared by MCVD combined with solution doping. The silica rude is prepared through corrosion, deposition, liquid phase doping, drying, vitrification, collapse, burning and other processes in the existing MCVD machine. In the gas phase doping process, the reverse deposition is utilized to improve the content of P2O5 in the fiber core. And the doping of P promotes the energy transfer from Yb3+ to Er3+ . Finally, the fiber prefabricated rod is matched with a suitable octagonal quartz sleeve and pulled into a specific size of fiber. A two-stage all-fiber main oscillation power amplification (MOPA) platform is set up to test the laser performance of the fiber. The MOPA structure contains a 1550 nm continuous laser as seed light, and the 915 nm and 940 nm lasers as pump light.Results and DiscussionsTwo erbium-ytterbium co-doped fibers of 10 μm/130 μm (EYDF1) and 25 μm/300 μm (EYDF2) are prepared. The cross section and refractive index profile of the fiber are shown in Figs. 2 and 3, respectively. The core for EYDF1 has a diameter of 10.12 μm, the cladding diameter is 128.25 μm, and the relative refractive index step numerical aperture (NA) of the core is measured to be 0.10. For the EYDF2, the core has a diameter of 25.01 μm, the cladding diameter is 292.09 μm, and the relative refractive index step NA is measured to be 0.12. The fiber cladding absorption coefficient is measured to be 4.50 dB/m at 915 nm for EYDF1 and 2.85 dB/m at 940 nm for EYDF2. For the laser experiment, the seed light power is measured to be 1.13 W. Through the 6.8 m long EYDF1, the signal power is pre-amplified to 5.25 W, and its spectrum is shown in Fig. 5(a). After pre-amplification, the central spectrum is stable at 1550 nm without obvious stray light such as amplified spontaneous radiation(ASE). As the scattered light is collected during the spectral test, the optical signal-to-noise ratio (OSNR) is only 17 dB. The output power versus pump power at the pre-amplification stage is plotted in Fig. 5(b), and the slope efficiency is 38.6%. The signal is coupled into an 8 m long EYDF2 through the MFA and the (6+ 1) ×1 forward pump combiner after pre-amplification, and the remaining signal power is measured to be 2.9 W after EYDF2. The pump light is coupled into the large mode area erbium-ytterbium co-doped fiber by the (6+ 1) ×1 pump combiner. The optical spectrum at 61.7 W is shown in Fig. 6(a). The 1 μm and 1.5 μm ASEs are too small to observe, and the laser signal-to-noise ratio is measured to be 45 dB. The variation of 1.5 μm laser output power with pump power is shown in Fig. 6(b). The maximum output power is measured to be 61.7 W, and the slope efficiency of 42% is achieved. With the increase of pump power, the maximum optical efficiency is measured to be 42.7% when pump power is 35.5 W. The optical-to-optical efficiency begins to decrease when the pump power is increased to 100 W, which is caused by the increase of the backward 1 μm ASE power. With the increase of pump power, the spectral quality is good, and the output power increases steadily. Therefore, the output power and slope efficiency can be further improved by the increase of pump power and the optimization of fiber length in the future.ConclusionsLarge mode area erbium-ytterbium co-doped fibers are successfully fabricated by the MCVD process combined with solution doping. A large mode area erbium-ytterbium co-doped fiber amplification system is established. The 1550 nm laser power of 61.7 W is achieved with a slope efficiency of 42%. It is verified that our large mode area erbium-ytterbium co-doped fiber has a good amplification performance for a 1.5 μm laser.
Jul. 01, 2022Vol. 49 Issue 13 1301004 (2022)
Hao Tian, Chaodu Shi, Shijie Fu, Quan Sheng, Shuai Sun, Shuai Zhang, Junxiang Zhang, Zheng Shi, Peiheng Jiang, Wei Shi, and Jianquan Yao
ObjectiveProgress on high-energy hundreds-ns all-fiber single-frequency fiber master-oscillator-power-amplifier (MOPA) is mainly constrained by the stimulated Brillouin scattering (SBS) effect. The SBS can be generally suppressed by using large-mode-area active fibers with high dopant concentration so that short fiber length is allowed for power scaling. Whereas the insufficient extraction of population inversion due to the limited seed power induces a significant part of amplified spontaneous emission (ASE), which degrades the spectral purity. To avoid this when increasing the SBS threshold of the pulsed single-frequency laser, a fiber amplification scheme based on a hybrid active fiber structure is proposed here to achieve a high energy output. A piece of heavily Yb3+ -doped phosphosilicate fiber with a large core diameter is spliced after a piece of Yb3+ -doped silica fiber with a smaller core diameter. The difference in active fiber size introduces the loss to the reversed Stokes light, which is similar to the operating principle of an outstanding tapered fiber, thereby increasing the threshold of SBS while avoiding the complicated fabrication process. The signal which is pre-amplified by the low Yb3+ -doped silica fiber can effectively extract the population inversion in the phosphosilicate fiber, which exhibits the benefits on ASE suppression and efficiency improvement.MethodsThe 1064.44 nm continuous-wave (CW) laser with a power of 76 mW is modulated by an electro-optic intensity modulator (EOIM) to become a pulsed laser source with a pulse duration of 100 ns. A single-frequency pulsed laser source with an average power of 1 mW is obtained after two-stage Yb3+ -doped fiber core-pumped pre-amplification and an acousto-optic modulator (AOM) synchronized with the EOIM. The average power of the pulsed laser source is increased to 120 mW corresponding to the pulse energy of 0.024 mJ after two-stage Yb3+ -doped fiber cladding-pumped pre-amplification. In the power amplifier, a hybrid active fiber structure, consisting of a 30 cm long piece of Yb3+ -doped silica fiber with a core/cladding diameter of 35 μm/250 μm (pump absorption of 12 dB/m @ 976 nm) and a 30 cm long piece of heavily Yb3+ -doped phosphosilicate fiber with a core/cladding diameter of 50 μm/400 μm (pump absorption of 27 dB/m @ 976 nm) spliced after it, is employed as the gain medium. Meanwhile, the coil diameters of the hybrid active fibers are controlled to ~12 cm and ~20 cm, respectively, in order to optimize the beam quality. For comparison, a 60-cm silica fiber with the same fiber length as that of the hybrid active fiber structure and the 40-cm phosphosilicate fiber which maintains almost the same pump absorption as that of the hybrid active fiber, are also employed as the gain medium in the power amplifier, respectively. The pump power in different cases is increased until the reversed Stokes light appears.Results and DiscussionsThe maximum pulse energy of 0.59 mJ is obtained with the hybrid active fiber structure at the pump power of 13 W and the PRF of 5 kHz [Fig. 2 (a)], and the corresponding average power is 2.95 W with the conversion efficiency of 22.7%. The measured average power of the pulsed laser is 3.05 W, indicating that there is only 0.1 W CW component in the laser output. However, the maximum pulse energy of only 0.327 mJ is obtained at the pump power of 11 W [Fig. 2 (a)] when a 60-cm silica fiber is employed as the gain medium, which indicates that in the hybrid active fiber structure, the SBS threshold is effectively raised by increasing the mode field area of the active fiber and introducing the loss to the reversed Stokes light. When a 40-cm phosphosilicate fiber is employed as the gain medium, the maximum pulse energy is 0.187 mJ, which is corresponding to the average power of 0.935 W and the conversion efficiency of only 10.4% [Fig. 2 (a)]. The measured average power is 1.67 W, which indicates that plenty of ASE and CW components exist, which decreases the signal-to-noise ratio (SNR) and the conversion efficiency. Therefore, in the hybrid active fiber structure, with the benefit of the pre-amplification of the signal by the silica fiber, the population inversion in the phosphosilicate fiber is effectively extracted and the conversion efficiency is enhanced. The pulse shape is measured at the pulse energy of 0.59 mJ, and the pulse duration is broadened to 104 ns from 100 ns (the pulse duration of the seed laser) (Fig. 3). The corresponding maximum peak laser power is ~5.33 kW, the measured spectral linewidth is 40 MHz (Fig. 4), the center wavelength is 1064.44 nm, the SNR is 41 dB (Fig. 5), and the measured beam quality in the x and y directions are 1.48 and 1.50, respectively (Fig. 6).ConclusionsA 1064-nm single-frequency Yb3+ -doped pulsed all-fiber laser based on a hybrid active fiber structure is demonstrated. It can achieve a 0.59-mJ laser output with spectral linewidth of 40 MHz and beam quality of 1.50. The hybrid Yb3+ -doped active fibers with different core diameters are served as the gain media of the power amplifier to enhance the threshold of the SBS and inhibit the ASE. The calculated conversion efficiency is 22.7% and the measured SNR is 41 dB at the highest pulse energy. The hybrid active fiber structure provides a beneficial reference for further pulsed fiber amplifiers.
Jul. 01, 2022Vol. 49 Issue 13 1301005 (2022)
Zhilun Zhang, Xianfeng Lin, Wenzhen Li, Zhongwei Xu, Lei Liao, Gui Chen, Yingbo Chu, Yingbin Xing, Haiqing Li, Jinggang Peng, Nengli Dai, and Jinyan Li
ObjectiveHigh-power ytterbium-doped fiber lasers (YDFLs) have good beam quality, high conversion efficiency, high reliability, and good compactness, making them widely usable in industrial processing, military, and national defense fields. The output power of YDFLs has been unprecedentedly improved with the development of double-clad fiber, laser diodes, and passive devices. This unprecedented progress is hampered by nonlinear effects, such as stimulated Raman scattering (SRS) and transverse mode instability (TMI). The most effective and fundamental way to suppress these two effects is to optimize the structure design of active fiber. We propose a low-numerical aperture confined-doped long-tapered (LCT) fiber that combines the advantages of low numerical aperture (NA), Yb3+ ions restricted doping, and longitudinal tapered design and can theoretically suppress TMI and SRS effects simultaneously.MethodsThe LCT fiber is proposed and successfully fabricated using modified chemical vapor deposition (MCVD) in conjunction with a solution doping technique (SDT). The LCT fiber has a core NA of ~0.05 and a gain dopant doping diameter ratio of ~77%, with a core/cladding diameter of 25/400 μm at both ends and 37.5/600 μm in the middle. A bidirectional-pumped master oscillator power amplifier (MOPA) system verifies the laser performance of the LCT fiber.Results and DiscussionsA laser output of 4.188 kW was obtained with a slope efficiency of 82.8% (Fig. 3). The intensity of the Raman Stocks light was ~18 dB lower than that of the signal laser at 4.188 kW output power, and the M2 factor was about 1.3, maintaining a single-mode output. Further optimization will focus on improving the pump absorption and effective mode area of this fiber to mitigate SRS.ConclusionsWe present a novel low-NA (0.05) confined-doped long-tapered fiber fabricated using the MCVD process in conjunction with SDT. The Yb-ions doping diameter ratio is ~77%, and the middle section core/cladding diameter is 37.5/600 μm, tapering to 25/400 μm at both ends. In the bidirectional pumping MOPA configuration, a 4.188 kW laser is obtained with a slope efficiency of 82.8%. The M2 factor is about 1.3 at 4.188 kW output power, maintaining a single-mode output. The results above reveal that using low-NA confined-doped long-tapered Yb-doped fiber to achieve high power output with high brightness is a promising prospect.
Jul. 01, 2022Vol. 49 Issue 13 1315002 (2022)
Chuan Jin, Liqiao Jiang, Fan Li, Xing Li, and Xiaohan Wang
ObjectivePlanar laser-induced fluorescence (PLIF) technology is commonly used for flame structure diagnosis. For instance, OH hydroxyl (OH radical) and formaldehyde (CH2O) groups in different flames have been extensively measured using the PLIF technology. Generally, the OH radical and CH2O mainly exist in high- and low-temperature oxidation zones of carbon fuel flames, respectively. The heat release rate (HRR) of flames can also be measured indirectly by calculating [OH]×[CH2O] after obtaining the OH-PLIF and CH2O-PLIF images. However, most previous studies have focused on the HRR distribution measurement in turbulent flames with light fuels (e.g., methane) based on the PLIF technology and the measurement of flame thickness has received limited attention. In this study, the PLIF technology is used to measure the HRR and flame thickness of n-butane/air laminar flames under varied equivalence ratios and inlet flow velocities. Moreover, the obtained results are compared with those based on CH* chemiluminescence imaging. Because the oxidation reaction process of n-butane is similar to that of some large molecular hydrocarbon fuels, the findings of this study can provide quantitatively experimental data for further understanding the combustion characteristics of n-butane and large molecular hydrocarbon fuels.MethodsIn the experiment, a coflow burner is used to generate n-butane/air jet flames for optical diagnosis. The inner diameter of the burner center tube for supplying n-butane/air mixtures is 4.5 mm, and the diameter of the sintered bronze plug plate of the burner for supplying the accompanying air is 60 mm. The equivalence ratios of the mixtures are 1.1-1.5. The mixture flow velocity is varied from 1.6 to 2.0 m/s with the Reynolds number Re=497-636. The PLIF technology (LaVision Inc.) is employed to measure the flame structure. The OH-PLIF and CH2O-PLIF measurements are performed using excitation wavelengths near 283 and 355 nm, respectively (~6.5 and 260 mJ/pulse, respectively, @ 10 Hz). All fluorescence signals are measured using an ICCD camera equipped with a UV lens and filters. The detected wavelengths of the OH and CH2O fluorescence signals are ±310 and >390 nm, respectively, in the visible light wavelength range. Moreover, a digital camera and the ICCD combined with the CH* filter are used to record the flames in the visible wavelength range and CH* chemiluminescence, respectively. In data processing, 100 images of OH-PLIF and CH2O-PLIF fluorescence signals are averaged and exported using the DaVis software by subtracting the background. Using the MATLAB program, the normalized [OH]×[CH2O] images are obtained to represent the HRR distribution. Finally, the HRR and flame thickness of the n-butane/air coflow jet flames obtained using the aforementioned optical measurement methods are analyzed.Results and DiscussionsBased on the CH* chemiluminescence imaging, the OH-PLIF and CH2O-PLIF images can clearly indicate the flamefront structure. At mixture equivalence ratios of 1.3 and 1.5, the open-tip structure of n-butane/air jet flames appears owing to the thermal diffusive instability. However, in the CH2O-PLIF images, no such open-tip structure is observed (Fig. 2). The HRR position marked by [OH]×[CH2O] is observed between the OH-PLIF and CH2O-PLIF fluorescence signals. Furthermore, the HRR distribution profile of OH is similar to that of CH2O and the HRR distribution of OH fairly overlaps with that of CH2O. With increasing mixture flow velocity, the overlap zone between the HRR distributions of OH and CH2O increases (Fig. 3). In the normal flamefront direction, the HRR distribution represented by [OH]×[CH2O] and CH* shows a single-peak-value curve. Moreover, the peak-value positions of [OH]×[CH2O] and CH* are consistent (Fig. 5). This confirms that the [OH]×[CH2O] distribution measured using the PLIF technology can be used to indicate the HRR of n-butane flames. The thicknesses of the flames defined by the distance between the peak values of CH2O (low-temperature reaction) and OH (high-temperature reaction) are 1.5-3.5 mm, considerably larger than the full width at half maximum (FWHM) of HRR in the CH* and [OH]×[CH2O] images. The flame thicknesses are 0.3-1.0 mm using CH* and [OH]×[CH2O], consistent with the theoretical results (Fig. 7).ConclusionsBased on the PLIF and chemiluminescence imaging technologies, the structure of the n-butane/air coflow jet flames is measured under normal temperature and pressure conditions. The HRR distribution is obtained by calculating [OH]×[CH2O] based on the OH-PLIF and CH2O-PLIF images in the axis section, and the thickness of flames is obtained. The OH-PLIF images clearly show the open-tip structure at the top of the flame caused by the thermal diffusive instability. However, a strong CH2O-PLIF signal is detected in the area, indicating a strong low-temperature oxidation reaction. The HRR distribution in the flame is located between the peaks of CH2O and OH radical distributions, and the HRR distribution zone obtained using PLIF is slightly narrower than that obtained using the CH* chemiluminescence imaging. The equivalent ratio considerably influences the peak-value position of the HRR, while a weak influence of the flow rate is observed under low Reynolds number conditions. This is because the OH-PLIF signal shows a considerable shift with an increase in the mixture equivalence ratio. The flame thickness obtained based on the distance between the OH radical and CH2O peak value positions is obviously greater than the FWHM of the HRR in the [OH]×[CH2O] and CH* chemiluminescence images.
Jul. 01, 2022Vol. 49 Issue 13 1304001 (2022)
Yefeng He, Yibo Pang, Man Di, Yuru Yue, Guoqing Li, and Jixiang Liu
ObjectiveWith the continuous development of quantum calculations, the classic cryptosystem that relies on mathematical difficulties and computational complexity to ensure security is constantly under threat. Therefore, in recent years, a large number of scholars have attracted attention from the quantum cryptography produced by the combination of cryptography and quantum mechanics. At present, quantum cryptography has many branches, such as quantum key distribution, quantum key agreement, quantum secure sharing, quantum secure direct communication, and deterministic secure quantum communication. Among them, quantum key agreement is an important branch of quantum cryptography. In real life, quantum key agreement is widely used in scenarios such as end-to-end communication and internet of things. Although, in the current quantum key agreement protocol, a secure shared key can be established between legal participants. However, participants in the quantum key agreement protocol are required to have high capabilities and equipment. But, the quantum equipment is still too expensive even in relatively rich future material conditions. In order to cope with this situation, the semi-quantum key agreement protocol is proposed by scholars. It allows one or more participants in the protocol to only have simple quantum capabilities, that is, to use the Z basis (|0〉, |1〉) for preparation and measurement. Therefore, the protocol reduces the requirements for participant capabilities and equipment. In addition, research on semi-quantum key agreement is relatively small. Therefore, the semi-quantum key agreement needs to be studied by scholars.MethodsIn this paper, a new two-party semi-quantum key agreement protocol is designed based on the G-like state. The securely shared key in the protocol is established by the two classical parties, Alice and Bob, through the measurement-resending operation and the entanglement characteristics of the G-like state with the assistance of a trusted third party with full quantum capabilities, Charlie, and the contributions of both parties are equal. The shared key cannot be determined by any participants alone. The G-like state is a special three-particle entangled state, and its entanglement properties are used in the key agreement and eavesdropping detection part of the protocol. For example, the measurement result of the counterpart can be inferred by the participant through the entanglement properties of his own initial quantum state and the G-like state. And the measurement-resending operation means that the particles are randomly executed the CTRL and SIFT operations. Among them, the CTRL operation means that the particles are only executed to reflection operations, and the SIFT operation means that the particles are executed to the Z basic measurement and a new particle is prepared. Finally, the newly prepared particles are resent. In this protocol, the measurement-resending operation is performed twice by us. Therefore, the CTRL particles usually discarded in the previous protocol can be reused and the waste of quantum resources is reduced. In terms of security, the security of the protocol is guaranteed by the entanglement characteristics of the G-like state. In addition, two optical devices, wavelength quantum filter (WQF) and photon number separator (PNS), have been introduced, so that the protocol can also resist two Trojan horse attacks. In terms of qubit efficiency, the performance of the protocol is measured by Cabello qubit efficiency.Results and DiscussionsAlthough most of the quantum key agreement protocols have been proposed to enable the secure keys to be established between participants. But all participants in these protocols are required to have full quantum capabilities. However, quantum devices are relatively expensive and difficult to carry. Therefore, the semi-quantum key agreement protocol is proposed to solve this problem. A trusted third party with full quantum capabilities is introduced, and thus the two-party semi-quantum key agreement protocol can be realized. The trusted third party can be used to prepare the G-like state required for this protocol. At the same time, it can also perform eavesdropping detection jointly with all participants. This ensures that the external attacks can be well resisted by the protocol, and in addition, the participant attacks can also be well resisted by the protocol. Since the quantum state in this protocol has been transmitted for many times, the attacker can eavesdrop on the information related to the shared key through a Trojan horse attack. Therefore, two optical devices, the wavelength quantum filter and the photon number separator, are introduced by us. Among them, the invisible photons can be filtered out by the wavelength quantum filter, and the delayed photons can be detected by the photon number separator. This ensures that the protocol can also resist two types of Trojan attacks. In terms of performance, Cabello qubit efficiency is used to measure the performance of the protocol. At present, this method is mainly used to evaluate the performance of the quantum key agreement protocol. The qubit efficiency of the semi-quantum key agreement protocol is generally low. But this kind of agreement has low requirements for participants. Therefore, the semi-quantum key agreement protocol is more suitable for our current situation.ConclusionsIn this paper, a two-party semi-quantum key agreement protocol based on G-like state is proposed. A securely shared key can be established by two semi-quantum parties with the assistance of a trusted third party. In terms of security, participant attacks and external attacks can be well resisted. In addition, the protocol also has an advantage in performance.
Jul. 01, 2022Vol. 49 Issue 13 1312001 (2022)
Xin Tian, Binyu Rao, Meng Wang, Xiaoming Xi, Zhixian Li, Chongwei Wang, Hao Li, Zilun Chen, Zhiyong Pan, Xiaolin Wang, and Zefeng Wang
Jul. 01, 2022Vol. 49 Issue 13 1316001 (2022)
Sicheng Li, Jiangming Xu, Junrui Liang, Jun Ye, Yang Zhang, Xiaoya Ma, and Pu Zhou
Jul. 01, 2022Vol. 49 Issue 13 1316002 (2022)
Jianru Yang, Kai Tan, Weiguo Zhang, and Shuai Liu
ObjectiveCharacterized by high phenotypic plasticity, salinity tolerance, and metal tolerance, Poaceae in mudflats and wetlands are considered to have great potentials for ecological restoration, coastal risk response, and climate change indication. Accordingly, in the context of severer climate change and fast-risen global mean sea level, there is a strong and urgent requirement of phenotypic traits extraction and growth monitoring for these plants. Terrestrial laser scanner (TLS) is a novel but effective way for retrieving phenotypic, biochemical, and physical parameters of Poaceae plants in intertidal wetlands. Before retrieving these various parameters, intelligent identification and precise separation for stalks and leaves are required. However, Poaceae plants in mudflats and wetlands are densely growing with tangled and complex leaves, making it more challenging to automatically separate the stalks and leaves. With the challenge above, we propose a new separation algorithm for stalks and leaves of individual Poaceae plants in intertidal wetlands using TLS three-dimensional point cloud data.MethodsIn the present algorithm, reflectance information (intensity data) and several spatial geometric characteristics (i.e., density, normal vectors, and spatial connectivity) are employed. Typically, there is an edge loss or edge effect in the laser scanning data of Poaceae in mudflats and wetlands. This results in low intensity for edge parts of stalk and leaves and intensity data errors on these parts. Additionally, differences in geometry and sizes of stalks and leaves can lead to discrepancies in the number of neighborhood points within a given search radius (i.e., density). Therefore, corrected intensity and density data can initially be used to separate stalks and leaves. Further, individual Poaceae plants are divided into two different types (i.e., upturned leaves and drooping leaves), and separation is continuously conducted from two different routes based on the geometric differences (i.e., density, normal vectors, and spatial connectivity). The specific procedures of the two routes are subtly different. The fundamental principles of the two routes are based on preliminary separation using normal vectors and density data, and stalk, in which leaf points are eventually classified according to the spatial connectivity logic.Results and DiscussionsRiegl VZ-4000, a long range full-waveform TLS, is used to obtain the point cloud data of a total of 16 Giant Reeds or Reeds from the western of Chongming Island in Shanghai to test and analyze the proposed method (Fig. 4). To assess the predictive performance of the proposed algorithm convincingly, we quantitatively assess all samples’ results using the confusion matrix (Table 1). Hence, the manual separation results are taken as truth reference data. By inputting a single parameter ra into the entire algorithm, an averaged overall accuracy of 0.87, and an averaged Kappa coefficient of 0.68 are achieved (Table 2 and Fig. 5). ra is empirically determined following the common stalk size of Giant Reed or Reed, is suitable to all samples in this research. However, when given a large number of samples, it is essential to adjust ra to achieve more satisfactory separation results. In addition, future studies are recommended to address the adaptive estimation of ra to improve the proposed method’s automatic and unsupervised performance. Results show that the proposed method has relatively high accuracy and fairly good robustness. However, because of the complexity of Poaceae morphology, surface heterogeneity in the reflectance (usually caused by withered stalks and leaves and speckles of diseases), and dearth of data points (especially for plants far from the instrument due to occlusion effects), the clustering process of intensity can be over-segmented. Therefore, under those circumstances, spatial connectivity of stalks and leaves may be destroyed, and misclassification will be inevitable. The proposed algorithm only uses some fundamental information or characteristics. Thus, it is more efficient and does not require time-consuming work like some existing methods, such as neural network training, regression statistical analysis, or grid construction. Moreover, the proposed method can be extended to stalk and leaf separation for other Poaceae species (e.g., wheat, maize, sorghum, and bamboo). More deep investigations should be conducted to separate stalks and leaves for natural growing Poaceae in mudflats and wetlands. Combining multiplatform and multi-type remote sensing observations may be a potential solution.ConclusionsIn this study, a novel separation algorithm is exploratively proposed for stalk and leaves of Poaceae (Giant Reed and Reed) in mudflats and wetlands using TLS three-dimensional point cloud data. Accordingly, an overall accuracy of 0.87 is acquired by setting a single parameter. The proposed method succeeds in providing a technical solution for retrieving phenotypic, biochemical, and physical parameters of Poaceae plants in mudflats and wetlands. It is worth mentioning that only very few existing methods can achieve effective stalk and leaf separation of Poaceae in mudflats and wetlands. The major innovation is that different kinds of spectral and geometric information are fully utilized in the proposed method, enabling the providing of an effective remote sensing solution for vegetation monitoring or biomass observation in estuarine and coastal zones.
Jul. 01, 2022Vol. 49 Issue 13 1310001 (2022)
Shichun Li, Xu Wang, Penghui Zhang, Wenhui Xin, Dengxin Hua, Xianglong Hu, and Yuehui Song
ObjectiveAtmospheric temperature is an important meteorological parameter in atmospheric physics, weather forecasting, and environmental monitoring. Because of the advantages of high temporal and spatial resolution, atmospheric temperature lidar has become a research hotspot. Because of the influence of aerosols at the bottom of the atmosphere, pure rotational Raman and Rayleigh high optical spectral lidars have become important equipment for observing atmospheric boundary layer temperature profiles. Among them, the pure rotational Raman lidar with a medium optical spectral resolution has particularly developed rapidly. However, it still has problems such as daytime detection capability and system stability, which have become critical factors in limiting its application. Based on the current application status of these optical spectroscopic bulk optics in the pure rotational Raman lidar, particularly the application of F-P interferometer (FPI) in the temperature relative detection technique of pure rotational Raman lidar, a multichannel pure rotational Raman lidar spectroscopic system is proposed and designed by combining with the research progress of our research group in the field of absolute-probing temperature lidar.MethodsConsidering the influence of the atmospheric fluorescence signal, the pure rotational Raman signal of the anti-Stokes branch is selected in the pure rotational Raman fine spectral-line structure of nitrogen molecules in the atmosphere to retrieve the atmospheric temperature. The FPI is used as a frequency comb filter to configure the primary pure rotational Raman spectroscopic system to effectively filter the daytime solar background noise and the pure rotational Raman spectral signals of other gas components such as oxygen molecules, which are distributed between the pure rotational Raman spectral signals of nitrogen molecules. A secondary pure rotational Raman spectroscopy system is constructed using the advantages of a low-order diffraction grating for spatial spectroscopy combined with a precise and uniform fiber line array to effectively extract the pure rotational Raman signal of the even rotational quantum number of nitrogen molecules. Based on FPI and low-order diffraction gratings, a two-stage pure rotational Raman spectroscopy system is promoted to effectively filter the background noise between the pure rotational Raman spectral lines and achieve a suppression rate of approximately 60 dB for elastic scattering signal, thereby achieving absolute detection of atmospheric temperature profile based on the pure rotational Raman lidar.Results and DiscussionsFirst, the FPI application results in the relative detection temperature lidar and multichannel pure rotational Raman absolute detection temperature lidar technique are combined, and the direct retrieval model of the atmospheric temperature from the multichannel pure rotational Raman signals is analyzed based on the principle of least squares. A statistical error model for retrieving atmospheric temperature from multichannel pure rotation Raman signal is proposed using sensitivity and signal-to-noise ratio (SNR) theory. A two-stage parallel 8-channel pure rotational Raman spectroscopy with FPI and low-order diffraction grating as the core is designed, followed by the construction of a pure rotational Raman lidar for absolute temperature measurement throughout the day (Fig. 2). Second, based on the spectroscopic principle of multibeam interference of FPI, it finely matches the spectral structure of the pure rotational quantum number of nitrogen molecules and optimizes performance parameters such as the free spectral range, fineness, extreme transmittance (maximum and minimum transmittance), and full width of half maximum (FWHM) of FPI. Considering the film loss and mirror defects of FPI, the structural parameters (Table 2) and performance parameters (Fig. 5) of FPI are optimized to match the pure rotational quantum number Raman spectra of the anti-Stokes branch of the nitrogen molecule. Therefore, we can suppress the elastic scattering signal by approximately 60 dB using a two-stage spectral filter (Table 3), and effectively filtering out the solar background noise and neighboring spectra in these eight channels. Finally, assuming that the radiant energy density of the solar background light is approximately 0.5 W·m-2·sr-1·nm-1, and the standard atmosphere model and statistical error analysis model are combined based on the SNR, the signal power and SNR of the rotating Raman lidar for absolute profiling atmospheric temperature throughout a day are simulated (Fig. 6) using the system parameters of the pure rotation Raman lidar (Table 1) and the multichannel pure rotation Raman spectroscopy parameters (Table 3), and then the retrieval temperature deviation of the system are analyzed (Fig. 7) to verify the effectiveness of 8-channel rotating Raman spectroscopy system.ConclusionsIn this study, we propose and design a two-stage parallel 8-Raman channel spectroscopic system with FPI and a low-order diffraction grating. The mirror spacing and FWHM of the frequency comb filter FPI are optimized to be 629.300 μm and 6 pm, respectively. The reflectivity and defect fineness are 0.9519 and 45.63, respectively, to efficiently filter out the solar background radiation noise and adjacent Raman spectral-line signals. The eight even rotational quantum numbers of nitrogen molecules (J=6-20) are chosen as the retrieval spectral signals for the absolute detection of atmospheric temperature profiles. The pure rotational Raman channel can suppress the elastic scattering signal by approximately 60 dB when the test results of the first-order diffraction grating by our research group are combined. The simulation analysis results show that, while the accumulation time is 17 min, the pure rotational Raman spectroscopic system can achieve the synchronous extraction of 8-channel pure rotational Raman signals of up to 1.8 km during the daytime with SNR better than 10. The detection height of the lidar for directly retrieving temperature is then increased from 0.4 to 0.8 km with a deviation less than 1 K. Considering the actual lidar system overlap factor, the temperature profile of a certain height in the troposphere can be obtained, allowing for uncorrected detection of atmospheric temperature throughout the day.
Jul. 01, 2022Vol. 49 Issue 13 1310002 (2022)
Tong Zhang, Haochong Huang, Zili Zhang, Hua Gao, Lu Gao, and Zhiyuan Zheng
ObjectivePlastics have a wide range of applications in the medical device, textile, construction, and automotive industries by virtue of low cost and high performance. Information on the radiation intensity of samples can be obtained by conventional detection methods, while information on other parameters such as phase and refractive index are not available. Terahertz time-domain spectroscopy is a low destructive, non-contact, high penetration and high sensitivity technique with a wide range of applications in material property analysis. In this paper, terahertz time-domain spectroscopy is used to characterize particle size, type and content of blends as well as absorption properties of high-density polyethylene (HDPE), polypropylene (PP), and polyvinyl chloride (PVC). The variations of optical parameters (refractive index and absorption coefficient) of PVC-PP blends in the range of 0.2-1.6 THz with content and frequency are compared and analyzed, and the variations of optical parameters of HDPE, PP, and PVC blended with calcium carbonate (CaCO3) and Kaolin fillers in the range of 0.2-1.4 THz with content and frequency are characterized and the correlation curves are established. A database is provided for the effective use of the optical properties of plastics in the terahertz range, which can be used as a supplement to the near-infrared spectroscopy plastic detection method and provides a technical means to monitor the filler content in industrial production. In addition, the terahertz time-domain spectroscopy technique can distinguish the absorption of common seawater pollutant methyl orange by different micro-plastics. These phenomena have important implications for the analysis of the environmental pollution of micro-plastics.MethodsPP, PVC and HDPE plastic particles with different particle sizes (less than 74 μm and 178 μm) are prepared. First, PVC and PP with particle size of less than 74 μm are mixed in a mortar and pressed into PVC-PP mixtures with different proportions. CaCO3 and Kaolin powder with the mass fraction of 0%-50% is added to PVC, PP, and HDPE, respectively. In the above experiments, 0.2 g mixed powder samples are mixed in a mortar for 20 min and pressed with a hydraulic press at 10 MPa for 2 min. The diameter of the sample is 13 mm and the thickness is 1-2 mm. The samples are tested by terahertz time-domain spectroscopy (THz-TDS) at 22 ℃ and 2% humidity to avoid moisture entering the samples to influence the experimental results. The liquid samples are placed in a liquid bath with a thickness of 0.1 mm. The THz-TDS system is used in the transmission mode without considering the influence of multiple reflection of terahertz pulses.Results and DiscussionsThe terahertz spectral lines of PP, HDPE and PVC with particle size of less than 74 μm are different in the range of 0.2-1.6 THz. The scattering effect becomes stronger when the particle size is close to the wavelength, and the absorbance of the samples at the same frequency is higher (Fig. 2). To avoid the influence of scattering effect of plastics, we mix the PVC and PP with particle size of less than 74 μm, and we find that the absorbance and refractive index increase with the increase of the PVC mass ratio (Fig. 3). The utility of terahertz elements made from the blends in the terahertz range can be improved by the curve fitting of the mixing results. Blends of three plastics (PVC, PP and HDPE) with two fillers (Kaolin and calcium carbonate) are characterized separately (Fig. 4). The dependence of optical parameters on filler concentration is characterized by establishing the correlation curves (Fig. 5), where CaCO3 has a greater effect on the samples than Kaolin. The high absorbance of PVC could be clearly distinguished from those of the other two plastics, and the effects of filler on HDPE and PP are closer but distinguishable by observing the fitting parameters (Tables 1 and 2). Finally, the absorption effect of plastics is explored. The adsorption phenomenon of micro-plastics could be distinguished by THz-TDS (Fig. 6), and the absorption effect of PVC is stronger than those of the other two plastics. The absorption reaction within 24 h could be distinguished by THz-TDS (Fig. 7), and the smaller the particle size of the plastic, the stronger its absorption capacity (Fig. 8).ConclusionsIn this paper, HDPE, PP, PVC and their filler-containing compounds are characterized by the terahertz time-domain spectroscopy. The characterizations of refractive indices and absorbance of PVC-PP blends compared to those of single polymers are useful for the fabrication of terahertz optical components. Blends made with different proportions of fillers can be identified by the terahertz time-domain spectroscopy technique. In addition, the time-domain spectra and absorbance of three plastics are related to the particle sizes of the constituent samples. The terahertz time-domain spectroscopy technique can detect different absorption capacities of three plastics and the differences in the absorption capacity to methyl orange of plastics at different time or with different particle sizes. Our study highlights the feasibility and promise of the terahertz time-domain spectroscopy for the identification and detection of plastics and their mixtures, and provides a new characterization method for the absorption behaviors of micro-plastics in the environment.
Jul. 01, 2022Vol. 49 Issue 13 1311001 (2022)
Shencheng Shi, Mengyun Hu, Qingshan Zhang, and Heping Zeng
ObjectiveLaser-induced breakdown spectroscopy (LIBS) is a novel atomic-emission spectroscopic technique, which has many advantages such as multi-elemental detection, rapid response for online monitoring, and easy sample preparation for in situ measurements, and it has been applied in many fields. However, nanosecond laser-induced breakdown spectroscopy (ns-LIBS) still has some defects such as poor stability, low analysis accuracy, and matrix effects. Many methods have been proposed to solve these problems. Among them, filament-induced breakdown spectroscopy (FIBS) and plasma-grating-induced breakdown spectroscopy (GIBS) based on femtosecond laser excitation do not require the introduction of additional equipment and sample preparation steps if compared with other methods. In FIBS, a long and stable filament is used to ablate samples. And it has been proved that FIBS has very stable analysis results and can be used to realize remote sensing detection. And GIBS is based on the plasma grating formed by the interaction of two non-collinear filaments to excite samples. A significant increase in spectral line intensity has been successfully observed in the comparative experiment between FIBS and GIBS. However, the length of the plasma grating is greatly reduced compared with that of the filament, so it is necessary to investigate the analysis stability of the GIBS technology. In addition, the influence of the enhanced spectral line intensity brought by the GIBS technology on the detection limit is still to be studied.MethodsWe build a GIBS system based on a plasma grating formed by the interaction of two filaments intersecting at a small angle to ablate the sample and generate plasma. In order to better control the experimental variables, we realize the conversion to the FIBS system by blocking one of the light filaments in the GIBS system. The sample is placed on a three-dimensional translation table to avoid over-ablation and the position of the sample relative to the focal point of the lens is changed. We collect the light emission from the induced plasma and transmit it to a spectrometer by an optical fiber. The light dispersed by the spectrometer is detected with an intensified charge-coupled device (ICCD). The ICCD is set to an on-chip integration mode to realize 100 excitations for each spectral data. In addition, we also configure the standard soil samples with different concentrations of Cr to establish calibration curves and analyze the detection limits of these two systems.Results and DiscussionsWe first compare the signal intensities of the spectral lines induced by the FIBS system and the GIBS system under the same conditions. An enhancement factor of around 2 is successfully obtained, which is very sensitive to the inter-pulse delay (Fig. 4). From this perspective, it can be clearly judged that the GIBS system we build is based on the excitation of the sample by the plasma grating formed by the interaction of two filaments. Then we study the influence of sample spatial position on these two systems to reflect the stability of the excited sample. When the laser energy is increased from 0.5 mJ to 1.5 mJ, the sample spatial position range corresponding to the obvious spectral line signal excited in the FIBS system increases from 1 mm to 4 mm, while in the case of GIBS system, such a range increases from 0.2 mm to 0.4 mm (Fig. 5). Unsurprisingly, the GIBS system has stricter requirements on the sample spatial location than the FIBS system. However, as laser energy increases, the optimal spectral line signal position in the GIBS system is stable around 0 mm, the position where the filaments intersect. In contrast, the optimal spectral line signal position in the FIBS system moves towards the lens as laser energy increases. In the last part, we compare the detection sensitivities of the FIBS system and the GIBS system by establishing a calibration curve for Cr element in the soil. In both systems, the coefficient of determination (R2) of the calibration curve exceeds 0.99 (Table 1), which means that both systems are very suitable for a quantitative analysis. But what is more, the limit of detection (LOD) in the FIBS system is calculated to be 55.09×10⁻⁶, while in the GIBS system it is 29.96×10⁻⁶. This shows that the GIBS system is more advantageous for the detection of trace elements.ConclusionsWe build a GIBS system to analyze soil samples, and the spectral signal enhancement by about 2 times that of the FIBS system is successfully obtained, which is closely related to the inter-pulse delay. By studying the influence of the spatial position of the sample on the spectral line signal under different laser energies, it is proved that although the sample spatial position range corresponding to the obvious spectral line signal excited in the GIBS system is reduced compared with that in the FIBS system, the optimal spectral line signal position in the GIBS system does not change with laser energy, as that in the FIBS system. In addition, in the quantitative study of the heavy metal element Cr in the soil, it is found that both FIBS and GIBS systems can be used to establish a linear calibration curve and the limit of detection in the FIBS system is 55.09×10⁻⁶, while the limit of detection in the GIBS system is 29.96×10⁻⁶, indicating that the GIBS technology has high detection sensitivity.
Jul. 01, 2022Vol. 49 Issue 13 1311002 (2022)
Yuanxia Fu, Ren Jia, Peng Xu, Ling Xue, Guanxin Yao, Xianfeng Zheng, Zhengbo Qin, Xinyan Yang, and Zhifeng Cui
ObjectiveLaser-induced breakdown spectroscopy (LIBS) is widely used in various fields, such as agriculture, industry, national defense, energy, aerospace, natural science, and interstellar physics, because of its unique advantages. However, low detection sensitivity and accuracy have hindered the expansion of LIBS, and many researchers have worked to improve the detection sensitivity and reduce measurement errors. Optimizing the experimental parameters is important in LIBS. The maximum intensity or signal-to-noise ratio of a LIBS signal under the optimal experimental parameters is an important means of improving the LIBS detection sensitivity. However, studies on the effect of sample matrix properties on the optimal detection system, which we call the matrix effect of the optimal experimental parameters, are scarce. Therefore, the matrix effect of the optimal experimental parameters must be studied for selecting the standard samples in the calibration method and improving the LIBS characteristics. The distance between the focal position of the laser beam and sample surface (defocus distance) is an important experimental parameter of a LIBS system during LIBS analysis. Optimizing this parameter ensures that the LIBS signal has the strongest intensity. Therefore, the intrinsic connection between the physical properties of the matrix and optimal defocus distance must be studied to select a suitable matrix for enhancing the LIBS signal and selecting a reference sample for the calibration method. We could not find other studies focusing on the correlation between the metal matrix and optimal experimental parameters.MethodsConsidering that the interaction of nanosecond pulsed laser and metallic materials to form a plasma involves the evaporation of metallic materials, interaction of vapors with laser, and plasma radiation, this work studies the influence of the matrix physical properties (density, hardness, optical absorption coefficient, ionization energy, electric conductivity, thermal conductivity, specific heat capacity, melting point, boiling point, latent heat of melting, and latent heat of vaporization) on the optimal defocus distance. Twelve metal matrix samples with considerable differences in the physical properties, i.e., Co, Ni, V, Nb, Cr, In, Sn, Cu, Er, Gd, Bi, and Zn, were selected, and the LIBS signals of these samples were measured. The appropriate metal element spectral lines were selected as the analytical spectral lines for optimizing the experimental parameters. The optimal defocus distances of the metal samples were obtained from the experimental results (Table 3). Based on the linear correlation hypothesis between the change in matrix physical parameters and optimal defocus distances, 11 equations were created and solved using the Mathematica program. For the first time, the correlation coefficients between the optimal defocus distance and matrix physical parameters were obtained.According to the correlation coefficients obtained and the nature of the matrix physical parameters, a rational correlation analysis was conducted to investigate the matrix effect mechanism of the optimal defocus distance. This study will be useful for developing a laser beam focusing on an optimization method in LIBS quantitative analysis.Results and DiscussionsThe correlation properties between the physical property parameters of the matrix and optimal defocus distance were obtained (Table 4). The density and hardness in mechanical property parameters are negatively correlated with the optimal defocus distance, and the hardness has a higher correlation coefficient than density. The optical absorption in optical properties parameters exhibits a positive correlation with the optimal defocus distance, whereas the ionization energy is negatively correlated with the optimal defocus distance. The conductivity of the matrix has a negative correlation with the optimal defocus distance. The influence of the thermodynamic properties of the substrate on the optimum defocus distance is prominent. The thermal conductivity, specific heat capacity, latent heat of melting, latent heat of vaporization, and boiling point of the matrix are positively correlated with the optimal defocus distance. Conversely, the melting point of the matrix is negatively correlated, with the high correlations for thermal conductivity and specific heat capacity. In the absence of previous studies on the matrix effect on optimal defocus distance for comparison, the results of existing LIBS breakdown threshold matrix effect studies and our speculation of the correlation between LIBS breakdown threshold and optimal defocus distance were used to explore the physical mechanism of the optimal defocus distance matrix effect.ConclusionsThe matrix effect of the optimal defocus distance of metal samples was investigated. The correlation rules between the optimal defocus distances and physical properties of metal matrix elements were initially revealed, which was corroborated with the results of the previous study on the LIBS breakdown threshold. Results show that the mechanical, optical, electrical, and thermal properties of the metal matrix influence the optimal defocus distance. However, the influence of thermal properties is more obvious, especially the thermal conductivity and specific heat capacity having the greatest influence on the optimal defocus distance, both of which show a positive correlation. A preliminary analysis of the mechanism of the optimal defocus distance matrix effect was also conducted based on the physical parameters of the matrix elements. The study results provide basic support for further understanding and correcting matrix effects, improving the quality of LIBS analysis.
Jul. 01, 2022Vol. 49 Issue 13 1311003 (2022)
© Copyright 2018-2021 | Chinese Laser Press.
All Rights Reserved 沪ICP备15018463号-20