


Please enter the answer below before you can view the full text.

Zhi Liu, Zewei Luo, Zhengyin Wang, Zhuang Tu, Zhengfei Zhuang, and Tongsheng Chen
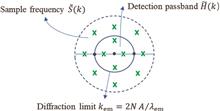
Significance Super-resolution microscopy overcomes the 200 nm spatial resolution limitation of traditional optical microscopy and has been widely used to image subcellular structures in living cells. Super-resolution microscopy mainly includes stimulated emission depletion (STED) microscopy, structured illumination microscopy (SIM), and single-molecule localization microscopy (SMLM). Super-resolution structured illumination microscopy (SR-SIM) is the most widely used super-resolution microscopy technique. Owing to the low phototoxicity, high-speed wide field of view, and multichannel three-dimensional super-resolution imaging capabilities, SR-SIM is especially suitable for real-time detection of dynamic fine structures in living cells. SR-SIM has high-speed wide-field imaging capabilities that enable rapid dynamic measurement of living cells. Compared with STED and SMLM microscopy imaging under a light intensity of ~1000 W/cm 2, SR-SIM allows imaging under a low light intensity of ~10 W/cm 2, which meets the requirement of long-term imaging of living cells. At the same time, multicolor and multichannel imaging by SR-SIM is beneficial to the study of molecular interactions. The super-resolution structured illumination reconstruction algorithm (SIM-RA) is the key to realizing fast, long-term, and nondestructive super-resolution imaging of SR-SIM. SR-SIM uses structured light in different directions and phases to excite the fluorescent sample for acquiring multiple original images with illumination patterns and then reconstructs a single super-resolution image through mathematical calculations. Owing to the imperfection of the experiment and the inevitable uncertainty in the measurement of experimental parameters, the estimation of the reconstruction parameters results in false signal and noise, which reduces the resolution of the SR-SIM image and introduces artifacts that can be misinterpreted as biologically relevant features. An excellent SIM-RA can improve the accuracy of reconstruction parameters and filter out noise to reduce artifacts and ensure image quality. In addition, a long exposure time will increase the phototoxicity and photobleaching, which is not conducive to the long-time observation of living cells. SIM-RA can reduce the exposure time by two orders of magnitude for the reconstruction of SR-SIM images, allowing the use of fewer original images to achieve SR-SIM image reconstruction, providing longer and faster super-resolution imaging. Initially, SR-SIM requires users to have professional knowledge. The development of SIM-RA makes it unnecessary to manually set parameters, automatically obtain reconstruction parameters and estimate their uncertainty, and thus to reconstruct super-resolution images with a considerably reduced threshold. The super-resolution structured illumination microscopic image reconstruction process requires strict analysis and calculation to ensure the final super-resolution image quality and imaging speed, which relies on an efficient and stable SIM-RA.In the past two decades, to achieve automatic, simple, and stable acquisition of high-quality and high-spatial-resolution reconstruction images, the development of super-resolution SIM image reconstruction algorithms has never stopped. Systematic summary and analysis of SIM-RA are necessary for users who want to construct a higher-performance super-resolution structured illumination microscopy system.Progress This article systematically elaborates and analyzes the reconstruction algorithm of super-resolution structured illumination microscopy. First, it briefly introduces the realization principles and respective advantages of the three super-resolution microscopy techniques, i.e., STED, SIM, and SMLM, and expounds the necessity of studying SIM-RA based on the characteristics of SR-SIM imaging. Second, it introduces the imaging principle of SR-SIM based on structured illumination in detail, and focuses on SIM-RA. In view of the possible reasons for the poor imaging quality caused in the SR-SIM image reconstruction process and the improvement of the algorithm for fast, long-term, and nondestructive imaging of SR-SIM, the calibration and parameter value acquisition algorithms of SR-SIM, SIM-RA, and SR-SIM toolbox are analyzed and summarized. Initially, Gustafsson extended the Wiener filter and applied it to SR-SIM image reconstruction to solve the problem of reconstruction artifacts. Compared with Wiener filtering, the R-L deconvolution algorithm reduces the influence of photon noise on the imaging results, and MAP-SIM further reduces the influence of noise by suppressing defocused light (Fig.4). System calibration before SR-SIM imaging helps reduce artifacts, and the accuracy of reconstruction parameters determines the quality of the reconstructed image. Using algorithms including iterative calculations to accurately determine reconstruction parameters such as illumination frequency and illumination phase is a prerequisite for achieving artifact-free SR-SIM imaging. The inversion of SR-SIM images based on Bayesian theory allows automatic acquisition of parameters and reduces the number of reconstructed original images, which is helpful for the realization of fast automatic imaging. The Hessian-SIM algorithm automatically filters the original image to reduce artifacts and uses methods such as rolling reconstruction to achieve fast and long-term imaging (Fig.5). To promote the development of SR-SIM, FairSIM and SIMcheck have been developed to provide general reconstruction algorithms. OpenSIM and SIMToolbox provide open-source codes to help researchers further study SIM-RA. In addition, machine learning is also used to achieve fast SR-SIM image reconstruction. At the end of the article, five problems to be solved in the current development of super-resolution structured illumination microscopy image reconstruction algorithms are summarized.Conclusion and Prospect The super-resolution SIM image reconstruction algorithm has a decisive influence on the imaging quality and imaging speed of super-resolution SIM. To achieve fast, stable, and automatic acquisition of high-quality, high-temporal-resolution super-resolution SIM images without artifacts, it is necessary to build better imaging algorithms. Excellent SIM-RA is necessary for reconstructing higher-resolution, faster, longer, and nondestructive SR-SIM images.
Feb. 02, 2021Vol. 48 Issue 3 0307001 (2021)
Peng Wu, Jingshu Ni, Haiou Hong, Xiaojing Li, Bei Yao, Haoran Zheng, Changyi Hua, Xia Wang, Yuanzhi Zhang, Yang Zhang, Yikun Wang, and Meili Dong
Objective Skin cholesterol is an important biomarker for early atherosclerosis screening. Atherosclerosis is the leading cause of disability and death from cardiovascular disease. Effective control of pathogenic factors in the early pathological stage may delay or prevent the development of asymptomatic atherosclerosis into cardiovascular diseases. Thus, skin cholesterol detection becomes relevant in the prevention of cardiovascular diseases. Traditional skin cholesterol detection methods, such as skin biopsy or tape stripping, are invasive and usually time consuming. Alternatively, the recent three-drop method is being widely studied. In this method, three specific concentrations of reagents that bind to skin cholesterol are used on the skin surface of a subject, and atherosclerosis can be diagnosed by analyzing the reagent color changes. However, the three-drop method is sensitive to the application habits of the operator. Moreover, the detection reagents contain enzymes, polymers, and small molecule compounds, hindering quality control and increasing the sensitivity to environmental factors such as temperature and pH levels. We report a non-invasive skin cholesterol detection technique based on fluorescent spectrometry. By measuring the fluorescence spectrum of fluorescent-labeled skin, the cholesterol content can be calculated from the fluorescence spectra. This method corrects the influence of temperature on the test results and provides stability under various environmental conditions. Moreover, the skin cholesterol content can be obtained within 4 minutes. The proposed method provides a rapid non-invasive and stable method for skin cholesterol detection and corresponding applications including early atherosclerosis screening.Methods The proposed non-invasive skin cholesterol detection system is composed of a light source, fiber probe, spectrometer, photodiode, infrared temperature sensor, and computer. The fluorescence fluctuation of the detection reagent caused by temperature variation is corrected by establishing the relation between temperature and the fluorescence intensity of the detection reagent. To confirm the accuracy of the proposed skin cholesterol detection system, we extract skin cholesterol with absolute ethanol after the non-invasive measurement. The cholesterol content in the extraction liquid is determined by gas chromatography, and the correlation between the two results are analyzed. Finally, the clinical applicability of the proposed system is confirmed by measuring skin cholesterol content from both healthy subjects and subjects with high risk of presenting atherosclerosis.Results and Discussions The schematic of the proposed non-invasive skin cholesterol detection system based on fluorescent spectrometry is shown in Fig. 1. The system accurately detects skin cholesterol content after correcting for temperature. The average fluorescence intensity of the detection reagent in the 462--520 nm wavelength band decreases with increasing temperature, resulting in a significant negative correlation between fluorescence intensity and temperature (r=-0.995, pp=0.0004) (Fig. 7). The proposed non-invasive skin cholesterol detection system can screen subjects with high risk of presenting atherosclerosis. Nevertheless, clinical trials are required for verification given the small sample size used in this study.Conclusions We propose a rapid non-invasive detection system for skin cholesterol based on fluorescent spectrometry. The system quickly provides the skin cholesterol content on-site from the fluorescence spectrum of detection reagents that specifically bind to skin cholesterol. The proposed system performs temperature correction to prevent deviations of the measurement results and improve accuracy and stability. The system and its detection accuracy are verified through comparisons with skin cholesterol results obtained from gas chromatography. The proposed system may be used to screen people with high risk of presenting atherosclerosis by detecting skin cholesterol content in healthy subjects and subjects at high risk. Overall, the proposed system can detect skin cholesterol accurately, non-invasively, and quickly. We expect that the widespread adoption of this technology will contribute to the prevention and control of cardiovascular diseases.
Feb. 01, 2021Vol. 48 Issue 3 0307002 (2021)
Zhongyao Wang, Tiantian Zhang, and Weihua Shi
Objective At present, a supercontinuum (SC) has characteristics of wide spectrum, high brightness, and high coherence, and thus it can be widely used in spectroscopy, biomedicine, environmental detection, and other fields. In recent years, the spectral range of SC has covered infrared, ultraviolet, and visible bands. Due to the controllability of the spectral width, the tunable SC has a wider spectrum and an adjustable spectral range, and can be applied in many areas. However, most of the SC studies in current papers are tuning SC range by changing pump source parameters. In addition, the SC tuning range mentioned in some papers is relatively small. Based on the above information, a method for generating tunable SC is proposed in a suspended core fiber with a highly nonlinear arsenic trisulfide (As2Se3) core and a toluene-filled cladding layer, which is highly sensitive to temperature. In the suspended core fiber, the linear and nonlinear refractive indexes and change in nonlinear coefficient are controlled by the thermal energy through the toluene-filled cladding layer, and a temperature-controlled tunable SC can be generated. Under conditions of unchanged pumping parameters, the spectral width of the SC at different temperatures can be changed by controlling the temperature, and a controllable and tuned SC can be obtained.Methods The dispersion and nonlinear characteristics of the proposed optical fiber were simulated by the full vector finite element method combined with COMSOL Multiphysics software. The generalized nonlinear Schrodinger equation and the split-step Fourier algorithm were used to simulate the optical pulse transmission process in the optical fiber. As2Se3 was selected as the base material of the optical fiber, and the toluene-filled cladding was filled in the air holes of the optical fiber. The refractive index of the toluene solution changed with temperature, where the maximum difference of refractive index could be 0.105 at the critical temperature range of the toluene solution from -90 ℃ to 110 ℃. To obtain the maximum spectral range of SC, simulations of the dispersion and nonlinear characteristics in the optical fiber and spectral range of SC at the critical temperature of the toluene solution had been completed. In addition, the concept of spectral flatness (SFM) was introduced to quantitatively analyze the SC. Considering the spectral flatness and tunable spectrum range of SC, the structural parameters and pumping conditions were optimized.Results and Discussions This paper primarily studies SC tunability. First, the tunable range of the SC spectrum is discussed when the fiber core diameters are 2, 3, 4, and 5μm at the critical temperatures of toluene. It can be seen that when the core diameter is 3μm, the tunable spectral width is the largest (Fig. 3). Then the tunable range of the SC is discussed when the initial pulses are 280, 300, 320, and 340fs. It can be seen that when the initial pulse width is 300fs, the tunable spectral width is the largest (Fig. 4). Finally, the tunable range of the SC spectrum is discussed when the pump peak powers are 18, 20, 22, and 24 kW. It is found that the tunable spectral width is the largest when the peak power is 20kW (Fig. 5). By analyzing the tunability of the SC and the flatness of the spectrum, the results show that: at the critical temperatures of -90 ℃ and 110 ℃, when the core diameter is 3μm and the pulse width is 300fs, the tunable spectral width is the largest, which is 1.20μm. In the end, tunability changes at -90, -40, 10, and 110 ℃ are discussed. The tunable spectral width increases with the increasing temperature until it reaches a critical temperature (Fig. 6). It can be seen that continuous tunability of the spectral range can be realized in the proposed suspended core fiber.Conclusions A method for generating a tunable SC is proposed in the suspended core fiber with a highly nonlinear As2Se3 core and a toluene-filled cladding layer filled a highly temperature sensitive material. The fiber has high nonlinearity, and the cladding refractive index is relatively sensitive to temperature. According to the optimization of the fiber structure and pumping parameters, we find that the tunable spectral width reaches 1.20μm under the critical conditions of -90 ℃ and 110 ℃ when the fiber core diameter is 3μm, the center wavelength of the pump pulse is 3.1μm, the peak power is 20kW, and the pulse width is 300fs. As the spectral width increases, SFM slightly decreases. SFM is between 0.89 and 0.92, indicating that SC remains flat. The generated tunable SC has certain research significance and advantages in the fields of material detection, spectroscopy, and environmental analysis.
Feb. 01, 2021Vol. 48 Issue 3 0306001 (2021)
Xue Liu, Heming Chen, and Yuchen Hu
Objective With the advent of 5G communication, the demands for communication systems with increased capacity and speed are growing rapidly. Unit-device technology has basically matured, and the only way to break through the bottleneck of information systems to achieve high-speed, low power consumption, and small size is to use silicon-based optoelectronic integration. Various structures have been proposed for electro-optical modulators and wavelength-division multiplexers, and research on these two types of individual devices has become increasingly mature. However, there have been few studies which integrate the two devices in a single device to achieve multiple functions. Because silicon-based optoelectronic integration has the characteristics of low packaging cost, small size, and high integration, we propose here an on-chip integrated device for electro-optic modulation and coarse wavelength-division multiplexing. Integrating these two functions on the same silicon-based photonic-crystal plate yields a device with the desirable characteristics of small size, low insertion loss, small modulation voltage, large modulation depth, and low channel crosstalk. We therefore anticipate that this integrated-device study will be helpful for the rapid development of information technology in the near future.Methods The integrated device described in this paper consists of two modules, a photonic-crystal electro-optic modulator and a coarse wavelength-division multiplexer. The integrated device is a photonic crystal with a heterogeneous structure, which achieves “on” and “off” state modulation of different wavelengths in the electro-optical modulation module, and the download function for the different wavelengths is provided by the coarse wavelength-division multiplexing module. This article is based on a simulation analysis using the FDTD and DEVICE modules in the commercial optical-simulation software Lumerical. First, an L3 resonant cavity and PN junction employ plasma dispersion to modulate the wavelength of the input signal. Then, using direct coupling between the microcavity and waveguide, the device utilizes the L3 resonant-cavity structure to obtain coarse wavelength-division multiplexing, and complete the design of the coarse wavelength division multiplexing module. Finally, the two modules are cascaded together, and the modulated input port and the wavelength-division-multiplexing output port utilize tapered waveguides to reduce the impact of mode mismatch between the photonic-crystal plate and the nanowire waveguide. Cascading the two modules shifts the resonant wavelength of the L3 cavity, so it is fine-tuned to complete the electro-optic modulation and coarse wavelength-division multiplexing at 1530 nm and 1550 nm design wavelengths.Results and Discussions The integrated device has excellent performance, and the modulation voltage is small. When the modulation voltage is 1.505 V, the change in electron concentration reaches ΔNe=6.31×10 18cm3, and the change in hole concentration reaches ΔNh=7.94×10 18cm3 (Fig. 6), which modulates the wavelength (Fig. 7). According to the simulation, the transmittances of the integrated device at 1530 nm and 1550 nm in the “on” state are respectively 85.10% and 80.38%, while the corresponding transmittances in the “off” state are 0.68% and 0.5%, respectively. We calculate that the total insertion loss is less than 0.95 dB, the extinction ratio is greater than 20 dB, the modulation depths D are both 0.99, and the channel crosstalk values are all less than -27.59 dB (Table 1), which indicates good device performance for both modulation and wavelength division. Conclusions This paper presents an on-chip integrated device for electro-optical modulation and coarse wavelength-division multiplexing. The L3 resonant cavity of the photonic crystal and the silicon-based photonic-crystal waveguide are coupled together, and the modulation and wavelength-division multiplexing functions are obtained by adjusting the width of the waveguide and the resonant cavity. The tapered structure of the input/output waveguide reduces the coupling loss and increases the transmittance. The simulation results show that the integrated device can complete the modulation and multiplexing of two wavelengths. Compared with previous research results, this is no longer a single-function device. The insertion loss of the device at the working wavelengths of 1530 nm and 1550 nm is 0.70 dB and 0.95 dB, respectively, the extinction ratios are 20.97 dB and 22.05 dB, the modulation depths are both 0.99, the channel crosstalk is -29.05 dB and -27.59 dB, and the device size is only 17.83 μm×17.3 μm×0.22 μm. The compact structure of the modulator makes it easy to integrate into applications for high-speed optical-communication systems. We therefore believe that this device has huge application potential for the development of integrated optical devices and high-speed large-capacity communication systems.
Feb. 01, 2021Vol. 48 Issue 3 0306002 (2021)
Kaihua Liu, Shudan Yan, and Xiaolin Gong
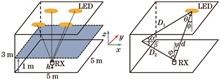
Objective With increasing demand for indoor localization services, indoor positioning technologies have gradually become a research hotspot. Visible light is harmless to the human body and can not interfere with electronic devices. In addition, the visible light signal is less affected by multi-path reflection; thus, it can be used as an information carrier for an indoor positioning system. Therefore, visible light has become an important indoor positioning technology. LED lights are often used in indoor positioning research due to their advantages, such as high cost performance, high broadband, long life. Model building of machine learning-based indoor visible light positioning currently relies on the photodiode and the number of fingerprints. To reduce the complexity of fingerprint acquisition and increase positioning accuracy, an indoor three-dimensional visible light positioning algorithm based on sparse reconstruction of fingerprint matrixes is proposed, and a localization algorithm with boundary correction is introduced. The proposed algorithm can effectively reduce the sampling rate of fingerprints and improve the global positioning speed and precision. We hope that our concepts and algorithms will facilitate the design of fingerprint acquisition and understanding of the relationship between singular value decomposition and fingerprint reconstruction.Methods First, the proposed algorithm uses extreme learning machine to train sparse sampling nodes and is applied to learn the nonlinear mapping relationships between the received signal strength and location at the receiving end, which only considers the line-of-sight propagation and first-order reflection of visible light. In addition, singular value decomposition and the alternating direction multiplier method are combined to solve the reconstruction problem of sparse fingerprint matrixes, and we get the good sparse samples from the 64 sampling nodes through multiple simulation selection of samples. Second, due to the impact of multi-path reflection of visible light and other factors, the boundary positioning error of the positioning area is greater than the internal positioning error. A localization algorithm with boundary correction is introduced. This algorithm improves the extreme learning machine training weight of the positioning regional boundary by adding virtual boundary nodes to increase the number of fingerprints, reduce the generalization error of boundary targets, and reduce boundary positioning error significantly.Results and Discussions At heights of 0 m, 0.3 m, 0.6 m, and 0.9 m, the average positioning error of less than 7 cm can be obtained. As the height of positioning targets increases, which leads to increased multi-path reflection gain of visible light, the boundary positioning error and overall positioning error increases (Fig. 4). It is observed that using 48 or 56 sparse samples for positioning provides good performance with sparse reconstruction. Here, the average positioning error is 2.74 cm with 48 sparse samples and 1.88 cm under 56 sparse samples by adding four virtual nodes (Fig. 7). By adding eight virtual nodes, the average positioning error is 1.59 cm with 48 sparse samples and 1.2 cm with 56 sparse samples (Fig. 8). The extreme learning machine has better positioning effect than the k-nearest neighbor, backpropagation, random forest algorithms (Fig. 10). The proposed algorithm has the shortest positioning time and lowest positioning error. The average positioning time is 0.0205 s, the average positioning error is 1.593 cm, and the average minimum error is 0.243 cm (Table 2). It is found that 48 and 56 sparse samples demonstrate good performance with sparse reconstruction, and the average positioning error is 7.29 cm with 48 sparse samples and 3.3 cm with 56 sparse samples (Fig. 13). By introducing the localization algorithm with boundary correction into an experimental scene with 48 and 56 sparse samples, we conclude that the proposed algorithm works well relative to reducing the positioning error and number of fingerprints. By adding eight virtual nodes, the average positioning error is 2.95 cm with 48 sparse samples and 2.49 cm with 56 sparse samples (Fig. 14).Conclusions An indoor three-dimensional visible light localization algorithm based on sparse reconstruction of fingerprint matrixes is proposed. The proposed algorithm reduces the number of fingerprints required by traditional machine learning training significantly and improves the average positioning error and positioning speed compared to the KNN, BP, RF, and ELM algorithms. In addition, a localization algorithm with boundary correction is introduced to reduce the boundary positioning error of the positioning area. The simulation results demonstrate that the proposed algorithm has an average positioning time of 0.0205 s, average positioning error of 1.593 cm, and average minimum positioning error of 0.243 cm. With 48 samples, the experimental results demonstrate that the average positioning error is 2.95 cm, and the minimum average positioning error is 0.22 cm. With 64 sparse training nodes, the number of fingerprints can be reduced further using the singular value algorithm, and the global positioning speed and precision can be improved. Simulation and experimental results demonstrate that the proposed algorithm has better localization speed and accuracy while reducing the number of fingerprints compared to traditional machine learning algorithms.
Feb. 01, 2021Vol. 48 Issue 3 0306003 (2021)
Shiwu Xu, Yi Wu, and Xufang Wang
Objective Over the past few years, the large-scale popularization of smart terminal devices has introduced a wide range of services, including indoor positioning. Indoor positioning systems that are based on visible light communication have four advantages over indoor positioning systems that are based on radio-frequency communication technology: 1) Centimeter-level positioning accuracy can be achieved; 2) They have high bandwidth and support high-speed data transmission; 3) There is no electromagnetic wave radiation, so they can be used directly in gas stations, operating rooms, and other places where electromagnetic radiation is prohibited; 4) They use mainly line-of-sight communication. Because of these advantages, indoor positioning based on visible light communication has gradually become a research hotspot. Currently, fingerprint positioning based on compressed sensing has two problems: 1) Using the linear least squares method to reconstruct the signal can easily fall into the local optimal solution, resulting in large positioning errors; 2) Large observation values are required to improve the accuracy of reconstructed signals, that is, a high-density light emitting diode (LED) layout is required. To solve the two abovementioned problems, a visible light positioning algorithm based on particle swarm optimization compressed sensing (PSO-CS) is proposed that aims to provide a high-precision positioning method under low-density LED layout.Methods The research methods for visible light positioning propose in this paper are mainly based on compressed sensing and particle swarm optimization. First, based on the reconstructed and measured received signal strength (RSS) values, a fitness function based on the matched RSS residual is established. Second, based on the sparsity of the location fingerprints, the problem of solving the weight of fingerprint positioning is transformed into the problem of reconstructing the sparse matrix. Third, based on the inner product of the measurement matrix and the observation vector, the energy of the inner product is arranged from high to low to obtain the four fingerprint points with the highest energy value. Finally, combined with particle swarm optimization, the weight vector of four fingerprint points close to the target is reconstructed and the coordinates of the target are calculated.Results and Discussion The simulation results show that the average positioning error of the PSO-CS algorithm is significantly lower than that of K-nearest neighbor (KNN), extreme learning machine (ELM), random forests (RF), artificial neural network (ANN), weighted K-nearest neighbor (WKNN), orthogonal matching pursuit (OMP), reweighted l1-norm minimization (RWl1M), and basis pursuit (BP) algorithms. In the low signal-to-noise ratio (SNR) range (5 dB-20 dB), even if the grid spacing is 50 cm, the average positioning error of the PSO-CS algorithm is still better than that of the Newton-Raphson (NR) and linear least square (LLS) positioning algorithms (Fig. 3). When the SNR is between 10 dB and 20 dB, the cumulative distribution of positioning errors made by the PSO-CS algorithm is significantly better than that of the other 10 algorithms (Fig. 4). Even in the low-density LED layout, the average positioning error based on the PSO-CS algorithm is still low (Fig. 8). The PSO-CS algorithm has good robustness. Even if the grid spacing is 50 cm and the fingerprint sampling rate is only 50%, the average positioning error curve fluctuation is still small, even after execution is repeated 50 times. When the SNR is 10 dB, the variance is 2.54 cm, and when the SNR is 20 dB, the variance is 1.38 cm. The variance in both cases is very small (Fig. 9 and Fig. 10). When the grid spacing is 50 cm and the SNR is 10 dB, compared with KNN, ELM, RF, ANN, WKNN, OMP, RWl1M, BP, NR, and LLS algorithms, the average positioning errors of PSO-CS algorithm are reduced by 75.88%, 89.15%, 85.44%, 90.25%, 58.05%, 80.82%, 86.29%, 80.01%, 73.57%, and 76.56%, respectively (Table 2). When its positioning accuracy is similar to that of the PSO-CS algorithm, the WKNN algorithm requires 34.3 times more fingerprints than the PSO-CS algorithm, and WKNN’s average calculation time is 2.5 times higher than PSO-CS’s (Table 3).Conclusion In this paper, a novel particle swarm optimization compressed sensing algorithm is proposed and successfully applied to visible light positioning based on location fingerprints. Because only four neighbor fingerprints are required to participate in positioning, the dimension value of the swarm search is 4. The weight value of the fingerprint points is between 0 and 1; that is, the search space of the swarm is between 0 and 1. The dimensions and space are very small, so the time complexity of the proposed algorithm is low. This allows it to meet real-time positioning requirements. The simulation results show that even in the low signal-to-noise ratio and low-density LED layout, the average positioning error of the proposed algorithm is still low, and it remains significantly lower than that of similar algorithms. This paper also analyzes the influence of grid spacing, swarm size, sparsity, number of LEDs, and fingerprint sampling rate on positioning errors in the PSO-CS algorithm. The results obtained can provide a useful reference for the design of a practical visible light positioning system.
Feb. 01, 2021Vol. 48 Issue 3 0306004 (2021)
Jiawen Wu, and Shiyong Wang
Objective Target detection is an active research field of computer vision and forms the basis of applications such as video surveillance and live streaming. Numerous algorithms are used in target detection including traditional methods such as optical flow, frame difference, background modeling, and deep learning, the latter of which has developed rapidly in recent years. However, with the exception of background modeling, most of these algorithms are limited by factors such as budget constraints as well as low processor performance, real-time capability, and accuracy. Thus, background modeling is widely used in real applications. This method also has limitations, however. For example, background modeling will lead to poor video quality and texture and a lot of noise when processing grayscale images such as infrared video. In the present study, we address these limitations by proposing a novel statistical-based adaptive background modeling algorithm that shows high accuracy and an improved recall rate.Methods We build a grayscale histogram for each pixel in an 8-bit grayscale video and update it on each frame. Then, we estimate the true background from the histogram mode and obtain the noise threshold by using an improved three-frame difference method. From the results, we divide each frame into two regions: a static region and a dynamic region. For the static region, we simply apply single Gaussian modeling to the obtained noise threshold to determine the foreground. For the dynamic region, we utilize an algorithm based on kernel density estimation (KDE) for the detection. Moreover, we resolve the illumination shift and shadow by calculating the grayscale difference between the background and the input frame.Results and Discussions In the proposed algorithm, a period of 13 ms is required to handle one frame with 320 pixel×240 pixel on an i7-7700HQ platform, which fits the real-time requirement. To prove the high performance of the proposed algorithm, we compare the results of other traditional background modeling algorithms including CodeBook (CB), ViBe, KDE, the Gaussian mixture model (GMM), and the pixel-based adaptive segmenter (PBAS) on public test dataset CDnet2014 (Fig. 8) with the infrared dataset obtained in the present study (Fig. 9). These datasets contain various scenes including mall, highway, avenue, office, river, infrared park, and infrared sea. Target detection under these scenes faces several common challenges such as shadow, static target, complex background, dynamic background, and low-quality images. The results (Table 1) show some of the advantages of the proposed algorithm. In particular, (1) the new algorithm shows the highest recall rate, at 90% in most scenes, which efficiently ensures the integrity of the target. (2) In the mall and office scenes, the previous algorithms except for CB absorb the static foreground into the background. (3) In the river scene, a slow, large, and homogeneous color foreground caused by a canoe led KDE, PBAS, and ViBe to incorrectly consider the front part of the canoe as the background, thus causing incomplete detection of the back part. (4) In the mall and avenue scenes, abundant shadows are present that interfere with the detection result. The proposed algorithm not only preserves the intact foreground but also eliminates the shadow to some extent. (5) Numerous dynamic background areas are present in the highway and river scenes that result in huge amounts false positives. The proposed algorithm effectively decreases the false alarm rate. (6) In the office scene, foreground motion causes the camera exposure to adjust several few times. At the moment of exposure adjustment, CB and PBAS are unable to rapidly adapt to the new illumination, which causes false positives that last for long periods. (7) The images in the infrared park and infrared sea scenes are low in contrast, resulting in extremely poor image quality. Only the proposed algorithm can effectively distinguish the foreground from background. The maximum recall rate of the previous method is 0.671, and the false positives are abundant; that of the proposed algorithm is 0.900, and the false alarm rate is significantly decreased. All these results show that proposed algorithm can significantly increase the detection recall rate and integrity of the target with a low false alarm rate and considerably rapid processing speed.Conclusions According to the experiment results, the proposed algorithm adopts various detection strategies for dynamic and static regions and combines the advantages of various algorithms to significantly improve the recall rate of target detection in grayscale video. Moreover, it can also detect targets with complex motion pattern with no prior knowledge, which makes this method highly robust in many applications. This robustness results in an overall better index compared with that in common background modeling algorithms. Further, the proposed algorithm can effectively enhance the target detection performance in monochromatic and infrared video. However, its shadow elimination is inadequate, and the accuracy of some scenes requires further optimization.
Feb. 08, 2021Vol. 48 Issue 3 0309001 (2021)
Lin Jiang, Jun Liu, Xiaorong Yuan, Hao Zhang, Chunling Li, and Guangming Cai
Objective Thin-disk lasers have become one of the main research targets in the high-power solid laser technology, owing to their short thermal conduction distance, which in turn causes a significant reduction in the thermal lensing effect. However, with the increase of pump caliber and pump power, the distorted wavefront caused by the increasingly serious thermal effect becomes one of the important factors restricting the output power and beam quality of laser. In this study, a new central radiative cooling structure is proposed. This structure satisfies the cooling requirements of thin-disk gain media and effectively reduces the thermal teratogenesis of gain media under a high-power loading. We hope that our basic strategy and findings can provide new approaches and ideas to achieve highly efficient cooling and distorted wavefront control of high-power thin-disk gain media.Methods The thermal teratogenicity of a large thin-disk gain medium is considerably large. To overcome this drawback, the technical route of microchannel composite jet impingement based on nonuniform cooling was proposed. Based on the technical route, the design of the central radiative structure cooler was created. In the central region of the heat transfer, jet impingement reduced the thickness of the boundary layer to enhance heat transfer and reduce the central temperature and thermal teratogenicity of the gain medium through “peak-clipping”. The peripheral heat transfer runner was designed as a microchannel with a central radiative structure to guarantee the circumferential uniform distribution of flow field and realize the circumferential uniform cooling. Moreover, the effect of the different structure parameters on heat transfer performance and stress distortion in the gain medium was analyzed via the fluid-solid thermal coupling simulation. The performance comparison between the central radiative structure cooler and the microchannel cooler was completed through simulation and experiment.Results and Discussions The performances of the central radiative structure cooler and the original microchannel cooler are compared through simulation and experiment, respectively. The simulation results reveal that the heat transfer performance of the central radiative structure cooler is slightly better than that of the conventional microchannel cooler. Moreover, the surface temperature distribution of the gain medium with the central radiative structure cooler exhibits better circumfluence uniformity (Fig. 7 and Fig. 10). The axial deformation of the extraction region of gain medium surface with the microchannel cooler is 4.3μm. Additionally, the deformation distribution is asymmetric, which makes it easy to generate high-order asymmetric aberrations (Fig. 10). The axial deformation of the extraction region of the gain medium surface with the central radiative structure cooler is 1.2μm, and the circumferential uniformity is found to be better (Fig. 7). The experimental results reveal that the wavefront distortion of gain medium with the original cooler reaches 3.27 λ under a full-power loading, whereas that of the gain medium with the central radiative structure cooler is reduced by more than 50% to 1.6λ (Fig. 12 and Fig. 13).Conclusions Based on the idea of nonuniform cooling, the intensification of heat dissipation in the central region of the thin-disk gain medium can realize the effective control of thermally induced wavefront distortion. The cooler adopts the central radiative structure to realize the central symmetric distribution of temperature field and strain field of gain medium, avoid the generation of high-order asymmetric aberrations, and greatly reduce the difficulty in wavefront distortion correction of gain medium. The heat transfer performance of the microchannel cooler with a central radiative structure is slightly better than that of the conventional microchannel cooler. This can effectively reduce the peak temperature in the central high-temperature region of the cooled gain medium.
Feb. 01, 2021Vol. 48 Issue 3 0301001 (2021)
Ji Zhang, Shanshan Wei, Haowei Liu, Yuanhuang Liu, Bo Yao, and Qinghe Mao
Objective In recent years, single-frequency lasers have been widely used in the fields of fiber communication, lidar, and fiber sensors due to their narrow linewidth and good stability. However, in high-precision applications, such as precise spectral measurement, gravitational-wave detection, and high-precision frequency transfer, noise characteristics are also important parameters and worth further optimization. High-precision measurement of single-frequency laser noise is the basis of laser noise analysis. So far, the current noise measurement method usually evaluates noise performance in a specific frequency band and hence it becomes difficult to cover the whole mHz to MHz frequency range. To realize broadband noise measurement, it is necessary to adopt segmented measurement schemes and use spectrum splicing techniques. However, there is still a lack of standard measurement schemes for obtaining the broadband noise spectrum. In this paper, a standard measurement technique for mHz to MHz broadband laser noise is reported.Methods Among the various methods of frequency noise measurement, the optical heterodyne beat-frequency method is suitable for measuring low frequency noise, but the maximum measurement range is limited, and the correlation delay self-heterodyne measurement technique based on a fiber-type interferometer is quite suitable for high-frequency noise measurements above 1Hz. Therefore, a correlation delay self-heterodyne measurement system based on a fiber-type Michelson interferometer [Fig. 1(a)] is designed and developed for measuring high-frequency noise by suppressing environmental noise through passive control techniques such as sound insulation, vibration isolation, and temperature control, where the 10Hz--1MHz spectral range can be successfully measured. The optical heterodyne beat-frequency method [Fig. 1(b)] is used to measure low frequency noise by the beating of two self-developed DBR fiber lasers with similar performance, where a reference laser with calibrated frequency noise can be obtained. The laser to be tested is beating against the reference laser to achieve frequency noise measurements in the low frequency range of 1 mHz--100Hz. By using the direct average method, the spectra measured by these two methods can be spliced together smoothly, and the frequency noise measurement in the frequency range of 1 mHz--1 MHz can be ultimately realized.For measuring relative intensity noise, the direct measurement method based on the electric spectrum analyzer is used in the high-frequency range, and the digital measurement method based on the digital multimeter and FFT analyzer is used for frequencies lower than 10kHz. Combining these two noise measurement techniques and using the gradual in and out spectrum splicing method, the relative intensity noise spectrum in the frequency range of 1 mHz--50MHz is obtained.Results and Discussions Using the measurement schemes mentioned above, we evaluate the noise spectral characteristics of a single-frequency DBR fiber laser from NP photonics. We measure the frequency noise spectra with the developed correlation delay self-heterodyne method (Fig. 2) and beat frequency method (Fig. 3), respectively. And we measure the RIN spectra by the ESA [Fig. 5(a)] and FFT analyzer [Fig. 5(b)]. The measurement results are compared with the data provided by the supplier and the results reported in the related literature. At the same time, through mutual verification between different schemes, the reliability and accuracy of our measurement systems are verified. The frequency noise spectra (Fig. 4) and RIN spectra (Fig. 6) in the frequency range of mHz to MHz after spectrum splicing are obtained. It can be seen that the overlapping area in the spectrum shows a smooth curve without splicing traces. In addition, we also evaluate the broadband noise characteristics of our self-developed 1064 nm and 1560 nm single-frequency DBR fiber lasers. Compared with a commercial NP laser, our self-developed 1560 nm single-frequency DBR fiber laser shows better noise performance over a wide frequency range.Conclusions A standard technique for measuring single-frequency laser frequency and intensity noise in an ultra-wide Fourier-frequency range from mHz to MHz is presented in this paper. We successfully measure both the frequency noise and intensity noise spectral characteristics of single-frequency lasers in a Fourier-frequency range of mHz to MHz, using two established measurement systems in conjunction, namely, a correlation delay self-heterodyne frequency noise measurement system based on a fiber-type Michelson interferometer and an optical heterodyne beat-note measurement system with calibration function, combined with common analysis instrument. The accuracy of our measurement results has been verified. This presented method may be used for laser noise evaluation in various applications such as gravitational-wave detection and precision measurement.
Feb. 01, 2021Vol. 48 Issue 3 0301002 (2021)
Haichao Zhao, Yulin Qiao, Xian Du, Sijie Wang, Qing Zhang, and Yan Zang
Objective A paint layer can be applied to metals to enhance their surface characteristics. However, in many cases, paint often needs to be removed from the metal surface because of its potential damage to the environment. Paint removal using laser provides several advantages over the conventional techniques such as mechanical or chemical cleaning. Specifically, an accurate removal area, minimal detrimental effects to the substrate, reduction in contaminated waste, and fast cleaning rate are the key favorable factors in paint removal using laser. Several studies have been published in the literature that dealt with the effect of different process parameters for paint removal including the change of the temperature. Other processes that affect the relationship between the laser beam and paint have not been determined. In the present study, we report a novel type of research methods to understand the detailed micro process of paint removal, such as the plasma effect near the paint surface and the microscopic destruction process in the paint. We expect that our basic strategy and findings can help in understanding the characteristics and mechanisms of paint removal.Methods In this work, 2024 aluminum alloy and polyacrylate resin-based paint were employed. A laser paint-cleaning test was carried out using pulsed laser with a wavelength of 1064nm and a pulse width of 1μs. In the experiment, the focal spot diameter of the Gaussian beam was approximately 78μm. The whole apparatus was completely automatic, that is, a computer controlled the laser power, repetition rate, and scanning speed. The cleaning residues were deposited on a silicon wafer, which was located 17 mm from the surface of the sample, as shown in Fig.1. The effects of scanning speed, pulse frequency, and laser power on the laser-cleaning quality were investigated. According to the morphology and element-valence changes in the cleaned surface and by combining the morphology of the cross section of the paint and particles generated during the cleaning process, the underlying process and mechanisms of the paint removal using pulsed laser were thoroughly investigated. Simultaneously, the temperature and stress-field distributions of the finite-element simulation using COMSOL Multiphysics software were also used for the auxiliary analysis.Results and Discussions The paint in the experiments could be removed using pulsed laser. The laser-cleaning quality first increased and then decreased (Fig.3, Fig.4) and the surface roughness first decreased and then increased (Table 2, Table 3) with the increase in the scanning speed and pulse frequency. Furthermore, the laser-cleaning quality increased (Fig.5) and the surface roughness first decreased and then increased (Table.4) when the laser power increased. The morphologies and elements of the cleaned-surface study illustrate that the laser plasma and thermal combustion were affected by the absorption of laser energy by the paint during the laser-cleaning process (Fig.6). In addition, the X-ray photoelectron spectroscopy analysis indicates that C—H, C—C, O—H, C=O, C—O, and other covalent bonds in the polymer molecular chain of the paint were broken under the action of the pulsed laser (Fig.7). During the cleaning process, a layered structure was formed in the paint. Obvious cracks appeared that were parallel to the surface of the paint at the fracture section, which extended inside the paint. This result indicates the presence of a mechanical effect perpendicular to the surface of the paint. The cohesion of the lacquer was destroyed, which damaged the paint between the layers, and the paint layer was ejected (Fig.8). The study of the collected particles illustrates that the presence of mechanical mechanisms in the paint-damage process, such as vibration and impact, and the vaporized paint nucleated and grew in the high-energy limited area formed by the pulsed laser, which resulted in the formation of nanoparticles (Fig.9).Conclusions In the present study, three different process parameters, namely, scanning speed, pulse frequency, and laser power, influence the laser paint-cleaning quality at different levels. The laser-cleaning quality first increases and then decreases with the increase in the scanning speed and pulse frequency and increases as the laser power increases. The laser-cleaning quality is good when the process parameters are as follows: laser power=16.5W, scanning speed=600mm/s, and pulse frequency=30kHz. Under different process parameters, the main mechanism of the laser paint removal is different. With regard to the analysis characterization, we conclude that the effect of the cohesive-failure and crack-propagation-fracture mechanisms is more efficient than the chemical bond-fracture combustion.
Feb. 23, 2021Vol. 48 Issue 3 0302001 (2021)
Zhenhua Li, Jibiao Shen, Huaiyang Li, Baoren Teng, and Jing Liu
Objective With its excellent thermal conductivity, copper is an ideal material for the critical complex cooling parts in the combustion chambers of aerospace engines. Increasingly, complex copper parts are being fabricated by selective laser melting, an additive manufacturing method that forms complex 3D parts and structures. However, bulk copper surfaces and spherical copper particles absorb less than 10% and 45% of 1064 nm laser energy, respectively. Melting the copper powder completely and fabricating sound copper parts without defects such as unmelted particles and holes are difficult tasks. Recently, we improved the laser absorptivity of copper powder by nano-TiC modification, and fabricated a sample with a density of 99.8% under a 1064 nm laser (340 W, 500 mm/s). Our modification technique provides a novel solution to the above problem.Methods The reflectivities of nano-TiC, unmodified pure copper powder, and copper powder modified with 0.2%(mass fraction) nano-TiC were measured under lasers of different wavelengths. Measurements were performed in a UV-3600 plus ultraviolet spectrophotometer. The morphologies of the powders and nano-TiC particles were observed by scanning electron microscopy with energy-dispersive X-ray spectroscopy. The unmodified and modified copper powders were subjected to selective laser melting in a metal 3D printer (EOS M290) operated with a 400 W and 1064 nm laser under the same scanning conditions (340 W, 500 mm/s). The relative densities of the samples were determined by the Archimedes method. Their morphologies and hardness values were analyzed by a Nikon optical microscope and a Brinell hardness tester, respectively. The thermal and electrical conductivities of the samples were measured by a laser thermal conductivity meter and a Hall effect tester, respectively.Results and Discussions The observation and analyses confirmed that: a) modifying the copper powder with 0.2% nano-TiC significantly reduced the reflectivity of copper to 1064 nm laser, and consequently increased the laser absorptivity from 22% to 53.7% (Fig. 4); b) the sample modified with the powder had a much higher relative density (99.8%) and significantly fewer defects than the sample fabricated from unmodified pure copper powder under the same conditions (340 W, 500 mm/s) (Fig. 5); c) modification with nano-TiC improved the Brinell hardness of the samples from 64.5 to 87.7 HB (Fig. 6); d) the modification improved the thermal and electrical conductivities of the samples from 120.8 W/(m·K) and 29.1% IACS, respectively, to 189.2 W/(m·K) and 42.1% IACS, respectively. The improved relative density fundamentally improved the performance of the samples.Conclusions The proposed modification increased the relative density of copper powder from 90.7% to 99.8% and improved its laser absorptivity from 22% to 53.7% under a 1064 nm laser (340 W, 500 mm/s). The high relative density correspondingly improved the Brinell hardness, thermal conductivity, and electrical conductivity of the modified sample. Modification by nano-TiC is a novel and effective technique for increasing the laser absorptivity of copper and fabricating high-density copper parts by selective laser melting under low-power laser scanning.
Feb. 23, 2021Vol. 48 Issue 3 0315001 (2021)
Qing Sun, Chong Ma, Yandong Lin, Yunpeng Zhang, and Tao Xu
Objective High-power lasers have important applications in industrial processing, military defense, scientific research, and other fields. With the development of laser technology in recent years, the output power level of lasers has been continuously improved. The accurate measurement of power is the basis of researches and applications of high-power lasers. Traditional high-power laser measurement mainly uses calorimetric methods. The device is large and heavy, and the surface of the absorption material is easily damaged by laser.Methods Although the photon has no static mass, it has momentum. When the laser is irradiated on the surface of the object, pressure will be generated. Using the light pressure effect, the laser power can be traced directly to the micro-nano force or micro-mass. Figure 1 is the principle diagram of the measuring device, which adopts the structural design of three mirrors, and the transmission direction of the laser remains unchanged after three reflections. One of the mirrors is installed on the weighing module, and the weighing module is placed horizontally in the same manner as the mass calibration.Results and Discusions Figure 2 shows the time response curve of the optical pressure measurement device. The laser emission time is set to 20 s, and the response time of the measurement device is only 3 s. A calorimetric laser power meter that has been accurately calibrated is placed behind the optical pressure measurement device for simultaneous measurement. The measurement results of the two methods are compared. The maximum relative deviation is less than 1%. Limited by the output power of the test light source, the upper limit of power measurement is only verified to 15 kW. In fact, the upper limit of power measurement of the device is only limited by the damage threshold of the laser mirror, so the upper limit of power measurement can reach 100 kW or even higher.Conclusions Based on the principle of light pressure, a set of high-power laser measurement devices is established, and the power measurement uncertainty is better than 2% (confidence factor k is 2). The light pressure method is compared with the calorimetric method in the power range of 0.6--15 kW, and the maximum relative deviation is less than 1%. At the same time, the measurement device has the advantages of fast response speed, high measurement accuracy, and online measurement.
Feb. 08, 2021Vol. 48 Issue 3 0315002 (2021)
He Chen, Feng Zhou, Chengmin Lei, Junhao Cai, and Shengping Chen
Objective Passively mode-locked fiber lasers have been widely studied because of their simple structure, low cost, and high reliability. All-fiber passively mode-locked fiber lasers have outstanding advantages in terms of stability, reliability, and packaging technology because of the absence of spatial optical components. Their output pulse energy and average power are generally low because of fiber nonlinearity and poor power tolerance ability of fiber devices. To improve their pulse energy and average power while ensuring strong anti-interference stability, we developed an all-fiber all-polarization-maintaining dumbbell-shaped, ytterbium (Yb)-doped mode-locked fiber laser based on the nonlinear optical loop mirror (NOLM) dumbbell-shaped structure. By introducing all-polarization-maintaining large-mode-area fiber, high-power fiber components, and optimized cavity, we realized an average power of 5.5 W and pulse energy of 0.68 μJ in rectangular dissipative soliton resonance mode-locking.Methods Figure 1(a) shows the laser structure, comprising an amplifier and two equivalent cavity mirrors composed of NOLMs. The NOLM1 on the left has a coupling ratio of 10∶90, and a nonreciprocal phase shifter (NRPS) with a phase shift of 3π/4 is inserted into the ring. The NOLM2 on the right has a coupling ratio of 50∶50, and a bandpass filter with a center wavelength of 1064 nm and a 3-dB bandwidth of 13 nm is connected to the ring. All the fibers in the cavity are single-mode, polarization-maintaining large-mode-area double-clad fibers with a core diameter and a numerical aperture of 10 μm and 0.08, respectively, which can reduce the nonlinear effects in the cavity. NOLM1 acts as an equivalent output cavity mirror and an equivalent saturable absorber, whereas the bandpass filter added in the NOLM2 stabilizes the laser center wavelength and dissipates soliton resonance. The insertion of NRPS can change the reflective NOLM's power-dependent reflectivity curve to achieve saturated absorption characteristics. A reasonable selection of NRPS phase shifts can also change the self-starting performance of NOLM-based mode-locked lasers.Results and Discussions When the pump power of the laser is low, it runs in continuous wave state. When the pump power increases to 2.1 W, the laser turns to a mode-locked state, and when it drops to 1.8 W, it goes to a continuous wave state. Figure 2 shows the output pulse's characteristics at 1.8-W pump power. Moreover, the pulse shape is approximately a flat-topped rectangle with steep edges, with pulse width of 156 ps, repetition frequency of 8.1 MHz, pulse energy of 13 nJ, and peak power of 84 W. When the pump power is increased, the pulse width and the output pulse energy increase linearly, and the pulse peak power and repetition frequency remain unchanged. Figure 3 shows the variations of the pulse waveforms, average power, pulse width, and peak power at different pump powers. When the pump power is increased from 1.8 to 22.7 W, the output pulse width linearly increases from 156 ps to 8.1 ns, the average laser output power from 106 mW to 5.5 W, and the corresponding pulse energy from 13 nJ to 0.68 μJ. Hence, it can be concluded that the laser is operating in the dissipative soliton resonance mode-locked state.Conclusions On the basis of an all-fiber, all-polarization-maintaining dumbbell-shaped, Yb-doped mode-locked fiber laser, we realized a high-power large-energy rectangular dissipative soliton resonance mode-locking. The pulse width can be adjusted from 156 ps to 8.1 ns. When the pump power reached 22.7 W, the average output power, pulse energy, and peak power increased to 5.5 W, 0.68 μJ, and 84 W, respectively. Benefiting from the all-polarization maintaining structure, we found that the laser exhibited excellent anti-interference stability. Compared with the previously reported maximum output power of all-fiber, Yb-doped mode-locked resonators, we achieved an increase of more than 100% in the average power and a significantly improved pulse energy.
Feb. 01, 2021Vol. 48 Issue 3 0315003 (2021)
Yu Liang, Yuanyuan Xu, Yang Zou, Shuangshuang Xue, Jingrong Liao, Wenyan Pan, and Yawei Wang
Objective The diffraction-limited phenomenon in optical imaging make the evanescent wave carrying high-order modes of the beam attenuate rapidly when it leaves the object surface, which results in low resolution and affects imaging quality. At the same time, the modulation mechanism from traditional optics makes an optical system highly integrated, which is still difficult. Owing to the miniaturization and flexible control of phase, amplitude, and polarization of the beam, metalenses have been widely used in a variety of highly compact and efficient devices. To overcome dispersion effect caused by the incident light with different frequencies passing through dielectric materials and to reduce the impact on the imaging effect of an optical system in the wideband spectrum, a metalens is designed herein, which achieves constant focus in the visible light band from 500nm to 550nm based on the titanium dioxide unit nanopillar. At the same time, to reduce the energy loss caused by the introduction of a polarizer in the traditional optical system, the achromatic metalens is introduced, which has also polarization-insensitive characteristics. The lens improves the imaging resolution of a multi-wavelength microscopy imaging system and has good applicability in the fields of digital cameras and optical instruments.Methods Based on the phase compensation theory, the transmission phase method and the particle swarm optimization algorithm are used in this paper to design an achromatic metalens, and the first and higher derivative terms of the incident light phase information can make the incident light with different wavelengths arrive at the same time. In the same focal plane, to achieve this goal, the unit structure that meets this condition is selected. Usually, the geometric phase method is used for designing with polarization sensitivity. To satisfy the polarization insensitivity of the metalens on the basis of achromatic aberration and ensure both linearly polarized light and circularly polarized light to be incident, square nanopillars are selected as functional units here. After the structure of the unit has been determined, the selection of the unit with different widths and the design of the arrangement mode are studied in order to achieve the effective control of the deflection of the incident light beam with different wavelengths and achieve the correction effect of chromatic aberration. The width and height of a square nanopillar as well as the distance between the centers of adjacent nanopillars are optimized. The cross-sectional area of the square ranges from 0 to 1 to maximize the filling factor range and ensures that the polarization is not sensitive. The height of the square unit pillar is set as 600nm to improve phase coverage. In actual manufacturing, due to the limited process level, the achievable shortest unit column width is 80nm and the maximum width is the center distance of adjacent nanopillars. The Nyquist sampling criterion is followed to ensure the integrity of the beam information and ensure that the efficiency impact is low. The particle swarm optimization algorithm is used to select a structure, which achieves the achromatic effect to match the ideal phase value at each pixel, and the titanium dioxide nanopillars are scanned using the CST Microwave Studio electromagnetic simulation software to obtain the final superstructure with different unit nanopillar widths corresponding to the phases required for lens arrangement. To excite guided-mode resonances with different dispersion, the period of the unit column should be greater than the bandwidth of all transmitted wavelengths and smaller than the wavelength of incident light in free space to suppress higher-order diffraction. Therefore, the period of the unit column is 400nm.Results and Discussions Due to the dispersion of optical materials, the obtained images have chromatic aberration. The use of polarizers in traditional optical systems causes energy loss, and the overall device energy utilization rate is low. At present, most of the designed metalenses with an achromatic function in visible light and near-infrared light have polarization sensitivity. Therefore, this paper presents the design of an achromatic polarization-insensitive metalens based on the titanium dioxide unit nanopillar. In addition, the selected basic unit column is scanned using the CST Microwave Studio electromagnetic simulation software to make phases of unit columns with different widths linearly propotortional to the incident light frequency (Fig. 3). At the same time, the particle swarm optimization algorithm is used to find the additional constant phase for adjusting the wavefront, and the optimal phase distribution is obtained, which is used for the metalens to achieve the achromatic effect. Compared with the phase distribution obtained without the particle swarm optimization algorithm, the obvious phase compensation improves the focusing efficiency without chromatic aberration (Fig. 4). By simulating the polarization-insensitive achromatic metalens designed in this paper, the achromatic effect is achieved at the focal length of 450nm for the incident light with 500--550 nm wavelength, and it is compared with that of a dispersive metalens with the same numerical aperture (Fig. 6). The CST Microwave Studio electromagnetic simulation software is used to simulate the intensity of the reflected beam by the metalens. It is observed that the intensity of the reflected beam in the xoy plane exceeds 90% (Fig. 7). To verify the polarization insensitivity of the selected functional unit, the polarization angle is set between 0 and 90° with 9° as the step sweep parameter under the incidence of linear polarized light of a single nanopillar. Under different polarization states, the same diffraction efficiency of the incident light at different angles of incidence remains constant, and the diffraction efficiency increases with the increase of the wavelength. Therefore, the metalens designed in this paper effectively realizes the achromatic and polarization-insensitive characteristics.Conclusions To summarize, this paper presents the use of titanium dioxide nanomaterials to design a reflective metalens under visible light. The chromatic aberration is successfully eliminated between 500nm and 550nm incident light, and the designed achromatic polarization-insensitive metalens is compared with a dispersive metalens with the same numerical aperture. It is a breakthrough in the limitation of traditional diffractive optics. To achieve achromatic effects, the achromatic polarization-insensitive metalens designed in this paper allows linearly polarized light and circularly polarized light with different chirality to be incident. Based on the design method of transmission phase theory and particle swarm optimization algorithm, this paper provides a reference for the field of metasurface device design, makes a contribution to the high integration of optical systems, and the designed achromatic polarization-insensitive metalens has a wide range of application in microscopic imaging and optical instruments.
Feb. 01, 2021Vol. 48 Issue 3 0303001 (2021)
Chu Chen, Kaining Ying, Nian Liu, Lunan Dai, Weiwei Kan, and Chenyin Ni
Objective The positioning and even imaging of small defects inside metal workpieces can avoid unqualified workpieces. Au ultrasound imaging technology is based on the property of ultrasound which can penetrate opaque objects to obtain images of target objects, and is widely used in various fields. Traditional ultrasonic imaging data is mostly obtained by using ultrasonic transducers, such as piezoelectric transducers and electromagnetic acoustic transducers, to excite and detect ultrasonic waves on the surface of the material. However, these ultrasonic detection technologies have limitations in specific environments. On the other hand, laser ultrasonic nondestructive testing technology (NDT&E) can provide possibilities to overcome the shortcomings of traditional ultrasonic testing methods. Traditional laser ultrasonic defect detection methods include A-scan, B-scan, C-scan, etc. Most of these methods cannot accurately determine the size and location of the defect. Apart from this, the synthetic aperture focusing technology (SAFT) is widely used in the field of ultrasound imaging due to its ability of imaging of small defects and high imaging contrast. Our research combines the laser ultrasonic NDT&E with SAFT algorithm, which can realize imaging of small defect when it is used as the traditional ultrasonic transducer, and can also bring the advantages of laser ultrasound. The propagation and interaction with defects of laser ultrasound in metallic samples are numerically simulated by Comsol Multiphysics and the PSM-SAFT algorithm is compiled and verified by experiments to be suitable for laser ultrasound. Results indicate that the algorithm can effectively detect and locate small defects, and the image reconstruction speed is faster than that of the time domain SAFT algorithm. It can provide faster real-time technical solutions for laser ultrasonic NDT&E.Methods The propagation mechanism of laser ultrasound in high-strength steel samples, as well as the interaction of the high-strength steel with circular through-hole defects, was numerically simulated by Comsol Multiphysics. The PSM-SAFT algorithm for laser ultrasound based on the principle of explosive reflection was then derived and adapted. Using the model data obtained by the finite element method, samples were imaged using longitudinal wave and shear wave signals, respectively. Then, the defect position error and signal-to-noise ratio were used for analyzing the imaging results of the two modes. Subsequently, in order to verify the applicability of the algorithm in actual application, an experimental device for laser excitation and Doppler-based vibrometer detection was built. PSM imaging was performed using one-dimensional scanning experimental data. Finally, different frequency ranges were selected by analyzing the center frequency of the selected acoustic waves, and the signal-to-noise ratio and imaging speed of the PSM imaging were compared.Results and Discussions In the finite element simulation, we compared the time domain B-scan results of simulated data with and without circular defects. It can be found that there are obvious defect reflection signals in the defective B-scan graph (Fig. 3). If a difference between the model data with and without circular defects is made, the reflected signal of defects can be highlighted (Fig. 4). Then shear wave and longitudinal wave were used to perform PSM imaging on all simulation data in the frequency range of 50kHz--20MHz (Fig. 6). By comparing the signal-to-noise ratio of images and the position error of the defect, it is concluded that the calculation result of the shear wave is better than that of longitudinal wave. In the experiment, by analyzing the frequency spectrum of the time domain signal, it can be obtained that the center frequency of the shear wave is about 10MHz. Therefore, nine different frequency ranges are selected for PSM imaging, and the signal-to-noise ratio and imaging time of each image are compared (Fig. 9). It can be found that when the frequency range is 3.1--16.9MHz (90 frequency components in total), the PSM imaging results are optimized (Fig. 10). In addition, after comparing the imaging time lengths of the time domain DAS-SAFT algorithm and the reported frequency domain PSM algorithm, it is concluded that by using the same model, the calculation time of the frequency domain PSM algorithm is only 1/535--1/180 of that of the frequency domain DAS algorithm.Conclusions In this paper, a frequency domain SAFT phase shift algorithm suitable for laser ultrasound is developed. In the process of PSM image reconstruction using experimental data, the broadband characteristics of laser-excited ultrasound are effectively used. By analyzing the center frequency of the acoustic wave mode used, a suitable frequency range is selected. This method not only avoids the influences of low-frequency noise and high-frequency noise, but also improves the signal-to-noise ratio of the image, and greatly reduces the consumed time for calculation. The results obtained by PSM algorithm for finite element simulation data and experimental data can accurately locate the defect position, which proves the feasibility of the algorithm in the field of laser ultrasound imaging.
Jan. 14, 2021Vol. 48 Issue 3 0304001 (2021)
Bin Zhang, Lihui Xiao, Junqing Hou, Wei Chen, Jieyu Jiang, and Yan He
Objective Combustion mechanism research and new burner design rely on the measurement and analysis of important parameters such as temperature, velocity, and composition of the combustion process. Combustion laser diagnostic technology provides the advantages of being nonintrusive and highly precise, providing both real-time results as well as high temporal and spatial resolutions. In recent decades, combustion diagnosis methods based on laser and optical technology have been developed vigorously. Combustion diagnosis has always emphasized the importance of scalar fields such as temperature, component concentration, density, and soot volume fraction to understand the combustion mechanism. However, with the emphasis on combustion dynamics in complex and rapidly evolving flow fields in the recent years, the demand for the measurement of transport characteristics such as velocity, vorticity, and diffusion is increasing. As two important parameters that reflect chemical reactions and flow field transport, velocity and temperature affect combustion mechanism and combustion dynamics. Therefore, simultaneous measurement and visualization of the two parameters become crucial to characterize and understand complex combustion.Methods Herein, a measurement technique coupled with deflection tomography and particle image velocimetry (PIV) is proposed to obtain the three-dimensional (3D) temperature and velocity fields of swirling combustion. PIV overcomes the limitation of single-point velocity measurement and enables two-dimensional (2D) or even 3D velocity field measurements. PIV records velocity distributions from numerous spatial points under certain transient conditions and provides abundant flow field spatial structures and flow characteristics. Deflection tomography using Moiré technology is known for its simple devices, wide temperature-measurement range, and a low requirement for mechanical stability. Deflection tomography is considered suitable for the measurements of high temperature and high flow-velocity fields.A combustion system is developed to generate a nonpremixed swirling flame. A hybrid imaging system is designed for the simultaneous sampling of Moiré fringes and particle images (Fig. 2). Particle image acquisition and particle recognition were realized under a flame high brightness background. The effects of the particle size and concentration of tracer particles on deflection tomography and PIV imaging are studied, and the optimum particle parameters are determined.Results and Discussions The PIV and deflection tomography systems are experimentally calibrated to obtain the correspondence between the actual size and the camera pixels. Direct measurement is performed prior to the laser measurement. A thermocouple and a hot-wire anemometer are used for point measurements of the combustion temperature and velocity. Then, the laser beams emitted from the Nd:YAG for PIV and He-Ne lasers for deflection tomography are passed through the flame. Fringe patterns are obtained in four view angles, and the deflection angles are extracted. The deflection angle revision reconstruction technique is used to reconstruct the temperature distributions on different cross sections. Visualization technology is then employed to generate a 3D temperature field (Fig. 6). Four CCD cameras capture the particle images illuminated by a volume light source. The tracer particles in four particle images obtained are then screened, identified, and matched. A 3D cross-correlation calculation is performed on the particle distributions of the A- and B-frame images generated through the double pulses to obtain a 3D velocity field. Then, the isovelocity surface, constant vorticity surface, and velocity streamlines are visualized simultaneously (Fig. 7 and Fig. 8). The relative error of the temperature between the reconstruction value and the thermocouple measurement is 6.9%, and the relative error of the velocity between the reconstruction value and the anemometer measurement is 3.3%. The factors affecting the measurement results are analyzed. The swirling combustion characteristics are analyzed based on the quantitative measurement and visualization of parameter distributions. The evolution of the flow field and the combustion reaction process are explained.Conclusions A multitechnology integrated method for the multiparameter measurement of swirling combustion was constructed herein. PIV and deflection tomography are combined for the simultaneous measurement and visualization of 3D temperatures and velocity fields. Fringe patterns are obtained in four view angles using a Moiré deflectometer to reconstruct the temperature distributions in different cross sections. Visualization technology is used to generate a 3D temperature field. The particle images illuminated by a volume light source are captured using four CCD cameras to reconstruct the velocity distribution. Furthermore, the isovelocity surface, isosurface of vorticity magnitude, and velocity streamlines are visualized simultaneously. The swirling combustion characteristics are analyzed on the bases of quantitative measurement and visualization of the parameter distributions. The validity of the experimental results is verified via direct point measurements, and the measurement errors are then discussed.
Feb. 02, 2021Vol. 48 Issue 3 0304002 (2021)
Baihong Li, Zhiguang Xia, Xiao Xiang, Yaqing Jin, Run'ai Quan, Ruifang Dong, Tao Liu, and Shougang Zhang
Objective The entangled photons generated by the spontaneous parameter down-conversion (SPDC) process have wide applications in quantum precision measurement, quantum spectroscopy, quantum imaging, quantum teleportation, and quantum security communications. However, one can only obtain a highly efficient SPDC when the phase-matching condition (conservation of momentum) is satisfied. In general, only a few birefringent crystals can meet the phase-matching condition, however the phase-matched wavelength (PMW) and bandwidth of entangled photons are limited. Afterwards, the quasi-phase matching (QPM) technology is proposed to solve the limitation problem of a birefringent crystal by artificially modulating the polling periods of the crystal. QPM is determined by the polling period and the refractive index of the crystal. The crystal temperature can be used to adjust the refractive index and different crystal temperatures are corresponding to different PMWs. To determine the crystal temperature at the required PMW, it is necessary to know the relationship between the PMW and crystal temperature. The temperature-dependent Sellmeier equation can be used to estimate this relationship. However, the Sellmeier equations of many nonlinear crystals are still unknown. Even if the Sellmeier equation is known, there is still a discrepancy between the estimated result and the experimental result in some special wavelengths and temperature ranges since the coefficients in the Sellmeier equation come from some empirical values. Thus, it needs to be revised or improved continuously. Therefore, it is necessary to use some experimental methods to accurately measure the PMW of the entangled photons in the SPDC process. In experiments, a monochromator is usually used to measure the spectrum of entangled photons and thus the relationship between the PMW and the crystal temperature is obtained. However, owing to the scanning for different wavelengths at different crystal temperatures, the measurement is low-accuracy and time-consuming, especially for the entangled broadband spectra.Methods Herein, we propose an alternative experimental method for fast measuring the PMW of entangled photons versus crystal temperature. It utilizes the wavelength-to-time mapping (WTTM) technology with a dispersive element to realize a fast measurement. In the experimental setup (Fig. 1), the fiber Bragg grating is successively inserted in the signal and idler paths. By adjusting the crystal temperature, one can obtain the two curves of the time delay between arrival time of signal and idler photons versus crystal temperature. Further, based on the wavelength-to-time mapping relation, these two curves can be converted into those of the PMWs of the signal and idler photons versus the crystal temperature. Before the experiment, we first calibrate the WTTM relation by measuring the idler wavelength as a function of the time delay, in which the programmable filters and FBG are together input in the idler path. The utilized SPDC sources are generated from a 10 mm long, type-II periodically poled LiNbO3(PPLN, Fig. 2) waveguide and a periodically poled KTiOPO4(PPKTP, Fig. 3) crystal pumped by a continuous wave distributed Bragg reflector laser (DBR laser) at 780 nm. A half-wave plate is used to optimize the SPDC efficiency by adjusting the polarization of the pump laser. After filtering out the residual pump beam using two long-pass filters (LPFs), the signal and idler photons are focused and then coupled into a fiber polarization beam splitter (FPBS). With the help of another half-wave plate, the signal and idler are separated into two polarization-orthogonal fiber paths marked using s and i, respectively. The coincidence count measurement is accomplished using a time-correlated single-photon counting module. According to our experimental results, we obtain a linear relation between the idler wavelength and the time delay, i.e., τ-=893203-523.6l. With this relation, we can estimate the FBG with Dl=-(523.6 ± 2.2) ps·nm -1 at 1560 nm. Results and Discussions As examples, the experimental results are given with a PPLN waveguide (Fig. 2) and a PPKTP crystal (Fig. 3), which provides a proof for our proposed method. A measurement resolution better than 0.1 nm in Fig. 2 is obtained owing to the use of two superconducting nanowire single-photon detectors (SNSPDs) with the maximum standard deviation of 47 ps from the five measurements of full-width half-maximum (FWHM) of G(2). A measurement resolution better than 0.27 nm in Fig. 3 is obtained owing to the use of two semiconductor single-photon detectors with the maximum standard deviation of 143 ps using the same FBG. The measurement resolution in Fig. 2 is better than that in Fig. 3, because the SNSPDs the former used can provide lower time jitters. The resolution is limited by the time jitters of the detectors and the magnitude of the dispersive elements. In principle, the smaller the jitter of the detector and the larger the amount of dispersion, the higher the resolution. Compared with the traditional method using a monochromator (a few hours), this method only takes a few minutes. Conclusions In conclusion, we propose an alternative experimental method for fast measuring the PMW of entangled photons versus crystal temperature based on the WTTM technology. A measurement resolution better than 0.1 nm is obtained in our experiment and the measurement time is reduced significantly (only a few minutes) if compared with that of the traditional method using a monochromator (a few hours). In addition, we analyse the discrepancy between the theoretical and experimental results and discuss some possible applications. The proposed method can be applied to calibrate the poling period of crystals and the relation between PMW and crystal temperature, and is expected to modify or improve the temperature-dependent Sellmeier equations of nonlinear crystals.
Feb. 01, 2021Vol. 48 Issue 3 0312001 (2021)
Nearly-Resonant Gain Grating in Atomic MediaOn the Cover
Yabin Dong, Jialu Pang, Li Yang, and Yaoyao Liu
Objective With the increasing demand for high capacity and high speed information transmission, the transmission, storage, retrieval, transformation, and processing of optical information have become a very important research area in the field of information science. A grating is a type of optical device with a spatially-periodic structure. It has four main properties: dispersion, beam splitting, polarization, and phase matching. It is widely used in information processing, optical communication, optical storage, and other fields. However, when a grating is used in communications, it not only has a conversion efficiency and a conversion rate between optical and electrical signals, but also has the response rate of a mechanical structure, which has large effects on the signal transmission efficiency, bandwidth, and stability. Therefore, all-optical networks based on the all-optical switching technology have become a new focus of research. In all-optical networks, information transmission, transformation, and amplification do not need light-electricity conversion, and the optical structures are simple, reconfigurable with anti-interference capability, thus the utilization rate of network resources is improved. The core device of an all-optical network based on an all-optical switch has the advantages of stability, high capacity, and ultra-high speed, and thus, it has attracted more and more attention from researchers. Therefore, the purpose of this study is to realize all-optical control based on grating characteristics. We achieve a nearly-resonant gain grating effect that can be used to control light in real-time and thus all-optical control is realized.Methods In an N-type four-level atomic system, the analytical expression of the polarization rate of the probe field was first calculated by the density matrix method under the steady-state condition based on the perturbation theory. Then, the propagation equation of the probe field was obtained using Maxwell's equations. From the analytical solution, the related factors affecting the diffraction efficiency of the probe field were analyzed, mainly including the Rabi frequencies and detunings of the modulation and coupling fields. In addition, it was seen that the transfer function of the interaction length between light and atoms also influenced the diffraction efficiency. We focused on the amplification and diffraction capacity of the probe field and generated the transmission functional curve of the probe field. The changes in diffraction intensity with Rabi frequencies, detunings of the modulation and coupling fields, and interaction length between light and atoms were also considered. A nearly-resonant gain grating with high gain and a strong diffraction ability was realized by identifying and adjusting the relevant parameters appropriately.Results and Discussions A nearly-resonant gain grating effect is studied in an N-type four-level coherent atomic structure. The grating can not only amplify the light information, but can also actively control the light field in real-time and realize the modulation of the amplitude and phase at the same time to achieve all-optical control. When the coupling field is resonant and the probe and modulation fields are near resonance, they can regulate the gain and phase of the probe field so that the energy of the probe field is amplified and the high-order diffraction efficiency of the probe field can be significantly improved [Fig. 2(b)]. It is seen that the diffraction efficiency of the nearly-resonant gain grating goes beyond the theoretical limit of an ideal sinusoidal phase grating, and its diffraction efficiency is nearly three times that of a sinusoidal phase grating. In addition, during the change in the Rabi frequency of the modulation field, the atomic medium can continuously transform between the absorption and gain media [Fig. 3(a)]. Moreover, the modulation field has a threshold for the diffracted light during this process. When the intensity of the modulation field is less than the threshold, there is almost no diffracted light. When the intensity of the modulation field is greater than the threshold, the intensity of the each order diffracted light increases sharply (Fig. 6).Conclusions We theoretically study a nearly-resonant gain grating in an N-type four-level atomic system. The results show that the energy of the probe field is amplified by four times under the combined action of the modulation and coupling fields when there is only amplitude modulation, and this is mainly concentrated in the zeroth-order diffraction direction. With the introduction of phase modulation, the coupling field plays an important role in the distribution of diffracted light, and more energy is distributed along the higher-order diffraction direction. In this process, for the first-order, second-order, and third-order diffracted light, there are thresholds for the modulation field, which are 0.28γ, 0.26γ, and 0.32γ, respectively. When the intensity of the modulation field is less than the threshold, there is almost no diffracted light, and when the intensity of the modulation field is above the threshold, the intensity of each order diffracted light increases dramatically. In addition, other factors affecting the high-order diffraction efficiency of the probe field are also studied. By adjusting the relevant parameters, a grating with high gain, strong diffraction capacity, and controllable threshold is obtained, which has broad applications in new photonic devices such as all-optical switches, all-optical routes, and all-optical logic gates.
Feb. 02, 2021Vol. 48 Issue 3 0312002 (2021)
Jian Han, Mingda Jiang, Kai Zhang, Dong Xiao, and Yongtian Zhu
Objective The current maximum size of a diffraction grating is a ruled area of 300 mm (groove length) by 400 mm (ruled width). With the latest generation of eight- and ten-meter-class optical telescopes and the desire for resolutions exceeding 100000 for spectroscopic applications, there is a need to produce larger diffraction gratings or assemblies of existing gratings in good alignment. At the same time, descriptions of instrumentation utilizing such large gratings are found in the chirped-pulse-amplification (CPA) scheme. To overcome the current size limit for ruled gratings, a method is required for producing a stable assembly of two or more gratings. The most obvious choice is to build a fixture that can hold individual gratings in a stable configuration relative to one another and relative to the instrument where the gratings are being used. The alignment requirements for mosaic echelle gratings are derived from the image-quality requirements for a high-resolution spectrograph. Several schematic setups have been used to build alignment collimators of the echelle mosaic. Image analysis, as well as the logging of all data, is typically important for achieving the required level of noise reduction. The errors of the mosaic gratings can be analyzed quantitatively, enabling the experiment to succeed more effectively.Methods The alignments in a mosaic grating are determined by maintaining a reference grating in a static position and moving the adjustable gratings relative to the reference tile. There are five degrees of freedom relative to the reference grating: the tilt Δθy, tip Δθx, twist Δθz, lateral shift Δx, and piston extension Δz. All these alignment errors produce different fringes, so the properly aligned position can be determined by interferometric analysis. In order to increase the precision of the angular-error adjustments in mosaic grating alignment, we use nine-pixel-average algorithm based on Fourier-transform to analyze the interference-fringe frequency patterns with high precision. The algorithm contains several steps. First, a window function is applied to each fringe pattern to reduce edge effects in the Fourier-transform calculations, and the carrier frequency is chosen to position the sidelobes outside the noise spectrum of the interferometer system. Second, we apply an inverse Fourier-transform, followed by phase calculations, to produce a two-dimensional phase reconstruction of the gratings. Finally, any remaining tip/tilt errors can be calculated and resolved. By using the nine-pixel-average algorithm and calculating the centroid coordinates of the sidelobes of the interferogram, we can determine the spatial carrier frequencies with high accuracy. This technique is especially useful when operating in optically “noisy” environments, and it permits a high level of noise rejection. In connection with the interference method for mosaic echelle alignment, we have simulated and analyzed the Fourier-transforms of the different fringes obtained for different angular errors. We also have obtained the calibration coefficients for the angles in alignment and have determined the resolution and the precision tolerance of the Fourier-transform-based fringe-pattern analysis in a co-phasing mosaic-grating-assembly experiment.Results and Discussion In the zeroth-order diffraction pattern of the mosaic gratings, the angular errors Δθx and Δθy affect the tilt and the period of the interferogram fringes. Using nine-pixel-average algorithm based on Fourier-transform, we have analyzed the different fringes obtained with different micrometer-head readings, and we have also calculated the calibration coefficients for the angles in alignment system (Fig. 5 and Fig. 6). The calculated angular errors increase linearly as the micrometer-head readings increase, and the linear fitting coefficient is better than 0.999. In addition, we have determined the resolution and precision tolerance of the algorithm. According to the error analysis of calculated misalignment angle, we find that Fourier-transform-based nine-pixel-average algorithm data is in accord with the setting data, and the angular-misalignment error distribution is less than 0.4 μrad (Fig. 8). We have also compared the angular resolution for different fringe algorithms (the peak algorithm and the nine-pixel-average algorithm). We find that the resolution precision of the nine-pixel-average algorithm is better than 0.1 μrad, while the peak algorithm is impractical for use in fringe calculations (Table 2). From this sensitivity study, not only do we find that the nine-pixel-average algorithm shows better performance in the analysis but also we verify its high sensitivity for detecting phase variations. All these results demonstrate the usefulness of the nine-pixel-average algorithm.Conclusions In the present study, we have devised Fourier-transform-based nine-pixel-average algorithm and have used it to analyze the interference-fringe frequency patterns with high precision. With this technique, we can determine the angle-adjustment coefficients of the system. The alignment angles of the two gratings with respect to each other can be determined with an accuracy of 0.4 μrad, and the resolution precision of the nine-pixel-average algorithm is better than 0.1 μrad. This result is entirely sufficient to guarantee the precision required for mosaic echelle gratings at the telescope, and the work provides a theory for fringe calculations for the co-phasing mosaic alignment of large-sized gratings. We anticipate that in conjunction with future increases in grating size, astronomical spectrographs will be able to attain the significantly increased resolution that is very important for astronomical research.
Feb. 01, 2021Vol. 48 Issue 3 0311001 (2021)
Recognition of Food-Borne Pathogenic Bacteria by Raman Spectroscopy Based on Random Forest Algorithm
Qi Wang, Wandan Zeng, Zhiping Xia, Zhiping Li, and Han Qu
Objective Food and drug safety is of great concern to society. Food pathogenic bacteria are pathogenic bacteria that can cause food poisoning or bacteria that use food as the vector of transmission. Therefore, quick and effective detection of food-borne pathogenic bacteria in food is crucial to protect public health. The culture separation method, which is traditionally used to examine microorganisms, depends on the medium used for culturing, separation, and biochemical identification. Detection of food-borne pathogenic bacteria generally requires five to seven days and includes a series of detection procedures such as pre-enrichment, selective enrichment, microscopic examination and serological verification. Therefore, traditional detection methods are insufficient for preventing and controlling food-borne pathogenic bacteria. However, Raman spectroscopy is a nondestructive method that can be used to rapidly and accurately identify molecules existing in the functional groups. In this study, 11 food-borne pathogenic bacteria samples were used to construct a recognition and classification model based on a random forest algorithm and Raman spectra. This model was then used to build a classification and recognition model to resolve the problems of low classification accuracy and long detection time required by traditional methods used to detect food-borne pathogenic bacteria. The results of this study will help to ensure public health safety by rapidly and effectively detecting pathogens in food and drugs.Methods All of the food-borne pathogenic bacteria in this study were purchased from China Center of Industrial Culture Collection. First, a sample of food-borne pathogenic bacteria was detected by Raman spectrometry in a shift range of 500--1600 cm -1. LabSpec 6.0 software was used for spectral collection, and each sample was collected 15 times. After screening, 132 Raman spectral data were obtained. Min-max normalization was performed on the Raman spectral data in the spectral preprocessing stage, and the intensity was mapped to a range of [0, 1] for comparison. The Savitzky-Golay algorithm was used for smooth denoising to remove noise and fluorescence interference. Principal component analysis (PCA) was used for feature dimensionality reduction for sample data with high-dimensional characteristics to avoid problems caused by excessively high dimensions. In the model evaluation stage, K-fold cross-validation was used to verify whether the model balanced underfitting and overfitting phenomena and to evaluate the model stability. According to these criteria, the Raman spectral recognition model based on the random forest algorithm proposed in this study was able to effectively distinguish different food-borne pathogenic bacteria among the collected samples. Results and Discussions In this study, K-nearest neighbors (KNN), logistic regression, support vector machine (SVM), decision tree, and random forest models were used for classification prediction of the pre-treated Raman spectral data of the food-borne pathogenic bacteria (Table 4). Among the 10-fold cross-validation models, the accuracy of the random forest model was better than that of the traditional machine learning algorithms. The decision tree model presented the worst results, with an accuracy rate of 82.63%. This is because the decision tree results in a single weak learner, whereas the random forest model includes multiple votes that are combined to form strong learning (Fig. 5). Therefore, the classification ability of the random forest algorithm is higher than that of a single decision tree classifier. Compared with traditional machine learning algorithms, the random forest algorithm adds two randomness elements in the model construction: sampling randomness and feature selection randomness (Table 2). Because the random forest is composed of decision trees, a higher correlation of decision trees results in a higher error rate. Random sampling determines the decrease degree in the correlation of each tree in the random forest. Among a small number of features selected randomly by each tree in the random forest, the features of optimal splitting ability are chosen as the left and right subtrees of the decision tree. This expands the effect of randomness and further enhances the robustness of the model. Because the introduction of the two randomness elements has a strong effect on reducing the variance of the model, the random forest generally does not need additional pruning. That is, it can achieve better generalization and a stronger ability to avoid overfitting, resulting in low variance. In addition, the Savitzky-Golay filtering algorithm was used for denoising in the preprocessing stage of the Raman spectral data (Fig. 3) to ensure good anti-interference ability in the model.Conclusions Raman spectroscopy is a mature technology that has a significant effect on the detection and classification of food-borne pathogenic bacteria. In this study, a Raman spectrometer was used to detect the spectral data of 11 food-borne pathogens. According to the spectral properties, the spectral data were normalized, smoothed, and denoised in the preprocessing stage, which facilitated the model construction and training. In addition, a method was developed for identification and analysis of food-borne pathogenic bacteria by using Raman spectroscopy. The experimental results show that the classification model of PCA combined with the random forest algorithm proposed in this study has higher accuracy for Raman spectral data than that of the single machine learning method used conventionally for detecting food-borne pathogens. In addition, the new method improves the speed of manual identification of the Raman spectra. However, the random forest model was prone to overfitting in the sample sets with large noise processing. Future research to improve the accuracy of the model will show that denoising can be optimized in the data pretreatment stage and that the data feature selection algorithm can be optimized using the random forest algorithm. Only 11 samples of food-borne pathogenic bacteria were used in this study. Additional samples could be introduced in the construction of a later model to build a more complete Raman spectral database.
Feb. 01, 2021Vol. 48 Issue 3 0311002 (2021)
Ziang Deng, Shujie Li, Jie Liu, Quanhong Ou, Youming Shi, and Gang Liu
Objective In some research fields and practical applications, the accurate determination of pH is extremely important. For example, in biology, the change in intracellular pH plays an important role in cell growth, apoptosis, ion transport, homeostasis, and enzymolysis. There are three main methods for traditional detection of pH: pH indicator; pH test paper; glass pH electrode. The principles of the pH indicator and test paper are essentially the same, and the pH value is determined from color change after the reaction using the indicator and test paper. However, because of the color change, the pH value of the solution is determined according to a standard colorimetric card, which is easily affected by subjective consciousness. At the same time, the detection target range is small; for example, pH test paper cannot display the pH value of oil. Furthermore, the accuracy of the pH value is limited by the method used. The use of a glass pH electrode is the main method for accurately determining pH, but it is not suitable for long-term use owing to susceptibility to mechanical damage, electrical interference, long preparation time, complex calibration, and other reasons; moreover, the detection targets are limited. Therefore, it is necessary to find a simple, noncontact, and reliable method to detect pH. In this study, a pH optical probe with good sensitivity, selectivity, reversibility, and stability was constructed using SERS technology, Au NPs as reinforcement substrate, and R6G as a probe molecule. Our basic strategy and research results are expected to be helpful for the combination of pH detection with other fields and the tracking of pH changes in single molecules and tissue cells.Methods In this study, Au NPs were used as the enhancement substrate and R6G was used as the probe molecule to output SERS signals. The pH value of the sample solution was rapidly and conveniently measured. First, Au NPs were prepared via chemical reduction, and the silicon wafers were modified using the soaking method to obtain four types of dispersed distributions; the particle size of the SERS-enhanced substrate was within the range of 30--100 nm. Second, the morphology, particle size, particle dispersion, and LSPR resonance frequency of Au NPs were characterized using scanning electron microscopy (SEM) and ultraviolet visible absorption spectroscopy. We explored the uniformity and reproducibility of the enhanced Raman signal and the influence of different R6G concentrations and Au NPs size on the SERS spectrum and finally select the appropriate molecular concentration of Au NPs and R6G probe for subsequent experiments. Subsequently, we measured the SERS spectrum changes of the probe molecules under different pH conditions and determined the linear relationship between the peak area ratio of SERS and the pH value of R6G at 1363 and 1314 cm -1 so as to design the pH sensor. In addition, we conducted experiments on recovery, stability, H + selectivity, and real sample pH value to explore the performance of the pH sensor. Results and Discussions The 45 nm Au NPs substrate exhibited better enhancement effect, stability (Fig.2) and uniformity of the Raman signal (Fig.3). Because of the different inclination orientation of the deprotonated and protonated R6G molecules adsorbed on the enhanced base surface in closed- and open-loop forms, R6G exhibited different SERS activities at different pH levels (Fig.4). We found a linear relationship between the SERS spectral peak area ratio of R6G and pH value at 1363 and 1314 cm -1 to design the pH sensor. Experimental results show that the SERS signal of R6G can be stabilized for more than 2 h at room temperature. The sensor showed good recoverability when the pH value of the sample solution was changed back and forth between 7 and 3 (Fig.5). After the introduction of other interfering metal cations in the pH detection process, the probe showed better selectivity of H + (Fig.6). The detection of the actual sample pH revealed that the probe has good analytical performance and that it is easy to detect the pH value in acidic mediums (Table 1). Conclusions We explored the method of pH sensing using R6G molecules adsorbed on Au NPs. In the process of pH increasing from small to large values, R6G molecules changed from protonation in the form of an open ring to deprotonation in the form of a closed loop, and the angle between the R6G molecules on Au NPs' surface increased gradually, resulting in the interference of stretching vibration of the C—N bond connected with the benzene ring and C—C bond of the aromatic ring. We found a linear relationship between pH and the C—C and C—N frequencies.Results show that the probe has superior sensitivity, selectivity, reversibility, and stability. The SERS signal can be stabilized for more than 2 h at room temperature. Moreover, the probe has the ability to detect dynamic changes in pH, which can reflect the change in pH in actual acidic mediums. Compared with traditional pH-detection methods and other optical pH sensors based on the spectral response of synthetic probes, the pH sensor prepared in the present work has the advantages of high sensitivity, nondestructive detection, and good biological stability. The application range of the pH sensor is widened, the selected probe molecules are easy to obtain and economical, and the phenomena of photolysis and photobleaching do not occur easily in the detection process. The rhodamine group produces cationic stimulated SERS signals with strong fluorescence; this has good application prospects in SERS ultrasensitive single-molecule detection. Moreover, it is easy to be combined with other fields and has greater application prospects in tracking the pH changes in single molecules and tissue cells.
Feb. 01, 2021Vol. 48 Issue 3 0311003 (2021)
Min Zhang, Fengping Yan, Xuemei Du, and Xiaoqi Zhang
Objective Metamaterials have several advantages compared to natural materials. As they are produced by the artificial synthesis of periodic unit structures, metamaterials can achieve special electromagnetic phenomena, including electromagnetically induced transparency (EIT), near-zero refractive index, and photonic band gap. Therefore, improving the performance of metamaterials has become a hot topic in the industry. If metamaterial devices offer a rational selection of materials and structural parameter adjustment, their wide application in the field of terahertz technology would be possible. EIT is an optical quantum interference cancellation effect that makes opaque media transparent to light detection. It has substantial application value for the realization of slow light. In the atomic field, the conventional EIT effect requires strict experimental conditions, such as ultra-low temperature and strong light pumping. However, when using metamaterials to achieve the EIT effect, only light and dark mode structures are needed. Their resonant absorption frequencies are quite similar. After an electromagnetic wave incident, light and dark mode structures are coupled with each other, and their transmission peak appears. Many researchers have studied and designed two-dimensional metamaterials, with a variety of different media and structures, and they have achieved ground-breaking results. However, only few studies have focused on three-dimensional (3D) metamaterials with the multi-band slow-light effect. In order to solve this critical problem, a 3D metamaterial model comprising of a square closed loop and split ring resonators is designed based on relevant principles. Moreover, the proposed structure shows a multiband EIT effect in the terahertz range.Methods To design metamaterials with optimum performance, we first designed the unit structure, in which four split ring resonators were vertically arranged on the quartz substrate. In addition, the square closed loop was placed horizontally on the quartz substrate. The parameters of these four split ring resonators were the same, and the opening positions were forward and reverse. Next, we used CST to simulate an EIT metamaterial structure and study its mechanism. For analyzing the mechanism of its electromagnetic response and EIT effect, we split the metamaterial structure into reverse and forward double-split ring resonator unit structures that were then simulated and compared. In addition, to further explore the mechanism of resonance peaks, the electric and magnetic field distributions (at each resonance peak) were analyzed. The structural parameters, including the width, opening size, and square closed loop size, were analyzed and studied. Finally, the optical buffer was studied, and the proposed structure was applied to the refractive index sensor.Results and Discussions The designed metamaterial structure has four transmission peaks at 1.21THz, 1.46THz, 1.61THz, and 1.98THz. The coupling bodies of the bright mode and dark mode in the structure are forward and reverse double split ring resonators, respectively with a square closed loop, respectively, and the resonance intensity is about 0.90 (Fig. 2). Compared with the customary structure, the proposed structure achieves a four-band, high-intensity EIT effect. The first resonance transmission peak appears at 1.21THz, which infers that the forward and reverse double split ring resonators and the square closed loop are light and dark modes of one another. It can also be inferred that they are coupled after the magnetic wave incident (Fig. 3). The second transmission peak appears at 1.46THz, which is obtained by the coupling of the forward double split ring resonators and the square closed loop as light and dark modes of each other (Fig. 3). The third transmission peak is pinpointed at 1.61THz, which is obtained by the coupling of four split ring resonators and the square closed loop, also as bright and dark modes of each other (Fig. 3). The last transmission peak appears at 1.98THz, which indicates that it is obtained by the coupling of the reverse, double split ring resonators, and the square closed loop. In the discussion of broadband EIT characteristics, by differentiating the absorption peaks, the split ring resonators are sharper than the square closed loop, so the electromagnetic resonance is more intense and the value is also elevated. The forward double split ring resonators and the square closed loop are of mutual light and dark modes, and they are coupled to form two transmission peaks with a bandwidth of 0.25THz. In the same way, the reverse double split ring resonators and the square closed loop are also coupled, forming two transmission peaks with a bandwidth of 0.52THz and 0.41THz. The simulation results show that the broadband characteristics have clear advantages over the 0.1THz bandwidth of the traditional narrow-band structure (Fig. 4). For the opening size of the split ring resonators, the resonance intensity of the EIT transmission peak decreases simultaneously with the increase of parameters, and the bandwidth also decreases (Fig. 5). For the size of the square closed loop, the resonance intensity of the transmission peak gradually increases along with the successive increase of the transmission peak. This reveals a small blue shift of the transmission peak, and the bandwidth also increases (Fig. 6). For research in the field of optical buffering, with the rapid increase of refractive index and dispersion, the group refractive index also increases in the EIT effect. The values are 67.6, 37.5176.4, and 57.8289.4 (Fig. 7). Finally, when the proposed structure is applied to the refractive index sensor, the refractive index sensitivities of four bands are 235.2, 39.2, 65.8, and 29.4 GHz/RIU, respectively. In contrast with the conventional EIT structure, the designed metamaterial structure not only presents multiband refractive index sensing performance but also presents its own high sensitivity (Fig. 8).Conclusions The results show that the EIT effects of 1.21THz, 1.46THz, 1.61THz, and 1.98THz can be achieved in the three-dimensional structure model of metamaterials in terahertz band; the resonance intensity can reach 0.90, 0.89, 0.90, and 0.87, respectively. The mechanism of the multiband EIT resonance was studied by differentiating the coupling response of forward and reverse double split ring resonators, and a square closed loop. By adjusting the structural parameters, the influence of the size of the opening of the split ring resonators and the size of the square closed loop on the strength and bandwidth of the EIT (in the metamaterial) is discussed. Compared with the traditional design, the metamaterial 3D structure indicates a multiband EIT effect, and it shows an escalating refractive index sensitivity in multiple bands. This can produce a strong slow-light effect at multiple frequency points. Therefore, it is satisfactory for the application and promotion in the field of refractive index sensing and optical buffer.
Feb. 01, 2021Vol. 48 Issue 3 0314001 (2021)
Jianxin Wang, Zhiqiang Yu, Junbo Hu, Qiang Su, Lanjun Guo, Lie Lin, Hui Gao, Weiwei Liu, and Nan Zhang
Objective Broadband terahertz (THz) wave has important applications in many fields, such as material identification, security inspection, optical communication, etc. It has attracted worldwide researchers' attentions in recent years. Two-color femtosecond laser filamentation can produce THz waves with electric field as high as 21 MV/cm and broad bandwidth up to 200 THz, which show significant advantages over other THz wave generation methods. In addition, THz source produced by femtosecond laser filamentation can achieve the long-distance delivery of THz wave. Due to the serious diffraction phenomenon of THz waves and the strong absorption of THz waves by water vapor in the atmosphere, THz wave cannot propagate long distance in air, while by long-distance delivery of femtosecond laser filament, THz wave can be produced in the remote locations, providing a feasible way for the related application of THz waves in the atmosphere.For the two-color femtosecond laser filamentation, the time delay, spatial walk-off, and polarization state of the fundamental and second harmonic laser beams strongly affect the generation efficiency of terahertz wave. In this paper, we demonstrate experimentally and numerically that when the polarization directions of the fundamental and the second harmonic beams are adjusted to be identical by using the dual-wavelength wave plate, obvious pulse separation will be generated due to the group delay dispersion and birefringence of the dual-wavelength wave plate. Therefore, simply adding a dual-wavelength wave plate will decrease the generation efficiency of THz wave, even a zero-order dual-wavelength wave plate is employed. By using a zero-order dual-wavelength wave plate and a dispersion compensating plate, the effect of pulse separation can be reduced, thereby increasing the terahertz generation efficiency. This work demonstrates the role of dual-wavelength wave plate and dispersion compensating plate in increasing the THz wave generation efficiency when two-color femtosecond laser filamentation is employed.Methods When femtosecond laser pulse passes through a dual-wavelength wave plate, the laser pulse splits into two pulses in the temporal domain due to the polarization dependent group velocity in the wave plate. This paper investigates the influence of the pulse splitting on the generation of terahertz waves in two-color femtosecond laser filamentation both experimentally and numerically. In experiments, we use a β-BBO with a thickness of 100 μm to excite the second harmonic beam of the 800 nm fundamental laser beam. α-BBO crystals with different thicknesses are used to compensate the time delay between the fundamental and second harmonic laser beams. The polarization directions of the fundamental and second harmonic laser beams are adjusted by the dual-wavelength wave plates with different thicknesses. The power of the produced THz wave is obtained by the Golay cell detector. The photocurrent model is used in the simulation process, and the effect of pulse separation on the generation of terahertz wave is investigated by calculating the ionizing radiation process.Results and Discussions We investigate the THz wave generation by the two-color femtosecond laser filamentation when the multi-order, zero-order or no dual-wavelength waveplate is employed both experimentally and numerically. It is found that the terahertz radiation efficiency using a multi-order dual-wavelength wave plate is lower than that using no dual-wavelength wave plate or a zero-order dual-wavelength wave plate.According to the simulation results, it concludes that:1. The THz generation efficiencyincreases by about 120 times when the multi-order dual-wavelength wave plate is replaced by the zero-order dual-wavelength wave plate (Fig.9).2. The THz generation efficiency in the case using the zero-order dual-wavelength wave plate is about 5.4 times larger than thatwithout any dual-wavelength wave plate (Fig.6 and Fig.9).According to the experimental results, we can conclude that: 1) The THz generation efficiencyincreases by about 45 times when the multi-order dual-wavelength wave plate is replaced by the zero-order dual-wavelength wave plate. 2) The THz generation efficiency in the case using the zero-order dual-wavelength wave plate is about 2.5 times larger than thatwithout any dual-wavelength wave plate (Fig.10).Both experimental and simulation results show that the use of a relatively thin zero-order dual-wavelength wave plate can effectively suppress the pulse separation phenomenon (Fig.7) and improve the THz generation efficiency. Therefore, the zero-order dual-wavelength wave plate should be implemented in the THz wave generation by the two-color femtosecond laser filamentation.Conclusions When femtosecond laser pulse passes through a dual-wavelength wave plate, the laser pulse splits into two pulses in the temporal domain due to the polarization dependent group velocity in the wave plate. This paper investigates the influence of the pulse splitting on the generation efficiency of terahertz waves by two-color femtosecond laser filamentation both experimentally and numerically. It is found that the use of dual-wavelength wave plates to control the polarization states of the fundamental and the second harmonic beams will cause the phenomenon of pulse separation and decrease the generation efficiency of terahertz waves. Replacing the multiple-order dual-wavelength wave plate by the zero-order one together with a dispersion compensator can weaken the effect of the pulse splitting and enhance the terahertz generation efficiency.
Feb. 23, 2021Vol. 48 Issue 3 0314002 (2021)
© Copyright 2018-2021 | Chinese Laser Press.
All Rights Reserved 沪ICP备15018463号-20