


Please enter the answer below before you can view the full text.

Jie Hu, Han Liu, Wencai Xu, and Liang Zhao
Objective In the field of autopilot, the intelligent driving decision is highly dependent on the accurate detection of road obstacles, and the accurate information of road obstacles is the prerequisite for automatic driving. Three dimensional (3D) LiDAR has a high resolution, high detection accuracy, all-weather operation, and strong anti-jamming ability, allowing it to provide accurate environmental information for vehicles. To detect road obstacles using a 3D point cloud generated by 3D LiDAR, the point cloud data must be processed. The point cloud is divided into independent subsets, each of which corresponds to targets with distinct physical meanings. The target detection of a point cloud is divided into several modules, the most important of which are preprocessing, ground segmentation, point cloud clustering, target output, and other modules that lack the target’s pose information. Pose information is critical for tracking, classification, and other tasks involving target obstacles, so it is critical to accurately detect the target’s pose.Methods The target detection based on 3D point cloud is generally divided into preprocessing, ground segmentation, point cloud clustering, target output, and other modules. On this basis, the target’s pose information is determined further. A segmentation method based on a fan-shaped box is proposed to segment the ground point cloud and the target point cloud to meet the requirements of high accuracy and high real-time for ground point cloud segmentation. To address the issue of Euclidean clustering’s fixed distance threshold’s poor adaptability to the characteristics of LiDAR close dense far sparse, a Euclidean clustering method with adaptive clustering threshold is proposed to improve the clustering accuracy of the clustering algorithm at different distances. A boundary line fitting method based on the random sample consensus (RANSAC) algorithm is proposed to determine the target object’s box model to meet the requirement of pose information detection. The direction angle is obtained by direction fitting, and the dimension is obtained by coordinate system rotation, which reduces the amount of computation and enhances the real-time performance of the algorithm. RANSAC direction and measurement estimation is the name of the pose detection algorithm used in this paper (RDME).To validate the algorithm, 100 frames point clouds are randomly selected from each of the three LiDAR datasets during the experiments. Statistics of the number of objects in all single frame point clouds and the number of targets detected by the clustering algorithm and pose detection algorithm record the processing time of each frame and use four indicators to evaluate the algorithm effect, and the algorithm is compared with the minimum bounding rectangle (MBR) algorithm and the Three-Point Estimation (TPE) algorithm to verify the algorithm’s effectiveness and advanced nature.Results and Discussions The clustering algorithm performs well, with high true positive accuracy (TPA) and low false negative accuracy (FNA). RDME algorithm performs better than MBR and TPE algorithms in three LiDAR datasets. The RDME algorithm performs better when the number of LiDAR laser rays is increased and the point cloud is dense, and the total true positive accuracy (TTPA) is improved by up to 4.52 percentage points. For PPA, the performance of RDME algorithm is improved by up to 8.14 percentage points. The RDME algorithm can effectively estimate the direction of the target object, and the adaptive threshold clustering method based on LiDAR parameters can effectively identify the target objects at different distances and improve the clustering algorithm’s accuracy (Table 2). In the same frame sequence, the detection speeds of the RDME, MBR, and TPE algorithms differ. The average detection time of the RDME algorithm is 14.84 ms, 19.48 ms, and 19.71 ms respectively (excluding the link time of data transmission) in the first LiDAR datasets, and RDME algorithm detection time is 23.81% lower than the MBR algorithm, and 24.71% less than TPE algorithm; the average detection time of the RDME algorithm is 38.10 ms, 47.02 ms and 48.07 ms respectively in second LiDAR datasets, and the RDME algorithm detection time is 18.97% lower than MBR algorithm and 20.74% less than TPE algorithm; the average detection time of the RDME algorithm is 12.78 ms, 15.3 5 ms and 15.56 ms respectively in the third LiDAR datasets, and the RDME algorithm detection time is 16.74% lower than MBR algorithm and 17.86% less than TPE algorithm (Fig. 11). The results show that the RDME algorithm has less detection time and better real-time performance than the MBR algorithm and TPE algorithm.Conclusions A ground segmentation method based on sector bin box and slope threshold is proposed, which can meet the real-time and accuracy requirements of ground point cloud segmentation. This paper proposes an algorithm for determining the clustering threshold based on LiDAR performance parameters to process the point cloud, overcoming the problem that European clustering relies on setting the distance threshold. For obstacles at different distances, the clustering algorithm can achieve a better clustering effect. A pose detection (RDME) algorithm is proposed to detect the pose information of the target obstacle based on the feature that the point cloud is concentrated on the surface of the target object after projection. The position detection (RDME) algorithm is compared to the MBR algorithm and the TPE algorithm using three different types of LiDAR datasets. Compared with the MBR algorithm, the RDME algorithm improves detection accuracy by 1.12%, 3.98%, and 8.14%, and reduces detection time by 23.81%, 18.97%, and 16.74%; compared with the TPE algorithm, the detection accuracy of the RDME algorithm is improved by 2.43%, 3.63%, and 6.57% respectively, and the detection time is reduced by 24.71%, 20.74%, and 17.86% respectively. The RDME algorithm’s detection accuracy and real-time performance have been significantly improved. The algorithm’s maximum average detection time is 47.02 ms, which is less than 0.1 s of the 10 Hz LiDAR’s real-time requirement. It can meet the real-time needs of intelligent vehicles and is a more efficient method.
Nov. 25, 2021Vol. 48 Issue 24 2410001 (2021)
Yamin Wang, Jiangfeng Wang, Jiangtao Guo, Xinghua Lu, Dajie Huang, and Xiaoqin Wang
Objective Inertial confinement fusion (ICF) is important to achieve controlled nuclear fusion. To solve the problem of low energy coupling efficiency in the traditional ignition scheme in a laser-driven ICF experiment, Zhang Jie and other researchers proposed double-cone ignition (DCI) as a new solution for ICF ignition. In DCI experiments, using laser irradiation, the surface area of the target material filled in the metal cone decreases sharply as the laser irradiates fusion targets; therefore, the focal spot size of the irradiated beam must be dynamically reduced accordingly. In this process, the control of shooting laser beamlines in the laser driver must be flexible. Thus, to meet the aforementioned demand, the dynamic focusing of shooting beams has been proposed. In 2013, to mitigate cross-beam energy transfer during low-adiabat cryogenic experiments on the OMEGA laser facility, researchers in the Laboratory for Laser Energetics of the University of Rochester in the United States proposed a technical solution of two-state focal zooming. The dynamic focusing process of the proposed technique is similar to that of the two-state focal zooming. Two combined spatiotemporal laser pulses are amplified by coaxial propagation. Then, a specially designed continuous phase plate is used to modulate the wavefronts of these two beams (denoted as beams 1 and 2) and smooth the focal spot separately. Next, the target material is irradiated by laser spots after focusing. In this study, to realize beam control using dynamic focusing technology, a new method for achieving dynamic focus using a combined spatiotemporal beam based on a preamplifier system is proposed to provide support for the subsequent research of DCI.Methods Herein, near-field beam quality during the generation and propagation of the combined spatiotemporal beam is analyzed. First, based on the Fresnel diffraction propagation theory and the numerical simulation method of fast Fourier transform, a propagating model of the combined spatiotemporal beam is established. Then, the influences of the filter pinhole diameter, softening factors, extinction ratio, and phase difference on the propagation of the combined spatiotemporal beams are discussed. Finally, based on the overall plan of the spatiotemporal beam combination, an experimental laser system is constructed to verify the accuracy of the numerical simulation.Results and Discussions In the analysis of the generation and propagation of the combined spatiotemporal beam, the outer size of beam 1 is 12 mm×12 mm, the outer edge softening factor is 0.1, the inner circle diameter is 6 mm, and the diameter of beam 2 is 6.6 mm. When the softening factor of the inner edge of beam 1 is Q3≥0.0625 and that of the outer edge of beam 2 is Q2≥0.055, and the pinhole of the spatial filter is greater than or equal to 32DL. After the propagation of laser in the 4f system, the near-field modulations of beams 1 and 2 are less than 5% at the positions of the image plane and 15 cm away from the image plane (Fig. 5). These results meet the demand for the near-field beam quality of the combined spatiotemporal beam. Furthermore, considering the perspective of risk prevention, when the time-domain extinction ratio is higher than 30 dB and the spatial extinction ratio is higher or equal to 20 dB, the influence of near-field intensity fluctuation on the system can be negligible [Fig. 6(b)]. Presently, the time-domain extinction ratio of the system can be greater than 40 dB and the spatial extinction ratio is ~20 dB, meeting the requirements of intensity stability of combined spatiotemporal beams in the propagation.Conclusions Herein, to meet the physical experimental requirements of dynamic focus in the scheme of DCI using a high-power laser facility, a method based on the spatiotemporal beam combination laser preamplifier system in the laser driver is proposed. Based on Fresnel diffraction propagation theory, the laser propagation model of the combined spatiotemporal beam is established using the numerical simulation method of fast Fourier transform. The effects of the filter pinhole diameter, softening factor, extinction ratio, and phase difference on the propagation of the combined spatiotemporal beams are analyzed in the simulation, and reasonable softening factors and spatial filter pinhole diameters are obtained. The preliminary experimental results agree well with the simulation results. Moreover, the parameters of the facility can meet the intensity stability requirements of the propagation of the combined spatiotemporal beam from a risk prevention viewpoint. The numerical model can be used for optimizing other parameters, which can guide the propagation and amplification of the combined spatiotemporal beams in future research. The proposed method will be used in the spatiotemporal beam combination system of the preamplifier of the high-power laser facility. In the future, experimental research will be conducted on dynamic focus to meet target physics requirements.
Nov. 22, 2021Vol. 48 Issue 24 2405001 (2021)
Yang Zhang, Tengchao He, Weishuai Zhong, Meili Dong, Jingshu Ni, Yong Liu, Yikun Wang, and Yuanzhi Zhang
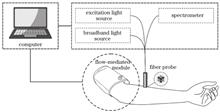
Objective The technique called flow-mediated NADH fluorescence measurement is used to reflect tissue microcirculation function, which has important value for early screening of cardiovascular disease. However, due to the obvious difference in the extinction coefficients of oxyhemoglobin and deoxyhemoglobin in the visible and near-infrared bands, the tissue absorption coefficient will change constantly during the blood flow-mediated process. The excitation light and emission fluorescence of fluorescent molecules are affected by the tissue absorption coefficient. The current flow-mediated tissue fluorescence detection technology only measures the change in total tissue fluorescence intensity during brachial artery occlusion and release and does not account for the interference of tissue absorption coefficient changes caused by changes in oxygen saturation on NADH fluorescence measurement. Therefore, this problem may directly lead to blood flow-mediated tissue fluorescence technology failing to achieve an accurate measurement, thus limiting the clinical application of the technology.Methods First, we created the flow-mediated tissue fluorescence measurement system. The tissue absorption coefficient was calculated using a combination of tissue fluorescence and diffuse reflectance measurements. To improve the detection system’s accuracy, a steady-state tissue intrinsic fluorescence recovery method was used to correct the interference of absorption coefficient changes during the process of brachial artery occlusion and release on NADH fluorescence measurement. Second, we carried out the validation experiments of biological tissue solid phantom with different optical parameters and blood oxygen phantom simulating the physiological process of brachial artery occlusion and release. Furthermore, we validated the flow-mediated tissue fluorescence measurement system’s accuracy by comparing the corrected and uncorrected changes in blood flow-mediated tissue fluorescence in normal subjects.Results and Discussions The results of tissue solid phantom experiments with different optical parameters showed when the values of α and β are 0.67 and 0.31, respectively, the small coefficient of variation of fluorescence intensity of the same concentration, the large linear correlation coefficient of gradient fluorescence intensity and concentration, and the closest curve shape could be satisfied at the same time (Fig.2). After obtaining the optimal combination of α and β , the fluorescence spectra of tissue phantom were recovered. The fluorescence intensity of NADH after recovery was linearly correlated with its concentration (R2=0.99), which indicated that the recovery effect was better (Fig.3). The results of blood oxygen phantom experiments showed that with the increase of sodium sulfite treatment time, oxygen saturation decreased significantly until stable. After being recharged, O2 returned to its baseline level and then decreased for the second time. The results demonstrated that the system could accurately extract the physiological parameters of a blood phantom. We found that changes in tissue oxygen saturation could interfere with NADH fluorescence detection, whereas the corrected intrinsic fluorescence spectrum of NADH was unaffected by changes in oxygen saturation (Fig.5). Finally, the blood flow-mediated tissue fluorescence system was used to measure the diffuse reflectance and fluorescence of four subjects during the brachial artery occlusion and release process. The low flow response (LFR) and high flow response (HFR) of four subjects were calculated separately. The results showed that the average values of LFR and HFR were 19.8% and 13.6%, respectively. In vivo experiments showed that after spectral recovery, the LFR and HFR decreased by 22.8% and 22.1%, respectively (Table 1). This change could be explained by the interference of oxygen saturation on the measured NADH fluorescence. Conclusions The extraction of tissue optical parameters and the recovery of intrinsic fluorescence in steady-state tissue fluorescence technology were introduced into flow-mediated tissue fluorescence measurement in this study to achieve the dynamic measurement of tissue intrinsic fluorescence spectrum in the blood flow-mediated process. The tissue phantom experiment of the distribution of different absorption, scattering, and gradient fluorescence characteristics was validated using the flow-mediated tissue fluorescence and diffuse reflectance measurement system. The results showed that the coefficient of variation of fluorescence intensity of tissue phantom with the same concentration of fluorescence components was approximately 36% under different absorption and scattering characteristics, whereas the coefficient of variation of intrinsic fluorescence intensity was less than 10%. The results demonstrated that the recovery algorithm reduced the impact of absorption and scattering properties on the detection of the intrinsic fluorescence spectrum. Furthermore, there was a significant positive linear correlation between the intensity of the intrinsic tissue fluorescence spectrum and the concentration of fluorescent components, indicating that the intrinsic tissue fluorescence spectrum could be used to detect fluorescent components quantitatively. The results of blood oxygen phantom experiments showed that the change of blood oxygen saturation would interfere with the fluorescence measurement, and the corrected tissue intrinsic fluorescence spectrum was independent of the change of oxygen saturation, which further verified the reliability of the algorithm. Finally, it was found through in vivo experiments that the blood flow-mediated tissue fluorescence may better reflect changes in NADH fluorescence in tissues by introducing the tissue optical parameters extraction and tissue intrinsic fluorescence spectrum recovery algorithm, which was expected to effectively improve the accuracy of this technology’s tissue microcirculation function evaluation.
Nov. 22, 2021Vol. 48 Issue 24 2407001 (2021)
Lixin Yin, Zhichao Liu, and Chunhui Liu
Objective The current methods for structural health monitoring are suitable for real-time monitoring of aircraft structures because they have the characteristics of the complicated measurement process, high quality,and complicated operations. Therefore, the aircraft structure state detection technology based on fiber grating sensors is becoming increasingly important. Aiming at structural deformation problems caused by strain field changes and environmental loads, the overall strain field change monitoring of the free-form surface structure is performed, and the fiber Bragg grating (FBG) array is used to measure and obtain the curvature information and strain of the structure, using structural health monitoring and three-dimensional (3D) surface reconstruction in the aircraft as the research background. To achieve the goal of real-time perception of the state of the curved surface structure, a three-dimensional reconstruction algorithm is built to reconstruct the surface structure in three dimensions.Methods The finite element model of the free-form surface structure is established using ANSYS simulation software to understand the degree of deformation of the specific surface of the test piece under different pressures. The static stress simulation software performs a numerical simulation of the strain field distribution under different loads of 0, 20, 40, 60, 80, and 100 N, which is gradually increasing. The simulation results show the strain distribution trend of the surface strain field of the free-form surface structure. The maximum deformation is 0.243 mm at 100 N, and the position of the FBG array is determined by the stress field distribution characteristics. A test system for surface position offset and three-dimensional stress field distribution is built, a free-form surface structure state sensing system based on the fiber grating sensor network is designed, and a three-dimensional reconstruction algorithm based on FBG array test data is proposed.Results and Discussions When the load is applied, we measure the center wavelength shift of the fiber grating at the positions of the six fibers, record the change in physical value at 0, 20, 40, 60, 80, and 100 N, and observe microstrain under the condition of no plastic deformation. Under different pressures, the microstrain με changes at different positions of the workpiece. The strain should have a linear functional relationship with the FBG center wavelength offset, and the three-dimensional reconstruction algorithm in section 2.2 demonstrates that the curvature is positively correlated with the fiber center wavelength offset (Fig. 6). Because the wavelength shift of the pressure points s1, s2, s3, s5, and s8 has the same changing trend when different loads are applied, we choose FBG measurement data at point s2 to compare with ANSYS simulation values and Handyscan measurement data. Similarly, data comparison experiments at s7 and s9 are conducted (Fig. 6). When the pressure of the pressure gauge is fixed at 100 N, the maximum change in the strain of the FBG strain gauge group monitored under the same force is 28.5 με -1, and the simulated value of ANSYS has the largest strain under the same force. The amount of change is 28.3 με -1. When compared to the simulated strain data, the maximum absolute error between the experimentally measured strain and the simulated value is 0.7 με -1, and the relative error is less than 2.81% (Fig. 7). It demonstrates that the FBG method of measurement has high precision and it is close to the theoretical value (Fig. 7). The test data obtained by the FBG array is close to the data measured by the Handyscan scanner using the two measurement methods. Since the Handyscan scans the center of the positioning punctuation, it deviates from the actual position, and there will be many burrs when scanning the surface. Therefore, the Handyscan measures the coordinate points before and after the force is applied to the workpiece to be tested. There is an error between the data and the ANSYS simulation value. The absolute error of Handyscan measurement data and actual measurement data is kept within 0.026 mm. The relative error of each measurement point data of the FBG reconstructed from the deformed surface and the Handyscan measurement data is kept within 6.67%, and the average relative error is less than 4.53% (Tables 1--3). Therefore, the spatial offset value in the force-bearing area reversed by the strain sensor is close to the Handyscan measurement result, which is consistent with the expected effect of the experiment. The 3D reconstruction surface obtained by the 3D reconstruction algorithm is approximately close to the surface scanned by the Handyscan. The more the pasted FBG sensors are, the closer the reconstruction effect to the actual situation is and the smaller the deviation between the reconstructed surface and the ideal surface is. It provides strong evidence that the FBG array can be used to monitor the curved structure’s state change in real-time (Figs. 8 and 9). Conclusions This paper uses the spacecraft surface structure as the research object, uses linear interpolation to continuously process the space curvature, proposes a 3D reconstruction algorithm based on the FBG array test data, and finally builds a set of surface position offsets and a 3D stress field distribution test system. This paper presents the FBG sensor network distribution design that conforms to the complex surface structure, combined with the free-form surface strain detection test, optimizes the test data corresponding to the variable sensitive position, and provides new theories and data for aircraft structural health monitoring support layout design. The free-form surface structure state sensing system and 3D surface reconstruction algorithm based on the fiber grating sensor network investigated in this paper can more accurately reconstruct and reproduce complex free-form surfaces, which not only validates the feasibility of related research ideas but also helps to further realize the spacecraft real-time perception and reconstruction of typical structural forms,therefore providing useful ideas and technical reserves.
Nov. 22, 2021Vol. 48 Issue 24 2406001 (2021)
Pengfei Xu, Xiangyang Song, Dechun Zhou, Minqiang Liu, Yanfang Peng, Jiacheng Li, and Chunlai Song
Objective Microstructure fiber (MF) has wide applications in fiber laser, fiber sensing, optical communication, and nonlinear optics owing to the controllable periodic arrangement of air holes in the cladding. It has new optical properties that distinguish it from traditional fibers, such as flexible and controllable dispersion, high birefringence, and high nonlinearity. However, the presence of dispersion will severely limit optical fiber transmission. The dispersion compensation fiber with large negative dispersion can effectively solve this problem. The birefringence of optical fiber has received a lot of attention as a result of the development of new transmission technology. There has been little research in the ~3 μm band on dispersion compensation and birefringence control. High birefringence and large negative dispersion at ~3 μm can be achieved simultaneously in another glass matrix, such as silicate glass and tellurite glass, by adjusting the waveguide structure parameters and the structure optimization design of optical fiber. However, Si-O-Si has strong vibration absorption in the infrared band, so the silica matrix material cannot meet the requirements of ~3 μm application. Moreover, tellurite glass has poor mechanical strength, so drawing fibers is difficult. Bismuthate glass has a broad infrared transmission region, good thermal stability, low phonon energy (approximately 750 cm -1), and a high refractive index. Bismuthate glass is considered an ideal gain medium material in the midinfrared band. Therefore, we proposed a new bismuthate glass microstructure fiber with high birefringence and large negative dispersion in the ~3 μm band. The proposed MF has some guiding significance for dispersion and birefringence control fiber lasers or fiber sensing in the ~3 μm band. Methods Fig.1 shows the cross-section of the proposed MF. The MF consists of three regions, rectangular fiber core, inner cladding, and outer cladding. The main structure parameters of MF include air hole diameter (din, dout), air hole lattice parameter (Λout, Λin, and Λout/Λin=3), and dimensionless parameter (dout/Λout, din/Λin). To achieve the high birefringence, we designed a solid rectangular core with a 3∶2 aspect ratio. Through the unique rectangular arrangement structure (the ratio of length to width is 3∶2), the dispersion characteristics of MF can be controlled flexibly by the dout/Λout, din/Λin. This method is used to establish the model of MF in this work, along with the perfectly matched layer boundary condition. Using the appropriate formula, we calculate the dispersion coefficient, birefringence, and effective mode field area. Note that the lattice constant of the inner cladding Λin=Λout/3 was found to be optimal in controlling both dispersion and birefringence.Results and Discussions We investigated the effect of Λout on the dispersion and birefringence characteristics of MF when the structure parameters are dout/Λout=0.68, din/Λin=0.86, Λout/Λin=3 (Fig. 4) and the peak positions of dispersion and birefringence change with different Λout. Meanwhile, the effect of Λout on the effective mode field area of MF under the same structure parameters was investigated (Fig. 5). When the structure parameters are Λout=1.5 μm, din/Λin=0.86, Λout/Λin=3, the influence of dout/Λout on the dispersion, birefringence characteristics, and effective mode field area of MF were also studied (Fig. 6, Fig. 7). When the dout/Λout is decreased from 0.70 to 0.68, the peak value of negative dispersion of y- and x-polarized fundamental modes increases by 74.3% and 50.16%, respectively. Further, when dout/Λout decreases to 0.65, y- and x-polarized fundamental modes appear anomalous dispersion at 2300~2500 nm and 2700~2900 nm, respectively. Finally, we studied the influence of din/Λin on characteristics of MF (Fig. 8, Fig. 9) when the structure parameters are Λout=1.5 μm, dout/Λout=0.68, Λout/Λin=3. In order to achieve large negative dispersion, din/Λin must larger than dout/Λout. In addition, the effect of din/Λin on the dispersion and birefringence characteristics of MF is opposite to that of Λout and dout. Similarly, Λout, dout/Λout, and din/Λin has different effects on the effective mode field area of MF.Conclusions In this paper, a new bismuthate glass microstructure fiber with high birefringence and large negative dispersion at ~3 μm band was designed. The full-vector finite element method and the perfectly matched layer boundary condition are used to investigate the effect of waveguide structure parameters on the birefringence and dispersion characteristics of the proposed fiber. The structure consists of an inner cladding with rectangular air holes and an outer layer with hexagonal air holes. The results indicated that the birefringence of the fundamental mode can reach 0.0296 and the dispersion coefficient of x-polarized fundamental mode can reach ~3204.75 ps·nm -1·km -1 at 2740 nm (corresponding to Er 3+∶ 4I11/2 → 4I13/2 emission band), when the structure parameters of MF are Λout=1.5 μm, dout/Λout=0.68, din/Λin=0.86, and Λout/Λin=3. Furthermore, by changing key structural parameters of the MF, dispersion, and birefringence can be flexibly controlled over a relatively wide range. The results show that the proposed fiber has some guiding significance in the ~3 μm band for dispersion and birefringence control fiber lasers or fiber sensing.
Nov. 16, 2021Vol. 48 Issue 24 2406002 (2021)
Chenying Qi, Changping Xu, Yangbo Bai, Bin Li, and Yinping Miao
Objective Electromagnetic fields have the substantial interference and influence on electronic device systems, and their online detection has been a persistent problem in sensor and detection technologies. Furthermore, the environmental conditions for electromagnetic field measurement are challenging, and traditional sensors are huge and have poor anti-interference ability. Optical-fiber magnetic field sensors are compact and have high sensitivity and strong environmental adaptability, which can withstand high temperature, nuclear radiation and electromagnetic interference. Therefore, it has good application potential in online electromagnetic field detection. Magnetic fluid is a new type of functional material with an adjustable refractive index, birefringence and light transmittance. It combines the characteristics of solid magnetic material with the fluidity of a liquid, making it easy to integrate with optical fiber. In this study, we propose a non-adiabatic optical-fiber magnetic field sensor, which is made by combining arc discharge with hydrogen flame heating. It can realize the rapid and accurate measurement of an external weak magnetic field. The basic strategy and research results will help in the development of a new optical-fiber magnetic field sensor.Methods First, two cascaded concave cones were fabricated on a single-mode fiber using arc discharge. The single-mode fiber with a concave cone structure was then fixed on the flame taper machine’s motor, and the hydrogen flame was manually adjusted to align with the concave cone structure for drawing. The spectrum changes during the preparation of micro-fiber were observed in real time using a spectrometer. Then, the supercontinuum source is used as the light source, and the cone is placed between the two coils. The electrified coil produces a uniform vertical magnetic field, and the voltage changes the magnetic field intensity. The effect of magnetic field intensity on the wavelength shift was investigated using a spectrometer to analyse the spectrum with the change of the magnetic field intensity.Results and Discussions The optical-fiber magnetic field sensor has high magnetic field sensitivity, with a maximum sensitivity of 193.28 pm/Oe, a detection limit of 0.187 Oe and a quality factor of 8.77×10 -3 Oe -1 (Fig. 5). When the magnetic field intensity is 0~30 Oe, the transmission spectrum remains unchanged. This is because the magnetic field intensity is small, which makes the effect on the nanoparticles too weak to change the arrangement of nanoparticles, causing the refractive index of the magnetic fluid to change slightly, and the wavelength shift to be incomprehensible. The magnetic field sensitivity of the interference peak increases with the wavelength (Fig. 6). The experimental results show that if the sensor’s sensitivity is improved, the working wavelength can be located in the long wavelength band, or the micro-fiber’s diameter can be reduced. Furthermore, the measurement range of the magnetic field intensity can be expanded by increasing the threshold value of magnetic fluid material. Because the thermal optical coefficient of the magnetic fluid is approximately -2.4×10 -4 ℃ -1 and the refractive index of the magnetic fluid changes with the external magnetic field is approximately 3×10 -2 mT -1, the influence of temperature is considerably less than that of the magnetic field. That is, when the temperature changes greatly, the spectral change caused by temperature is considerably less than that caused by magnetic field change. Thus, the influence of external temperature change on the sensor is small. Conclusions A high-sensitivity magnetic field sensor based on the integration of micro-fiber and magnetic fluid is proposed. A thin and uniform non-adiabatic micro-optical fiber is fabricated in the central region of the tapered region where the diameter of the fiber decreases sharply by combining arc discharge with hydrogen flame heating. The fiber structure has a strong evanescent field, which considerably improves the interaction between the light field and the external field. Therefore, it is more sensitive to the changes in the physical parameters of the external environment. Through integrating it with magnetic fluid, the measurement of an external weak magnetic field is realized based on the tunable refractive index of magnetic fluid. The results show that the sensitivity is 193.28 pm/Oe and the detection limit is approximately 0.187 Oe in 0--150 Oe. Further research shows that the sensor’s performance can be greatly improved by reducing the diameter of the micro-fiber and increasing its length. The sensor has the advantages of compact, low cost and simple manufacturing approach, which has potential application potential in the fields of online monitoring of the electromagnetic field in a smart grid, prospecting engineering and detection of magnetic field source.
Nov. 25, 2021Vol. 48 Issue 24 2406003 (2021)
Zhao Dong, Wenjian Wang, Huaying Wang, Zijian Zhang, Jieyu Wang, Jialiang Lei, and Xiaolei Zhang
Objective This work presents an improved phase vibration minimization (PVM)-based method for fast compensating phase aberrations in digital holographic microscopy. Polynomials are used to fit the aberrations, and the quasi-Newton optimization procedure is applied to find their coefficients. During the optimization procedure, gradients of the merit function value related to the coefficients are offered. The results of simulations and experiments show that this treatment makes the procedure fast and more reliable. Furthermore, the sampling technique is used to improve the processing speed even further. The analysis and experimental results reveal the improved method that can meet the demand for robustness to noise in everyday use. With high speed and accuracy, this method is suitable for dynamic holographic microscopic imaging.Methods This work presents an improved PVM-based method for fast compensating phase aberrations in digital holographic microscopy. We use polynomials, such as standard and Zernike polynomials, to fit the phase aberration φa. To further improve the optimization speed, formula (4) is rewritten. The rewritten formula is shown in formula (7). It is more convenient to use software such as MATLAB to compute the derivative of the optimization coefficient and then use the fminunc function in MATLAB to carry out the optimization process using the quasi-Newton method and evaluation function (7). The obtained aberration coefficient {ai} can expand the formula (2) to obtain the compensated phase. In addition, this method can conveniently use sampling technology to increase the processing speed further.Results and Discussions Simulative methods are used to verify the gradient-offered PVM-based method. This method is more accurate than the original method (Table 1). The main reason is that the maximum number of iterations set by MATLAB is 900. When the derivative of the optimized function with respect to the parameter to be optimized is not provided, the original method’s calculation process fails to converge. The improved method in this paper completes the optimization process in about 2.00 s (approximately 100 iterations), whereas the original method takes about 10.60 s to complete 900 iterations (Figs.1 and 2). This demonstrates that the improved PVM method can significantly speed up the calculation. Moreover, we used experimental methods to test the improved PVM method (Fig.3). However, the original method takes about 2.544 s to complete the optimization, whereas the improved method takes about 0.536 s. The latter method is more efficient. The improved PVM method with sampling processing can save the processing time (Fig.4). Compared to the improved PVM method without sampling, sampling saves 84% and 81% of the processing time.Conclusions The PVM-based method can accomplish phase compensation without the need for specimen-free areas. In this paper, we introduce the gradients of the merit function value M related to {ai} in the method’s nonlinear optimization process by properly processing the merit function. It becomes faster and more reliable with this treatment, according to simulation and experimental results. Furthermore, sampling can be used to reduce processing time even further. Analysis and experimental results show that the improved PVM method and that with the sampling can meet the demand for noise robustness in common use. With high speed and accuracy, the improved PVM-based methods can be used in dynamic holographic microscopic imaging.
Nov. 22, 2021Vol. 48 Issue 24 2409001 (2021)
Yantang Huang, Sheng Lin, Jingping Liu, Canxua Xu, and Tingdi Liao
Objective Stimulated Raman scattering is an important method to extend the wavelength of the laser. The self-stimulated Raman laser is a phenomenon of the pump wavelength to excite the ions of the rare-earth-doped laser gain media and generate the fundamental mode, single-frequency laser, which then generates the stimulated Raman scattering laser. The self-stimulated Raman laser reduces the optical elements in the cavity, yielding a compact laser to reduce the optical loss, and improve the performance and efficiency of the laser. Due to the high-quality factor (Q, up to 10 9) of the whispering gallery mode (WGM), the silica microcavity has been widely used in the study of nonlinear optical phenomena. The first-order self-Raman laser for Nd 3+ doped SiO2 microspheres with high Q-value has been reported. To enhance the self-Raman laser, the silica microspheres were coated with Yb 3+-Zr 4+ doped silica film using the sol-gel and immersion method. The 976 nm pump laser was coupled with a tapered optical fiber to form a highpower density WGM in the inner surface of the microspheres. The results provide a reference for the preparation of materials with a high efficiency self-stimulated Raman laser, allowing the laser to operate at 1.2--1.3 μm wavelength band which can be used in the second near-infrared window. Methods After removing the coating layer of the standard single mode fiber, the single mode fiber was heated using an alcohol lamp to form the tapered fiber. The end of the tapered fiber was fused with the electrode discharge arc and formed into SiO2 microspheres with handles for operation. The Yb 3+Zr 4+ doped silica was prepared by the sol-gel method with the Yb 3+ concentration of 4%, and the doping concentrations of Zr 4+ were 0%, 5%, 10%, and 15%. The optimal doping concentration of Zr 4+ was 10%. The sol-gel film was deposited on the surface of SiO2 microspheres via the immersion-lifting method. After drying, the film was melted using the electrode discharge arc to improve the Q-value of the coated microspheres. A 976 nm semiconductor laser was used as the pump source. Next, the pump light was coupled into the inner surface of the microsphere equator to form WGM by the tapered optical fiber. The coupling position between the tapered optical fiber and the microsphere was controlled by a three-dimensional adjusting frame and monitored by a charge-coupled device microscope. The output end of the tapered fiber was connected to an optical spectral analyzer (OSA, 600--1700 nm) to measure the transmission spectrum of the microspheres (Fig. 1). The basic frequency laser and self-Raman laser of Yb 3+-doped and Yb 3+-Zr 4+ co-doped microspheres were measured using this setup by gradually increasing the pump power. Results and Discussions The Yb 3+-doped microsphere and Yb 3+-Zr 4+ co-doped microsphere have the same diameter of 68 μm with the function film thickness of 0.5 μm. Under the 976 nm excited laser with the power of 18.5 dBm, the self-stimulated Raman scattering spectra can be observed. Three orders of the cascade self-stimulated Raman laser were obtained; the wavelength of the third-order self-Raman laser can reach up to 1295 nm (Fig. 4).Alternatively, the Yb 3+-doped microsphere obtained three cascade self-Raman lasers with the pump power of 24.3 dBm, which verified that Zr doping can enhance the self-stimulated Raman laser. Thus, the laser conversion efficiency and the threshold of the third-order self-Raman laser can be achieved (Fig. 6). The 10% doping concentration of Zr 4+ makes the third-order self-Raman laser threshold only 12% of the Yb-doped microsphere, and the conversion efficiency is 3.09 times of Yb 3+-doped, which attributes to the improvement of the high polarization of the silica bond by Zr 4+ doping, thereby increasing the phonon vibration and Raman gain coefficient of the silica. According to the results, the Raman gain coefficient of the microsphere material with and without Zr 4+doping is estimated and then compared; the results show that the Yb 3+ 4% mol/Zr 4+ 10% mol doped silica increases the Raman gain factor by 18.966 times compared to the Yb 3+4% mol doped silica. Conclusions In this study, the phenomenon of the self-stimulated Raman laser enhancement is investigated using a high Q-value microsphere cavity coupled with a tapered optical fiber. The SiO2 microspheres were coated with Yb 3+ or Yb 3+/Zr 4+ doped SiO2 thin films via the sol-gel adhesive coating method. Theoretical analysis shows that the Zr 4+ ion doped films can increase the susceptibility of the rare-earth-doped gain media and increase the Raman gain factor as well as increase the film’s refractive index to result in gathering WGMs, thereby reducing the mode volume and increasing the power density of the WGM. Both effects can reduce the Raman laser threshold and improve the efficiency of the self-stimulated Raman laser. When compared with the Yb 3+-doped silica microsphere, the experimental results show that the silica microsphere with co-doping concentration of 4% mol Yb 3+/10 mol% Zr 4+increases the Raman gain coefficient by 19 times, the slope efficiency of the third-order self-stimulated Raman laser increases by 3.09 times, and the third-order self-stimulated wavelength extends to 1295 nm. The enhancement effect of the self-stimulated Raman laser of the Yb 3+ /Zr 4+ co-doped silica microspheres is consistent with the theoretical analysis.
Nov. 22, 2021Vol. 48 Issue 24 2401001 (2021)
Quanping Zhao, Haiying Song, Yang Wang, Xun Liu, Wei Li, and Shibing Liu
Objective In the research of inertial confinement fusion, the conventional center ignition scheme has very high requirements on the uniformity and symmetry of deuterium-tritium(D-T) pellet pellet compression and driver energy. To reduce these requirements, a fast ignition scheme has been proposed. In this scheme, the pellet would be first compressed to a state of high temperature and density, and then, the plasma would be driven by a short high-intensity laser pulse to produce several MeV magnitude hot electrons, which would then need to travel for a distance of dozens of micrometers to deposit their energy into a small volume of the pellet, igniting the pellet. Finally, fusion would be realized. Therefore, the fast ignition scheme needs a high beam quality of hot electrons. However, the Weibel, filament, and two-stream instabilities may decrease the beam quality of hot electrons during their transmission, which severely restricts the realization of the fast ignition scheme of inertial confinement fusion. In this study, a conical-entry-multilayer target is proposed to improve the collimation and transport efficiency of hot electrons. We hope that the model established in this study has a good significance for improving the beam quality of hot electrons in fast ignition.Methods In this study, the generation and transport characteristics of hot electrons in the interaction between an intense laser and the conical-entry-multilayer target are investigated using the two-dimensional particle-in-cell simulation program Vorpal. We design two types of targets, namely, multilayer target and conical-entry-multilayer target. The multilayer target is mainly used as a reference to determine whether the conical-entry-multilayer target can improve the collimation and transport efficiency of hot electrons. By comparing the energy density distribution, longitudinal and transverse distribution, energy spectrum, and divergence angle distribution of hot electrons in the two targets, it is proved that the collimation and transport efficiency of hot electrons in the conical-entry-multilayer target is higher than that of hot electrons in the multilayer target. By analyzing the generation mechanism and transport process of hot electrons in the conical-entry-multilayer target, the reasons for the enhancement of collimation and transport efficiency of hot electrons in the conical-entry-multilayer targets are clarified.Results and Discussions Compared with the multilayer target with no cone structure, in the conical-entry-multilayer target, the energy density of hot electrons near the y-axis in the region of x>12λ0 is increased (Fig. 2). In the multilayer target, the temperature of hot electrons behind the target is 0.73 MeV, and in the conical-entry-multilayer target, hot electrons behind the target can be divided into three parts, and their temperatures are 0.80, 1.31, and 13.17 MeV (Fig. 4). The results show that the temperatures of hot electrons in the conical-entry-multilayer target are higher. The divergence angle of hot electrons in both targets can be controlled mainly in the range of -38°--38°, but the energy of hot electrons with divergence angle between -38° and 38° in the conical-entry-multilayer target increases by ~0.6 times compared with that in the multilayer target (Fig. 4). The above results show that the collimation and transport efficiency of hot electrons in the conical-entry-multilayer target is higher than that of hot electrons in the multilayer target. There are three reasons for the efficiency enhancement: first, several hot electrons are pulled out from the cone wall using the laser (Fig. 5), and these hot electrons are guided to the rear of the target, which directly increases the hot electron current at the rear of the target; second, the focusing effect of the cone wall on the laser enhances the ponderomotive force near the cone tip (Fig. 6), and thus, the number and energy of hot electrons generated by the ponderomotive force acceleration near the cone tip increase significantly; third, a stronger self-generated magnetic field distribution is generated behind the cone tip (Fig. 8), and a stronger self-generated magnetic field distribution has a stronger binding effect on hot electrons.Conclusions In this study, the collimation and transport characteristics of hot electrons generated in the interaction between an intense laser and the conical-entry-multilayer target are investigated. The results are compared with those in the multilayer target without a cone structure. It is demonstrated that hot electrons in the conical-entry-multilayer target are more numerous, more energetic, and more spatially concentrated than those in the multilayer target, the energy of hot electrons with divergence angle between -38° and 38° increases by ~0.6 times, and the collimation and transport efficiency of hot electrons can be improved using the conical-entry-multilayer target. The main reasons for the enhancement of the collimation and transport efficiency of hot electrons in the conical-entry-multilayer target are as follows: first, the laser pulls a large number of hot electrons out of the cone wall; second, the focusing effect of the cone wall on the laser enhances its ponderomotive force; and third, a stronger self-generated magnetic field distribution is generated behind the cone tip.
Nov. 16, 2021Vol. 48 Issue 24 2401002 (2021)
Wenhui Cui, Jianqiang Zhu, Yuanqi He, Zhigang Liu, Quantang Fan, Weiheng Lin, and Ziming Dong
Objective The high power laser facility for inertial confinement fusion (ICF) is a large scientific project with ultraprecision, long optical path, and many precision components. Any optical interference caused by environmental vibration, acoustic vibration, or thermal gradient reduces the aiming accuracy and success rate. The confocal lens pair in the spatial filter is the most important component of SG-Ⅱ series devices. Considering the phenomenon where the beam propagation of the confocal lens pair of the long optical path spatial filter deviates from the ideal optical axis and causes poor pointing stability, the existing solutions involve processing the optical elements with higher accuracy or using the beam stabilization technology. Neither of the two solutions starts from the root, and the vibration response of the optomechanical structure affects the beam-pointing stability. The beam-pointing stability has been analyzed by assuming that the structure’s vibration is known but the structure’s transmission characteristics under excitation have not been analyzed. Further, active damping dynamic vibration absorption can be used to analyze the pointing stability of the ICF facility, but the theoretical analysis has not been reported. Therefore, studying the beam-pointing convergence accuracy from the perspective of optical mechanical structure vibration control is necessary.Methods The full link beam propagation model of SG-Ⅱ series facilities was established, and an optomechanical coupling system of spatial filter based on active damping dynamic vibration absorption principle was provided. The peak value formula of the spatial filter’s output optical angular response was derived, and an adaptive fuzzy proportional-integral-derivative (PID) active controller was designed to realize control parameter self-tuning. The influence of active control parameters on the peak value of output optical angular response was analyzed. The control efficiency was defined, and the control parameters were optimized. The adaptive fuzzy PID control algorithm realized the adaptive tuning of the damping. The active damping dynamic vibration absorption control was conducted for the shooting deviation of SG-Ⅱ series facilities. The calculation formula of the shooting deviation of the spatial filter was derived. It analyzed the control effect of space filter shooting deviation of SG-Ⅱ series facilities before and after active damping dynamic vibration absorption by adaptive fuzzy PID control.Results and Discussions The peak value of output optical angular response degenerates from two formants to one formant with the change of excitation frequency, and velocity feedback gains control parameter gP. With increasing control parameters, the maximum value of output optical angular response first decreases and then increases, indicating that there is an optimal velocity feedback gain to minimize the peak value of output optical angular response. The response amplitude of the entire frequency domain is controlled below the optimal parameter’s peak value [Fig. 8(a)]. When gP is 80, the parameters are optimal, and the control efficiency is the highest, reaching 75.9% [Fig. 9(a)]. When the excitation frequency and the displacement feedback gain control parameter gI change, the peak value of the output optical angle response is positively correlated in 18--20 Hz and above 28 Hz and negatively correlated below 18 Hz and in 20--28 Hz. The overall tuning control amplitude is small, and the narrow-band excitation frequency band even increases the peak value of the output optical angle response, making it unsuitable for peak value control of the output optical in the full frequency domain [Figs. 8(b) and 9(b)]. The maximum target deviation of the spatial filter of the SG-Ⅱ facility appears in the sixth stage, and the output deviation after optimal control of active damping dynamic vibration absorption is 1.23 μm (Table 4 and Fig. 11). The maximum target deviation of the spatial filter of the SG-Ⅱ high-energy laser system appears in the seventh level, and the output deviation after the optimal control of active damping dynamic vibration absorption is 4.52 μm (Table 5 and Fig. 12). Compared with the later spatial filters, the 0-, 1-, and 2-stage spatial filters can achieve the function of shooting deviation without dynamic vibration absorber, and the 3-stage spatial filter only requires a passive damping dynamic vibration absorber. The maximum target deviation of the SG-Ⅱ spatial filter upgrading facility appears in the fifth to eighth level. After optimal control of active damping dynamic vibration absorption, the output deviation is 3.29 μm (Table 6 and Fig. 13). After controlling the active damping absorber, the shooting accuracy of the SG-Ⅱ facility is reduced from 5.42 μm to 1.30 μm, the shooting accuracy of the SG-Ⅱ high energy laser system is reduced from 7.67 μm to 1.87 μm, and the shooting accuracy of SG-Ⅱ upgrading facility is reduced from 6.52 μm to 1.57 μm. After designing the passive damping absorber, the active damping absorber can tune the damping to the optimal value according to the specific working conditions. Therefore, the effect of dynamic vibration absorbers is better than that of passive damping (Table 7).Conclusions When the active damping dynamic vibration absorber is tuned to optimal damping, the shooting deviation is reduced by 75.9% compared with the traditional method. At the same time, the passive damping dynamic vibration absorber reduces shooting deviation by about 31% compared with the traditional method. Additionally, the active damping dynamic vibration absorber can adjust the velocity feedback gain based on the shooting deviation. Consequently, the control efficiency varies from 31.0% to 75.9%, which realizes the feedback function of adaptive adjustment. Therefore, this method has a good application prospect for improving the shooting performance of laser facilities in service.
Nov. 16, 2021Vol. 48 Issue 24 2401003 (2021)
Lei Wei, Bao Li, Guo Chen, Cong Fang, Long Han, Ligang Yuan, Decheng Wu, Youbao Ni, and Yingjian Wang
Objective An 8--15-μm long-wave infrared (IR) laser has less transmission loss in the atmosphere; therefore, it can be used for gas detection, free-space optical communications and IR electro-optic confrontation. CO2 and ZnGeP2 optical parametric oscillator (OPO) lasers have been used to output long-wave lasers, although it is difficult to output lasers with wavelengths longer than 12 μm. Moreover, research on such lasers is inadequate. In this study, we design a CdSe OPO scheme and experimentally test its long-wave IR output. The results show that lasers with wavelength larger than 12 μm can be obtained by using CdSe OPO, which provides a solution for obtaining lasers with longer wavelengths.Methods The scheme of the OPO-based long-wave IR laser pumped using a 2-μm laser is discussed, in which the selection of a non-linear long-wave IR crystal is included. In this scheme, the selected non-linear crystal is CdSe and the selected pumping laser source is 2.05 μm Ho∶YLF laser with a maximum output power of 40 W (frequency is 5 kHz). The two end faces of the CdSe crystal are polished and coated with an anti-reflection film at 2,2.4--2.7 and 10--13 μm bands, which are the key processes for reducing the optical loss and risk of damage in the crystal. The resonator of the OPO is a flat cavity, and the resonant mode is a single-resonance OPO. The Ho∶YLF laser is linearly polarised, which is helpful for CdSe OPOs to achieve a high optical-to-optical conversion efficiency. The Ho∶YLF laser pulsed using an acousto-optic Q-switch is pumped via a Tm∶YAP laser continuous wave with a 1.94-μm wavelength and 78-W maximum output power. The Q-switch and all crystals are wrapped in thin indium foils and placed in red copper heat sinks to collect the heat absorbed by them. During the experimental apparatus operation, there is water flow at 20 ℃ in all heat sinks and a microchannel structure for the water flow is indicated. Finally, the typical parameters of the long-wave IR laser are measured, including average power wavelength laser beam quality repetition rate and pulse duration.Results and Discussions The laser experimental apparatus (corresponding to the above-mentioned scheme) output long-wave laser with a wavelength longer than 12 μm. The long-wave laser is generated when the 2.05-μm pulsed laser with a 14-W average power is injected. The maximum output power of the long-wave laser is 526 mW when the 2.05-μm pulsed laser with a 36-W average power is injected (Fig.7); therefore, the corresponding optical-to-optical conversion and slope efficiencies are up to 1.46% and 23.4%, respectively. A spectrum analyser is employed to measure the spectrum of the long-wave laser with 504-mW output power, and the peak wavelength is 12.52 μm (Fig.8). A charge-coupled device laser beam analyser is employed to measure the laser beam quality factor M2 of the long-wave laser with 504-mW output power. The focussing lens method is used for the measurements. After the measurements, the M2 factor is 4.3 and 3.2 in the X and Y directions, respectively (Fig.9). The pulse parameters, including 5-kHz repetition frequency and 24.4-ns pulse width (Fig.10), are measured using a photoelectric detector. After calculation, the energy of the single-pulse laser is 0.1 mJ and the peak power is 4.3 kW. Finally, the CdSe crystal is rotated to change the phase-matching angle, and the maximum wavelength is 12.8 μm (Fig.11). Conclusions We verify that a CdSe OPO is feasible to realise a long-wave laser output. First, the phase-matching mode and the phase-matching angle of the CdSe crystal are analysed and designed according to the principle that the output laser wavelength of CdSe OPO corresponds to the phase-matching angle. Second, to realise a 12-μm laser, the CdSe crystal is processed according to the phase-matching angle. Third, an experimental apparatus is set up and the effect of the long-wave CdSe OPO laser is verified; the CdSe OPO laser is pumped using the 2.05-μm Ho∶YLF pulsed laser to generate long-wave lasers with a wavelength longer than 12 μm. In the future, long-wave IR lasers with longer wavelengths can be achieved just by reducing the phase-matching angle of the CdSe crystal, such as changing the cutting or incident angle of the pump laser.
Nov. 25, 2021Vol. 48 Issue 24 2401004 (2021)
Naling Zhang, Hongqi Jing, Qinghe Yuan, Li Zhong, Suping Liu, and Xiaoyu Ma
Objective In recent years, the quantum well mixing technology has been widely used in photonic integrated circuits, optoelectronic integrated circuits, and high-power semiconductor lasers with non-absorbing window structures. As for impurity-free vacancy induced quantum well mixing, due to the fact that there is no introduction of impurities, the process is simple, the cost is low, and the epitaxial wafer can maintain high lattice quality after quantum well mixing. The current literature reports are focused on the theoretical research, the exploration of experimental conditions, and the performance analysis of the related devices, but the reports on the influence of epitaxial structure on impurity-free vacancy induced quantum well mixing are still blank. In this article, the rapid thermal annealing experiment is carried out on the epitaxial wafers with different Al composition concentration waveguide layers and confinement layers, the influence of epitaxial structure on quantum well mixing is discussed, and the experimental results are theoretically analyzed and discussed. The research results provide a reference for the theoretical study of impurity-free vacancy induced quantum well mixing and the design of epitaxial structure of the device.Methods Firstly, the InGaAs/GaAs single quantum well epitaxial wafer is grown using the metal-organic chemical vapor deposition equipment, the sample 1 is a high-aluminum structure, and the sample 2 is a low-aluminum structure, whose detailed epitaxial structures are shown in Figs. 1(a) and 1(b), respectively. Second, the 200 nm SiO2 dielectric film is grown on the surface of the samples 1 and 2 using the plasma enhanced chemical vapor deposition equipment. Then, the samples 1 and 2 are carried to a rapid thermal annealing treatment under different annealing temperature and time conditions. Finally, the PL spectral test is performed on the samples 1 and 2, and the experimental results are analyzed and discussed focusing on the influence of epitaxial structure on impurity-free vacancy-induced quantum well mixing.Results and Discussions Firstly, the influence of annealing temperature on impurity-free vacancy induced quantum well mixing is analyzed. The wavelength blue shifts of these two samples are 20--50 nm in the range of 865--905 ℃. The wavelength blue shift gradually increases (Fig. 2) and the PL spectral intensity gradually decreases (Fig. 3) as the annealing temperature increases. The wavelength blue shifts of these two samples do not increase when the annealing temperature is greater than 895 ℃. Under the same experimental conditions, the wavelength blue shift of the sample 2 with a low aluminum structure is larger than that of the sample 1 with a high aluminum structure (Fig. 2), and the PL spectral intensity of the sample 2 decreases less (Fig. 3). Second, based on the influence of annealing temperature on impurity-free vacancy induced quantum well mixing, the influence of annealing time on impurity-free vacancy induced quantum well mixing is also studied. Under the condition of 875 ℃, with the increase of annealing time, the wavelength blue shift of the sample 2 gradually increases, and the PL spectral intensity gradually decreases.Conclusions The influence of epitaxial structure on impurity-free vacancy induced quantum well mixing is discussed. The experimental results show that under the same experimental conditions, the sample 2 with a low-aluminum structure has a greater wavelength blue shift, and the PL spectral peak intensity decreases less. This shows that as for impurity-free vacancy induced quantum well mixng, Al and Ga in the epitaxial structure have different influences on the diffusion of point defects, and Ga is more conducive to the diffusion of point defects. According to the experimental results, we propose the following hypotheses: 1) when the InGaAs/GaAs quantum well epitaxial structure produces impurity-free vacancy-induced quantum well mixing, it is mainly induced by Ga vacancy diffusion, and the degree of quantum well mixing is proportional to the logarithmic function of Ga vacancy concentration; 2) when Ga vacancies generated in the cap layer of the epitaxial wafer diffuse downward and Si atoms diffuse into the epitaxial wafer and move in the epitaxial wafer, the Ga atoms in the lower layer are easier to occupy the upper Ga vacancies than Al atoms, and the Si atoms are easier to replace Ga Atoms, therefore, compared with Al atoms, Ga atoms are more likely to cause point defect Ga vacancies and Si atoms to diffuse downward.
Nov. 16, 2021Vol. 48 Issue 24 2403001 (2021)
Bing Peng, Aihuan Dun, Lunzhe Wu, Zhe Wang, and Xueke Xu
Objective Fused silica glass has been widely used in high power laser systems and advanced optoelectronic devices, because of its good optical, thermal, and mechanical properties. The traditional optical fabrication methods are easy to cause scratches, cracks, and defects on the surface of fused silica, making the fused silica optical elements become the bottleneck restricting the development of high power laser systems, optical systems, and advanced optoelectronic devices. It is difficult to process small and complex faceted fused silica optical elements due to its high cost and time consumption. Atmospheric pressure plasma polishing (APPP), as an alternative non-contact processing method, has the advantages of non-destruction, high precision, high efficiency, low cost, and improved flexibility. The essence of APPP is a chemical reaction to generate volatile gas and achieve non-destructive removal. At present, it has been shown that it has the potential to solve the problem of processing fused quartz optical elements. However, in the actual processing process, the processing results always present the phenomenon of low convergence rate due to the different removal amount in unit time caused by the different dwell time at each processing point in the process. In this study, a variable removal function is proposed to solve the problem of nonlinear removals. The specific method is to change the single removal function in the traditional APPP process into a variable removal function that varies with the relative residence time. We hope that the nonlinear effect can be eliminated by using the variable removal function, and the actual convergence rate and machining accuracy are improved.Methods In this paper, a 120 mm×65 mm×10 mm fused silica optical element is used as the research object. Firstly, the processing parameters such as flow rate and power are optimized to obtain a stable processing removal function. Second, several groups of removal functions are obtained on the fused silica element at different speeds, which confirms the existence of a nonlinear effect. The relationship between the nonlinear effect and the Arrhenius formula is verified by the temperature field distribution of the element surface measured by the thermal imager and the simulation analysis. Third, it is necessary to explore whether the nonlinear changes of processing residue and removal amount with speed are related or not. In the optical element surface deposition layer, the residue increases from left to right, and a removal function experiment in this deposited layer is performed. Finally, the amount of removal under different residual thicknesses is extracted by a profilometer. The correlation between the residuals and the nonlinear effect is determined according to the experimental results. After that, the coefficients of several groups of removal functions at different speeds are extracted and fitted, and the variable removal function is written based on the fitting function. The variable removal function is used for the actual processing, and the processing effect is compared with that by the original single removal function to verify whether the processing effect is improved or not.Results and Discussions Firstly, the processing parameters are optimized, and each gas flow rate is balanced to make the material removal amount reach a stable state. At this time, the optimal parameters are the He flow rate of 2.5 L /min, the CF4 flow rate of 70 mL/min, the O2 flow rate of 50 mL/min, and the power of 170 W (Fig. 10). The experimental results confirm that the removal amount presents a nonlinear trend with time at each feeding speed (Fig. 5). After extracting and fitting the coefficients of each removal function, it is found that both the fitting function and the Arrhenius function are inverted exponential functions,and it is confirmed that the removal function is positively proportional to the Arrhenius function (Fig. 9). The influence of residues during processing on subsequent removals is compared with the removal amount under each deposition amount extracted by a profilometer. It is found that there is little difference between the removal amounts, which proves that the influence of sediment on the nonlinear effect of removal amounts is not obvious (Fig. 8). The fitting variable removal function is used for actual processing and compared with the traditional single removal function processing experiment. Compared with the processing speed distribution before processing, it is found that the speed distribution of the variable removal function is more average and clustered. After actual processing, the PV convergence rate increases from 21.4% to 65.6%, the RMS convergence rate increases from 24.1% to 72.7%, and the final processing result reaches 110λ, which perfectly completes the ultra-smooth processing of optical components (Fig.12).Conclusions In this study, it is found that the convergence rate of fused silica processed by atmospheric pressure plasma polishing is not high due to the nonlinear effect of removal functions with different dwell times. The reasons for the nonlinear effect are analyzed, and it is verified by experiments that there is little relationship between the residue and the nonlinear effect in the processing. A new machining method is proposed to change the traditional single removal function into a variable removal function. The processing algorithm of the variable removal function is applied to the actual processing. The control experiment discloses that the PV convergence rate changes from 21.4% to 65.6%, and the RMS convergence rate changes from 24.1% to 76.7%. The PV value of the final surface shape of an optical element reaches 110λ, indicating the realization of ultra-precision machining of optical elements.
Nov. 16, 2021Vol. 48 Issue 24 2403002 (2021)
Xiuhua Fu, Junwei Li, Gong Zhang, Jing Zhang, Haijun Jin, and Shuang Li
Objective Cyclic olefin copolymer (COC) is a kind of amorphous polymer material which attracts more and more attention in recent years, and it has many advantages such as high transmittance covering the full spectrum, low birefringence coefficient, very low water absorption, low density, not fragile, high Abbe number, stable chemical properties, acid and alkali resistance, and excellent mechanical properties. Compared with traditional transparent plastics such as polymethyl methacrylate (PMMA) and polycarbonate (PC), COC not only has the same optical performance as PMMA, but also has higher temperature resistance than it. And these characteristics are the excellent properties needed for the preparation of optical elements. Therefore, COC is considered as an ideal substitute material for PC, PMMA, polystyrene, polyvinyl chloride, and some engineering plastics, and has a good development prospect in the optical field. However, COC is similar to traditional polymer materials due to its high coefficient of thermal expansion, and thus film cracking or shedding occurs due to the temperature change during or after film coating. There are many domestic and foreign researches on the deposition of optical films on the surface of PC and PMMA, but there are few reports on the use of COC as the substrate, although COC has good performances in the visible band. Therefore, this paper mainly designs and develops the anti-reflection film for the band of 400--700 nm, and conducts researches on how to improve the adhesion and environmental resistance of optical films on the COC surface.Methods The material characteristics are analyzed according to the thin film thermal stress theory, and the ZrO2 with the smallest thermal stress is selected as the adhesive layer by calculating the thermal stress between the first layer material and the substrate. The plasma treatment time of the substrate surface is studied. The XPS test is performed on the surface of the treated sample to find a solution with a relatively high surface oxygen content, and the technological parameters are optimized to solve the problem of film shedding due to the mismatch between the coefficients of thermal expansion of the film and the substrate. It is found that the film layer of the sample after the film pulling test is not completely fell off. Firstly, the shedding position from the spectral curve of the sample is analyzed, and then through the analysis of the moment of film, the transition layer is coated, which improves the adhesion between the coating and the adhesive layer. Finally, the samples with the two structures are tested by SEM. Through the analysis of the micrograph of the film cracking sample after the constant temperature and humidity test, it is found that the film layer is not compact enough, which causes the water vapor to enter the film layer during the test and to change the stress, and the technology of ion beam bombardment after coating is used to increase the film filling density.Results and Discussions The effect of plasma treatment under different time on the content of chemical elements and functional groups on the surface of the substrate is studied (Fig. 4), and the technological parameters are optimized to increase the activity of substrate surface and improve the adhesion between the substrate and the coating. The thermal stresses of different materials with COC as the substrate are analyzed (Table 2), and the ZrO2 with the smallest thermal stress is selected as the adhesive layer, which solves the problem of film shedding due to the mismatch between the coefficients of thermal expansion of the film and the substrate. The film layer of the shedding sample is analyzed by the moment of film, and the adhesive layer L5 is coated in the middle, so that the film layers can infiltrate and form chemical bonds on the basis of moment matching (Fig. 7), which greatly improves the adhesion between the film layers. The technology of ion beam bombardment after coating solves the problem of low film aggregation density caused by non-heating in the film formation process (Table 6), and makes the sample pass the constant temperature and humidity test.Conclusions In this paper, the cyclic olefin copolymer is used as the substrate to study the properties of the substrate and the film material. And ZrO2 is selected as the adhesive layer and the surface of the substrate is treated with plasma to improve the adhesion between the film and the substrate. Then the moment between the film layers is analyzed and the L5 is selected as the transition layer material to combine the adhesive layer with the coating, so that the film layers can infiltrate and form chemical bonds on the basis of moment matching, which greatly improves the adhesion between the film layers. The technology of ion beam bombardment after coating solves the problem of film cracking in the constant temperature and humidity test due to the non-compact film layer. The test results show that the average reflectivity of the anti-reflection film at 400--700 nm is 0.117%. Furthermore, the anti-reflection film can pass the film adhesion test, the high and low temperature test, and the constant temperature and humidity test, and possesses good environmental adaptability.
Nov. 16, 2021Vol. 48 Issue 24 2403003 (2021)
Hongyu He, Jianfeng Sun, Zhiyong Lu, Haisheng Cong, Ronglei Han, Weijie Ren, Longkun Zhang, Chaoyang Li, and Yuxin Jiang
Objective The phase-shift laser ranging technique, which can achieve millimeter accuracy over medium and long distances, is widely used in the aerospace field, such as docking of spacecraft and landing on extraterrestrial planets, as well as civil fields such as three-dimensional mapping and vehicle-mounted lidar. In a previous study, we proposed a phase-shift laser range finder based on optical carrier phase modulation. Comparing with the traditional intensity-modulated phase-shift laser range finder, the technique shows excellent advantages such as simplification of modulation and demodulation, ability to measure range and velocity precisely at the same time. The technique combined the advantage of traditional intensity-modulated phase-type laser ranging technology and coherent laser ranging technology. This paper aims to conduct additional research on the technique to make it usable in the field. The system has been improved in several ways, including using a separate transmitting-receiving (T-R) optical system, using a heterodyne detection method, and the proposal of a feasible algorithm to improve system sensitivity.Methods First, the experimental system of phase-shift laser range finder based on carrier phase modulation using heterodyne detection is descripted (Fig. 1). The balanced detector’s output signal equation is deduced. Second, the algorithm’s thoughts are presented, and the algorithm’s steps are demonstrated. Finally, the effect of background light on the system signal-to-noise ratio is discussed. The condition of ignoring background light is discussed. An experimental setup using heterodyne detection is built. The parameter of the experiment equipment are as follows, the linewidth of the laser is less than 100 kHz, the frequency shift of the acoustic-optical modulator is 1 MHz, the half-wave voltage of the phase modulator is 4 V and its bandwidth is 300 MHz, the bandwidth of balanced detector is 26 MHz, receiving aperture of an optical system is 8 mm, the center wavelength and full width of half maximum are 1550 nm and 10 nm respectively. In the experiment, the light power of the erbium-doped optical fiber amplifier (EDFA) is 500 mW, the frequency and amplitude of the input signal of the phase modulator is 200 kHz and 2 V. The oscilloscope’s sample rate is 10 MHz, and every 10000 sample point is cut to process and calculate, which makes the measurement period is 1 ms. A series of the experiment is conducted. A different distance from the target is measured, and the linearity of the distance measurement is discussed. The precision of range and velocity measurements is estimated after multiple measurements. Furthermore, the range and velocity of the moving target (a pedestrian) are measured to test the system’s ability to move targets. Finally, the ability of the proposed system to resist background light interference was tested by measuring the noise’s root mean square value (RMS) under various background light conditions.Results and Discussions A linear model can fit the relationship between measured and actual distance (Table 1), and its intercede is 20.478 m. The intercede shows the transmission length of the RF signal inside the system unit. A target at a distance of 75.7 m is measured (Fig. 7), the average (AVG) of the measured distance is 96.18 m, the root mean square error (RMSE) is 0.93 m. The AVG and RMSE of measured velocity, respectively, are 1.18×10 -4m/s and 5.48×10 -4m/s. A moving target (a pedestrian) at a distance of 71.5 m is measured (Fig. 8). AVG of the measured distance is 71.83 m, and the RMSE of the distance measurement is 1.39 m. The measured speed is approximately 1 m/s, which corresponds to the speed of pedestrian movement. When the system is looking directly at the sun, the noise of the balanced detector is acquired, with the target surface illuminated by the sun and blocking the receiving aperture. The RMS of noise hardly changed in different conditions, indicating that the proposed system can withstand interference from sunlight (Table 1). Conclusions This paper improves the phase-shift laser range finder based on carrier phase modulation. The basic principle of the system is deduced, an algorithm can calculate range and velocity by analyzing frequency spectrum is proposed, experiment setup uses transmit-receive separate optical system and heterodyne detection methods. The range and velocity measurement in the field was carried out when the modulation frequency of phase modulator is 200 kHz, power of the emitted signal is 500 mW. The distance of the target is 75.5 m. The precision of range and velocity is 0.93 m and 5.48×10 -4 m/s. Notably, the measurement range of the system is 750 m, and the accuracy of the phase measurement of the system is 0.22°. The measuring frequency is 1 kHz. A moving target is measured in the same conditions. The precision of the moving target is also high. Besides, the system’s noise in different background light conditions hardly changed, which shows that the proposed system has a strong ability to resist background light interference. The anti-interference ability and sensitivity of the system have been greatly improved as a result of the field experiment results, and it can adapt to the working conditions of the field. As a result, it will have a wide range of applications in the future.
Nov. 16, 2021Vol. 48 Issue 24 2404001 (2021)
Ziming Dong, Yanan Zhang, Zhigang Liu, Xiang Jiao, Jianqiang Zhu, Wenhui Cui, and Weiheng Lin
Objective With the advancement of high-power laser technology, the optical components that affect the system’s beam quality indicators are subjected to more stringent standards. Due to its properties of precise control of the surface shape and rapid development, computer-controlled optical surfacing technology has become an important processing method for creating high-quality optical components. Dual-rotor polishing technology, which is a type of computer-controlled small tool polishing technology, is one of them. It can achieve a steady and controllable removal function, which is vital in the surface processing of optical components. The removal function of Gaussian shape is ideal in computer-controlled optical surface cleaning. However, traditional dual-rotor motion polishing produces a substantial deviation from the Gaussian removal function and is not smooth enough, resulting in a mid-spatial-frequency error on the polished surface, which impacts the performance of the high-power laser system. The main cause of the mid-spatial-frequency error caused by small tools polishing is the simple repetition of the processing trajectory and the low precision of the removal function form. To address this issue, we have proposed a new small tool motion-polishing method that optimizes the two aspects of the removal function shape and processing trajectory to better suppress the mid-spatial-frequency error in this study.Methods This study proposes an eccentric dual-rotor motion based on the traditional dual-rotor motion. The cross-sectional shape of the removal function through the center and the Gaussian curve are evaluated by establishing the motion model of the eccentric dual-rotor and using the goodness of fit as the evaluation index to optimize the removal function shape and obtain the range of process parameters that can produce the Gaussian removal function. To demonstrate the suppression effect of the removal function on the mid-spatial-frequency error, a mathematical model of the direction removal characteristic is proposed to evaluate how much removal direction a point on the removal function receives and whether the removal amount in each direction is uniform. The removal function of the dual-rotor motion and the eccentric dual-rotor motion are compared in the fixed-point polishing experiment. The suppressing effect of the dual-rotor motion and eccentric dual-rotor motion on the mid-spatial-frequency error is compared in grating track numerical control polishing experiment.Results and Discussion A removal function that is closer to Gaussian shape than the motion of the dual-rotor is obtained from the optimization range of the simulation process parameters (Fig.5) and the fitted R2=0.9986. Comparison of simulation results of direction removal characteristic between dual-rotor motion and eccentric dual-rotor motion is shown(Fig. 8 and Table 2). It shows that the eccentric dual-rotor motion has better direction removal characteristic than the traditional dual-rotor motion, and theoretically has a better suppression effect on the mid-spatial-frequency error. The fixed-point polishing experiment compares the removal function shape of the traditional dual-rotor motion and the eccentric dual-rotor motion and obtaines the removal function shape, which is closer to the Gaussian removal function shape than the dual-rotor motion, the R2=0.9895 (Figs.10 and 11 and Table 3). The eccentric dual-rotor motion PSD curve obtained by the grating track numerical control polishing experiment is below the limit line, and the error ratio of eccentric dual-motor motion at frequency of 1 mm -1 and below is smaller than that of the motion of the dual-rotor, indicating that the eccentric dual-rotor removal function can better suppress the mid-spatial- frequency error (Figs.14 and 16), which verifies the correctness of the simulation analysis of the direction removal characteristic. Conclusions The key parameters of the eccentric dual-rotor motion model were investigated and optimized theoretically in this study, and the Gaussian removal function of theoretical R2=0.9986 was obtained. The Gaussian removal function can theoretically be obtained within a considerable optimization range. Also the direction removal characteristic model is established, which shows that the removal function of the eccentric dual-rotor is more uniform and has a better suppression effect on the mid-spatial-frequency error. A fixed-point polishing experiment is used to examine the removal function of dual-rotor and eccentric dual-rotor. The eccentric dual-rotor motion obtains a removal function closer to the Gaussian shape than the dual-rotor motion, and its R2=0.9895. The effects of dual-rotor and eccentric dual-rotor motion on suppressing mid-spatial-frequency error are compared in the numerical control-grating track polishing experiment. Among them, the PSD curve of the dual-rotor motion partially exceeds the limit line, and the PSD curve obtained from the eccentric dual-rotor motion is below the limit line and has a better suppression effect on the mid-spatial-frequency error of less than 1 mm -1, indicating that the eccentric dual-rotor motion has a better suppression effect on the mid-spatial-frequency error. The above results verify the correctness of the direction removal characteristic and have guiding significance for the actual processing.
Nov. 22, 2021Vol. 48 Issue 24 2404002 (2021)
Fei Dai, Kai Wang, Wei Lin, Jun Li, and Haile Lei
Objective Gifford-McMahon (GM) cryocooler without liquid helium has gradually become the primary method to obtain a low-temperature environment, but the typical vibration displacement is about ±14.6 μm at the second-cold stage when the compressor is operated at 50 Hz. This vibration is still too high for some applications, such as optical interference, cryogenic microwave oscillators, X-ray phase-contrast imaging, and other precision systems that require submicron-level vibration control on the sample holder. We have developed a vibration-free cryostat using GM cryocooler years ago and measured the vibrations of the sample holder using the high-speed microscopic vision method. However, a more accurate method is needed to analyze its vibration to provide reference data for further reducing the vibration of the sample holder. Moreover, the direct contact measurement method will destroy the eigenfrequency of the system, resulting in the deviation of results from the real value. Therefore, the non-contact vibration measurement methods, such as the doppler method, triangle method, and holographic interferometry, are needed to analyze the vibration of the sample holder of the cryostat. This paper presents a novel vibration-measuring method for the measurement of the vibration amplitude of the cryocooler based on the Fraunhofer double-slit interference principle. This method not only has a high resolution, but also has the ability to measure the vibration of distant objects, and is especially suitable for cryostat vibration measurement and analysis.Methods The laser is divided into two beams by the beam splitter after collimation. Beam 1 and beam 2 are used as the reference and signal lights, respectively. First, beam 1 and beam 2 pass through the slit, respectively, to generate slit light. Then, they are reflected by mirror 1, which is fixed, and mirror 2, which is mounted on the vibration object to be measuring and pass through the slit again. Finally, the two beams focus on the focal plane by focusing the lens on generating interference fringes, acquired by the plane-array charge-coupled device (CCD). The light intensity distribution of the fringes at the focal plane is similar to that of Fraunhofer diffraction (Fig.1) when assuming that the two-slit beams are parallel to each other and there is a specific interval between the two-slit beams after passing through the spectroscope. Because the position of the interference fringe is related to the phase of the two-slit beams, we can obtain vibration information about the sample holder by acquiring the position of maximum intensity of the interference fringe. Furthermore, the factors influencing measurement results are investigated to avoid a significant amount of experimental work.Results and Discussions The resolution of displacement measurement is affected by the parameters of the optical system under the same displacement speed and the same CCD sampling rate through Eq. (6) and Eq. (9). Increasing the focal lengths of the focusing lens, decreasing the slit width and the slit spacing can improve the resolution of the measurement. However, the intensity of light will decrease(Fig.4 and Fig. 5). We conclude that the appropriate slit spacing, slit width and focal length according to the actual situation of CCD are chosen. In this paper, the focal length of the focusing lens is 150 mm, and the size of a single-pixel of the CCD is 13.5 μm. By adjusting the parameters of the optical system, the number of pixels in a cycle is set at around 40, the maximum sampling rate of CCD is 3000 frame/s and the laser wavelength is 532 nm. Hence, the resolution of this device is about 6.65 nm theoretically. The results show that this method can accurately obtain the submicron-level vibration of vibrating objects, and the resolution can reach 10 nm (Table 1). Finally, the vibration curve of the vibration-free cryostat is measured using the optical system (Fig. 9).Conclusions The current study proposes a novel vibration measuring method for measuring the vibration amplitude of the cryocooler based on the Fraunhofer double-slit interference principle. The factors influencing measurement results are investigated, and the performance of the system is evaluated using a commercial PZT. The results show that the precision of the device can reach 10 nm in the 50--1000 nm vibration range. Furthermore, the vibration of the sample holder of the GM cryocooler after vibration reduction is measured and analyzed with this vibration measuring device. Measured results show that the vibration amplitude of the sample holder is reduced from ±15 to ±0.3 μm. However, the vibration spectrum of the cryostat shows a frequency of 1 Hz, indicating that, whereas the vibration reduction method effectively inhibits vibration transfer from cold head to sample holder, there is still a large optimization space. As a result, this work provides considerable support for further optimization of the vibration level of the cryocooler.
Nov. 25, 2021Vol. 48 Issue 24 2404003 (2021)
Liangze Pan, Cheng Liu, and Jianqiang Zhu
Objective Current developments in pulsed lasers have accelerated developments in fields, such as inertial confinement fusion, plasma emission, and high-energy-density physics. Fully characterizing these laser pulses is critical for its wide applications. Currently, many useful techniques exist, such as frequency-resolved optical gating, spectral phase interferometry for direct electric-field reconstruction (SPIDER), and double-blind holography for fully characterizing ultrashort laser pulses. However, these techniques are either incapable or ineffective for nanosecond laser pulse diagnostics because its narrow spectral width is always beyond most spectrometers’ resolution capability. For the nanosecond laser pulse diagnostic technique, the temporal intensity distribution can be obtained using a photodetector and oscilloscope, and the temporal phase distribution can be obtained using a heterodyne measurement approach. However, no applicable technique can provide the temporal intensity and phase distributions using a single detector.Methods In the proposed technique, the measured pulse is divided into two, with a delay of hundreds of picoseconds. One replica received a proper amount of frequency shift using an acousto-optic frequency shifter. The temporal shearing interferogram is recorded using a normal photodiode and oscilloscope after combining the delayed and frequency-shifted pulses. The measured pulse’s temporal phase distribution is reconstructed using the Fourier transform method, like that used in the SPIDER technique. In this paper, an amplitude reconstruction algorithm based on Fourier transform is proposed to reconstruct the measured pulse’s temporal amplitude distribution using the recorded temporal interferogram. Fig. 2 shows a flowchart of the detailed amplitude reconstruction algorithm. Thus, the proposed amplitude reconstruction algorithm can fully characterize the nanosecond laser pulse with a single photodiode.Results and Discussions From the systematic analysis of the amplitude reconstruction algorithm principle, four nanosecond laser pulses with different intensity distributions are simulated to evaluate the feasibility algorithm (Fig. 3). The numerical simulation results showe that the temporal intensity distribution of nanosecond pulses could be reconstructed from the temporal interferogram using the proposed amplitude reconstruction algorithm. Figs. 4 and 5 show the influence of signal-noise ratio (SNR) of the recorded interferogram, relative time delay, the relative intensity between delayed and frequency-shifted pulses, and relative frequency response ratio of photodiodes on the reconstructed results. When SNR of the recorded interferogram, the relative time delay between two pulses, is between 0.002 and 0.6, the algorithm can well reconstruct the temporal intensity distribution. Furthermore, the experiment verifies the algorithm’s feasibility. In the experiment, a nanosecond-pulsed laser diode with a central wavelength of 640 nm generates laser pulses with time durations varying from 5 ns to 39 ns at a repetition rate from 1 MHz to 10 MHz, with a peak power of 50 mW. An acousto-optic frequency shifter is used to obtain a frequency shift of 1.16 GHz. A fast photodiode (PDA2.5GA3KSFA) with a bandwidth of 2.5 GHz and a 20 GSa/s oscilloscope (LeCroy WaveRunner 620Zi) are used to record the temporal heterodyne signal intensity S(t) (Fig. 6). The results showe that the reconstructed temporal intensity of the measured pulses correlated well with those recorded directly using a photodiode.Conclusions In this paper, online measurement technology based on self-referencing temporal shearing interferometry is proposed to reconstruct the complex amplitude distribution of nanosecond pulses from the interferogram. In this proposed scheme, a temporal amplitude reconstruction algorithm is proposed to reconstruct the measured pulse’s temporal intensity using the recorded temporal interferogram. Simulation is conducted to determine the influence of SNR, relative time delay, the relative intensity between two pulses, and the relative frequency response ratio of photodiode on the reconstructed results. Furthermore, an experiment is conducted to evaluate the reliability of the proposed algorithm. An additional measurement is conducted to record the temporal intensity distribution of measured pulses using a photodiode as a comparison to the reconstructed intensity distribution. The results showe that the measured and reconstructed temporal intensity distributions of the measured pulses matched well. The proposed amplitude reconstruction algorithm simplifies the experimental setup and fully characterizes nanosecond laser pulses within a single shot. The proposed algorithm is simple and has wide applications. It provides a new measurement method for fully characterizing nanosecond laser pulses. Furthermore, the proposed amplitude reconstruction algorithm could reconstruct the amplitude distribution in the SPIDER technique.
Nov. 22, 2021Vol. 48 Issue 24 2404004 (2021)
Jun Chen, Zengxin Huang, and Dengfeng Kuang
Objective Recently, optical tweezers and related optical manipulation technologies have been extensively studied. One important method to improve the capability of optical manipulation is to use structured beams with novel propagation properties to realize specific capture and manipulation of particles. Here, we propose a new type of multi-axis asymmetric exponential cone device composed of an asymmetric structure and a multi-axis structure for generating multi-axis asymmetric structured beams. These beams are proved to be effective to give the dielectric microspheres a unique ‘accelerating-decelerating-reaccelerating’ movement and provide new ideas and implementation methods for particle screening and transporting.Methods Themulti-axis asymmetric exponential cone is designed with the geometrical optics theory and the diffractive optics theory. The modulating effects of such a device are produced by the different height distribution functions of its two asymmetric parts, which causes the redirection of the wave vector and influences the phase difference during propagation. With the three-dimensional finite-difference time-domain simulations, the electro-magnetic field distribution of the multi-axis asymmetric structured beam is obtained. Also, the energy flux distribution and the optical force distribution of dielectric microspheres are investigated based on the electro-magnetic field distributions of these beams. Moreover, the measurement of a focused multi-axis asymmetric structured beam and the manipulation of polystyrene fluorescent microspheres are conducted with our home-made experimental system to study the application potential in optical manipulation. The spatial light modulator and the phase mask of the device are employed to generate a multi-axis asymmetric structured beam in experiments.Results and Discussions From the simulation results, the multi-axis asymmetric structured beam shows an alternation of multiple focal points and a ring-shaped focal pattern during propagation, possessing unique energy flow characteristics. There are two processes in which the beam energy flows to the geometric center, thus a ring-shaped equilibrium position is formed between the two energy convergences, as shown in Fig. 3. The optical force distribution demonstrates that the optical force on microspheres at each secondary focal point is basically uniform, indicating that the microspheres may move between different secondary focal points, as shown in Figs. 4 and 5. The capture of microparticles can be divided in two parts: one is from free space to the secondary focuses, and the other is from the secondary focus to the geometric center, indicating that the dielectric microspheres move in multi-stages under the effect of the focused multi-axis asymmetric structured beam. In experiment, when the focused multi-axis asymmetric structured beam is irradiated into the sample cell, the microsphere starts to accelerate toward the beam center, which is mainly caused by the focal gradient force. Then the speed of the microsphere moving toward the beam center decreases, and the distance between the microsphere and the beam center keeps stable for several seconds. This phenomenon confirms the equilibrium position found in our simulation results of energy flow and optical force. The small-angle rotation of the microsphere corresponds to the energy flow between different focal points. Eventually, the microsphere accelerates toward the beam center again, and leaves the focal plane driven by the scattering force. The whole process can be seen in Fig. 7. The experimental results show that multi-axis asymmetric structured beams cause the ‘accelerating-decelerating-reaccelerating’ movement of polystyrene microspheres during the trapping process, which is consistent with the simulated results, as shown in Fig. 8.Conclusions In this paper, we propose a new type optical element, i.e. multi-axis asymmetric exponential cone, to generate multi-axis asymmetric structured beams, which can effectively capture and manipulate dielectric microspheres. Theoretical calculations, numerical simulations, and experimental measurement results show that the multi-axis asymmetric structured beam has unique propagation properties, including alternation of multiple focuses and ring-shaped focal patterns during propagation, equilibrium positions appearing in energy flow, and continuous light force on dielectric microspheres. In order to verify these propagation properties and explore the application potential, an independently designed experimental system for optical manipulation and monitoring is constructed using the focused multi-axis asymmetric structured beams to manipulate polystyrene fluorescent microspheres. Under the effect of the focused multi-axis asymmetric structured beam, the polystyrene fluorescent microspheres show a consistent ‘accelerating-decelerating-reaccelerating’ movement, and this movement is not affected by the initial motion direction of the microspheres, the initial speed, and other environmental factors. Different from the traditional optical tweezer technology that uses the gradient force of the focus to capture microspheres, the proposed method using the multi-axis asymmetric exponential cone to generate the multi-axis asymmetric structure of the beam provides a simple experimental implementation to give the dielectric microspheres a unique movement. This technology provides a new idea for applications in such as drug delivery, biological research, light-controlled screening, and light sensing.
Nov. 16, 2021Vol. 48 Issue 24 2413001 (2021)
Qian Liu, Yu Xie, Lin Li, Ang’ang Liang, Wenwen Li, Henan Chen, Su Fang, Qiuzhi Qu, Liang Liu, Bin Wang, and Desheng Lü
Objective The optimal adjustment of experimental parameters is the most basic and important work in cold atomic experiments. Excellent experimental results cannot be achieved without the continuous optimization of parameters. In this paper, a multiparameter autonomous optimization system for ultracold atomic experiment based on artificial neural network is proposed. The setup of neural network structure, the autonomous optimization learning approach, and the construction of a multiparameter autonomous optimization system using the global optimization simulated annealing algorithm (SAA) are described in detail. The parameter autonomous optimization system is validated by using direct simulation Monte Carlo (DSMC) method to simulate the kinetic behavior of cold atoms in magneto-optical trap (MOT). The final results reveal that after about 30 h of optimization iteration, the input parameters of validation experimental system are effectively optimized, yielding a stable, efficient, and optimal experimental result. Therefore, the multiparameter autonomous optimization system based on artificial neural network can greatly reduce manual workload, enhance experimental system utilization, and improve the quality of the final experimental results. The proposed scheme provides a solution for engineering and remote control of cold atomic experimental systems.Methods This paper presents a detailed scheme for a multiparameter autonomous optimization system using artificial neural networks. The setup of the neural network structure, the autonomous optimization learning strategy, and the construction of a multiparameter autonomous optimization system using SAA are described. The experimental validation of the proposed scheme combined with the DSMC method for simulating atomic cooling experiment is shown. Finally, four parameters are employed to optimize the number of cold atoms trapped in MOT: cooling laser power, cooling laser detuning, magnetic gradient, and axial velocity of cold atomic beam.Results and Discussions For the combined simulation and deep neural network tuning experiments, the cooling laser power is set from 10 to 80 mW, the cooling laser detuning is set from -5Γ to 0 MHz, the magnetic gradient is set from 0.10 to 0.25 T/m, and the axial velocity of cold atomic beam is set from 4 to 40 m/s. From these parameter ranges, 64 sets of input parameters are randomly selected and brought into the simulation experiment based on DSMC method . For each of the 64 experimental results, target values are calculated. These parameters are pooled and utilized as initial training data for the neural network tuning system. A total of 348 iterations are conducted after approximately 30 h of optimization, and the final experimental results are shown in Fig. 4 and Fig. 5. The optimization of the cooling laser power in the parameter interval, the optimization of the cooling laser detuning in the parameter interval, the optimization of the magnetic field gradient in the parameter interval, and the optimization of the axial velocity of cold atomic beam in the parameter interval are shown in Figs. 4(a)--(d). Moreover, the total number of experiments, including 64 initialization and 348 optimization experiments, is shown in the horizontal coordinates. As a result of the initial random selection of 64 sets of parameters within the parameter interval, it can be seen that the four parameters change significantly at the beginning of the procedure. However, the degree of variation of each parameter in the interval progressively reduces and stabilizes during the next 348 iterations. Finally, the cooling laser power, cooling laser detuning, magnetic gradient and axial velocity of cold atomic beam are optimized to 19.86 mW, -2.76Γ, 0.18 T/m and 10.09 m/s, respectively. Figure 5 shows that the experimental values corresponding to the initial 64 sets of randomly selected parameters are rather uniformly distributed and that the atomic number gradually stabilizes with the later iterations. The optimal number of atoms obtained after the final optimization is 7.23×10 8. The prediction accuracies are within 0.5% for the entire 348 iterations. Those results show that the proposed scheme is computationally efficient enough to optimize a cold atomic experimental system with a high number of control parameters in real-time. Conclusions This paper presents a multiparameter autonomous optimization system built on artificial neural networks and global optimization algorithm. By using the DSMC method to simulate experiments on atomic cooling in MOT, the effect of the autonomous parameter optimization system is verified. The final results show that the proposed scheme can optimize the parameters of multiparameter experimental system and produce a consistent and stable optimal experimental result. Subsequent applications only require equivalent changes to the evaluation judgment basis, which can be used to optimize the remaining experimental processes. Moreover, the experimental solution can be extended to other multiparameter tuned experimental systems such as atomic clocks, interferometers, etc. The proposed scheme provides an automatic and intelligent operational control solution for the engineering and remote control of cold atomic experimental systems. In addition, the manual workload can be significantly reduced, the utilization of the experimental system can be increased, and the quality of the final experimental results can be effectively improved using the proposed scheme.
Nov. 25, 2021Vol. 48 Issue 24 2412001 (2021)
Peng Wang, Baolai Yang, Hanwei Zhang, Xiaoming Xi, Chen Shi, Xiaolin Wang, and Xiaojun Xu
Nov. 16, 2021Vol. 48 Issue 24 2416001 (2021)
Hanshuo Wu, Yi An, Hu Xiao, Liangjin Huang, Ruixian Li, Huan Yang, Jinyong Leng, Zhiyong Pan, and Pu Zhou
Nov. 16, 2021Vol. 48 Issue 24 2416002 (2021)
Zehao Lin, Runhua Li, Yinhua Jiang, and Yuqi Chen
Objective Orthogonal double-pulse (DP) laser-induced breakdown spectroscopy (LIBS) in reheating mode provides intrinsic advantages, such as reduced self-absorption, capability of quantitative elemental analysis using very low ablative laser pulse energy, and relatively large signal enhancement factor under low ablative laser pulse energy. Conventional reheating orthogonal DP-LIBS allows realizing sensitive elemental analysis under microablation or elemental mapping analysis with high spatial resolution. However, as the reheating laser is focused on sample plasma with low particle density, only part of the reheating laser can be absorbed, reducing the utilization efficiency of laser energy. Therefore, under high ablative laser pulse energy, the signal of orthogonal DP-LIBS cannot be suitably enhanced compared with single-pulse LIBS using the same ablation laser. To improve the energy utilization efficiency in reheating laser and increase the signal enhancement factor in orthogonal DP-LIBS, target-enhanced orthogonal DP-LIBS is proposed, and its signal enhancement mechanism is studied.Methods A solid target with low spectral interference was added in reheating orthogonal DP-LIBS. In addition, a rotating solid aluminum target was placed perpendicular to the target sample. Two electro-optically Q-switched Nd∶YAG lasers with 5 Hz pulse repetition rate and 1064 nm wavelength were used as excitation sources. The beam of the first laser was perpendicularly focused on the sample surface to produce sample plasma, and the beam of the second laser was focused on the surface of the aluminum target to produce target plasma. Moreover, the focal spot of the second laser beam was located in front of the sample surface, and the distance from the focal spot to the sample surface was adjusted to avoid sample ablation by the second laser. For evaluation, a compact fiber-optic spectrometer coupled with a nonintensified charge-coupled device was used to record the spectra. In addition, a monochromator and a photomultiplier tube were used to record the temporal profile of the light emission, and a brass standard sample was analyzed.Results and Discussions The signal intensities of the sample elements were significantly enhanced by the interaction between the target and sample plasmas. The temporal profiles of plasma emission from the brass sample were recorded at 324.75 and 324.00 nm using orthogonal DP-LIBS and the proposed target-enhanced orthogonal DP-LIBS. The persistence time of the copper atomic emission observed at 324.75 nm was prolonged to 18.0 μs using the target-enhanced orthogonal DP-LIBS (Fig. 2). The effect of the interpulse delay on the atomic emission intensities was experimentally determined. The best delay time for the two laser pulses was approximately 4.0 μs. In the target-enhanced orthogonal DP-LIBS, multiple emission lines of different elements could be simultaneously enhanced (Fig. 3). Under the optimal experimental conditions, the signal intensity was enhanced by a factor of 24-146 compared with single-pulse LIBS and by a factor of 6-10 compared with conventional orthogonal DP-LIBS. Thus, a substantial improvement in the intensity was obtained from aluminum target enhancement (Table 1). To clarify the signal enhancement mechanism of target enhancement, the plasma temperature variations in orthogonal DP-LIBS and target-enhanced orthogonal DP-LIBS were determined based on Boltzmann plots using various copper atomic lines. Plasma temperature was 6874 and 9752 K for orthogonal DP-LIBS and target-enhanced orthogonal DP-LIBS, respectively (Fig. 5), corresponding to a temperature increase of 2878 K. The averaged electron density in orthogonal DP-LIBS and the target-enhanced orthogonal DP-LIBS was evaluated according to the Stark broadening of selected atomic emission lines. Under the considered experimental conditions, the difference in Stark broadening of the selected atomic emission lines could not be distinguished. This may be owing to the change in electron density being negligible in both cases. Overall, the experimental results indicated that the proposed reheating target-enhanced orthogonal DP-LIBS could improve the signal for a given sample ablation condition compared with the conventional orthogonal DP-LIBS.Conclusions A target-enhanced orthogonal DP-LIBS technique considering reheating is proposed. Using a solid target in conventional orthogonal DP-LIBS, plasma emission can be substantially enhanced. The signal enhancement results from the increase in plasma temperature and collision mechanism. The energy utilization efficiency of the reheating laser is higher than that in conventional orthogonal DP-LIBS when the reheating laser points to the surface of a solid aluminum target. The additional particles from the solid target are ablated by the reheating laser. Under the assistance of the solid target, collisions during plasma interactions promote re-excitation and ionization of species, which can lead to a considerable signal enhancement. The proposed target-enhanced orthogonal DP-LIBS allows the use of low ablative laser pulse energy and can improve analytical sensitivity with microablation and high spatial resolution. Moreover, the proposed technique can drastically improve the signal intensity of orthogonal DP-LIBS, and it can further improve the analytical sensitivity of orthogonal DP-LIBS and deliver superior analytical results. The proposed target-enhanced orthogonal DP-LIBS can find applicability in elemental analysis of precious samples and small samples in fields such as jewelry identification, art, archaeology, and materials science.
Nov. 22, 2021Vol. 48 Issue 24 2411001 (2021)
© Copyright 2018-2021 | Chinese Laser Press.
All Rights Reserved 沪ICP备15018463号-20