


Please enter the answer below before you can view the full text.

Xiaoyu Zhou, Ling Wang, Yanxin Ma, and Peibo Chen
Objective Point cloud can be selected as an ideal data format for tasks such as object classification, detection, segmentation, reconstruction, and tracking in a three-dimensional (3D) scene. In the case of a single object tracking task, the approach of considering point clouds as data outperforms that of selecting two-dimensional (2D) picture or video sequences for two reasons. First, the point cloud can better describe the 3D geometric information of the object in real scenes, such as the position, scale, and posture of the object. Second, different from the passive optical imaging principle of cameras, information is collected using light detection and ranging (LiDAR) following an active imaging approach, which is not prone to be affected by natural light conditions. Therefore, the point cloud can adapt to different conditions involving visual degradation or illumination and is robust to glare, reflections, and shadows. Based on this discussion, the single object tracking of 3D point cloud is a topic worth investigating. Generally, single object tracking tasks aim to use the information in the given initial frame to determine the tracked object and predict the locating bounding box of the object in each subsequent frame. However, existing single object trackers of LiDAR point clouds exhibit a poor tracking performance of sparsely distributed and small-scale point cloud objects. This is mainly attributed to the downscaling operation applied to features extracted from the point cloud, leading to the insufficient application of object’s structural information; this distracts the tracker from performing accurate bounding box predictions of sparsely distributed and small-scale point cloud objects.Methods To address this problem, a single object tracking network combined with auxiliary deep neural network is proposed herein. During the training stage, we attach a modified auxiliary network to the backbone network, which accomplishes two auxiliary tasks: 1) foreground point cloud segmentation, which guides the backbone network to focus on pointwise semantic information; 2) pointwise center coordinate offset regression, which leads the features to be aware of the intrastructural information of the object. These two tasks are jointly supervised using the backbone network such that the semantic and structural features are naturally stored in the object features extracted using the backbone network. However, during the inference stage, the auxiliary network is bypassed in this process because the trained backbone network is already optimized to be structure aware and detaching the auxiliary network can avoid extra computational cost, which is essential for retaining the real-time performance of the tracker. Moreover, we notice that the latest work follows the same manner as the dataset organization. In particular, the number of input points in the search area point cloud and template point cloud is fixed, irrespective of the class of point cloud data. However, as the KITTI dataset presents, the point cloud of some classes is dense and comprises a large number of points, while the point cloud of other classes suffers from scarce points, providing insufficient and limited object information. A fixed number of input points may be unsuitable for all data classes. Hence, we propose setting different input quantities for each class during both the training and inference stages, which is accomplished without changing the network structure. In general, the structure of different network modules is shown in Fig. 1 to Fig. 6 respectively.Results and Discussions Both qualitative and quantitative experiments are conducted to prove the superiority of our propositions. Table 1 shows the result of extensive comparisons between our proposed tracker and other two former trackers; our tracker achieves better results in three of four data classes and shows higher mean performance than the other two former trackers. Test results on the KITTI dataset show that our network increases the average tracking success by 0.89 percent and the average tracking accuracy by 2.51 percent under the same parameter settings as the existing work. Second, some specific tracking results of four data classes are depicted in Fig. 7--Fig. 10. These figures show that our tracker can predict bounding boxes closely similar to the ground truth. Furthermore, we present some results of the tasks processed using the auxiliary network. Concretely, Fig. 11--Fig. 14 show the results of foreground segmentation task, in which our auxiliary network can accurately segment the surface of the object from the background points. Moreover, details of comparisons on tracking performance with different numbers of the search area point cloud and template point cloud are discussed in Table 2, which prove the efficiency of adjusting a suitable quantity of input points of different data classes. Compared with proposed algorithm, the average tracking success increases by 4.54 percent, and the average tracking accuracy increases by 7.83 percent. In particular, for class Cyclist, the average tracking success increases by 2.38 percent and the average tracking accuracy increases by 2.86 percent; for class Pedestrian, the average tracking success increases by 8.47 percent and the average tracking accuracy increases by 13.71 percent. These findings imply that our tracker achieves improvements in terms of the tracking performance of sparse and small-scale objects. Finally, Table 3 and Table 4 show that we succeed in maintaining a balance between performance and computational costs.Conclusions In summary, the proposed method achieves reasonable results in addressing the problem of tracking sparsely distributed and small-scale point cloud objects as expected, and can be applied to solve other tasks. Inspired by our experiment results, to achieve further improvement, we will seek new approaches on data augmentation and extract more useful clues using the background information for search area updates.
Oct. 18, 2021Vol. 48 Issue 21 2110001 (2021)
Xichun Zhang, Jinguang Lü, Chong Zhang, Wensheng Fu, Xin Zhao, Weiyan Li, and He Zhang
Objective Recent studies have shown that the optical system that produces the bottle beam is gradually diversifying. However, most optical systems are more complex and the resulting bottle beams are larger in size. This article uses the metasurface to generate a bottle beam. The ultrasurface system is straightforward and well-integrated. The lateral and longitudinal inner diameters of the generated bottle beam are considerably reduced, and the capture of tiny particles is more accurate. This has potential research and application value for multiparticle capture and precise capture.Methods In this study, to generate multiple bottle beams, an opaque annular obstacle is added to the metasurface with the hyperbolic phase distribution (PB phase). The metasurface is constructed with titanium dioxide (TiO2) nanopillars arranged on a silicon dioxide (SiO2) substrate. To design the working wavelength of the nanopillars to 632.8 nm, the length, width, and height of the super surface nanopillars are designed to be 377, 87, and 600 nm, respectively. Moreover, by varying the relative aperture value (RA) of the metasurface, the lateral and longitudinal inner diameters of the bottle beam are altered. The number of bottle beams produced can be altered by changing the size of the annular obstacle on the metasurface.Results and Discussions This article produced four micron-level bottle beams [Fig.6(a)]. Further, by increasing the RA value of the metasurface, the lateral and longitudinal inner diameters of the bottle beams are reduced [Fig.7(a)]. Thus, the RA value of the metasurface can be changed to alter the size of the generated light field. We select one of the bottle beams and observe that its transverse and radial full width at half maximum (FWHM) are roughly linear with RA [Fig.7(b)--(c)]. In this paper, the number of bottle beams produced is changed by changing the size of the annular obstacle on the metasurface [Fig.8(a)--(c)].Conclusions The metasurface method used in this paper generates four bottle beams. Two of the bottle beams are selected. The measured FWHMs of the two bottle beams are 0.47 and 0.61 μm in the transverse direction, respectively, and 0.9 and 1.2 μm in the longitudinal direction. Simultaneously, this paper finds that by changing the RA value of the metasurface, the inner diameter of the multiple bottle beams is variable, and its transverse FWHM and radial FWHM are roughly linear with RA. Therefore, if particles with a specific size need to be captured, the metasurface with a specific RA can be designed to generate a bottle beam with the required size. This paper also found that the size of the outer ring that controls the annular obstacle remains unchanged, and when its size is changed, the number of the bottle beams is changed to 2, 4, and 5, respectively. The size of the multiple bottle beams produced in this paper is considerably reduced, and capturing tiny particles is more accurate, which is of great significance to the study of particle capture.
Nov. 05, 2021Vol. 48 Issue 21 2105001 (2021)
Ao Yin, Shixian Zhai, Han Sun, Zhi Liu, Zhengfei Zhuang, and Tongsheng Chen
Objective Acceptor-sensitized 3-cube fluorescence resonance energy transfer (FRET) imaging (also termed E-FRET imaging) is a popular FRET quantification method in living cells that uses fluorescence intensity. We recently developed a measurement of calibration factors (termed as mTA-G method) that eliminates the influence of the emission transmission characteristics of the instrument used on quantitative E-FRET measurement, significantly increasing the success rate and accuracy of quantitative E-FRET measurement in living cells. Because of its inherent ability to resolve the excitation-emission spectra of donor and acceptor, as well as donor-acceptor sensitization, spectral unmixing of simultaneous excitation and emission spectra (mExEm-spFRET) has been used for quantitative FRET measurement without the need for additional reference for correcting the excitation crosstalk. We evaluated the two methods’ robustness by implementing them on a self-assembled quantitative FRET measurement system with cells expressing different constructs.Methods The research methods of this paper are mainly divided into four sections: Cell culture and plasmids transfection, predetermining spectral crosstalk and spectral fingerprints, measuring calibration factors and system parameters, superior robustness of mExEm-spFRET to E-FRET method. First, MCF-7 cells were cultured in 6-well plates. For transfection, cells were separately transfected with four different FRET plasmids using transfection reagent. Then, living MCF-7 cells separately expressing YFP (Y) and CFP (C) were used to predetermine the spectral crosstalk coefficients (a, b, c and d) and spectral fingerprints (SD, SA, and SS) were shown in Fig.1 and Fig.2. Next, calibration factors (G and γ) were measured using cells expressing C4Y, C10Y, C40Y, and C80Y (Fig.3). The cells expressing C4Y were used to measure system parameters (fSC and rK) (Fig.4). Finally, to evaluate the robustness of mExEm-spFRET and E-FRET methods, we performed quantitative mExEm-spFRET and E-FRET measurements respectively for the same cells separately expressing four kinds of plasmids under different signal-to-noise ratios (RSN) on different days (Fig. 5 and Table 3).Results and Discussion The E and RC values of different FRET plasmid in the cells in Fig. 3 measured by mExEm-spFRET and E-FRET method were shown in Table 1, respectively. For cells 1 and 2, the E and RC values measured by both methods were consistent with the reported E values and the expected RC values. Still, the E values measured by E-FRET were generally larger than those calculated by the mExEm-spFRET method. These results indicate that both methods are applicable for live-cell FRET measurement. Table 2 shows different constructs’ statistical E and RC values in living MCF-7 cells under different RSN. For the cells under RSN>3, the two methods obtained consistent FRET efficiency (E) values, but E-FRET obtained smaller donor/acceptor concentration ratio(RC) values than the expected for individual constructs; for the cells under RSNRC values, but the deviation of individual plasmid E values obtained by E-FRET was slightly larger. These results further demonstrate E-FRET has slightly less robustness than the mExEm-spFRET method, especially for the cells under a low RSN. We repeated the above measurements on our system on March 10 th and obtained consistent results with FRET results measured on December 12 by mExEm-spFRET (Table 3). But the RC values of C80Y obtained by E-FRET were inconsistent with expected values. These results show the superior robustness of mExEm-spFRET to E-FRET method especially for the cells with low E (ERSN, resulting in the inaccurate results measured by the E-FRET method. Because of the excellent robustness of mExEm-spFRET, just as described above, the mExEm-spFRET method still obtained accurate results for the C80Y construct in the cells with a low RSN. Conclusions In this report, we evaluated the robustness of both E-FRET and mExEm-spFRET methods by implementing E-FRET and mExEm-spFRET measurements, respectively, with two excitation wavelengths using the same cells expressing different constructs under different RSN. For the cells under RSN>3, the two methods obtained consistent FRET efficiency (E) values, but E-FRET obtained smaller RC values than the expected for individual constructs; for the cells under RSNRC values, but the deviation of individual plasmid E values obtained by E-FRET was slightly larger. E-FRET and mExEm-spFRET methods are very applicable for live-cell FRET measurement and the superior robustness of mExEm-spFRET to E-FRET method, especially for the cells with low RSN and E (RSNE
Oct. 27, 2021Vol. 48 Issue 21 2107001 (2021)
Fen Zhang, Wuyu Zhang, Chunshu Li, Zhuangzhuang Tong, Yuanzheng Ma, and Kedi Xiong
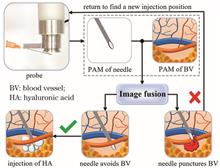
Objective In microplastic surgery, hyaluronic acid is injected into the dermis layer under the wrinkle depression to achieve the wrinkle removal effect. However, the percutaneous needle can puncture facial arteries, causing the penetration of hyaluronic acid into the blood vessels to form emboli and induce vascular embolism, resulting in local tissue ischaemia, blindness, and even stroke. The visualisation of human facial blood vessels can solve this problem. Photoacoustic imaging is a mesoscopic imaging method with high specificity and contrast based on optical absorption differences and ultrasound information carriers. This method combines the advantages of high resolution of optical imaging and large penetration depth of ultrasonic imaging. It has been widely studied in the biomedical imaging field. As an important branch of photoacoustic imaging, photoacoustic microscopy can obtain high-resolution and high-contrast images of blood vessels in the dermis layer of the human skin in a noninvasive and label-free manner. Therefore, a photoacoustic microscopy was proposed to navigate injection-based microplastic surgeries.Methods The needle inserted at a fixed angle was imaged using a photoacoustic microscopic probe to obtain the injection point of the needle. Then, the three-dimensional (3D) vascular imaging of the target area was performed. Based on the image fusion and quantitative evaluation, it can be assessed whether the needle will puncture the facial arteries, thereby reducing the risk of surgery. In this study, the feasibility of this method is confirmed using leaf vein imaging and in vivo mouse-ear imaging. Image reconstructions were performed using a user-defined programme, LABVIEW (2019, National Instruments, USA). The three-dimensional images and image fusion were obtained using functions provided by ImageJ (National Institutes of Health, USA). The user-defined algorithm implemented in MATLAB (R2019b, MathWorks, USA) was used to calculate the number of pixels in the intersection area of the image fusion.Results and Discussions Leaf veins were used to simulate the blood vessels of the dermis layer. The diameter of the leaf vein trunk was approximately 300--500 μm (for simulating facial arteries) and that of leaf vein branches was 100 μm is 35 and 31, respectively. The number of pixels intersecting the capillaries (positions 2 and 5) is 8 and 5, respectively. The number of pixels in positions 3 and 6 without the blood vessels is 0 (Fig. 4).Conclusions The experimental results of leaf veins show that photoacoustic microscopy can predict the relative position of the needle, simulate the blood vessels, and navigate the needle into a safe area. Results of the in vivo mouse-ear experiment show that photoacoustic microscopy can quantitatively determine the type of blood vessel punctured by the needle based on the number of pixels in the intersection area. Therefore, this study is expected to realize the preoperative navigation of injection-based microplastic surgeries and shows good application prospects for improving the safety of injection-based microplastic surgeries. However, some aspects still require improvement. The wavelength of the laser employed herein is 532 nm. Naturally, blood vessels show high absorption at this wavelength; however, the imaging depth is limited owing to the strong scattering of light by biological tissues. Furthermore, high wavelengths of the laser will be used in the future, e.g., 1064 nm, to achieve high imaging depth. Currently, only the upper surface information of the needle can be extracted owing to the limitation by the optical excitation mode of the system; moreover, post-processing algorithms are needed to determine whether the needle touches the blood vessel. In the next step, a complete needle can be simulated using the real size of the needle to improve the accuracy of the experiment. Additionally, there is a certain degree of blindness in the selection of the injection position and the probe must be moved repeatedly. The large imaging view and high imaging speed will considerably improve the detection efficiency. Moreover, owing to the limitation of the imaging speed, the proposed system can only realize preoperative navigation, not intraoperative navigation. Further, this system cannot monitor the process of needle entering the sample in real time. Subsequent work will focus on the aforementioned issues to improve the system.
Nov. 11, 2021Vol. 48 Issue 21 2107002 (2021)
Xin Cao, Zhishan Gao, Ningyan Xu, Lu Chen, Qun Yuan, and Zhenyan Guo
Objective Given the increased prevalence of digestive diseases in recent years, the endoscope has been widely used for abdominal diagnoses, including those related to the stomach and intestines. Researchers are working to develop more effective and less invasive techniques for patients to benefit from endoscopy. A large field-of-view (FOV) and high resolution will reduce examination time and improve evaluation accuracy. Moreover, a compact endoscope structure is critical for minimising patient discomfort. In conventional wide-field camera lenses, a large panoramic scene needs to be focused onto an image sensor plane, to reduce the field curvature caused by the strong mismatch between the focal planes. The concentric lens consists of four refractive surfaces, and the centres of curvature of each refractive surface coincide at one point. Therefore, off-axis aberration does not exist. Only spherical and axial chromatic aberrations need to be corrected. Therefore, this structure can be applied to optical systems with miniaturisation, high image quality, and a large FOV; however, the image surface formed by the concentric system is curved. In this study, we correct the curvature of the field in the concentric sphere system by designing an annularly stitched aspheric surface to achieve flat-field imaging with a large FOV.Methods In this study, an optical system with full FOV is regarded as a combination of multiple single- or small-FOV sub-system units, then the sub-field units are solved separately, and the formation of a complete complex surface is optimised to realize the construction of a complete optical system. First, the initial concentric structure is solved with well-corrected spherical and chromatic aberration. Then, based on the FOV, an annularly stitched surface is constructed by dividing the surface into rings and calculating the initial structure parameters of each zone based on the flat-field conditions. The Q-type aspheric surface characterises different annuli to ensure imaging quality while obtaining good splicing results. Simultaneously, the continuity constraint condition of the annularly stitched aspheric surface is derived. Finally, a complete surface is optimized to realize the construction of a complete electronic endoscope.Results and Discussions The deviation of normal and sag between adjacent rings has been reduced to less than one-tenth of the test wavelength (typically test wavelength 632.8 nm) through optimisation. These rings are then fused after the optimisation. The system diagram is shown in Fig.10. Compared with the modulation transfer function (MTF) curve of the initial structure in Fig. 3, the MTF of the system after optimisation is more than 0.3 at the spatial frequency of 72 lp/mm (Fig.11). Thus, the curvature of the full FOV is reduced from 0.5 mm in the initial structure to within 0.1 mm [Fig.12(a)], the imaging requirements of electronic endoscope objectives are met. To validate the design results’ manufacturability, a Monte Carlo simulation analysis was performed 200 times within the tolerance range (Fig.14). Consequently, in the full FOV, considering mass production and assembly, a probability that an optical system with an average diffraction MTF greater than 0.3 at 72 lp/mm frequency can be obtained is more than 90%.Conclusions Based on the concentric structure, multiple rings are superimposed on the last surface to obtain different optical powers to generate the initial surface shape of the splicing surface of the rings. The surface shapes of the multiple rings are fused to generate a complete continuous surface after the continuous conditions are optimized. In the design, the Q-type aspheric surface is used to characterise different ring zones to ensure imaging quality. An electronic endoscope objective lens operating in the visible band is designed using this method. The objective comprises only four refractive surfaces, with a total system length of 2.81 mm and FOV of 90°. The field curvature of the system is less than 0.1 mm, the distortion is within 20%, the MTF reaches 0.3 at 72 lp/mm, and the relative illuminance of the full FOV is greater than 0.5, which meets the imaging requirements of electronic endoscope objectives. The system uses the imaging advantages of the concentric objective lens with a large FOV and small volume. The annularly stitched aspheric surface is used to correct the curvature of the field caused by the spherical lens. Compared with the traditional structure, our electronic endoscope objective lens is more compact and readily manufacturable.
Oct. 27, 2021Vol. 48 Issue 21 2107003 (2021)
Rui Wu, Fei Yang, Yanguang Sun, Fang Wei, Youzhen Gui, Yaqian Ding, and Haiwen Cai
Objective Time and frequency synchronization technology based on optical fiber transmission method has good synchronization performance, which can meet application requirements such as clock comparison, very long baseline interference, and radar networking. However, some coherent detection applications put forward new requirements for fiber-based time and frequency synchronization technology. Phase synchronization must also be ensured based on frequency synchronization, and low phase noise transmission is required simultaneously. Phase synchronization means that no matter what changes the system experiences, the phase difference between remote sites can remain a constant value, ensuring the phase coherence of the frequency signal. But low phase noise transmission may bring uncertainty to phase synchronization. Therefore, this paper has studied a consistent fiber-optic phase synchronization system with phase noise purification function.Methods The transmitted frequency signal is input into an electrical phase-locked loop (EPLL) at the remote site. The EPLL contains an oven-controlled crystal oscillator (OCXO) with ultra-low phase noise. After completing phase lock, the phase noise of the output frequency signal will be the same as the OCXO at frequency offsets higher than the phase-locking bandwidth. Therefore, the deteriorated far-end phase noise of the frequency signal due to fiber transmission can be purified by the EPLL, realizing low phase noise transmission. Through the “round-trip delay stabilization” method, the round-trip phase difference can remain constant, while the one-way phase difference may change as long as system status changes. EPLL and the phase compensation process can bring phase uncertainties to the one-way phase difference through theoretical analysis. According to the relationship between the round-trip time delay of the time pulse and the phase difference of the frequency signal, the change value of the round-trip delay can be controlled to the even periods of the frequency signal, thereby eliminating the half-period phase uncertainty caused by phase compensation process. The effect of the one-way phase difference introduced by EPLL needs experimental measurements to evaluate. Experiments on phase noise purification and phase consistency are conducted.Results and Discussions First, the far-end phase noise of the 1-GHz frequency signal has deteriorated significantly after 26-km fiber link transmission, such as 21.7 dB (from -145.0 to -123.3 dBc·Hz -1) at 100 kHz frequency offset; after EPLL purification, the far-end phase noise is purified, decreasing 17.0 dB (from -123.3 to -140.3 dBc·Hz -1) at 100 kHz frequency offset (Fig. 2). The results show that the phase noise of the frequency signal can be effectively purified by setting the EPLL at the remote end. Then, by measuring the additional phase shift introduced by the EPLL under multiple shutdowns and restarts of the EPLL, the mean values of the one-way phase difference are between 0.698 and 0.824 rad, with an inconsistency of 0.126 rad, corresponding to 2% of one full cycle (Fig. 3). So, according to theoretical analysis, EPLL will bring ~0.063 rad uncertainty to the one-way phase difference, which is 3 dB lower than its inconsistency. Finally, when the system experiences restart operations and fiber link changing, the phase synchronization process based on optical compensation can be performed as expected. After each closed loop, a relatively consistent phase difference can be achieved with an inconsistency less than 0.068 rad, corresponding to ~1% of one full cycle (Fig. 4 and Fig. 5). The inconsistency is determined by the coupling of various asymmetry effects, including the use of EPLL and the operating temperature drift of devices. Conclusions A consistent fiber-optic phase synchronization system with phase noise purification function is studied in this paper to meet the application requirements in the field of coherent detection. After 26-km fiber link transmission, the phase noise of 1-GHz frequency signal deteriorates but can be compensated by the EPLL. At the frequency offset of 100 kHz, phase noise is increased by 21.7 dB after optical fiber transmission, from -145.0 to -123.3 dBc·Hz -1; and then decreased by 17.0 dB after EPLL purification, from -123.3 to -140.3 dBc·Hz -1. Experimental measurements show that the EPLL introduces additional phase shift while purifying phase noise, with a phase inconsistency of 0.126 rad. The round-trip delay control of the time pulse eliminates the π rad (half of one full cycle) phase uncertainty during the remote transmission of the frequency signal. The phase uncertainty introduced by the additional phase shift of EPLL is reduced by 3 dB (half of 0.126 rad). Experiments results show that when the system experiences shutdown and restart and removing the 1-km fiber link, the mean values of the one-way phase difference have an inconsistency less than 0.068 rad, corresponding to ~1% of one full cycle. Therefore, a consistent phase difference is achieved based on low phase noise.
Oct. 27, 2021Vol. 48 Issue 21 2106001 (2021)
Xi Zhang, Shouyu Wang, Yan Kong, Xiaoliang He, Zhilong Jiang, and Cheng Liu
Objective Compared to traditional holography that relies on silver salt films, digital holography can reconstruct sample wavefront from holograms recorded by digital cameras via Fresnel transform as modern image processing. Therefore, digital holography is more convenient, fast and been widely studied and used in biological tissue imaging, particle tracking, encryption and measurements. Although refocusing is required, samples in digital holography can be focused at any depth for observation, whereas ordinary digital holography cannot provide sample tomographic structure. Optical diffraction tomography via angular scanning has been proposed as a method for obtaining tomographic imaging by combining computed tomography and holography; however, the optical system is complex and the spatial resolution is considerably limited by the accuracy and the range of the scanning mechanism. Multi-wavelength digital holography similar to optical coherence tomography has also been designed for tomographic imaging and it completely avoids the mechanical scanning in the imaging process. The samples, however, have different refractive indices for different wavelengths due to the dispersion effect. To address the shortcomings of traditional digital holographic tomography, this paper proposes a transmission mode K-domain transform-based digital holographic three-dimensional imaging method that requires only a single wavelength and one-dimensional sample scanning and is completely different from existing methods.Methods In transmission mode K-domain transform-based digital holographic three-dimensional imaging method, light sheet formed by a cylindrical lens is used to illuminate the sample and the off-axis hologram of the transmitted light is recorded via the interference between another reference light sheet. After the complex amplitude of the transmitted light is obtained using the traditional digital holographic reconstruction method, its spectrum is calculated and its low-frequency component is removed via high-pass filtering. Thus, the component of zero-order transmitted light is filtered out, and the high-order diffracted light is enhanced. Then the K-domain transformation is implemented on the spectrum space. The inverse Fourier transform is finally performed on the transformed spatial spectrum to obtain the tomographic sample structure illuminated by the light sheet through one-dimensional scanning. Because the low-frequency component has been removed, the reconstructed images are differential intensity images with intensities that are inverse to the bright field images. They do, however, retain the same structural information as the sample.Results and Disscusions According to theoretical analysis, the principle of transmission mode K-domain transform-based digital holographic three-dimensional imaging method is explained (Fig.1). Then, the characteristics of the method are analyzed by mathematical principle and physical model (Fig.2). Based on the analyses above, a high-pass filtering algorithm is proposed and its feasibility has been verified (Fig.3 and Fig.4). By filtering the low-frequency spatial spectrum of the transmitted light, the tomographic sample structure can be obtained accurately and swiftly via K-domain transforming and one-dimensional scanning. Furthermore, some low-frequency spatial spectrum loss does not affect axial resolution but slightly improves lateral resolution. As a result, even after filtering out some of the low-frequency components, the axial and lateral resolutions of the system are still primarily determined by the numerical aperture of the imaging system. But because the low-frequency components are filtered out, the image obtained is the differential image of the observed object in the transverse direction. The influence of high-pass filtering on reconstructed image quality is analyzed by a set of numerical simulation, and the necessity of high-pass filtering algorithm is proved (Fig.5). Furthermore, numerical simulations (Fig.6) and experiments (Fig.7) in this paper are used to validate the feasibility of this transmission mode K-domain transform-based digital holographic three-dimensional imaging method.Conclusions This paper reports a transmission mode K-domain transform-based digital holographic three-dimensional imaging method, which is theoretically analysed and verified by both numerical simulations and experiments, to provide a simple and convenient tomographic imaging tool for the field of X-ray and electron beam microscopy, based on our previously proposed K-domain transform-based tomography. This paper reports a transmission mode K-domain transform-based digital holographic three-dimensional imaging method, which is theoretically analysed and verified by both numerical simulations and experiments, to provide a simple and convenient tomographic imaging tool for the field of X-ray and electron beam microscopy, based on our previously proposed K-domain transform-based tomography. It is proved that the method based on high-pass filtering can overcome the technical limitation that our previously proposed K-domain transforming based tomography can only work in the reflection light path. Furthermore, since this three-dimensional imaging method works in transmission mode, it has a much simpler optical alignment. Therefore, it can be adopted for ultra-high microscopic three-dimensional imaging with coherent synchrotron radiation. Furthermore, the illuminating light sheet is used to repeatedly scanning the sample, which can quickly generate a three-dimensional image of the entire sample quickly. As a result, the newly proposed transmission mode K-domain transform-based digital holographic three-dimensional imaging method can provide a simple and practical tomographic imaging tool for X-ray and electron beam short-wavelength microscopic imaging.
Oct. 18, 2021Vol. 48 Issue 21 2109001 (2021)
Jiantai Dou, Junchao Wu, and Zhongming Yang
Objective The extended ptychographical iterative engine (ePIE) is a powerful phase-retrieval method that provides label-free, high-contrast imaging and robustness. In the ePIE method, all diffraction patterns captured during each iteration are applied to perform batch improvement and iteratively recover the probe and object in sequence. The ePIE can converge reasonably at a proper rate in practical experiments; however, hundreds of time-consuming iterations are required. In our previous work, a technique is proposed to increase the convergence speed of ptychographic imaging based on multiple axial intensity constraints (MAIC-PIE). In this strategy, the diffracted light from the sample is separated axially using a beam splitter and inserting multiple charge-coupled devices (CCDs) into the splitter beams. The multiple CCDs work together independently to obtain multiple axial intensity images. Such multiple axial intensity images function as an additional constraint to strengthen the connection between the intensity and the unknown phase. In MAIC-PIE, each axial intensity is required in the calculation over all iterations; however, with an increasing number of iterations, the multiple axial intensity constraints are not required in the calculation of each iteration. Thus, we modified the MAIC-PIE and propose a fast-convergence ePIE based on nonglobal multiple axial intensity constraints (ngMAIC-PIE) to reduce calculation time.Methods In the experimental apparatus of ngMAIC-PIE, the light diffracted from the sample is split spatially into two orthogonal beams using a beam splitter. Two CCDs (CCD1 and CCD2) are placed at two axial positions after the beam splitter. They are used to record the diffraction patterns generated by the interaction of the sample with the localized probe. The ngMAIC-PIE reconstruction method involves four stages: multiple axial intensity constraints, ePIE reconstruction, multiple axial intensity constraints, and ePIE reconstruction. In the multiple axial intensity constraint stage, a round-trip iteration between the two CCDs and intensity constraints is added to the ePIE method, where the object function and light field function can be constrained to update along the effective direction and improve the convergence speed. In the ePIE reconstruction stage, the conventional ePIE method is employed, which maintains the rapid convergence in the previous stage and reduces the calculation time of the multiple round trips of the CCDs. The selection rule for the number of iterations for the multiple axial intensity constraint stage is summarized as follows. In the first 20 iterations, two stages of the multiple axial intensity constraints are completed. Here, the number of iterations at the end of the first stage and the beginning of the second stage should vary between 5 and 10. Further, the first and second stages of the multiple axial intensity constraints should be completed in 1--10 and 10--20 iterations, respectively.Results and Discussion In a simulation evaluation, the root mean square (RMS) value relative to the amplitude and phase error from each iteration is evaluated in terms of reconstruction accuracy and convergence speed. Using the same system parameters, the convergence performance and reconstruction accuracy of the ngMAIC-PIE and MAIC-PIE exceed those of the ePIE and the performance of ngMAIC-PIE is similar to that of MAIC-PIE (Fig. 4). The reconstruction quality can be improved by increasing the number of iterations; however, the convergence rate differs. The ngMAIC-PIE method demonstrates considerably faster convergence than the conventional ePIE method for the target test object (Fig. 4). In an experiment, when reaching the iteration termination condition Et=0.002, the minimum numbers of iterations for ePIE, MAIC-PIE, and ngMAIC-PIE are 155, 70, and 78, respectively. In addition, the computation times achieved by ePIE, MAIC-PIE, and ngMAIC using an I7-6700HQ CPU with 24 GB RAM are 4989.45, 3302.60, and 2720.68 s, respectively (Fig. 7). Compared with MAIC-PIE and ePIE, the computation time of ngMAIC-PIE is reduced by 17.62% and 45.37%, respectively. Experimental results demonstrate that the proposed method can effectively improve the convergence speed and reduce the calculation time. In addition, the proposed method demonstrates higher time efficiency than MAIC-PIE.Conclusions A ngMAIC-PIE strategy is proposed to improve the convergence speed and time efficiency of ePIE, in which the multiple axial intensity constraints and ePIE reconstruction methods are employed alternatively. The proposed strategy maintains the fast convergence characteristics of MAIC-PIE. Moreover, the round-trip iteration calculation between CCDs can be reduced in the ePIE reconstruction stage, which improves time efficiency and reduces the calculation time. Simulation and experimental results show that the proposed method exhibits fast convergence and high time efficiency. Furthermore, we compared the proposed ngMAIC-PIE with MAIC-PIE and the traditional ePIE. The results demonstrate that MAIC-PIE and ngMAIC-PIE can obtain reasonable solutions quickly, with improved reconstruction quality in previous several iterations. In subsequent iterations, ngMAIC-PIE and MAIC-PIE exhibit nearly similar convergence characteristics and both converge faster than ePIE. The proposed ngMAIC-PIE strategy is both simple and effective and demonstrates fast convergence and high time efficiency.
Oct. 27, 2021Vol. 48 Issue 21 2109002 (2021)
Weili Wang, Fengping Yan, and Luna Zhang
Objective The fibre laser working in the eye-safe 2.0-μm band is an important pump source for producing the ~3--5 μm mid-infrared laser, and the single-longitudinal-mode fibre laser has the characteristics of large gain, good coherence, and stable spectrum. This laser can be applied to laser optical radio, coherent optical communication, optical fibre sensing, optical fibre remote sensing, and other fields having large light source requirements. The wavelength-switchable fibre laser has a flexible output laser wavelength, which has great application value in the wavelength division multiplexing and multi-parameter sensing systems. The single-longitudinal-mode thulium-doped fibre laser operating in the 2.0-μm band has a wide range of applications, and it is necessary to further study and optimize its performance. Single-longitudinal-mode fibre lasers have excellent and better power stability than the traditional semiconductor lasers, and their modulation amplitude does not change with the modulation frequency. However, there are very few reports on the 2.0-μm-band spatial optical network. The 2.0-μm-band wavelength division multiplexing system requires the single-longitudinal-mode and multi-wavelength thulium-doped fibre laser. In our study, we reported a three-wavelength-switchable single-longitudinal-mode thulium-doped fibre laser based on a Fabry-Perot fibre Bragg grating filter. Under the normal room temperature condition, this laser can obtain the single-longitudinal-mode, high stability, ultra-high optical signal-to-noise ratio, and high power output. Therefore, this study has an important application value in space optical communications.Methods The experimental structure of the proposed laser is shown in Fig. 6. A 793-nm laser diode was used as the pump source, pumping a 2-m thulium-doped fibre. The circulator ensured the one-way operation of the optical path in the cavity; a three-channel narrow-band Fabry-Perot fibre Bragg grating filter and a fibre Bragg grating were fabricated using the phase-mask method. The fibre Bragg grating was placed on a translation stage and its reflection wavelength was changed using stress to make it overlap with each channel of the Fabry-Perot fibre Bragg grating. The optical signals passing through the filters can be selected and most of the longitudinal modes can be suppressed to vary the laser wavelength. The polarization controller balanced the gain and loss of the intracavity signal to stabilise the output with the highest optical signal-to-noise ratios. Two 50∶50 couplers formed an 8-shaped sub-cavity, which effectively increased the longitudinal mode interval in the composite cavity, so that each channel of the Fabry-Perot fibre Bragg grating filter obtained single-longitudinal-mode lasing. The 10% port of the 90∶10 coupler was used to output the laser, and the 90% port was connected to the main cavity. By reasonably adjusting the length of each resonant cavity, the single-longitudinal-mode output of the proposed laser was realized.Results and Discussions The transmission spectrum of the self-made Fabry-Perot fibre Bragg grating filter had three narrow-band filtering channels with the centre wavelengths of 1941.48, 1941.57, and 1941.65 nm; the corresponding 3-dB bandwidths were 0.060, 0.054, and 0.066 nm, respectively. The 3-dB bandwidth of fibre Bragg grating was 0.11 nm and the reflectivity was ~97%. The centre wavelength of the fibre Bragg grating was matched with the centre wavelength of the three transmission channels of Fabry-Perot fibre Bragg grating through a translation stage (Fig.5). The designed 8-shaped sub-cavity expanded the longitudinal mode interval in the cavity to 0.3 nm, which was greater than the 3-dB bandwidth of each channel of the Fabry-Perot fibre Bragg grating filter, ensuring the single-longitudinal-mode lasing in each channel (Fig. 7). Switching between different laser wavelengths was achieved by changing the reflection wavelength of the fibre Bragg grating under the normal room temperature condition and the output lasers with three different wavelengths (Fig. 8). The wavelength fluctuations were less than the minimum resolution of optical spectrum analyser, which was 0.05 nm. Each lasing’s power fluctuations were less than 0.39 dB, 0.61 dB, and 0.55 dB (Figs. 9 and 10). The experimental results indicated that the laser could work with a good stability in 50 min. Using a spectrum analyser to observe the frequency spectra of the output laser, it was seen that the laser worked at the single-longitudinal-mode operation stably (Fig. 11).Conclusions In the present study, first, the Fabry-Perot fibre Bragg grating filter is analyzed theoretically. Based on the filter, a three-wavelength-switchable single-longitudinal-mode thulium-doped fibre laser is verified. Then, the narrow-band Fabry-Perot fibre Bragg grating and fibre Bragg grating are fabricated. The laser wavelength can be switched among three wavelengths by stretching the fibre Bragg grating in the cavity through regulating the stress adjustment frame. The laser works stably at the single-longitudinal-mode operation by adjusting the polarisation controller. An 8-shaped passive sub-cavity is employed to expand the longitudinal mode spacing. At 24 ℃, the laser wavelengths were 1941.48, 1941.57, and 1941.65 nm and the corresponding optical signal-to-noise ratios were 61 dB, 61 dB, and 60 dB, respectively. The stability of lasing was measured in 50 min. The output power fluctuation of each lasing was less than 0.39, 0.61, and 0.55 dB, respectively. The wavelength fluctuations were less than 0.01 nm, which was less than the optical spectrum analyzer’s minimum resolution of 0.05 nm. Therefore, the three-wavelength switchable thulium-doped fibre laser has stable single-longitudinal-mode output characteristics and can be applied to the fields of optical communication and optical fibre sensing in the 2.0-μm band.
Oct. 18, 2021Vol. 48 Issue 21 2101001 (2021)
All Polarization Maintaining Fiber-Based Optical Comb System with Nonlinear Loop Mirror Mode-Locking
Shiyu Lu, Qing Hao, Tingting Liu, Fei Chen, Xinyi Ren, Xuling Shen, Ming Yan, and Heping Zeng
Objective Compared with the traditional laser, fiber laser has the advantages of simple structure, high stability, and small size, becoming the research focus of practical optical comb. The structure of fiber-based optical comb with nonlinear polarization rotation (NPR) mode-locking is simple, but the refractive index of non polarization-maintaining fiber is easily affected by vibration and temperature, and the long-term stability of mode-locked state and phase-locked state of the oscillator is poor. The optical frequency comb based on semiconductor saturable absorption mirror (SESAM) can improve the influence of environmental noise due to the fully polarization maintaining fiber structure and appropriate damping measures. However, SESAM has the risk of light-induced damage during long-term use. It has a relaxation time of several hundred femtoseconds to picoseconds, bringing additional phase noise and instability to the optical comb. Most of the reports about the long-term stable operation of the comb were obtained in the constant temperature laboratory. In this study, we report a compact optical frequency comb with all polarization maintaining fiber structure. The system had kept stable operation for a long time in the external environment of 10 ℃ temperature fluctuation, and the mixed gas detection experiment was completed. This paper provides a feasible method for realizing practical optical frequency comb.Methods In the study, a mode-locked fiber laser with nonlinear amplifying loop mirror (NALM) was used as the seed source of the optical comb, which was placed in a sealed cavity to achieve isolation from the external environment. Then, the optical power amplification, pulse width compression, and spectrum broadening were studied by using cascaded erbium-doped fiber amplifier, single-mode polarization-maintaining fiber (PMF), and highly nonlinear fiber (HNLF). The broadened spectrum was injected into the f-2f self-referenced detector to detect the carrier envelope offset frequency (f0) signal. Then, by precision controlling the local temperature of the mode-locked fiber oscillator, the length of a piezoelectric transducer, and the current of the pump diode, long-term repetition rate (fr) and f0 locking of the optical frequency comb was achieved. Finally, a high non-linear dispersion shifted fiber (HN-DSF) was connected to the comb application end to generate flat spectrum at 1350--1550 nm. Besides, a gas sample cell filled with 12CO and 12C2H2was used to exam the mixed gas detection experiment. Results and Discussions The repetition rate of the mode-locked laser was 75.27 MHz, and the average power was 4.1 mW. The pulsed light was amplified to 196 mW by a cascaded erbium-doped fiber amplifier, and then the pulse width was compressed to less than 100 fs by a section of PMF fiber. The supercontinuum of the compressed pulse was realized by a segment of HNLF fiber from which the spectrum covered 1000--2200 nm [Fig. 2(a)]. The f-2f self-referenced detector detected f0 signal with signal to noise ratio of 40 dB and line width of 5 kHz [Fig.2(b)--2(c)]. In long-term operation, the drifts of fr and f0 (24 h) in the open-loop were reduced from 6.2 kHz and 310 MHz to 0.51 kHz and 26.9 MHz, respectively [Fig. 4(a) and (b)]. The drifts were further reduced to 10 Hz and 700 kHz in the partially feed-back loop, which satisfied the servo capability of the phase-locked circuit of the system [Fig. 5(a) and (b)]. Finally, the standard deviations of fr and f0 after locking were 358 μHz and 248 mHz in 100 hours operation, respectively [Fig. 6(a)]. In the experiment of gas mixture detection based on the optical frequency comb, a flat spectrum from 1250--1650 nm was generated from a segment of HN-DSF fiber, covering the absorption spectra of various gas molecules including 12C2H2, 12CO, and H2O [Fig. 2(d)]. The obtained 12C2H2 gas detection data was basically consistent with the simulation results of HITRAN database, and the standard deviation of their deviations was only 2.4% [Fig. 7(c)]. Conclusions An all polarization-maintaining fiber optical frequency comb for outdoor application is proposed. The size of the optical frequency comb is 330 mm×340 mm×65 mm. The frequency stability of the optical frequency comb system is about 4×10 -12 in 1 s, and the system can keep fr and f0 stable for a long time under the temperature fluctuation of (22±5) ℃. In addition, in the experiment of wide spectrum detection of mixed gas based on the optical comb, the gas detection data obtained is consistent with the simulation results of HITRAN database, indicating that the optical comb system can be rudimentarily used for outdoor applications such as spectral analysis.
Oct. 18, 2021Vol. 48 Issue 21 2101002 (2021)
Yi Hong, Xia Hou, Dijun Chen, Cuiyun Zhou, Minjie Huang, Tieqiang Song, Guibing Wang, Jian Zhao, and Weibiao Chen
Objective Compared with the traditional 780 nm saturated absorption spectroscopy, modulation transfer spectroscopy has higher sensitivity and resolution. It is very suitable for laser frequency stabilization. Nowadays, most of the researchers focus their attention on the hyperfine D2 line 5 2S1/2 (Fg = 2)→5 2P3/2 (Fe= 3) of Rb 87 modulation transfer spectrum frequency stabilization technology. However, there are few reports on the hyperfine D2 line 5 2S1/2 (Fg=1)→5 2P3/2 (Fe=0,1,2). The main reason is that the saturation absorption peak and error signal amplitude of the latter are much smaller than the former. But the frequency of hyperfine D2 line 5 2S1/2 (Fg=1)→5 2P3/2 (Fe=0,1) cross resonance peak of Rb 87, which is suitable for the re-pumping laser needed by cold atomic clock system to cool rubidium atoms, has great research significance. Therefore, it is necessary for us to study it. Methods By main oscillator power amplifier and efficient frequency doubling of 1560 nm distributed feedback laser with a periodically poled lithium niobate (PPLN) crystal, we have obtained a 780 nm laser about 200 mW. We mix the modulated probe laser with the local signal and get the error signal of modulation transfer spectrum. In order to get better signal-noise ratio (SNR), the signal is amplified and passed by a low-pass-filter. We also change the modulation frequency and modulation depth of electro-optic modulator (EOM) to increase the amplitude of the error signal. The laser frequency is locked to the D2hyperfine transition 5 2S1/2(Fg=1)→5 2P3/2(Fe=0,1) of Rb 87 via proportional-integral-derivative (PID) controller and we get a 20 h laser frequency stability data finally. We change the polarization of probe laser and pump laser by adjusting the optical structure, so as to study the influence of different polarization states on the error signal of modulation transfer spectrum. By changing the absorption length of rubidium cell (25 mm and 50 mm), we study its effect on laser frequency stability. Results and Discussions We find that the error signal on the hyperfine D2 line 5 2S1/2 (Fg=1)→ 5 2P3/2 (Fe=0,1,2) of Rb 87 can be influenced by different polarization of probe laser and pump laser. Only when the probe laser and pump laser are linearly polarized in the same direction can there be a clear and large single error signal on the D2 hyperfine transition 5 2S1/2(Fg =1)→5 2P3/2(Fe=0,1) of Rb 87(Fig. 3). There will be no locking error on this transition compared with probe laser and pump laser are perpendicular polarized or circular polarization. We finally lock the laser frequency on this transition for 20 h and measure laser frequency is 384234489.5 MHz (the theoretical calculation is 384234490.2 MHz, with a difference of 0.7 MHz). The peak to peak amplitude of frequency fluctuation is 105 kHz in 20 h. The Allan deviation of the frequency stability is 3.7×10 -11when the integration time is 1 s and 4.6×10 -12 when the integration time is 10000 s (Fig. 7). The influence of rubidium cell absorption length on frequency stability is studied. We find the amplitude of error signal in 50 mm is higher than that in 25 mm (Fig. 5). The 1 h frequency fluctuation of rubidium cell in 50 mm is 80 kHz, which is less than that in 25 mm (152 kHz). The 1 s frequency stability of rubidium cell in 50 mm is 3.7 × 10 -11, which is also less than that in 25 mm (5.4 × 10 -11), but 1000 s frequency stability about the same (Fig. 6).The results show that increasing the absorption length of a single rubidium cell will produce a higher SNR, which will be beneficial to the short-term laser frequency stability. However, its effect on the long-term laser frequency stability is not significant. Perhaps the long-term laser frequency stability depends on other factors, such as the temperature control of rubidium cell and EOM. Conclusions The reason for the difference of modulation transfer spectroscopy (MTS) error signal, which is caused by probe laser and pump laser in different polarization directions, on the hyperfine D2 line 5 2S1/2 (Fg = 1) → 5 2P3/2 (Fe= 0,1,2) of Rb 87 is analyzed theoretically. The influence of the absorption length of rubidium cell on the frequency stability is studied. The laser frequency is locked on the D2hyperfine transition 5 2S1/2(Fg =1)→5 2P3/2(Fe=0,1) of Rb 87 via modulation transfer spectroscopy, The results show that the peak to peak frequency fluctuation is 105 kHz in 20 h. The Allan deviation of the frequency stability is 3.7×10 -11when the integration time is 1 s and 4.6×10 -12 when the integration time is 10000 s, which meets the requirement of cold atom platform for cooling atoms.
Oct. 18, 2021Vol. 48 Issue 21 2101003 (2021)
Zhitong Li, Yiming Zhao, Zuohan Li, and Qingsheng Pang
The orthogonal Porro prism resonant cavity has strong anti-detuning characteristics under shock vibration conditions, so it has a wide range of applications in the military and aerospace fields. The ridge line is typically set at 45° when using Porro prisms. A wave plate must be added to compensate for the phase delay introduced by the Porro prism. Quartz Porro prisms are generally compensated by 0.57λ wave-plates (where λ is the wavelength of light). In practice, the optimal compensation azimuth angle range of 0.57λ wave-plates is relatively narrow, and there are numerous azimuths near the wave-plate’s best azimuth angle. Therefore, it is equivalent to weakening the anti-detuning ability of the Porro prism. This study reported that a 0.93λ wave-plate could compensate for the phase retardation of Porro prisms. The 0.93λ wave-plate has a wide optimal compensation range angle, and no angle is close to the optimal compensation range angle. It provides new ideas for the phase delay compensation of Porro prisms.Objective In the optical system shown in Fig. 2, the effective reflectivity of the polarizer is calculated by using the Jones matrix and the relationship between the phase delay of the Porro prisms for linearly polarized light and the Porro ridge angle are analyzed. The resonant cavity shown in Fig. 4, the Porro prism ridge line, is placed at 45°/135°, and the resonant cavity is at a low-Q state when the Q-switch is without high voltage. It is calculated by Jones matrix that two groups of 0.57λ/0.43λ and 0.93λ/0.07λ can make the resonant cavity in a low-Q state. Since the two wave plates in each group of wave-plates are complementary, the 0.57λ and 0.93λ wave-plates are selected for theoretical analysis and experimental comparison. The Jones matrix is used to perform the theoretical simulation of the compensation of the two wave-plates, and the experimental verification is performed in the resonant cavity shown in Fig. 4 based on the hypothetical simulation results. The wave-plate is installed in an adjustable frame with an adjustable angle in the experiment. Under free-running conditions, the wave-plate is rotated while increasing the pumping current to determine the best azimuth angle range for the resonant to be in a low-Q state at the maximum pumping current.Objective and Discussions In the optical system shown in Fig. 2, the phase delay produced by Porro prism is demonstrated in Fig. 3 when the ridge angle is 45°/135°, the effective reflectivity of the polarizer is the largest indicating that the Porro prism produces the largest phase delay at these angles. The Porro prism ridge line angle in the resonant cavity shown in Fig. 4 is 45°/135°. According to the Jones matrix simulation results, the 0.57λ and 0.93λ wave-plates can make the cavity in a low-Q state; at this state, the azimuth angle range of the 0.93λ wave-plate is 3.6°, which is about 3.6 times that of the 0.57λ, as shown in Fig. 5. It can also be seen in Fig. 5 that the 0.93λ wave-plate does not have any other angles that are close to the optimal compensation angle within the adjustment range of 0°--180°. The 0.57λ wave-plate, however, has multiple angles that are close to the optimal compensation angle. The experimental verification, according to the theoretical analysis, shows that the adjustment range of the 0.93λ wave-plate in the low-Q state of the resonator is about 6.8°, and the adjustment range of the 0.57λ wave-plate is about 2.2°, as shown in Table 1. The optimal adjustment range of the 0.93λ wave-plate is about 3.1 times that of the 0.57λ waveplate, which is consistent with the theoretical results. In addition, the output laser parameters of the two kinds of wave-plates are compared, and the results of the energy and pulse width of the two are the same, shown in Fig. 6 and Fig. 7.Conclusions This paper analyzes the phase delay introduced by the Porro prism made of quartz, the number of wave-plates that can compensate the phase delay is calculated using Jones matrix: 0.57λ/0.43λ and 0.93λ/0.07λ. Since the two sets of wave-plates are complementary wave plates, the 0.93λ wave-plate and commonly used 0.57λ wave-plate have been theoretically analyzed and verified by experiments. The results show that the adjustment range of the 0.93λ wave-plate is about 6.8° to make the resonant cavity in a low-Q state, which is 3.1 times that of the 0.57λ wave-plate. The result is consistent with that of the theoretical analysis. In the theoretical analysis, the 0.57λ wave-plate has multiple azimuth angles that make the resonant cavity close to the low-Q state, whereas the 0.93λ wave-plate has only one azimuth angle. This result has been experimentally verified. In the actual adjustment process, determining the best azimuth angle of the 0.57λ wave-plate one by one is necessary, and the 0.93λ wave plate is more convenient. Compared with the 0.57λ wave-plate, the 0.93λ wave-plate has a wider range of optimal angles when compensating the phase delay of the Porro prism, and the adjustment is more convenient. This provides a new choice for the Porro prism compensation wave-plate and ideas for further improving the stability of the laser cavity.
Oct. 27, 2021Vol. 48 Issue 21 2101004 (2021)
Yongzhi Li, Meng Zhang, Dongyu Yan, Guang Zhu, Yuxi Chu, and Minglie Hu
Objective Passively Q-switched laser is widely used in laser ignition, laser processing, nonlinear frequency conversion, and other fields owing to its short pulse width, high peak power, and miniaturization. A composite crystal can further shorten the length of the cavity to compress the pulse width, reduce the loss, eliminate the air gap, and avoid the damage to crystal surface coating caused by air-break. Although the heat can be dissipated via the end face YAG, strong thermal effect remains inside the Yb∶YAG/Cr∶YAG/YAG composite crystal. With the increase in temperature, the number of particles in the lower level of Yb∶YAG increases, augmenting the self-absorption effect of Yb∶YAG at wavelength of 1030 nm, resulting in its low efficiency. In addition, Yb, Cr∶YAG dielectric layer, which has detrimental effect on the laser output performance, will be formed in the center of the composite crystal owing to the preparation technology. The present study proposes a four-layer-bonded composite crystal, Yb∶YAG/YAG/Cr∶YAG/YAG. Among these layers, the outermost one, YAG, plays the role of cooler. YAG as the intermediate layer can dissipate heat and reduce the thermal effect, thus reducing the self-absorption effect of Yb∶YAG, as well as avoid the dielectric layer produced between Yb∶YAG and Cr∶YAG. Experimentally, the good output parameters can be obtained by the Yb∶YAG/YAG/Cr∶YAG/YAG composite crystal.Methods In the present study, passively Q-switched lasers based on Yb∶YAG/YAG/Cr∶YAG/YAG and Yb∶YAG/Cr∶YAG/YAG composite crystals are studied. First, the optimal transmittance of output coupler (OC) is selected to achieve the highest output power. Then, the effect of pump beam radius on the output power is investigated using different collimation-focus ratios. Thereafter, the relationship among pump power of the two types of passively Q-switched lasers, repetition frequency, pulse width, single pulse energy, peak power, and spectrum are studied by optimizing the OC and pump spot. Furthermore, the quality factors (M2) of the laser beams with the two kinds of crystals are measured. Results and Discussions The optimal transmittance of OC for passively Q-switched lasers based on Yb∶YAG/YAG/Cr∶YAG/YAG and Yb∶YAG/Cr∶YAG/YAG composite crystals is 50%, and the output power increases approximately linearly with the increase of pump power. Passively Q-switched laser based on Yb∶YAG/YAG/Cr∶YAG/YAG composite crystal acquires a higher output power of 7.41 W and the slope efficiency of 57% (Fig. 2). When using 1∶2 collimation-focus ratio (diameter of pump spot is 210 μm), the maximum output power is achieved and the output power of passively Q-switched laser based on Yb∶YAG/YAG/Cr∶YAG/YAG composite crystal increases more rapidly as the diameter of pump spot increases as compared with that of passively Q-switched laser based on Yb∶YAG/Cr∶YAG/YAG composite crystal (Fig. 3). At the maximum pump power (17 W), the repetition rate, pulse width, single pulse energy, and peak power of passively Q-switched laser based on Yb∶YAG/YAG/Cr∶YAG/YAG composite crystal are 25.5 kHz, 4.6 ns, 290.6 μJ, and 63.2 kW, respectively. Overall, compared with passively Q-switched laser based on Yb∶YAG/Cr∶YAG/YAG composite crystal, passively Q-switched laser based on Yb∶YAG/YAG/Cr∶YAG/YAG composite crystal has the lower repetition rate and pulse width, higher single pulse energy and peak power (Fig. 4), and better beam quality at the same output power (Fig. 8).Conclusions We experimentally demonstrate a highly efficient passively Q-switched laser with Yb∶YAG/YAG/Cr∶YAG/YAG composite crystal pumped by a LD with a wavelength of 940 nm. The output performances are investigated based on Yb∶YAG/YAG/Cr∶YAG/YAG and Yb∶YAG/Cr∶YAG/YAG composite crystals with different transmittances of OC and diameters of pump spot. Based on the Yb∶YAG/YAG/Cr∶YAG/YAG composite crystal, the maximum average output power of 7.41 W is obtained at the pump power of 17 W. The slope efficiency is 57.0%, while the optical-to-optical efficiency is 43.6%. The laser pulse has a pulse width of 4.6 ns, a repetition rate of 25.5 kHz, pulse energy of 290.6 μJ , and peak power of 63.2 kW. Compared with the passively Q-switched laser based on of Yb∶YAG/Cr∶YAG/YAG composite crystal, Output power, pulse energy, and peak power of passively Q-switched laser based on Yb∶YAG/YAG/Cr∶YAG/YAG composite crystal are raised by 5.6%, 14.7%, and 22.2%, respectively. In the meantime, the M2factors of passively Q-switched lasers based on two kinds of composite crystals at the same output power are investigated, the passively Q-switched laser based on Yb∶YAG/YAG/Cr∶YAG/YAG composite crystal has a lower M2 factor when producing the same amount of power. By comparing the experimental results, passively Q-switched laser based on Yb∶YAG/YAG/Cr∶YAG/YAG composite crystal can achieve better laser output parameters.
Nov. 05, 2021Vol. 48 Issue 21 2101005 (2021)
Tiancheng Zheng, Xianglong Cai, Zhonghui Li, Chencheng Shen, Dong Liu, Jingbo Liu, and Jingwei Guo
Objective Mixtures of H2, CH4, and CO2 gases pumped using a 532-nm laser were studied as visible broadband Raman lasers to illuminate multispectral lasers. To conduct mixed-gas experiments, we must understand the Raman line-widths and gain coefficients of the three gases H2, CH4, and CO2, which are critical for adjusting the ratio of these three gases. The optimization process for mixing H2, CH4, and CO2 gases depends on two parameters: the input pump energy and the partial pressures of these gases. Notably, the most important step is to fully present the pressure- and pump energy-dependence of the Raman components of each order in H2, CH4, and CO2 gases. We hope to achieve simultaneous outputs of some spectral lines with nearly equal conversion efficiencies by controlling the pressure ratio between the three gases during the experiment of mixing the three Raman-active gases.Methods A schematic of the experiments used to study the multiwavelength Raman lasers generation using CH4, CO2, and H2 gases and their mixture in a single Raman cell is shown in Fig. 1. The radiation source was Nd∶YAG second harmonic at 532 nm, obtained from Beamtech Optronics Co., Ltd., with a spot diameter of ~8 mm, a divergence angle of less 1 mrad, and a pulse duration of 6 ns. All the experimental results were achieved at a fixed repetition frequency of 1 Hz. First, the pump beam was passed through a Pellin-Broca prism to avoid backward-shifted radiation. Then, it was focused using a lens L1 (f=1000 mm) at the center of the 1.80-m long Raman cell. Thereafter, the pump and Stokes beams were recollimated at the exit of the cell window using the same lens L2 (f=1000 mm) and dispersed via the same Pellin-Broca prism. Finally, the dichroic mirror was used to measure the backward scattering.Results and Discussions Fig. 3 presents the energy conversion efficiencies of the pump energy to various Raman components against the gas pressure fixed on the pump energy of 103 mJ for the H2, CH4, and CO2 gases, respectively. There are clear differences in energy distribution among the multiple orders of Stokes and anti-Stokes scattering in each of the three gases. We explain the favored BS1(the first Stokes in the backward direction) in CH4 for the large ratio between the forward and backward gain coefficients. Further, the strongest high-order Stokes in H2 can be observed owing to the biggest Raman gain. Four-wave mixing can play a considerable role in high pressure owing to the smallwave vector mismatch in CO2。Notably, various Stokes components among the three gases at the low pressure of 0.5 MPa have similar features (Fig.4): the conversion efficiencies for various Stokes components, especially for S1, will be stable at high pump energy. Fig.5(a) shows that the conversion efficiencies of different Raman components vary with the pump energy for a mixture of 0.45 MPa CH4, 0.4 MPa CO2, and 0.3 MPa H2. We can obtain 13 spectral lines (Table 2), in which the 574-, 630-, 683-, and 771-nm lasers own nearly equal conversion efficiencies (6.5%--8%) at the high energy region above 180 mJ, and the 532-, 853-, and 954-nm lasers reach 14%, 2.1%, and 1.9% efficiencies, respectively. Compared with the individual gas, we found that CH4 S1 (the first Stokes in the forward direction) yields the minimum threshold, followed by H2 and CO2. Furthermore, the S1 conversion efficiency of CH4 in the mixture is almost as good as that of the pure CH4 gas, while the S2 conversion efficiency (the second Stokes in the forward direction) is approximately two times than that of S1 owing to the additional H2 harming the BS1 in CH4. Compared with the unique H2 gas, the decrease of S1 (683 nm) in the mixture is due to a new pump laser that generates 853-nm laser by pumping CH4, which will compete with the formation of S2 (954 nm) in H2, leading to the decrease of the 954-nm laser. More attention should be given to investigate specific competitive mechanisms in the mixture.Conclusions In this paper, we have investigated the multispectral Raman system using H2, CH4, and CO2 gases as Raman media. The high-order Stokes light in H2 is the strongest among the three gases, especially S2. CH4 has the strongest BS1, causing the fierce competition with forward Raman light. The effect of S2 produced via four-wave mixing in CO2 gas is more obvious under high pressure. At low pressure, the conversion efficiency of each Stokes component (especially S1) of the three gases can reach saturation at high pump energy. We achieve the simultaneous outputs of 13 spectral lines, covering the wide visible spectral region by controlling the pressure ratio between different gases in the experiment of mixing the three Raman-active gases. A strong competition and interaction exist between the Raman-active gases in the mixture, especially between H2 and CH4gases. Thus, we conclude that combining multiple gases using a single laser and a single Raman cell can produce multispectral Raman laser outputs. Similarly, using 355-nm or other short-wavelength lasers, rich spectra can be generated, which will have paramount applications in the fields of laser color display, biomedicine, underwater communications, and atmospheric detection.
Oct. 18, 2021Vol. 48 Issue 21 2101006 (2021)
Changyang Liu, Yunxia Jin, Hongchao Cao, Fanyu Kong, Yonglu Wang, and Jianda Shao
Objective Fluoride film is used in infrared bands because of its excellent optical properties, including a large bandgap that results in increased transparency. Particularly, yttrium fluoride (YF3) has a broad transmission range, from ultraviolet (UV) to infrared (IR). Different deposition methods are used to obtain different optical properties for YF3thin films. Electron beam deposition is the most popular technique owing to its high productivity. However, this film is porous and has a low packing density. Therefore, it absorbs much IR energy in the water absorption bands and its optical properties are likely to be unstable. Alterenatively, sputtering creates films with a high packing density. However, YF3 thin films are easily contaminated with oxygen and crumbled. Unfortunately, to our knowledge, little work has been done to address the issue. Therefore, investigating how the deposition affects the material’s composition, structure, and optical properties is important.Methods The sputtering material was YF3 ceramic target (99.9% purity, 100-mm diameter, 3-mm thickness). All YF3 thin films were deposited on germanium wafers at room temperature by radio frequency magnetron sputtering at different deposition power in a vacuum chamber. Sputtering power of 150, 200, 250, 300, and 350 W were selected to deposit YF3 films. However, the thin films easily crumbled when sputtering power was more than 300 W. Therefore, three power parameters of 150, 200, and 250 W were selected. The vacuum chamber was evacuated to a 5×10 -5 Pa base pressure with turbomolecular and mechanical pumps. Presputtering was performed for approximately 10 min with a shutter covering the substrate before film deposition. The target-substrate distance is 15 cm. Under 1.0 Pa at room temperature, the deposited power changed step by 50 W from 150 W to 250 W. To maintain the film thickness at 1000 nm, deposition time lasted for 5, 4, and 3 h at 150, 200, and 250 W, respectively. The sputtering deposition conditions of the YF3 films are listed in Table 1. The crystalline structure of the films was identified using glancing incident X-ray diffraction (GIXRD, Philips X’Pert-Pro) with Cu Kα source (40 kV, 40 mA). The incidence angle was 1.5° and samples were scanned in a 2θ range of 10°--90° with a scan step size of 0.05°. The sample compositions were examined using X-ray photoelectron spectroscopy using a monochromatized Al Kα X-ray source with a step size of 0.8 eV. In addition, these coating samples’ surface morphology and spectrum transmittance were analyzed using atomic force microscopy and Fourier transform tnfrared spectrometer.Results and Discussions Fig. 1 shows the XRD patterns of as-deposited YF3 films grown on Ge wafers at 150, 200, and 250 W, and YF3 ceramic target, respectively. Different deposition power contributes to forming the orthorhombic YF3 crystal structure with different preferential orientations, and no evident peak belonging to cubic yttrium oxide appears in the samples. Fig. 2 shows the XPS survey spectra for the surface of the YF3 thin films using different deposition power in the 0--1400 eV range, no peaks from other elements appear in the scan except yttrium (Y), fluorine (F), oxygen (O), and carbon (C). Besides Y and F elements, all samples contained O. When deposited by 150 W, the ratio of atomic number fraction between F and Y elements is the smallest (~2.03), and the oxygen atomic number fraction is 9.59%, which is the highest. The atomic concentrations of Y and F are close to the theoretical values for the stoichiometry of the YF3 at 200 W and 250 W. Simultaneously, the films have an oxygen atomic number fraction of 5.74% and 5.19% from Table 2. The refractive index of YF3 thin film was fitted from 2000 nm to 8000 nm using OptiChar software; the refractive index parameter increases with power. To ensure the accuracy of refractive index fitting, the refractive index parameters obtained through fitting were substituted into OptiChar for transmittance parameters. The black line in Fig. 7 represents experimental transmittance, whereas the red dot line represents fitted transmittance, indicating that the refractive index is accurate. Film RMS and TIS values are listed in Table 3.Conclusions Some work has been done with more than 200 ℃, the thickness of the thin films was less than 300 nm, and oxygen atomic number fraction was more than 15%. In this work, we successfully deposited 1000-nm-thick YF3 films through radio frequency magnetron sputtering on germanium substrates at room temperature by adjusting the deposition process. The research shows that YF3 thin films deposited using 200 W had less than 6% oxygen atomic number fraction, low absorption, and a refractive index are higher than 1.6 from 2 μm to 8 μm.
Oct. 18, 2021Vol. 48 Issue 21 2103001 (2021)
High-Resolution Focusing Diagnosis Technology on Ti-Target X-Ray Diffraction Using Toroidal Crystals
Tong Yao, Miao Li, Jun Shi, Wanli Shang, Zuhua Yang, Feng Wang, Guohong Yang, Minxi Wei, and Ao Sun
Objective Fusion energy based on inertial confinement fusion (ICF) is both efficient and environment friendly. It is necessary for ICF research to diagnose weak X-ray signals by focusing on imaging. Because the crystal has a periodic and regular arrangement of internal atoms and the lattice spacing is close to the order of X-ray wavelength, the X-ray diffraction spectrometer can obtain relevant information about the X-ray source using the crystal as the spectroscopic element; thus, the crystal spectrometer is an important part of the spectrum diagnostic instrument. Several types of crystals that are currently being developed have some issues. Planar crystals, for example, do not have the ability to focus rays. Likewise, the cylindrically bend crystal spectrometers are not suitable for diagnostic experiments using coupled fringe cameras. The application of spherically bend crystals for self-luminous imaging requires Bragg angle close to 90°, limiting the imaging energy spectrum selection range. As a result, the development of a crystal spectrometer for diagnosing X-rays with both strong-focus performance and high-resolution is an urgent need for plasma X-ray diagnosing technology for the current ICF devices with ever-increasing performance. This paper proposes a toroidal quartz crystal that can perform focused imaging on Ti-target X-ray at 4.75 keV. The results of simulations and experiments show that after the Ti-target X-rays are diffracted by the toroidal quartz crystal, they have good imaging focusing performance on the sagittal and meridional planes and can achieve high spatial resolution imaging results.Methods A quartz crystal with a toroidal structure was proposed in this paper. First, the imaging principles and properties of spherical and toroidal crystals were investigated and analysed. Then, to demonstrate that the toroidal crystal had high-resolution properties, the X-ray diffraction of spherical and toroidal crystals was simulated in this paper using the X-ray diffraction tracing principle. The diffraction results of various crystal structures were compared and analysed while the radiation source and imaging object remained constant. Then, the imaging spatial resolution of spherical and toroidal crystals in the sagittal plane was calculated. In addition, a Ti-target laser device, an IP plate, and a toroidal quartz crystal were used to complete the X-ray backlight imaging experiment. The imaging results of the toroidal crystal were obtained through actual experiments and the actual resolution was calculated. Finally, the differences between the actual and simulated results were analysed. The related influencing factors were discussed in this paper.Results and Discussions The toroidal crystal’s X-rays have good imaging spatial resolution in the meridional and sagittal planes. The imaging grid’s length in both directions is 500 μm, which meets the imaging magnification relationship, and the shape of the imaging grid has almost no deformation [Fig. 4(b)]. The toroidal crystal has a spatial resolution of aproximately 5 μm in the meridional and sagittal planes [Fig. 5(b) and Fig.5(d)]. The simulation of focusing imaging on spherical and toroidal crystals indicates that the circular spot can be better focused and imaged after being diffracted from the toroidal crystal. The size of the imaging spot is roughly equal to the size of the original source. In addition, the sizes of the imaging spots on the meridional and sagittal planes are nearly equal (Fig. 6). From the simulation of the focused imaging of the source, it can be concluded that the toroidal quartz crystal proposed in this paper has strong-focus characteristics and can effectively focus the source, thereby improving the intensity of rays, which is useful for subsequent data processing and analysis. The actual experiment of diffraction focusing imaging on a Ti-target laser device with a pulse width of 920 ps and energy of 1137.34 J can achieve the resolution of 10 μm.Conclusions We propose a toroidal quartz crystal and conduct a simulation study based on X-ray diffraction tracing using a toroidal crystal and a spherical crystal of the same material under the same conditions. The focused imaging image of X-rays diffracted by toroidal crystals has a high spatial resolution in the meridional and sagittal planes, as determined by comparing and analysing the imaging results of X-rays diffracted by two crystals of different structures. Metal grids in both planes can be clearly distinguished, and the imaged metal grids show almost no deformation. The imaging result data is used to calculate the simulated imaging spatial resolution, which is approximately 5 μm. The Ti-target laser device is used as the source in the experiment to test the effect of diffraction imaging of the quartz crystal’s toroidal structure. The backlight imaging experiment yields a focused imaging image with a magnification of five on both the meridional and sagittal planes. The spatial resolution of X-ray diffraction imaging of toroidal quartz crystal is estimated to be 10 μm. The imaging spatial resolution obtained by the simulation and imaging spatial resolution measured by the experiment differs slightly. The difference depends on the actual source’s size, geometric aberrations, and crystal defects. In future, we intend to discuss the aforementioned factors that influence resolution. In conclusion, the quartz crystal with the toroidal structure proposed in this paper has the ability of strong-focus and high-resolution, which can meet the requirements for the spectral diagnosis of high energy density plasma.
Oct. 18, 2021Vol. 48 Issue 21 2103002 (2021)
Yanru Tang, Di Zhao, Xuezhuan Yi, Jie Chen, Yanna Tian, and Shengming Zhou
Objective The third generation of lighting source, light emitting diode (LED), has the advantages of energy savings and environmental protection, no startup delay, low energy consumption, and long life. As a result, it is widely used in traffic signal display, street lighting, car lighting, home lighting, high-power stadium lighting, liquid crystal display backlight, full-color display, and other fields. Currently, the white LED which is composed of blue LED chips and cerium-doped yttrium aluminum garnet (Ce∶Y3Al5O12, abbreviated as Ce∶YAG) yellow phosphor conversion materials is mainly used for white light illumination and display. Part of the blue light emitted by the blue LED is absorbed by the cerium ion in the yttrium aluminum garnet and converted into yellow light, which is mixed with the remaining blue light to form white light. As the power of the blue LED chips increases, the requirements for the luminescence performance and thermal stability of yellow phosphor conversion materials also increase. Yellow phosphor conversion materials are mainly phosphor powder, phosphor glass, phosphor crystal, and phosphor ceramics. Researchers at home and abroad have conducted several in-depth studies on the luminescence properties of phosphor conversion materials. However, there are only a few reports on the effect of excitation conditions and environment on the luminescence performance of blue LED chips and then on the luminescence of white LED chips.Methods The changing trend of blue LED chip electroluminescence (EL) spectra is studied based on two excitation modes—constant temperature and constant current. Ce∶YAG phosphor ceramic has been made and processed to a suitable size and encapsulated on the blue chip to form a white LED. The white LED is fixed inside the integrating sphere’s bracket to perform a constant temperature and variable current excitation test. The ambient temperature of the test was 15 ℃, and a pulse driving current of 150--1000 mA was applied. The photoluminescence (PL) spectra and the photoelectric data of the white LED with constant temperature and variable currents were measured using the HAAS-2000 high-precision rapid spectroradiometer. The white LED was fixed on the temperature control bracket inside the integrating sphere to perform the excitation test with constant current and variable temperatures. Pulse currents of 500 and 1000 mA were selected, and a variable temperature environment of 15--145 ℃ was applied to the temperature control bracket. The PL spectra and the optoelectronic data of the white LED under the constant current and variable temperature conditions were measured using the HAAS-2000 high-precision rapid spectroradiometer. The results have a reference value for the blue LED control and white LED encapsulation.Results and Discussions The EL spectra of the blue LED chip and the PL spectra of the white LED (Ce∶YAG phosphor ceramic and blue LED chip package) are studied with two modes of constant temperature and constant current. The results show that the emission peak of the blue LED chip generates a blue shift with the increase of excitation current at a certain temperature (Fig. 1). Under the condition of constant excitation current, with the increase of temperature, the emission peak of the blue LED chip appears red shift (Fig. 3). Under constant temperature conditions, the emission peak of white LED does not change with the increase of excitation current. However, the relative intensity of the emission peak decreases with the increase of current (Fig. 6). When the excitation current of the white LED is a fixed value, the emission peak of the phosphor ceramics is redshifted with the increase of ambient temperature. The relative intensity of the emission peak increases with the increase of ambient temperature (Fig. 8). With the increase of the excitation current, the color temperature of white LED increased. When the ambient temperature is less than 100 ℃, the color temperature of white LED does not change significantly, while when the temperature exceeds 100 ℃, the color temperature increases significantly (Fig. 9).Conclusions Under constant temperature conditions, the emission peak of a white LED does not change as the excitation current increases; whereas, the relative intensity decreases. When the excitation current of a white LED remains constant, the emission peak of phosphor ceramics redshifts as the ambient temperature increases. As a result, the relative intensity of the emission peak increases with the increase of the ambient temperature. Therefore, the working conditions and the environment of white LED lighting affect the optical parameters of the white lighting products. For the application and the quality management of lighting products, it is necessary to strictly match the absorption and emission wavelengths of phosphor conversion materials and blue light LED chips, as well as pay attention to the influence of working environment temperature on product performance.
Oct. 27, 2021Vol. 48 Issue 21 2103003 (2021)
Xu Zhang, Lailin Ji, Dong Liu, Yanqi Gao, Zhan Sui, Xiaohui Zhao, and Xia Xiang
Objective High-efficiency broadband third-harmonic conversion is one of the key technologies of laser inertial confinement fusion driver. In the research of laser-driven inertial confinement fusion (ICF), neodymium glass laser frequency tripling (351 nm) is generally used to target to effectively improve the coupling efficiency of laser and plasma. At the same time, further increase the relative bandwidth (Δν/ν) of the laser to ~1%, which can effectively suppress the increase in instability during the interaction between the laser and the plasma, and reduce the generation of backward stimulated scattering and hot electrons. However, on account of high-speed optical field modulation technology, narrow gain during high-gain amplification, and narrow high-efficiency frequency tripling bandwidth, the current output bandwidth of the laser driver is not greater than 0.3 nm (100 GHz). The broadband characteristics of super luminescent light and the wide, narrowband and frequency schemes provide a new way to realize this research.Methods A numerical solution method for the harmonic conversion process under high power conditions is deduced. The necessity of studying super luminescent light is analyzed, and according to literature, a numerical model of super luminescent light is built, and combined with the numerical model of super luminescent light, the coupled wave equation for numerical simulation of the frequency tripling process of super luminescent light is given. The thickness of frequency doubling crystal and frequency tripling crystal is optimized to obtain the optimal solution under corresponding conditions. It also analyzes the evolution of the efficiency and spectral characteristics of the narrow-band light with high time coherence as the sum frequency of the fundamental frequency light and the super luminescent light frequency doubled light. In addition, the direct frequency tripling process of super luminescent light, and the wide, narrowband sum frequency scheme of super luminescent light frequency doubled light and narrowband light input at different frequencies, and the wide, narrowband sum of super luminescent light fundamental frequency light and narrowband frequency doubled light are compared and analyzed. Frequency scheme. To judge the results of super luminescent light frequency tripling with different bandwidths, different wide, narrow bands and frequency schemes.Results and Discussions Through simulation, it can be found that when the frequency doubling crystal is 19 mm, the fundamental frequency light intensity can obtain a more stable and efficient frequency doubling conversion efficiency in the range of 2-3 GW/cm 2. At this time, the frequency doubling conversion efficiency is ~84.3% (Fig. 3). Therefore, the ratio of the narrow-band fundamental frequency light energy to the super luminescent light pulse energy is set to 0.843: 2, which can make the ratio of the number of photons of the fundamental frequency to the frequency doubled in the sum frequency process close to 1∶1. Choosing a 6 mm thick sum-frequency KDP crystal, the corresponding frequency tripling conversion efficiency can be as high as 44% (Fig. 3). By comparing the simulation results of the sum frequency of the broadband doubling frequency and the narrowband fundamental frequency and the direct frequency tripling (3 THz) of the super luminescent light pulse, it can be found that the introduction of narrowband can make the light intensity range 3-4 GW/cm 2. The maximum efficiency of the internal frequency tripling is increased from 5% to 44%. And its frequency tripling spectrum width is about 1.9 THz (Fig. 4). By comparing the wide, narrow and frequency processes of the super luminescent light input of different bandwidths, it is found that under the condition of 6 mm of the frequency tripling crystal thickness, the wideband fundamental frequency input of 2 THz and 1 THz can be fully converted over the entire spectrum. Obtain the frequency tripling spectrum waveform that is basically the same as the frequency doubling input, but as the bandwidth of the frequency doubling decreases, the bandwidth of the obtained frequency tripling will also decrease (Fig. 5). In addition, the super-radiation optical broadband fundamental frequency and narrow-band frequency multiplication and frequency schemes are compared, and it is found that the efficiency and spectrum results are consistent with the compensation for group velocity (Fig. 6). Conclusions This paper establishes a numerical calculation model for the frequency tripling process of super luminescent light, simulates the frequency tripling process of super luminescent light frequency doubled light and narrow-band fundamental frequency light, and compares and analyzes the direct frequency tripling of super luminescent light and broadband super luminescent light frequency based. The frequency tripling and narrowband fundamental frequency optical sum frequency scheme proves that the wide, narrowband sum frequency scheme can effectively reduce the group velocity mismatch in the super luminescent light frequency tripling process, and theoretically can significantly improve the conversion efficiency and output. The frequency tripling bandwidth is close to 2 THz, and the conversion efficiency is greater than 40%, which is about 8 times higher than the direct frequency tripling efficiency of super luminescent light. This research provides theoretical guidance for the subsequent experiments to realize the broadband and efficient frequency tripling process of super luminescent light.
Oct. 18, 2021Vol. 48 Issue 21 2108001 (2021)
Xin Fang, Qinzhong Gao, Jiangjiang Zhang, Yu Wang, Xiaomin Guo, and Yanqiang Guo
Objective The semiconductor laser with external optical feedback (EOF-SL) provides a good platform for the study of nonlinear effects and complex photon dynamics. The high-dimensional chaotic signal output of an EOF-SL has been widely used in chaotic secure communications and physical random number generation. However, the external optical feedback gives rise to a time-delay signature, which reduces the entropy and randomness of a chaotic entropy source. In addition, quantifying the randomness of a physical process from the original analog signals remains to be explored. The randomness of a chaotic laser originates from the inherent quantum noise. Quantum noise can provide a stochastic initial value for the chaotic system, and the randomness of the quantum noise can be rapidly and nonlinearly amplified by the chaotic system. In this study, we propose a technique to effectively enhance the entropy of a chaotic laser via quantum noise. Here a method is proposed to accurately quantify entropy evolution of a chaotic laser and evaluate noise characteristics of the chaotic system. We hope that our basic strategy and findings are potentially beneficial to improve the quality of random number generation and the security of chaotic secure communications.Methods In this work, a chaotic laser prepared by a semiconductor laser with external optical feedback is used as an entropy source. The effects of quantum noise intensity and bandwidth on the entropy enhancement of the chaotic laser are studied numerically and experimentally. The mean value of permutation entropies at the feedback delay time τext, τext/2, and τext/3 is used for quantifying the complexity hdcomp of the chaotic signals. The permutation entropy growth Gd between the adjacent embedding dimensions is used to evaluate whether the chaotic dynamics is noise-dominated or not. In addition, to investigate the influence of quantum noise on the dynamics of the chaotic laser, the theoretical model can be described by Lang-Kobayashi rate equations with Gaussian white noise (GWN-LK). Quantum noise is experimentally prepared through balanced homodyne detection, which is injected into the chaotic entropy source. Then the time sequences of chaotic lasers are recorded by an oscilloscope for the analysis of complexity and entropy growth.Results and Discussion The theoretical results show that the entropy growth Gd is greater than the noise-dominated threshold GdNthr after injecting quantum noise, and Gd increases monotonically and rapidly as the embedding dimension d increases, that is, the chaotic dynamics process is located in the noise-dominated region (Fig. 2). The effects of quantum noise intensity and bandwidth on the hdcomp and Gd show that the injection of quantum noise can effectively enhance the entropy of the chaotic laser, and the effect of entropy enhancement becomes more significant as the quantum noise intensity and bandwidth increase (Fig. 3). In the experiment, the mean entropy hdcomp of the 3.8 GHz bandwidth chaotic laser is increased to 0.999 in the case of quantum noise injection with an intensity of 15 dBm and a bandwidth of 500 MHz, and it demonstrates that narrow-bandwidth quantum noise substantially enhances the entropy of the wide-bandwidth chaotic laser (Fig. 5). The experimental results for hdcomp and Gd of the chaotic laser versus quantum noise intensity agree well with the theoretical results in Fig. 3. As the quantum noise intensity increases, the entropy and complexity of the chaotic laser enhance significantly. The maximum entropy output can be achieved by using quantum noise with a narrower bandwidth, and the chaotic laser with noise domination and entropy enhancement is obtained (Fig. 6).Conclusions In our study, a technique for evaluating and enhancing the entropy of a chaotic laser is proposed. And the complexity of the chaotic laser is quantified by the mean value of the permutation entropies at the feedback delay time τext, τext/2, and τext/3. We observe the entropy enhancement of the 3.8 GHz bandwidth chaotic laser versus quantum noise intensity for different quantum noise bandwidths: 100 MHz, 300 MHz, and 500 MHz. The results demonstrate that narrow-bandwidth quantum noise substantially enhances the entropy of the wide-bandwidth chaotic laser, and the mean entropy or whole complexity of the 3.8 GHz bandwidth chaotic laser is increased to 0.998 in the case of quantum noise injection with an intensity of 15 dBm and a bandwidth of 100 MHz. Moreover, the quantum noise bandwidth, which is needed to enhance the entropy of the chaotic laser to the maximum, decreases as the quantum noise intensity increases. In addition, the entropy growth Gd is used to determine whether the chaotic dynamics process is located in the noise-dominated region. As the quantum noise intensity increases, Gd is greater than the noise-dominated threshold GdNthr. And Gd increases monotonically as the embedding dimension d increases. The results show that the chaotic dynamic process is dominated by random noise, that is, the chaotic laser output dominated by random noise is obtained. The improved chaotic laser has potential applications in random number generation and secure communications.
Oct. 18, 2021Vol. 48 Issue 21 2112001 (2021)
Hanwei Zhang, Zhejian Hong, Xiaoming Xi, Baolai Yang, Peng Wang, Xiaolin Wang, and Xiaojun Xu
Oct. 18, 2021Vol. 48 Issue 21 2116001 (2021)
Fengyun Li, Yue Li, Huaqing Song, Yongqing Yi, Qiuhui Chu, Haoyu Zhang, Shan Huang, Chao Guo, Qiang Shu, Donglin Yan, Rumao Tao, Zhimeng Huang, Lu Pang, Yize Shen, Yi Shi, Cong Gao, Nian Liu, Honglei He, Yuwei Li, Yu Liu, Wenjie Wu, Qihua Wang, Jing Wen, Zhuo Wang, Honghuan Lin, Jianjun Wang, and Feng Jing
Oct. 18, 2021Vol. 48 Issue 21 2116002 (2021)
Zhenxu Bai, Duo Jin, Jie Ding, Yaoyao Qi, Xuezong Yang, Ichardp.mildren R, Yulei Wang, and Zhiwei Lu
Oct. 18, 2021Vol. 48 Issue 21 2116003 (2021)
Dong Shang, Lanxian Sun, Lifeng Qi, Yuanming Xie, and Tong Chen
Objective From iron ore to the final steel processing, accurate mineral content data is essential to maximize raw materials and energy accurately control the manufacturing. Mineral flotation is a beneficiation method in which target minerals and impurities are separated based on the physical and chemical properties of target minerals and impurities and then extracted from the original ore slurry. Content of iron ore slurry directly affects the flotation effect and quality and output benefit of the final product. Therefore, conducting an accurate quantitative analysis of the iron ore slurry composition is essential. Laser-induced breakdown spectroscopy (LIBS) has been widely used to detect material composition owing to its advantages such as online, in situ, and simultaneous measurement of multiple elements. However, self-absoprtion and matrix effects in LIBS affect the accuracy of the analysis. Simultaneously, with the continuous improvement of the spectrometer’s resolution, the data dimension is increasing, including a large amount of redundant information that is unnecessary for component analysis. When using PLS and LIBS for quantitative analysis, the existing research uses spectral line feature selection to reduce dimensionality and nonlinear correction to make improvements separately. To simultaneously reduce the data dimension and correct the nonlinear problem of the data itself, we build a nonlinear PLS model to reduce the influence of self-absorption and matrix effects on the accuracy of quantitative analysis. In addition, the characteristic variables are cyclically filtered to reduce the modeling complexity.Methods PLS is widely used in the quantitative analysis of material components, but as a linear processing method, it cannot resolve the nonlinear effects of self-absorption and matrix effects on the spectrum, reducing the accuracy of quantitative analysis. The characteristic spectrum line n-order polynomial form was proposed to be added to the PLS model. Thus, we can reduce the dimensionality of the data to extract the most useful information and reduce the complexity of the model by filtering feature variables. Taking the iron (Fe) element in the iron ore concentrate slurry as the analysis object, to reduce the influence of self-absorption on the quantitative analysis of the element to be analyzed, 10 characteristic spectral lines of Fe were selected. Simultaneously, to reduce the interference of other elements, 5 characteristic spectral lines of silicon (Si) were selected, and their three-order polynomial form was added to the modeling of PLS to correct the nonlinear influence caused by self-absorption and matrix effect. The regression coefficients of the variables were sorted according to the absolute value, and the optimal variables were determined by cyclically filtering the variables to reduce the interference of redundant information of the variables and reduce the model’s complexity.Results and Discussions Using the training set to build the model and determining the optimal variables and the number of principal components according to the root mean square error (RMSE) of the validation set, we made predictions on the prediction set and compared the traditional PLS model, the nonlinear PLS model with the characteristic spectrum lines three-order polynomial form, and the model proposed in this paper. The RMSE of the traditional PLS model is 1.15%, and the coefficient of determination R2 is only 0.51 (Fig.6). However, the RMSE of the nonlinear PLS model is reduced by 0.85%, and the coefficient of determination R2 is 0.73 (Fig.8). Furthermore, the RMSE of the cyclic filtering variable nonlinear PLS model proposed in this paper is reduced to 0.70%, and the coefficient of determination R2is increased to 0.86 (Fig.11). Conclusions We propose a nonlinear PLS model based on cyclic variable filtering to address the problem that LIBS is used for composition analysis, which is often affected by self-absorption and matrix effects and data redundancy caused by excessively high spectral data dimensions. The analysis object is the Fe element in the iron ore concentrate slurry, compared with the traditional PLS modeling method (Table 2). As a result, the RMSE of validation set is reduced from 1.15% to 0.70%, and the coefficient of determination R2 increased from 0.51 to 0.86. The result shows that the nonlinear PLS model based on cyclic variable filtering can significantly improve the analysis accuracy of Fe in iron concentrate slurry, indicating that this method has evident effects on the quantitative analysis of elements that are greatly affected by the matrix effect and self-absorption.
Nov. 02, 2021Vol. 48 Issue 21 2111001 (2021)
© Copyright 2018-2021 | Chinese Laser Press.
All Rights Reserved 沪ICP备15018463号-20