


Please enter the answer below before you can view the full text.

Qiang Zhao, Hongchao Su, Mingjian Yi, Dongsheng Yu, and Chidong Xu
Objective The dust and other particulate matter generated during the excavation of construction site foundation pits are major sources of urban atmospheric aerosols and an important factor in the frequent occurrence of severe weather, such as haze. Aerosol particles on construction sites are derived from slag transportation and general construction dust, which are unorganized and irregular emissions. However, monitoring data in limited locations cannot fully and accurately reflect the spatial and temporal distribution of aerosol levels in the construction area. Lidar with high temporal and spatial resolution, large range, and real-time remote sensing monitoring capabilities has gradually grown into an indispensable observation device in the field of urban fine particle monitoring and atmospheric science research. Therefore, lidar is an effective method for detecting the spatial and temporal distribution of aerosols during the excavation of foundation pits at construction sites.Methods In this study, a portable micropulse lidar with a 532-nm wavelength emits the laser and receives the backscattered echo signal generated by the interaction between aerosol particles and lasers. Combined with the particle concentration monitor, the Klett and segmented-slope methods are used to invert the aerosol. The horizontal extinction coefficient and particulate matter (PM10) mass concentration are used to ensure that emission of pollutant particles in the entire construction site is always in a known and controllable state.First, a curve with distance as the abscissa and logarithm of the signal as the ordinate is obtained according to the lidar equation. Then, the least squares method is used to plot each small distance in the curve to obtain the linear equation of each distance, and its 1/2 slope is the value of the horizontal extinction coefficient. The aerosol extinction coefficient of a certain distance with the highest correlation among the aerosol extinction coefficients at each distance is selected as the horizontal extinction coefficient at the boundary position. Finally, the distribution of the horizontal extinction coefficient on the detection path is obtained by substituting the boundary value of the extinction coefficient into the Klett equation. Although the atmosphere is assumed to be uniform, it is based on the long-distance detection data, and the average extinction coefficient value of the whole process is taken.Results and Discussion Lidar obtains the backscattered signal of aerosol particles on the construction site to the laser, revealing the horizontal distribution of aerosol during the excavation stage of the construction site.The detection results show that the change in the aerosol particle-level distribution curve at different moments in the excavation area of the site foundation pit first rose and then fell, and an extreme point appeared at 0.18 km. However, the position of the extreme point was not fixed (Fig. 4). The correlation between the extinction coefficient measured by the lidar and PM10 mass concentration measured by the particulate matter quality monitor reached 0.81, indicating that using the extinction coefficient to retrieve the PM10 mass concentration is feasible. The relative error between the measured value of PM10 mass concentration at 0.21 km from October 19 to 22 and inversion hourly average value was between 10% and 30%. Continuous change in the concentration profile of pollutants are essential for determining the location of pollution sources and emission rules and can better reflect the temporal and spatial distribution and change of aerosol levels. The excavation of foundation pits and the export of muck are mainly concentrated in the period of 30--48 h and 54--72 h. The range of 0.09--0.24 km is the area where the PM10 mass concentration changes continuously. Simultaneously, owing to the influence of the southeast wind direction, particulate matter, such as aerosols generated in the construction site, will drift with the wind and spread to the construction site within 1--2 km.Conclusions The results show that the dust and other aerosols generated during the excavation of the construction site's foundation pit are concentrated in the area of 150 m from 0.09--0.24 km. The PM10 mass concentration in the construction site area is significantly higher than that in the surrounding area; however, it will diffuse to the surrounding area, resulting in certain periods. The PM10 mass concentration in the surrounding area is higher than that in the construction site.With the normalization of construction, the change in PM10 mass concentration-level profile and the time of peak appearance are inseparable from the construction schedule of the site. After stopping the construction, aerosol particles will gather in the site area without obvious wind speed. The PM10 mass concentration will be maintained at a high level. Thus, the discharge of pollutant particles on the construction site can be grasped and controlled in time so that the discharge of pollutant particles on the entire construction site is always in a standard and controllable state.
Sep. 16, 2021Vol. 48 Issue 20 2010001 (2021)
Kaipeng Li, Yan He, Chunhe Hou, Jian Ma, Zhengyang Jiang, Weibiao Chen, Peng Chen, Fanghua Liu, Yongqiang Chen, and Shouchuan Guo
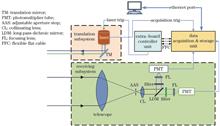
Objective Marine phytoplankton is crucial to the marine ecosystem due to their important roles in the global primary carbon cycle. They can also be used as an evaluation criterion of water property because of their correction to the watercolor remote sensing parameters. Two detection schemes are often used to obtain the distribution of subsurface phytoplankton, including passive remote sensing technology, such as ocean color remote sensing technology, and activity detection technology, for instance, ocean lidar. The ocean color remote sensing is a practical approach to detecting chlorophyll-a (Chl-a) which is a proxy of phytoplankton. However, as a passive remote sensing scheme, the ocean color remote sensing system can only obtain the integral information of upper waters. The vertical distribution of subsurface phytoplankton in the ocean is significantly important for ocean remote sensing study. To obtain the depth-resolved profiles of Chl-a concentration, it is necessary to use the active detection system, such as the ocean lidar system. The conventional ocean lidar systems are often equipped with 532 nm lasers; the 532 nm laser is robust and cost effective and can penetrate ocean water with high-energy pulses. However, a blue laser penetrates and detects clean ocean waters better than a green laser with the same pulse energy. This study presents a novel dual-wavelength ocean lidar (DWOL) system equipped with a dual-wavelength laser, which can emit 532 and 486 nm lasers simultaneously. An airborne experiment and a shipborne in-situ experiment were conducted in the South China Sea to validate the performance of DWOL; the airborne data has been processed to inverse the vertical Chl-a concentration. We hope that our novel DWOL system can be useful in researching the vertical distribution of the subsurface phytoplankton concentration in the South China Sea.Methods The flying speed was around 55 m/s; given that the repetition rate of the laser is 100 Hz, 500 frames of airborne data obtained in 5 s will be accumulated to extend the dynamic range of the detector system. This study will use the Klett method to inverse the airborne data from offshore water to coastal water. The attenuation coefficient of 486 nm and 532 nm channels was retrieved with the Klett method to compare the difference in coefficients between coastal water and oceanic water. The detectors equipped in the DWOL are photomultiplier tube (PMT) detectors. The PMTs will generate a series of after-pulse count (APC) noises after receiving strong returning signals from the upper water, which will mislead the inversion results from the deep water. To avoid the effect of APC and the saturated data returning from the water surface, the airborne data from 80 m to 6 m underwater will be used to analyze the distribution of subsurface chlorophyll concentration. The correction between the shipborne inversed results and the in-situ measurement results will be analyzed to validate the effectiveness of the inversed airborne results. Finally, the swath of about 120 km was selected, and the Chl-a concentration based on the airborne data from the selected swath was inversed to analyze the distribution of Chl-a in the South China Sea.Results and Discussions The profiles of backscattering signals recorded with 486 nm channel and 532 nm channel in continuous 5 s were accumulated to enhance the dynamic range of the detecting system after the effect of after-pulse noise induced by the strong signals from upper water was removed (Fig. 4). The results [Fig. 4(a)] show that the backscattering signals obtained with 486 nm channel are about 25% deeper than those obtained with 532 nm channel, although the attenuation trend in coastal water is almost the same [Fig. 4(b)]. The inversed results of airborne data in coastal water and oceanic water (Fig. 5) show that the attenuation coefficient of 532 nm channel is larger than that of 486 nm channel, which means the 486 nm laser is more suitable for detecting oceanic water. However, the attenuation coefficients of 486 nm and 532 nm channels are virtually equal in coastal water, indicating that the 532 nm laser becomes more suitable for coastal water detection. The asynchronous shipborne experiment was conducted in coastal water and oceanic water. The synchronous shipborne measurement results show that, in oceanic water, the maximum chlorophyll concentration is at 60 m underwater (Fig. 7); the maximum chlorophyll concentration in coastal water ranges from 40 to 20 m underwater (Fig. 6). The correction analysis between the inversed airborne results and the in-situ shipborne results shows that the determination coefficient of correlation between the inversed airborne data and the in-situ shipborne data is above 0.8 (Fig. 9), indicating that the inversed airborne data and the in-situ shipborne measurement results are in good agreement. A flight swath was selected from the tracks, which began the offshore water Swath-A to the coastal water Swath-B and was about 120 km in total. The inversed results of chlorophyll concentration based on the airborne from the selected swath are shown in Fig. 10. The result (Fig.10) shows that the subsurface chlorophyll scattering layer is meanly suspended at 60 m underwater in the offshore water. When the tracks are near coastal water, the subsurface chlorophyll scattering layer raises rapidly and is suspended from 40 to 20 m underwater because the water becomes shallower near the coastal line.Conclusions In this study, we describe a unique dual-wavelength lidar system that simultaneously uses 532 and 486 nm lasers. An aerial experiment and a synchronized shipborne in-situ measurement experiment were undertaken in the South China Sea to test the performance of the dual-wavelength lidar. The inversed findings of attenuation coefficients for the 486 nm and 532 nm channels reveal that the 486 nm blue laser is better for detecting oceanic water, whereas the 532 nm green laser is better for detecting coastal water. The continuous inversed results of Chl-a concentration from coastal water to oceanic water show that the subsurface chlorophyll scattering layer in the oceanic water is primarily suspended at 60 m underwater. In contrast, the chlorophyll scattering layer in coastal water is mainly suspended between 40 m to 20 m underwater. The determination coefficient of correlation between the inversed aerial results and the in-situ shipborne measurement results is more significant than 0.8, showing compelling inversed airborne results.
Oct. 11, 2021Vol. 48 Issue 20 2010002 (2021)
Xiaozhe Ma, Fang Zhang, and Huijie Huang
Objective The step-and-scan photolithography machine is the main equipment for manufacturing integrated circuits used in the key layer preparation. The exposure system of the photolithography machine consists of the illumination system and projection objective. The illumination system is the core of the subsystems, therefore, it is used for several purposes, and it generates an illumination field with a specific intensity profile. The critical dimension uniformity is determined using the uniformity of the dose energy in the scanned exposure field. In and below 28 nm node, the top-Gaussian illumination is an important technology for reducing the influence of the pulse quantization error on dose energy. Considering the matching and consistency of the photolithography machine and the moving range of the wafer platform, the requirements and tolerances of the top-Gaussian illumination field are relatively strict. However, owing to limitations in design, manufacturing, and installation for the microlens arrays, diffuser, and Fourier transform lens (FTL), the dimensions of the top-Gaussian illumination field in scan direction are relatively difficult to meet the requirements directly. The performance of optical elements, such as coating transmittance, may degrade the performance of the top-Gaussian illumination field after long-term use. The general correction methods are focused on the uniformity correction of the illumination field. Therefore, in this study, a correction technology for the intensity profile of the illumination field is proposed. A corrector designed and optimized by this technology can correct the intensity profile and integral uniformity of the illumination field simultaneously. The energy loss can be decreased by considering the dimension tolerances of the intensity profile in the scan direction as boundary conditions during the optimization.Methods The design process of the corrector includes the intensity profile and integral uniformity corrections. The corrector is located at the front of the rear focal plane of FTL with a defocus distance. The illumination field on the rear focal plane of FTL should be transferred to the defocus plane during the design and optimization process. For the conventional illumination mode, the intensity distribution of a field point on the rear focal plane of FTL at the corrector plane is shown in Fig. 5. The intensity profile correction in the scan direction is coupled with the integral uniformity correction in the nonscan direction. Conducting a few iterations of the optimization during the design of the corrector is necessary. To reduce the number of iterations, the integral uniformity of the illumination field in the nonscan direction is corrected. Then, the intensity profile of the illumination field in the scan direction is corrected. Additionally, the dimension tolerances of the intensity profile in the scan direction should be included in optimizing the corrector to reduce the energy loss of the correction of the illumination field.Results and Discussions To verify the feasibility of this technology, correctors are designed for three unsatisfied top-Gaussian illumination fields. Moreover, the transmittance distributions of the correctors are optimized through the simulated annealing algorithm. Fig. 10 shows the transmittance distributions of the designed and optimized correctors. The correctors’ abilities are tested through simulations in LightTools software. The integral uniformities of the three top-Gaussian illumination fields in the nonscan direction are less than 0.29% after correction (Table 6 and Table 7). The dimensions DY_97, DY_50, DY_003, and DY_25~75 of the three illumination fields in the scan direction are [3.79 mm, 4.39 mm], [13.18 mm, 13.58 mm], [23.3 mm, 23.4 mm], and [3.05 mm, 3.44 mm] after corrections, respectively. The correction results show that the integral uniformities and intensity profiles are meet the requirements. The energy loss introduced by the correction is reduced by an average of 4.09%. Furthermore, the time taken by algorithm is less than 10 s (CPU: Intel Core i7-10750H, SDRAM: 16 GB). The consistency of the algorithm and simulation results shows the feasibility and veracity of the proposed technology.Conclusions In this study, a correction technology for the intensity profile of the illumination field in a photolithography machine is proposed. To reduce the number of iterations, the integral uniformity in the nonscan direction of the illumination field should be corrected. Then, the intensity distribution of the illumination field in the scan direction is corrected by the proposed technology. The tolerances of the dimensions of the intensity distribution in the scan direction are taken as the boundary conditions during the optimization to reduce the energy loss of the illumination field. According to three unsatisfied top-Gaussian illumination fields, the correctors are designed and optimized in a relatively short time. The integral uniformities in the nonscan direction and the dimensions of the intensity profiles in the scan direction are satisfied with the requirements after correction.
Sep. 22, 2021Vol. 48 Issue 20 2005001 (2021)
Yan Xiao, Pengxiang Wang, Teng Guo, Ru Gao, and Shumin Ren
Objective Diffraction can affect beam propagation. To reduce its influence, people have tried many means to search for a nondiffracted beam. Airy beam, featuring self-acceleration and self-healing, is a typical nondiffracted beam discovered in exploration. Unfortunately, it carries infinite energy. Later, an Airy beam with finite energy is obtained through truncation in practice. Airy-Gaussian beam is modulated by finite energy Airy beam, ranging from Airy beam to Gaussian beam by adjusting the distribution factor, which is convenient for research. Based on the nonlinear Schrödinger equation, researchers have studied the propagation of Airy-Gaussian beams in various nonlinear media such as Kerr medium, strongly nonlocal nonlinear media, photorefractive media, and obtained many intriguing phenomena.Following the discovery of the nonlinear Schrödinger equation, the fractional Schrödinger equation, which is proposed in the category of quantum mechanics, is discovered. Longhi introduces it into optics, which sparks widespread interest and promptes a series of researches. The propagation and interaction characteristics of Airy and Gaussian beams have been extensively studied within the framework of the fractional Schrödinger equation. However, little research has been conducted on the Airy-Gaussian beam. Therefore, studying the propagation of the Airy-Gaussian beam modulated using the fractional Schrödinger equation is necessary.The split-step Fourier method, considering that diffraction and nonlinearity act independently when the transmission distance is very small, is one of the most common methods to solve the nonlinear Schrödinger equation. Therefore, the transmission process is calculated in two steps, the influence of diffraction effect and nonlinearity effect is considered respectively, and the transmission result of the beam is obtained finally.Methods The fractional Schrödinger equation model is used in this paper to study the interaction of dual Airy-Gaussian beams in the Gaussian potential and the effect of various parameters on the propagation process, including distribution factors, Lévy index, and barrier parameters, is thoroughly examined. The interaction process of dual Airy-Gaussian beams in the Gaussian potential is periodic.Results and Discussions We first consider the effect of the Lévy index and the potential barrier’s position x0 on the interaction process. With the increase of α, the diffraction effect becomes stronger, and the splitting phenomenon gradually disappears, accompanied by the larger angle between the two main lobes and the decreasing transmission period. When α takes a certain value, the energy exchange of the splitting sub-beams occurs after the collision. The position of the potential barrier will affect the propagation period, performing that when x0 increases, the evolution period of the beam becomes larger (Fig. 1). When χ0 is small, the interval parameter B has a certain influence on the period, and with its increment, the effect of the Airy-Gaussian beam on the period decreases, even disappears finally. And the number of peak points varies with the value of B at the same transmission distance (Fig. 2). In addition, when B is assigned different values, with the increase of the transmission distance, the number of peaks changes accordingly, whose number and intensity are always completely symmetric with x=0 in the transmission process (Fig. 3). In the case of in-phase and out-phase, the energy distributions of the beam are symmetric about the center axis. While energy transfer occurs in other phase conditions, the energy distributions are no longer symmetric (Fig. 4). When retaining other parameters unchanged, transmission/reflection ratio and period of beam interaction can be controlled by potential barrier depth p and potential barrier width d0, both of which can decrease the transmission period. Simultaneously, the transmission of the beam in the wall of the potential barrier is weakened, whereas the reflection is enhanced (Fig. 5).Conclusions The interaction of dual Airy-Gaussian beams in the Gaussian potential is studied using the split-step Fourier method in this paper, which is based on the fractional Schrödinger equation. The results show that the interaction between the two Airy-Gaussian beams in the Gaussian potential is periodic and the period can be changed by adjusting the potential barrier parameters. The increase of the potential barrier width and potential depth leads to the decrease of the period, whereas the change of the barrier position leads to the increase of the period. The depth and width of the potential barrier not only affect the periodic variation, but also affect the reflection and transmission of beams. With the increase of the depth and width of the potential barrier, the Gaussian potential’s reflection effect on the beam is enhanced, the transmission is weakened, and the beam reaches total reflection. The Lévy index mainly affects the splitting and diffraction of the beam. With the increase of the Lévy index, the splitting phenomenon gradually disappears, and the diffraction effect is strengthened. When the Lévy index increases to a certain value, chaos will appear after a propagation period. The distribution characteristics of the Airy-Gaussian beam can be adjusted by changing the distribution factor. When the distribution factor is small, the interval parameter can affect the beam period. In addition, the interaction between interval parameter and relative phase will affect the intensity distribution of beam in the transmission process. In the case of in-phase and out-phase, the energy of two beams remains symmetrical in the propagation process, but when a relative phase is π/2 or -π/2, the energy is no longer symmetrical and the energy transfer phenomenon appears. Changing the interval parameter also affects the direction of energy transfer. Our findings can be used to control the propagation direction of a light beam and the number of light beams generated. They have potential applications in optical switches, splitters, and other fields.
Oct. 11, 2021Vol. 48 Issue 20 2005002 (2021)
Yufeng Gong, Xiaochao Wang, Yanghui Tang, Shouying Xu, and Shenlei Zhou
Objective In the implosion process of laser inertial confinement fusion (ICF), several requirements are proposed for the uniformity of the target irradiation and various beam-smoothing techniques, including spectral dispersion smoothing (SSD), have been developed and applied. According to different physical processes, different physical parameters are adopted in different periods to further improve the focal spot smoothing effect. Considering OMEGA as an example, the main pulse generated by its front end is divided into two parts, corresponding to SSD. In the initial part of the pulse, high-frequency multifrequency phase modulation is used to achieve a wide bandwidth output to obtain a better smoothing effect. The relatively narrow spectral width output can smooth the main pulse and suppress the stimulated Brillouin scattering. Finally, the initial part of the pulse and the main pulse form a complete pulse output through the beam combination. The modulation requirements of the pulse light in the main pulse front end of the OMEGA device differ at different time points. However, the pulse light in the main pulse front end of the OMEGA device is realized by splicing time and space; the optical system is relatively complex. Therefore, it is necessary to implement a scheme that can achieve different modulations at different time points, changing the corresponding spectral width. The scheme can meet different spectral width requirements of different time points in the pulse light without beam-splitting modulation.Methods This study investigates the specific phase modulation technology. The specific phase modulation function is obtained by integrating original phase change function of the target. It is essential that the modulation depth of the specific phase modulation function is a time-varying function. The spectrum width can be changed at any time using a specific phase modulation function to modulate the phase of the pulse light. Based on phase modulation spectrum theory, the spectrum characteristics of the laser with a specific phase modulation are analyzed. Using an arbitrary waveform generator (AWG) for digital pulse shaping, two output channels of AWG are used to output specific phase-modulated electrical signal and pulse shaping signal, respectively. After amplifying the two signals of two output channels of AWG using two electric amplifiers, the pulse shaping signal is connected to the bias modulator to shape the output of the continuous wave (CW) laser into the pulse optical input phase modulator. Additionally, a specific phase-modulated electrical signal is loaded onto the phase modulator. The modulation spectrum of 250-ps signal light at different time points in 3 ns is obtained by changing the relative time difference of two electrical signal outputs using AWG. The experimental results are consistent with the theoretical simulation.Results and Discussions To obtain a modulation output with gradually increasing spectral width, phase modulation function f1(t) is obtained by integrating the target phase change function φ'1(t) (Fig. 1). Under the modulation of f1(t), the spectrum (Fig. 6) of the pulse light increases slowly at first. Then, the spectrum width significantly increases as the modulation depth increases, vibrating in a zigzag pattern. The oscillation amplitude of the experimental results is relatively large due to the influence of the measurement accuracy of the spectrometer. Since the signal light has a certain time width, the broadening of the spectrum appears delay and tailing at the beginning and end of the experiment, respectively. If the sampling interval is constant and the signal pulse width is reduced, the oscillation amplitude of the spectrum width with time will increase. However, if the pulse width of the signal light remains unchanged and the sampling interval is reduced, the zigzag oscillation will be smoother. If the pulse width of the signal light is reduced and the sampling interval is reduced, the spectrum width of the signal light changes with increasing oscillation, and it is closer to the absolute value of the phase change function φ' 1(t). To obtain a modulation output with gradually decreasing spectral width, the phase modulation function f2(t) is obtained by integrating the target phase change function φ'2(t)(Fig. 2). Under the modulation of f2(t), the spectral width (Fig. 7) of the signal light increases rapidly at first, reaches the maximum value, and then decreases in zigzag oscillation. The experimental results are consistent with the results of the simulation. At the tail of the f2(t) modulation function, the modulation is smaller, and the modulation change is weaker in the pulse width of the signal light. The analysis and experiment show that the spectrum width decreases rapidly in tail time.Conclusions This study proposes a method of specific phase modulation function. The corresponding time-varying phase modulation function is designed, and its physical process is analyzed. The phase modulation under the function can effectively realize the change in signal light spectral width with time. The experimental results show that under the effect of the designed phase modulation function, the spectral width of the signal light increases or decreases with time. It is consistent with the results of the simulation and verifies the feasibility of the real-time dynamic control of the spectrum. In practical applications, a higher power amplifier can achieve higher modulation voltage output and wider spectrum width adjustment. The research of the specific phase modulation can provide theoretical reference to improve the time domain-smoothing performance, realize dynamic control of spectral width, and improve the control ability of high-power lasers.
Oct. 11, 2021Vol. 48 Issue 20 2005003 (2021)
Qi Zhang, Limin Zhang, Jiayu Wang, Jingyi An, Jing Wang, chen Chen, and Feng Gao
Objective Early-stage screening and treatment of mucosal tissue lesions are particularly important for mucosal cancer prevention. Since most mucosal lesions originate from the superficial epithelium, that is sub-diffusive regime, where the diffusion approximation theory is no longer applicable. In the sub-diffusive regime, the second-order phase function parameter γ has a great effect on the sub-diffusive reflectance, in addition to the absorption coefficient μa and reduced scattering coefficient μ's. Therefore, traditional diffuse reflectance spectroscopy (DRS) technique has some deficiencies in the early detection of mucosal lesions. Sub-diffusive reflectance spectroscopy (sDRS) technique can collect the light at short source-detector separations, which experiences fewer scattering interactions and carries more information about the microstructure of the tissue. Meanwhile, sDRS can achieve quantitative and multi-parameters detection, making it more suitable for mucosal tissue screening. In order to determine the optical properties of mucosal tissue, a spatially resolved reflectance in sub-diffusive regime measurement system was designed and digital lock-in detection technique was adopted to improve measurement speed and suppress random noise.Methods In this study, the sDRS system is composed of light source module, hand-held optical fiber probe, data acquisition module, central control module, signal processing and human-computer interaction module. By collecting the reflection light of multi-wavelengths (520, 650, 785 and 830 nm) and multi-source-detector separations (220, 440, 660, 880 and 1100 μm), the system realizes the detection of spatially resolved sub-diffusive reflectance spectrum. In this system, digital lock-in detection technique of square-wave modulation is adopted by which the four wavelength light sources are excited simultaneously, and the five detectors are used to detect the reflected light parallelly. In addition, the system noise and the ambient light interference can be suppressed, which is extremely meaningful for detecting weak light. In order to demonstrate the feasibility of the system, a series of experiments are conducted to assess the system’s performances in terms of stability, linearity, ambient light suppression, and anti-crosstalk among multi-frequency channels. To further verify the effectiveness of the proposed system, turbid phantom experiments are carried out. Herein India ink and polystyrene microspheres are used to simulate the absorption and scattering properties of mucosal tissue, respectively. A modified forward Monte Carlo numerical model based on optical fiber probe geometry and Gegenbauer-kernel phase function and 3D lookup-table algorithm are used to predict the three optical parameters (μa, μ's, γ) simultaneously and quantitatively.Results and Discussions The assessment results show that the fluctuation ratio of the system is less than 1.5% (Fig. 2); the crosstalk ratio among multi-frequency channels is less than 3% (Fig. 3). At different intensities of ambient light, all the voltage amplitudes obtained based on the digital lock-in detection technique are very low and almost unchanged (Fig. 4). When the intensity of the light source increases with a specific step, the correlation coefficients of the corresponding detection values obtained by linear fitting are all close to 1 (Fig. 5 and Table 1). Turbid phantom experiment results show that the predicted values and true values of optical parameters demonstrate satisfactory consistency (Fig. 6 and Table 3), under the condition that the numerical simulation noise cannot exactly match the experimental noise. These experimental results prove the feasibility and effectiveness of the proposed system and its potential application in mucosal lesion recognition.Conclusions In this paper, towards practical application, a spatially resolved reflectance in sub-diffusive regime measurement system combined with digital lock-in detection technique was designed, which has the advantages of non-invasiveness, portability and speediness. A series of preliminary system evaluation experiments and turbid phantom experiments verify that the system possesses good stability, linearity, anti-frequency crosstalk ability as well as strong anti-ambient interference ability, and can effectively predict the three optical parameters simultaneously, indicating the feasibility and effectiveness of the proposed system. In the future work, we will further study the potential application of sDRS in the detection of mucosal lesions in vivo.
Oct. 11, 2021Vol. 48 Issue 20 2007001 (2021)
Junyi Ouyang, Zhongliang Li, Teng Liu, Nan Nan, Xiaona Yan, and Xiangzhao Wang
Objective Optical coherence tomography (OCT) has been widely used in clinical medicine, materials science, tissue engineering, among other fields due to its advantages of non-destructive, non-contact, high speed, and high resolution. In the traditional OCT system, which is based on Gaussian beam illumination, the lateral resolution is determined by the size of the focused spot of the Gaussian beam. However, the smaller the focused spot, the shorter the depth of focus, and the rapid drop of the lateral resolution outside the depth of the focus area. Therefore, improving the depth of the focus, while maintaining a high lateral resolution is one of the important problems to be solved in a high-resolution OCT system. Bessel beam is used to extend the depth of the focus of the OCT system because of its non-diffracting property. Bessel beams can be generated by the optimal solution of the first-order circular Dammann grating (CDG), and the depth of the focus can be extended effectively, while the diffraction efficiency can reach 81%. However, in the existing CDG design, the splitting effect of the first-order diffraction ring will lead to a zero-energy dent in the axial direction of the central spot of the Bessel beam, resulting in a short depth of focus. To solve this problem, this paper proposes a depth of focus extension method, which eliminates the axial energy dent of Bessel beam generated by CDG. Moreover, it can effectively reduce the splitting effect of the first-order diffraction ring, improve the uniformity of axial intensity distribution within the depth of the focus range of Bessel beam, and realize the depth of the focus extension of the OCT system.Methods In this paper, by optimizing the radius of the central circle of the CDG and the ratio of the binary phase in a single period, we design a CDG for generating Bessel beams that eliminate the energy dent, and apply it to the OCT system, which effectively extends the depth of the focus of the system. Based on the principle of the CDG diffraction, the CDG parameters that meet the requirement of eliminating the first-order diffraction ring splitting are derived and the optimal CDG design is obtained. We use the software simulation to prove the feasibility of the design. Based on our simulation, we set up a swept-source OCT system with the CDG. The system is used to imaging the samples of polystyrene microspheres embedded in agarose gel and multilayer white tape to verify the effectiveness of the focal depth extension and the imaging capability of the system.Results and Discussions The energy dent in the depth of focus of the Bessel beam generated by CDG diffraction is eliminated, and the axial intensity uniformity is improved [Fig. 8 (c), (d)]. Based on the CDG design, we built a swept-source OCT system, the axial resolution in the air is 8.24 μm (Fig. 11). Imaging results of the polystyrene microspheres measured by the system show that the system can achieve a lateral resolution of 3.9 μm over the depth of the focus range of 1.8 mm (Fig. 12). Additionally, the system is used to image human nails and multilayer white tape samples. In OCT imaging of human nails, the boundary between the cuticle and nail can be clearly distinguished, and the nail extending under the skin can be observed [Fig. 13 (a)]. Furthermore, the optical thickness of the multilayer white tape sample is about 2 mm. The layered structure of the multilayer white tape can be clearly distinguished in the OCT image, and the air layer between the white tape and the upper surface of the glass slide can be observed [Fig. 13 (b)].Conclusions Based on the diffraction principle of CDG, the energy splitting effect of the first-order diffraction ring of the CDG is reduced by optimizing the central circle radius of the CDG and the ratio of the binary phase in a single period. On the premise of maintaining a higher first-order diffraction efficiency, the axial energy dent of Bessel beam generated by the CDG is eliminated, and the depth of the focus is effectively extended. A swept-source OCT system based on Bessel beam illumination is built by the optimized CDG. By measuring polystyrene microspheres embedded in the agarose gel, it is proved that the system can achieve a lateral resolution better than 3.9 μm over the depth of the focus range of 1.8 mm, which is consistent with the calculated theoretical result of the depth of the focus and lateral resolution. By using the system, clear tomographic images of human nails, white tape, and other samples were obtained, which verified the imaging ability of the system.
Sep. 15, 2021Vol. 48 Issue 20 2007002 (2021)
Min Li, Hongqian Mu, Muguang Wang, Xinhang Wei, and Xiangshuai Guan
Objective The arbitrary waveform generator (AWG) has been widely utilized in wireless communications, radar systems, and signal processing due to its benefits of high frequency and large bandwidth. More emphasis has been paid to creating commonly used pulses (triangular, sawtooth, rectangular, parabolic, and Gaussian). Conventional AWG, based on electronics, has a sampling rate up to a few tens of GHz, whereas photonic-assisted AWG, which can break the speed and bandwidth limits of electronics, has become a topic of interest. Compared with other photonic-assisted AWGs, spectral shaping and frequency-to-time mapping can realize arbitrary waveforms with the advantages of low loss, strong system reliability, and easy integration. To further simplify the AWG system based on spectral shaping and frequency-to-time mapping, linearly chirped fiber Bragg grating (LCFBG) is operated as both the spectral shaper and dispersion device for the generation of frequency-chirped and phase-coded pulses. For the generation of arbitrary waveforms, it is difficult to employ CFBG as both the spectral shaper and dispersion device because of the complicated design method and fabrication process of CFBG with an arbitrary spectral response. This paper proposes a simple all-fiber method for arbitrary waveform generation based on the frequency-to-time mapping. The design scheme of CFBG with an arbitrary spectral response is simplified, and with the assistance of the dispersion characteristic of CFBG, the user-defined arbitrary waveform can be achieved accordingly.Methods This study proposes an all-fiber and straightforward method for arbitrary waveform generation based on frequency-to-time mapping. First, the design scheme of LCFBG with an arbitrary spectral response is simplified. The relationship between refractive index modulation amplitude and grating reflectivity is derived from the transmission loss formula. By adjusting the amplitude scaling factor M1 and the normalized position of the spectral vertex of the refractive index modulation M2, the reflective spectral response can be optimized to achieve high reflectivity (≥ 90%) and low error (less than 10%). The effects of grating parameters, such as length and chirp coefficient, on reflection spectrum shape are analyzed. And then, frequency-to-time mapping introduced by the dispersion characteristic of LCFBG has been utilized to convert the designed reflection spectrum of LCFBG into a temporal waveform. In this way, the user-defined arbitrary waveform can be realized. Generated pulse shape and temporal width can be adjusted flexibly by redesigning the LCFBG, and the repetition rate is identical to that of the broadband optical source. This simple and flexible method may provide a useful reference for arbitrary waveform generation and application.Results and Discussions The system feasibility and performance are analyzed and verified on Matlab and Optisystem platforms. Triangular-shaped LCFBG is taken as an example to demonstrate the proposed design scheme of LCFBG. To realize target triangular-shaped LCFBG, we derive the refractive index modulation using the transmission loss formula and obtain the corresponding reflection spectrum via the transfer matrix method. The amplitude scaling factor M1 and normalized position of a spectral vertex of the refractive index modulation M2 is introduced to reduce the error between the target triangular-shaped spectrum and obtained reflection spectrum (Fig. 2 and Fig. 3). In addition, the effects of grating length and chirp coefficient on the spectral bandwidth are analyzed (Fig. 5 and Fig. 6). We explore the effects of the grating period and index modulation depth errors introduced in the grating fabrication process for practical applications. The grating period error has a more serious effect than index modulation depth error (Fig. 7 and Fig. 8). Besides the triangular-shaped spectrum, the proposed LCFBG design scheme also caters to LCFBG with an arbitrary spectral response. We present the simulation results of LCFBGs with sawtooth-, rectangular-, trapezoidal-, Gaussian-, and parabolic-shaped spectra (Fig. 4 and Figs. 9--11). User-defined arbitrary waveforms are then realized with the help of LCFBG’s dispersion characteristic. To examine and test the system viability, examples of commonly used key waveforms (triangular, sawtooth, rectangular, trapezoidal, Gaussian, and parabolic pulses) are employed (Fig. 13 and Fig. 14). Small amplitude oscillation on frequency-to-time mapped waveforms are induced by both limited uniform pieces in transfer matrix method and steep leading edge of the reflection spectrum.Conclusions Based on a simple design of LCFBG and frequency-to-time mapping, a low-cost, all-fiber scheme for arbitrary waveform generation is suggested in this paper. The relationship between grating reflectivity and refractive index modulation amplitude is derived from the transmission loss formula, leading to the reverse design of LCFBG with an arbitrary spectral response. The amplitude scaling factor M1 and the normalized position of a spectral vertex of the refractive index modulation M2 are introduced to optimize the reflective spectral response with high reflectivity (≥90%) and low error (≤10%); and yet, for designing LCFBG reflection spectrum with steep leading edge, the error will be higher. The dispersion characteristic of LCFBG maps the specified reflection spectrum into a temporal waveform. We tested the system’s practicality and performance using the Matlab and Optisystem platforms. After frequency-to-time mapping, various waveforms (triangular, sawtooth, rectangular, trapezoidal, Gaussian, and parabolic waveforms) have been successfully created.Furthermore, both transform-limited pulse sources and temporally-gated incoherent sources can provide broadband spectrum for arbitrary waveform generation, corresponding to coherent and incoherent frequency-to-time mapping. Compared with coherent frequency-to-time mapping used in this manuscript, incoherent frequency-to-time mapping has a lower cost but requires averaging operation to improve the signal-to-noise ratio, hindering real-time measurement. This simple and flexible method of arbitrary waveform generation has a certain reference value for arbitrary waveform generation and application.
Oct. 11, 2021Vol. 48 Issue 20 2006001 (2021)
Jun Ruan, Hao Sun, Zhijun Zhu, Lin Tian, Wanli Xu, Baofeng Wu, and Xiaohan Sun
Objective With the continuous development of power transmission systems from west to east, the advantages of ultrahigh voltage (UHV) direct current (DC) transmission have become increasingly evident. The optical fiber link used in the UHV DC control and protection system may fail, exposing the system to risks. Existing methods for inspecting the performance of the optical fiber link in such systems are deficient. Only a part of the optical fiber can be used to test the attenuation using a light source and an optical power meter, and the quality of the optical fiber link requires manual evaluation. Faults along the optical fiber link and decreasing transmission performance are difficult to determine during operation and maintenance, thus representing a security risk to the UHV DC control and protection system. Because the use of a light source and an optical power meter to detect link faults in the control and protection system requires cooperation on the two ends of the link, it is difficult to determine the fault location, which is not conducive to failure cause analysis and rectification. Considering the high security requirements of UHV DC transmission, phase-sensitive optical time-domain reflectometry (Φ-OTDR) is employed to detect and locate weak faults in the optical fiber link of the control and protection system.Methods The proposed Φ-OTDR system prepared under laboratory settings comprised an optical transmission module, optical fiber interferometer, sensing optical fiber, optical receiver module, simulated weak fault source, signal processing module, etc. The fault status and environmental information of the key components of the UHV DC control and protection system are simulated, and information from time-domain backscatter phase modulation at the bottom of the Φ-OTDR system is obtained and analyzed experimentally. The information entropy algorithms of segmentation, multiplication, and integration are introduced to determine the failure status of the key components of the control and protection system of the simulated UHV DC transmission project and environmental information. Furthermore, the location accuracy of weak faults is evaluated.Results and Discussions In the experimental system, different frequencies and weak displacement vibrations are simulated. First, disturbances are applied to collect 20 raw datapoints at 1.8 km of the optical fiber link. During the acquisition of the backscatter of the optical fiber link, the difference between the fault signal and background noise is not clear and the signal-to-noise ratio (SNR) is low (Fig. 3). Then, the information entropy algorithm is used to conduct a preliminary signal analysis. The segmented information entropy is proposed after identifying the shortcomings of the conventional information entropy algorithm. The amplitude of the fault signal is divided into k segments in the dynamic range, and the information entropy of the k-segment fault signal is calculated and the sum is used to represent the information entropy of the signal (Fig. 5). Finally, the information entropy location using segmentation and multiplication segmentation is proposed and our study shows that it is more suitable for the system. The improvement in the SNR using the signal processing of the information entropy location considering segmentation and multiplication segmentation is evaluated (Fig. 8). The optimal number of segments for the application of the system is determined (Fig. 9).Conclusions Herein, two algorithms for information entropy location using segmentation and multiplication segmentation are proposed and the results of processing multiple types of mixed signals are compared and analyzed. The information entropy algorithm obtained by multiplying integral segments can considerably improve the SNR of the system when two segments are considered. The location accuracy of weak fault can reach ±1.5 and ±2.0 m, respectively, for 100 and 40 sampling periods, respectively.
Sep. 16, 2021Vol. 48 Issue 20 2006002 (2021)
Jiabi Xue, Shouqiang Lai, Xin Liu, and Dan Zhang
Objective The amplification function that describes an optical signal can be realized in rare-earth-doped polymer optical waveguide amplifiers based on the stimulated radiation of rare-earth ions when they experience excitation at the pump source. As an active device, polymer optical waveguide amplifier can be integrated with multiplexer/demultiplexer, beam splitter, optical switch, and other devices to compensate for various losses in the optical field that may occur during device transmission. To fabricate optical waveguide amplifiers, we typically use an SU-8 photoresist polymer and polymethyl methacrylate (PMMA) as the doping matrices for rare-earth ions. Further, to ensure population inversion of the produced rare-earth ions, pump sources are usually required. A majority of the research spanning the past three decades has focused on selecting semiconductor lasers as the pumping sources. Compared with the end-coupled pumping method using semiconductor lasers as its pumping source, the use of a low-power and low-cost light emitting diode (LED) is a new development trend that can effectively solve the problems of up-conversion problems and polymer waveguide damage caused by high-power semiconductor laser pumping (200--400 mW) sources. Additionally, this development greatly reduces the commercialization costs involved in fabricating these devices and is expected to replace the traditional pumping method of semiconductor lasers. The absorption of the pump source by the polymer matrix material directly affects the gain performance of the rare-earth-doped polymer optical waveguide amplifier. However, SU-8 and PMMA materials are seldom reported to negatively impact absorption performance during the excitation of ultraviolet (UV)-visible LEDs. Based on this point, we utilized SU-8 and PMMA materials in a core layer and fabricated these materials via lithography and reactive-ion etching processes to form passive polymer optical waveguides. We demonstrated the absorption characteristics of polymer optical waveguides with pump sources derived from four different wavelengths of LEDs.Methods Using a one-step lithography process, a rectangular SU-8 polymer waveguide and a Mach-Zehnder waveguide with a cross-section of 5 μm×5 μm were fabricated. A rectangular PMMA waveguide as core material was prepared via lithography and reactive-ion etching. Next, the morphology of these waveguides was characterized using scanning electron microscopy. Using a vertical top pumping mode, the absorbabilities of the SU-8 and PMMA polymer waveguides were measured at 1064, 980, and 635 nm wavelengths under the excitation wavelength of 310, 365, 405, and 525 nm for the LED-based approach as well as an excitation wavelength of 808 nm using the vertical top pumping mode.Results and Discussions For the polymer SU-8 waveguide with a cross-section of 5 μm×5 μm and a length of 20 mm, the optical intensity attenuation reached ~91.7%, 48.3%, and 26.7% at 1064-nm wavelength laser under the LED with excitation wavelength of 310, 365, and 405 nm and 50-mW pump power. The optical intensity could remain stable under the excitation wavelength of 525 and 808 nm using LED and laser, respectively [Fig. 5 (a)]. The optical intensity attenuation reached ~70.8%, 41.1%, and 24.2% [Fig. 6(a)] at 980-nm wavelength laser under the LED with excitation wavelength of 310, 365, and 405 nm, respectively. There was no obvious attenuation of the optical intensity under laser pumping at 635-nm wavelength [Fig. 6(b)]. For an SU-8 polymer waveguide with a length of 20 mm, a thickness of 5 μm, and the widths of 4, 6, and 8 μm, the optical intensity attenuations of approximately 53.1%, 65.1%, and 70.6%, respectively, were obtained at laser with wavelength of 1064 nm for LED with an excitation of 310 nm and 80-mW pump power (Fig. 8). Turning to the SU-8 polymer Mach-Zehnder waveguide, using a 50-mW LED-based pump source, the optical intensity attenuations of approximately 98.9%, 38.1%, and 24.1% were obtained at a 1064-nm wavelength laser for LED with excitation wavelength of 310, 365, and 405 nm, respectively. The optical intensity remained stable for an excitation wavelength of 525 nm using the LED-based approach [Fig. 10(a)]. There was no obvious optical intensity attenuation for the LED-based approach at 635-nm wavelength [Fig. 10(b)], which aligns with results obtained for the rectangular straight waveguide. Finally, for the PMMA polymer waveguide, the optical intensity remained stable for the excitation wavelength of 310, 365, and 405 nm using the LED-based approach (Fig. 11).Conclusions In this study, we measure the optical absorption performance of SU-8 and PMMA polymer optical waveguides with excitation wavelength of 310, 365, 405, and 525 nm for an LED-based pump source, as well as an excitation wavelength of 808 nm for the traditional laser-based approach. Our experimental results show that when pumped by a blue-violet LED, the resulting optical intensity of the SU-8 polymer waveguide sharply decays at the wavelengths of 980 and 1064 nm. Additionally, we observe that the optical intensity attenuation weakens with a red shift of the center wavelength of the LED pump source and a decrease in the size of the polymer waveguide. For the SU-8 polymer waveguide with a cross-section of 5 μm × 5 μm and a length of 20 mm, using a 50-mW LED-based pump source, we attain an optical intensity attenuation of approximately 91.7%, 48.3%, and 26.7% at laser source with wavelength of 1064 nm for the LED with excitation wavelength of 310, 365, and 405 nm, respectively. Conversely, both the 525-nm LED-based approach and the 808-nm traditional laser-based approach, the resulting optical intensity of the SU-8 polymer waveguide remains stable. Further, for the PMMA polymer waveguide, no obvious optical intensity attenuation was observed under the excitation of LEDs. Therefore, we conclude that in rare-earth-doped SU-8 polymer optical waveguide amplifiers pumped by blue-violet LEDs, single-mode and small-size waveguides with a low-power LED pump source should be used to effectively avoid optical intensity attenuation. Here, we note that it is easier to achieve the optical gain using a PMMA polymer as the host for the rare-earth solution when pumped by LEDs.
Sep. 16, 2021Vol. 48 Issue 20 2006003 (2021)
Chunqi Fang, Guangli Yu, Jianyong Ding, Binbin Li, Gaolong Li, Jun Zhou, Xiaolei Zhu, and Wei Wei
Objective The 1197 nm laser is located in the photoacoustic imaging window of the C--H bond, which can be used for the clinical diagnosis and treatment of biological tissues, such as tumors and fats. Additionally, its frequency-doubled yellow light has a wide range of applications in the field of fluorescence detection. However, the 1197 nm Raman laser suffers from low energy and poor reliability, making it unsuitable for engineering applications. In this paper, we conducted experiments to investigate the ways to improve the energy and efficiency of the 1197 nm Raman laser. On the one hand, the beam distribution and energy of fundamental light were improved to demonstrate their effect on Raman efficiency. On the other hand, the Raman laser was optimized theoretically and experimentally. A high-efficiency and high-energy solid-state Raman laser is studied and a prototype of this laser is developed to test its performance.Methods In this study, we investigated an external resonator stimulated by Raman scattering technology and demonstrated a Ba(NO3)2 Raman laser pumped by a Q-switched 1064 nm laser. First, a xenon-lamp-pumped Nd∶YAG laser was constructed. Experiments were conducted using three different cavity length conditions to determine the best cavity length of the resonator and simultaneously increase the output energy. To improve the uniformity of the 1064 nm beam, the laser output coupler adopted a variable reflectivity output mirror. Then, the beam diameter of the Nd∶YAG laser was compressed to 5 mm using a 1.5× telescope to increase the peak power density of the fundamental light. Thereafter, we optimized the parameters of the external-resonator Raman laser according to the rate equation and radiation transmission theories, such as the optimum reflectivity, the threshold of first-order Stokes light, and the highest conversion efficiency. Moreover, the output coupler of the Raman laser was selectively coated to suppress the oscillation of high-order Stokes light. Then, the external-cavity Raman laser experiment was performed and the differences between the experimental results and theoretical values were compared. Finally, a prototype of a 1197 nm Raman laser was built to verify its reliability and stability.Results and Discussions The experimental results of the 1064 nm and 1197 nm resonators are shown in this study. Figure 3(a) shows that 305 mm is the best cavity length under the three cavity length conditions. The maximum output energy, wavelength, and pulse width are 334 mJ, 1064.3 nm, and 10.5 ns, respectively. When the variable reflectivity output coupler is used, the 1064 nm beam is uniform with a flat top distribution [Fig. 3(b)] and the divergence angle is 1.1 mrad. The fundamental beam passed through a 1.5× telescope, and its peak power density was increased to 145.5 MW/cm 2. According to theoretical calculations of the external-resonator Raman laser, the best reflectivity of the output coupler is 55% and the highest conversion efficiency is 52%. Figures 4 and 5 show the output characteristics of the 1197 nm Raman laser. The best transmittance of the output coupler is 40%, which is consistent with the theory. When a 300 mJ 1064 nm laser was injected into the barium nitrate crystal, a steady laser at 1197.81 nm with an output energy of 135 mJ, a pulse width of 7.4 ns, and a divergence angle of 5 mrad was obtained. The maximum conversion efficiency was 46.6%, which was slightly different from the theory. This is because the second-order Stokes light starts to oscillate, and the thermal effect of Raman crystal becomes more severe. A prototype of the 1197 nm Raman laser was developed, as shown in Fig. 6(b). The energy stability (RMS) within 1 h is 0.48% [Fig. 6(a)], indicating that both the output characteristics and reliability meet the requirements of engineering applications. Conclusions We study the solid-state laser technology based on external-cavity stimulated Raman scattering and fabricate a high-efficiency and large energy 1197 nm pulse laser. By varying the resonant cavity length and using a variable reflectivity output coupler, the energy and beam distribution of the fundamental light are optimized. The maximum output wavelength of the 1064 nm laser is 334 mJ, and the pulse width is 10.5 ns. The fundamental beam is compressed by a 1.5×telescope to increase the peak power density and improve the Raman conversion efficiency. In addition, the selective coating on the output coupler suppresses the oscillation of high-order Stokes light, increasing the output energy of the first-order Stokes light. When the injected energy reaches 300 mJ, we obtained a 1197.81 nm laser of 137 mJ with a pulse width of 7.4 ns. The maximum Raman conversion efficiency is 46.6%, and the energy stability (RMS) within 1 h is 0.48%. Generally, the prototype of the 1197 nm Raman laser has been successfully used in medical photoacoustic imaging. The system has the advantages of high output energy and conversion efficiency, good energy stability, and low cost. It can provide high-quality light sources for photoacoustic imaging and fluorescence detection and has broad application prospects.
Sep. 14, 2021Vol. 48 Issue 20 2001001 (2021)
Hong Liang, Fang Wei, Yanguang Sun, Guangwei Sun, and Haiwen Cai
Objective With the development of modern communication network technology, people’s demand for communication capacity has increased dramatically, making the ultra-large capacity and long-distance optical fiber network transmission system a research hotspot in the field of optical fiber communication. As a light source with a comb-shaped spectrum in the frequency domain, the optical frequency comb can significantly increase the transmission capacity of a single optical fiber, make full use of the limited available bandwidth of optical fiber transmission, and become an ideal light source for large-capacity transmission in optical fiber network transmission systems. To improve the stability of large-capacity optical fiber communication system, it is necessary to examine the changes of the optical fiber link in the optical fiber communication system. However, the frequency coverage of the optical frequency comb is relatively wide, about dozens or even hundreds of nm, and the wavelengths needed for monitoring should avoid the band that carries information. Therefore, for a 1550 nm band optical frequency comb conventionally deployed in the current optical fiber communication system, a 1550 nm band laser cannot realize the monitoring of the optical fiber link in the optical fiber communication system. As another essential window of optical fiber communication, a 1310 nm band can realize the transmission with low attenuation and dispersion and has become an essential channel for optical fiber link detection. Therefore, it is necessary to study 1310 nm band narrow linewidth laser to improve the stability of the optical fiber communication system.Methods In this study, we have developed a 1310 nm band hybrid integrated external cavity diode laser based on the single angle facet semiconductor gain chip and fiber Bragg grating. First, the design and fabrication theory of the external cavity diode laser is presented. The fiber Bragg grating and ceramic substrate with V-groove are packaged by full-glue packaging process, which improves the fiber Bragg grating’s thermal sensitivity and mechanical stability. Then, the single angle facet semiconductor gain chip and fiber Bragg grating are coupled with a fiber-tapered lens polished at the front of the fiber Bragg grating. The fiber at the back of the fiber Bragg grating can be used directly as the output fiber. The narrow linewidth laser output is realized by the negative feedback of the sloping edge of the fiber Bragg grating reflection spectrum. The performance of the obtained external cavity diode laser is tested through experiment. Finally, our fabricated external cavity diode laser is applied in an optical fiber sensing system.Results and Discussions Our fabricated external cavity diode laser in the 1310 nm band uses the single angle facet semiconductor gain chip to provide gain and fiber Bragg grating as the frequency-selective element. It has the advantages of flexible wavelength selection, simple structure, and low cost. The performance of the fabricated external cavity diode laser is tested. At the operating temperature of 25 ℃ and operating current of 280 mA, the external cavity diode laser center wavelength is 1309.8 nm (Fig. 2), and 3 dB Lorentz linewidth is 18 kHz (Fig. 4). Moreover, under this operating temperature and current, the power and frequency fluctuation of the external cavity diode laser in 3 h is 0.6 mW and 315 MHz (Fig. 5). Additionally, the tuning characteristics of the external cavity diode laser are measured. When the external cavity diode laser operates at 25 ℃, the laser mode-hopping free current tuning range is 7 GHz, and the tuning coefficient is 47 MHz·mA -1 (Fig. 3). Conclusions A narrow linewidth hybrid integrated external cavity diode laser at the 1310 nm band is developed using a single angle facet semiconductor gain chip and fiber Bragg grating. The external cavity diode laser is integrated in a compact butterfly package. When the external cavity diode laser operating temperature and current are set to 25 ℃ and 280 mA, we obtain a wavelength, 3 dB Lorenz linewidth, power fluctuation, and frequency fluctuation of 1309.8 nm, 18 kHz, 0.6 mW, and 315 MHz, respectively, for 3 hours. Additionally, the laser mode-hopping free current tuning range is 7 GHz, and the tuning coefficient is 47 MHz·mA -1 with an operating temperature of 25 ℃. The external cavity diode laser can be used in fiber sensing and communication.
Sep. 22, 2021Vol. 48 Issue 20 2001002 (2021)
Da Lin, Jing Wang, Bingxuan Li, Wenbin Liao, Zhanglang Lin, Kaifei Tang, Ke Li, and Ge Zhang
Objective Structured light has been exploited in several fields in the past two decades, such as optical tweezers, spiral interferometers, and phase-contrast microscopes. The generation of structured light is generally achieved by utilizing optical elements such as spatial light modulators or spiral phase plates. Because of the limit on output power when utilizing these optical elements to generate structured light, a direct generation of structured light is proposed in the laser cavity. Intracavity generation of structured light could be achieved based on the theory of transverse mode degeneracy. The degenerate range (or lock range), which means a special short range of cavity length, is an important condition for exploiting transverse mode degeneracy to generate structured light. When the cavity length is adjusted to the degenerate range, the degeneracy condition is met. When the cavity meets the degeneracy condition, resonant frequencies of specific transverse modes become equal. In this situation, these specific modes will coherently superpose each other and generate a light field that may exhibit spatial structure. Therefore, the accurate degenerate range plays an important role in utilizing this method to generate structured light. Thus, to the approach of measuring the accurate degenerate range becomes a significant issue, which is what we mainly consider in this research.Methods The degenerate range is determined by the variation of output power or threshold of pump power in some articles. However, the widths of the degenerate range determined using these methods are somewhat approximate; their precision could be improved using other measurement methods. To more accurately measure the degenerate range, we try to exploit the frequency spectra of laser beams to characterize the degenerate range in this paper. As the cavity length is tuned slowly in the experiment, the frequency spectra of laser beams are detected in detail. Two peaks in the spectra that particularly considered in this study to show an obvious process of merging as the confocal resonator approaches the degenerate position. In this paper, the range of cavity length in which the two peaks become superposed is defined as the degenerate range. This type of measurement method is more accurate than the methods that utilize the variation of output power or threshold of pump power to determine the degenerate range because it directly monitors the variation of frequency spectra. We use the frequency spectra measured in experiment to analyze the change of dynamic behavior of transverse modes with different orders.Results and Discussions The frequency data measured in the experiment are shown in Fig. 3. As the cavity length changes, each of these frequencies (ΔfL,2ΔfT,ΔfL-ΔfT,ΔfT, and ΔfL-2ΔfT) show a variation tendency consistent with the theoretical variation tendency. Variations of these detected frequencies indicate the change of dynamic behavior of transverse modes with different orders. By analyzing these frequency spectra, we find that even though competition between modes exists, transverse modes that belong to different degenerate families are not suppressed when degeneracy occurs. The frequency difference of modes with the same order is clearly detected in the vicinity of the degeneration point, and it is not observed away from the degeneration point. From the beam patterns (Fig. 4), we can observe that higher-order transverse modes are generated when the confocal resonator is tuned in the vicinity of the degeneration point. This phenomenon implies that as the resonant frequency of the high-order mode becomes equal to that of the low-order mode, the high-order mode becomes easier to generate in the cavity. The detailed frequency spectra are presented in Fig. 5, using which we determine the degenerate range. As the confocal resonator is tuned to the degeneration point, the two peaks (ΔfL-ΔfT and ΔfT) become closer to each other and finally superpose. The state in which these two peaks are superposed sustains for a short range of cavity lengths. Accordingly, we could obtain the width of the degenerate range, which is approximately 0.20 mm in this experiment. The degenerate range defined in this way ought to be more accurate because it is directly determined from frequency spectra.Conclusions In this paper, the phenomenon of transverse mode degeneracy is researched based on the variation of frequency spectra, and a more accurate method for measuring the degenerate range (or lock range) is proposed. As the cavity length varies in the experiment, frequency spectra of laser beams are recorded in detail. The variation of dynamic behavior of transverse modes before and after the degeneracy is analyzed based on the frequency spectra. When the cavity satisfies the degeneracy condition, the two degenerate families of transverse modes (in 1/2 degeneracy) coexist in the cavity, neither of them is suppressed because of the competition between them. Meanwhile, the beam patterns measured in the experiment show that higher-order transverse modes are generated when degeneracy occurs. As the resonant frequency of the high-order transverse mode becomes degenerate with that of the low-order mode, the high-order mode becomes easier to generate, thus resonating with the low-order mode in the cavity. We achieve a more accurate measurement of the degenerate range with the frequency spectra measured in the experiment. The degenerate range is approximately 0.20 mm in this experiment. It exhibits a higher precision and is more accurate than the degenerate range determined using other methods. The results of this paper may provide some reference value for the application of transverse mode degeneracy.
Sep. 07, 2021Vol. 48 Issue 20 2001003 (2021)
Chi Cao, Bo Wang, Yingbo Chu, Yingbin Xing, Lei Liao, Nengli Dai, and Jinyan Li
Objective With the rapid development of aerospace technology, erbium (Er)-doped fiber amplifier (EDFA) has gradually become the best choice for satellite communication tasks because of its advantages such as high gain, wide bandwidth, and good compactness. However, the Er-doped fiber, a key component of the EDFA, is extremely sensitive to various cosmic rays (gamma rays, etc.). To maintain the performance and life of Er-doped fibers in the irradiated environment, the homemade radiation-resistant Er-doped fiber was developed.Methods Radiation-resistant Er-doped fiber was fabricated using modified chemical vapor deposition (MCVD) technology. The homemade Er-doped fiber was designed with Al-Ge-Ce-La co-doping to strengthen the radiation resistance. Cerium ion-doping technology was used to eliminate color centers due to irradiation. The radiation resistance of the fiber was further improved by adjusting the doping concentration and the ratio of aluminum and germanium. Lanthanum ions were used to reduce the clustering effect of Er ions and improve efficiency. Our fiber’s radiation-induced attenuation (RIA) and radiation-induced gain variation (RIGV) were tested based on Photon Kinetics 2500 and typical EDFA structure, respectively.Results and Discussions The radiation-resistant Er-doped fiber has the core and cladding diameters of 9 and 125 μm, respectively. After irradiation by 60Co, radiation source with a cumulative and average dose of 1500 Gy and 0.2 Gy/s, respectively, Fig.1 shows that RIA of radiation-resistant Er-doped fiber at 980 and 1550 nm is 1.4 and 0.8 dB/m, respectively. The gain-performance test was performed using a typical EDFA structure (Fig.2) with -20 dBm signal at pump source of 1550 and 980 nm. As shown in Fig.3, RIGV at 1550 nm is 0.8 and 0.2 dB at 100 and 500 mW pumping power, respectively. Conclusions In this study, we prepared a radiation-resistant Er-doped fiber through the MCVD process. RIA at 980 and 1550 nm is 1.4 and 0.8 dB/m, respectively. EDFA with -20 dBm signal at pump source of 1550 and 980 nm was built for the gain test. In addition, RIGV at 1550 nm is 0.8 and 0.2 dB at 100 and 500 mW puming power, respectively.The Er-doped fiber shows good antiradiation performance and broad application prospects in the fields of satellite communications, data acquisition, and space exploration.
Sep. 14, 2021Vol. 48 Issue 20 2015001 (2021)
Suochao Yuan, Ming Li, and Zhengshang Da
Objective A light field camera that is capable of capturing four-dimensional light field information through a single shot can be realized by inserting a microlens array in front of the sensor of a traditional camera. It has great potential to play important roles in many applications such as 3D measurement, flow field velocimetry, and wavefront sensing. To obtain the image information, the captured light-field information shall be decoded. The decoding process is largely based on the structural parameters of the light field camera, including the distance between the microlens array and sensor and the pitch of the microlens array. Because of the errors introduced during the manufacturing and assembling processes, using the nominal values of these parameters are not recommended; calibration of the true values and assembly errors are desired. Several studies have been conducted on the calibration of light field cameras. However, most of these studies follow the framework of the calibration method used for traditional cameras, where a complicated imaging model is built and the unknown parameters are searched using an optimization algorithm. The complexity of procedures in such methods makes them difficult to implement. Based on optical test principles, a new calibration method using simpler calibration models is proposed, which enables fast calibration.Methods The proposed calibration method comprises two parts: calibration with the main lens and calibration without the main lens. The calibrations of structural parameters are accomplished when the main lens is mounted, and the calibration model is based on the relation that the exit pupil of the main lens is imaged by the microlens. A uniform light source is used to illuminate the pupil of the main lens to obtain calibration images. The distance between the microlens array and sensor and the pitch of the microlens array are treated as two optimized variables of an optimization model and are calculated by searching the optimal values. The calibration of assembly errors is accomplished when the main lens is removed, and the calibration model is based on the imaging feature of the microlens for object points at infinity. A collimated beam is used to illuminate the microlens array to obtain calibration images. Rotation and tilt errors are obtained by analyzing the geometry of the spot array in calibration images.Results and Discussions A self-constructed light field camera is calibrated using the proposed method. The distance between the microlens array and sensor, for which the nominal value is 2.1300 mm, is calibrated to be 2.2738 mm. The pitch of the microlens array, for which the nominal value is 0.3000 mm, is calibrated to be 0.3001 mm. Furthermore, the distance between the microlens array and exit pupil of the main lens is calculated to be 47.7058 mm (Table 1). The rotation error between the microlens array and sensor is calibrated to be 0.1785°, which shall be corrected according to formula (2), and the pitch of microlens array is calculated to be 0.3001 mm by extracting the distance between adjacent spot centroids on the calibration image. The tilt error between the microlens array and sensor is 0.0083° and 0.0047° along the row and column directions of the sensor, respectively, and the distance between the microlens array and sensor is calculated to be 2.2719 mm based on equation (11). The relative deviation of the calibration values of the distance between the microlens array and sensor obtained from the two different methods is 0.84%. Based on the calibration data, reconstruction of the light field is executed and the rotation error is corrected. Compared with the reconstructed images before calibration, the quality of reconstructed images after calibration improved (Fig.10).Conclusions To solve the problem of calibration of structural parameters and assembly errors of light field cameras, a calibration method based on optical test principles is proposed. A uniform light source is used to illuminate the optical pupil of the main lens, and the array of images of the optical pupil on the sensor is used for calculating the structural parameters, including the pitch of the microlens array and the distance between the microlens array and sensor. The assembly errors can be calibrated with the main lens removed and the microlens array illuminated directly by a collimated light beam. The calibration images captured for assembly error calibration can also be used for estimating the structural parameters through simple geometric analysis, which can serve as comparisons for the calibration results obtained from the method with the main lens mounted. Experiment results show that the calibrated and nominal values of structural parameters agree well with each other, indicating that the proposed calibration method is feasible.
Sep. 29, 2021Vol. 48 Issue 20 2004001 (2021)
Shuqin Zhai, and Nan Yuan
Objective EPR steering is a quantum correlation between quantum entanglement and Bell nonlocality. Multipartite EPR steering, which manipulates information distributed in distinct quantum nodes, is a core resource in secret quantum networks. EPR steering describes a phenomenon in which two particles in the entangled state,Alice and Bob, are spread to distant places. Bob can be steered to a certain eigenvalue quantum state through the measurement of Alice, and Alice can be steered to a certain eigenvalue quantum state through the measurement of Bob. Situations in which Alice can steer Bob’s state but Bob cannot steer Alice’s state, or Bob can steer Alice’s state but Alice cannot steer’s Bob state, are referred as one-way EPR steering. EPR steering has been widely used in one-way quantum communication, such as one-sided device-independent quantum secret key distribution, secure quantum teleportation, and secure quantum networks, due to its unique asymmetric character. The entanglement persistence of continuous variable (CV) Cluster quantum entangled states is better than GHZ states.Many quantum communication operations based on Cluster states have been demonstrated due to their advantages, and the CV Cluster states quantum steering and its applications are exciting. Multipartite EPR steering is demonstrated in this study using a lossy channel in one mode of a quadripartite entanglement state and adding Gaussian noise in another.This study will be useful for advancing quantum information science and provide a reliable guarantee for the one-way requirements of secure quantum communication operations such as quantum teleportation and quantum secret sharing.Methods The schematic of the physical system for manipulating the direction of EPR steering with loss and Gaussian noise is shown in Fig. 1. As shown in this figure, two phase-squeezed optical modes and two amplitude-squeezed optical modes are used as input modes, and they pass through three beam splitters to yield four entangled output modes. The four output modes are described by Â, B̂, Ĉ, D̂. Multipartite EPR steering is demonstrated by introducing a lossy channel in one mode of the quadripartite entangled states and adding Gaussian noise in another mode. Here we consider a lossy quantum channel in mode Â, and after introducing loss, mode Âis converted into mode Â'. We introduces a Gaussian noise in mode B̂by a 99∶1 beam splitter, and B̂is converted into B̂' subsequently. The final modes Â', B̂', Ĉ, D̂are correlated with each other. First, the covariance matrices of the different combinations of multipartite states are reconstructed, then the manipulated quantum steering in bipartite, tripartite, and quadripartite are investigated. The EPR steering parameter versus Gaussian noise is obtained, and in the same way, EPR steering characteristic versus transmissivity in the lossy channel is analyzed. After that, the steering images are compared and analyzed to verify one-way EPR steering.Results and Discussions The changes of EPR steering parameters between different modes with Gaussian noise and transmissivity are analyzed. Fig. 2 shows the steering direction manipulation of (1+1) mode. Fig. 2(a) shows that a one-way EPR steering range varies with Gaussian noise when the transmissivity is settled. Fig. 2(b) shows that EPR steering parameter varies with the transmissivity when Gaussian noise is settled. This shows one-way steering, and two-way steering between Â' and B̂' can be obtained when different Gaussian noise is added. Fig. 3 shows the EPR steering in (1+2) mode and (2+1) mode of the Cluster states. Fig. 4 shows the EPR steering in (1+3) mode and (3+1) mode of the Cluster state. Finally, we analyze EPR steering parameters between two collaboration modes as shown in Fig. 5. Thus, we can achieve different types of EPR steering in a larger range by adjusting the transmissivity of a lossy channel and adding Gaussian noise.Conclusions This study investigates EPR steering among various combinations using quadripartite Cluster entangled states, by introducing loss and Gaussian noise in different modes. When the light modes are distributed in the quantum network, the manipulation effects of the lossy channel and Gaussian noise on the EPR steering are examined. The EPR quantum steering distributed in bipartite, tripartite, and quadripartite is discussed. The theoretical study confirms that the one-way EPR steering manipulation can be realized more easily and widely by adding the lossy channel and Gaussian noise. Gaussian one-way quantum steering directly enriches the one-sided device-independent quantum key distribution and quantum secret sharing schemes. The application of one-way quantum steering, which we study in long-distance secure quantum communication, is also crucial when combined with current quantum communication needs.
Oct. 11, 2021Vol. 48 Issue 20 2012001 (2021)
Pu Zhou, Jinyong Leng, Hu Xiao, Pengfei Ma, Jiangming Xu, Wei Liu, Tianfu Yao, Hanwei Zhang, Liangjin Huang, and Zhiyong Pan
Significance High-average-power fiber lasers have many important applications in advanced manufacturing, energy exploration, and national security benefit from the advantages of compact structure, high electro-optical efficiency, and flexible operation. In 2009 and 2010, IPG Photonics demonstrated a single-fiber single-mode laser with an output power of 9.6 kW and 10.5 kW, respectively, two important milestones in the field of fiber lasers. In the past 10 years (2010--2020), high-average-power fiber lasers and systems of various operation bands have developed rapidly and moved towards large-scale applications. In this paper, the research progress of high-average-power fiber laser technology in the past decade is reviewed.Progress Firstly, the realization history and parameter analysis of 10 kW single-mode fiber laser are given, and the important characteristics of 10 kW single-mode fiber laser is summarized. Specifically, the first one is the tandem-pump technology, the second one is the amplifier structure, the third one is ytterbium ion as the gain medium of the amplifier stage, the fourth one is that the relatively moderate laser output linewidth, and the fifth one is continuous wave operation.Second, the pump technology of high-average-power fiber lasers shifts from single to multiple. The pump source is one of the most critical and costly components in a high-average-power fiber laser system. With the development of semiconductor laser technology and double-clad fiber laser technology, semiconductor laser and ytterbium-doped double-clad fiber are once more the essential configurations in a high-average-power fiber laser system. For a period of time, the brightness of semiconductor lasers is unable to meet the development of high-average-power fiber lasers, so researchers begin to introduce new solutions such as tandem-pump technology. In recent years, with the rapid increase in the brightness of semiconductor lasers and the continuous discovery of new scientific issues, the pumping technology of high-average-power fiber lasers has gradually diversified, which has promoted the development of fiber laser technology.Third, the system structure of high-average-power fiber lasers expands from the amplifier structure to the resonant cavity structure and cavity-free structure. In recent years, with the development of passive devices and semiconductor lasers, the output power of fiber lasers with resonant cavity structures has increased rapidly. In addition, new concepts such as fiber lasers without cavity structures have also been proposed and quickly realized. The high-average-power fiber laser system structure has entered a stage in which various system structures develop parallelly.Fourth, the operation wavelength of high-average-power fiber lasers begins to expand from a short wavelength region to a long wavelength region, and from visible lasers to mid-infrared lasers. Although the radiation spectrum of ytterbium-doped fibers covers 0.96 μm to 1.2 μm, the net gain of the sidebands is relatively small and it is difficult to achieve a high-average-power output directly. Due to the traction of important applications, significant results have been achieved in the above fields. In addition, other new gain media including doped fibers and passive fibers have also been applied to realize a high-average-power output, which enables the operation wavelength of high-average-power fiber lasers to cover from shortwave to longwave, and from visible to mid-infrared.Fifth, the laser linewidth of high-average-power fiber lasers could cover from ultra-narrow linewidth to supercontinuum regions, and high-average-power pulsed fiber lasers have also been realized. The limiting factors for high-average-power fiber lasers with different laser linewidths are different. As for the single-frequency fiber lasers and narrow-linewidth fiber lasers, the stimulated Brillouin scattering (SBS) effect is one of the main issues in the power scaling. As for the broadband fiber lasers, the stimulated Raman scattering (SRS) effect is one of the main issues in the power scaling. In addition, the newly discovered mode instability (MI) effect becomes a technical bottleneck in the power scaling of high-average-power fiber lasers, which has also shown an obvious correlation with laser linewidth. Due to the high peak power of pulsed lasers, the nonlinear effects are more critical in high-average-power pulsed fiber lasers. Therefore, there still exists a gap in magnitude between the highest average power of pulsed fiber lasers and the highest average power of continuous-wave fiber lasers.Prospects In future work, the high-average-power fiber laser technology is moving toward the stage of controllable, which is specifically manifested in three areas. The first one is the controllable pulse characteristics, including repetition rate, pulse width, and waveform. Researchers have achieved an early control of repetition rate and pulse width of high-power fiber lasers. The second one is the controllable spectral characteristics, including center wavelength, linewidth, and spectral shape. With the continuous discovery of phenomena such as the influence of spectral characteristics on nonlinear effects, the ability of scientific researchers to control the spectral characteristics of high-average-power fiber lasers is continuously enhanced. The third one is the controllable spatial-mode characteristics. Mode-controllable high-average-power fiber lasers are currently a hotspot in the advanced manufacturing, which may bring important technological innovations.
Sep. 07, 2021Vol. 48 Issue 20 2000001 (2021)
Jinpeng Liu, Liuya Sun, Mingsheng Niu, Lili Ma, and Jinghu Zhang
Objective Quartz-enhanced photoacoustic spectroscopy (QEPAS), as a relatively mature trace gas detection technology, has promising application prospects. QEPAS has several advantages such as high-quality factor, narrow response bandwidth, strong anti-interference, the small size of detection module, and low cost. However, because the output power of the laser excitation source limits the QEPAS system’s performance, passing the laser beam through the acoustic detection module multiple times can effectively improve the optical power of the gas absorption. Conventional double-pass QEPAS systems, in which the laser beam passes through the acoustic detection module twice, are not visible for photoacoustic signals enhancement. This paper proposes an off-beam QEPAS system based on a lens-reflector combination (LR-QEPAS) in which the laser beam passes through the acoustic detection module four times to achieve a stronger photoacoustic signal. The lens-reflector combination structure comprising a convex lens, concave reflector, and plane reflector is applied to improve the detection limit of the QEPAS system. We hope that the results of this study can be applied to different types of QEPAS systems, allowing us to further improve the detection limit of trace gases.Methods A fiber-coupled near-infrared distributed feedback laser (NLK1E5EAAA, NEL) was used as a laser source; the current and temperature of the laser were controlled by a commercial diode laser controller (ILX Lightwave LDC-3724C). The current of the laser controller was tuned to achieve coarse and fine-tuning of the laser wavelength, respectively. The second harmonic detection was used to enhance the sensitivity of the off-beam LR-QEPAS. A sine wave at half of the quartz tuning fork (QTF) resonant frequency provided by the function generator was used to modulate the laser source and input the laser controller. The reference sine wave at half of the QTF resonant frequency was an input into lock-in amplifier. The piezoelectric signal generated by the QTF was amplified by a low noise trans-impedance amplifier and converted into a voltage signal. A lock-in amplifier (Stanford Research SR850) at the QTF resonant frequency demodulated the amplified signal. The acoustic detection module of the off-beam LR-QEPAS comprises a plane reflector, concave reflector, convex lens, and microresonator. An infrared sensor plate (HCP-IR-1201) and laser beam analyzer S-WCD-QD-1550 (Dataray Inc.) were used to fine-tune the optical path.Results and Discussions The photoacoustic signal of the off-beam LR-QEPAS system increases nonlinearly with the increases of times that the laser beam passes through the miroresonator (Fig. 4) for the laser beam is scattered in the air. The modulation depth of the off-beam LR-QEPAS is compared with the optimized off-beam QEPAS, P-QEPAS, and C-QEPAS systems, and the results show that the systems have the optimal modulation depth of 0.34 cm -1 (Fig. 5). The measurement of the second harmonic signal shows that the off-beam LR-QEPAS system has the highest signal amplitude because the lens-reflector combination effectively increases the power that the laser passes through the miroresonator. The normalized noise equivalent absorption coefficient is 3.46×10 -9 cm -1 ·W·Hz -1/2 (Fig. 6). The Allan variance analysis results show that the lowest detection limit of the off-beam LR-QEPAS system is 7.54×10 -8 with an integration time of 64 s (Fig. 7). The application of the lens-reflector combined structure greatly improves the detection limit. Conclusions The off-beam LR-QEPAS system based on a lens-reflector combination was proposed. The lens-reflector combination structures combined with the second harmonic detection technique were used to measure the water vapor with volume fraction of 1.2% at 1392.58 nm for evaluating the system performance. In the experiment, the off-beam QEPAS and two dual-pass QEPAS systems were used as a reference to determine the optimal modulation depth of the system and verify that the detection sensitivity of the system increases as the number of times the laser beam passes through the miroresonator. The Allan variance analysis shows that the minimum detection limit of the off-beam LR-QEPAS system is 7.54×10 -8 with an integration time of 64 s, and the NNEA coefficient is 3.46×10 -9cm -1·W·Hz -1/2. The results show that the performance of the off-beam LR-QEPAS system is better than that of the off-beam QEPAS, P-QEPAS, and C-QEPAS, and it meets the accuracy requirements in atmospheric trace gases detection. The lens-reflector combined structure significantly improves the sensitivity of the system and can be used in combination with different types of microresonator structures to achieve higher detection sensitivity. The next step will focus on realizing the multipass of the laser beam in the miroresonator, which can be expected to achieve sub-ppbv and applied to the other trace gas detection.
Sep. 23, 2021Vol. 48 Issue 20 2011001 (2021)
Tianyu Shao, Jianqiang Gu, and Wenqiao Shi
Objective Terahertz narrowband filters are indispensable functional devices for terahertz wireless communication, high-resolution spectroscopy, and passive security imaging techniques; the guided-mode resonance (GMR) effect in dielectric grating is a promising route for realizing these narrowband filters. The combination of the particle-swarm optimization (PSO) algorithm and rigorous coupled-wave analysis (RCWA) is a widely used method for devising GMR filters. However, Maxwell equations are usually hard to establish and solve when dealing with more complicated gratings, especially for metasurface gratings. This study proposes a novel automated design method that uses the PSO algorithm to invoke the commercial software, CST, to calculate dielectric grating transmission. By adding a “penalty” item in the fitness function, we design a silicon grating with a GMR at 0.65 THz and a polarization-independent metasurface grating with a GMR at 0.6 THz. The proposed automated design method provides a novel approach for investigating terahertz GMR devices, which may greatly promote the development of terahertz communication, spectroscopy, and passive imaging.Methods Silicon is almost lossless and nondispersive in a terahertz band, making it suitable for narrowband filters. In this study, we set the refractive index of silicon to 3.45, which has been widely used in previous studies. We aimed to design a silicon grating that worked at 0.65 THz and avoided absorption from water vapor. The whole design process was completed using MATLAB, where the PSO algorithm was easy to implement and converge. The whole design process began from program initialization and setting the parameters, in which the binary-coded PSO was used conveniently control the parameters’ resolution. The fitness function adopted herein comprised two parts: the root-mean-square error between the objective and the calculated transmittance and the penalty item used to limit the central frequency. We used the same PSO frame to invoke an RCWA code and the commercial software CST for calculating the grating transmissions (Table 1). The results proved that our method outperforms the RCWA method regarding the design with complicated structures. To experimentally verify our design concept, the designed silicon grating was fabricated using photolithography and deep-reactive ion etching, followed by the measurements with a home-built 8F terahertz time domain spectroscopy system (Fig. 6) at incident angles of 0°, 4°, and 8°.Results and Discussions In the case of a transverse electric (TE)-polarized incident wave, the result obtained from the method using the CST is similar to that obtained by the method using the RCWA. For a transverse magnetic (TM) polarization incident wave, the silicon grating designed by the CST shows a much higher quality factor [Fig. 3(b)]. Moreover, our method can be used to handle more complicated structures, such as metasurface gratings [Fig. 4(a)]. The penalty item in the fitness function limits the central frequency of the metasurface grating at 0.6 THz. Although an additional resonance is located at the higher frequency side, the high-Q resonance satisfies the design requirement. The monitored electric field distribution [Fig. 4(d)] shows nodes and antinodes, which are typical standing wave characteristics, proving that the obtained resonance belongs to the GMR. The fabricated grating sample (Fig. 5) shows an obvious resonance at 0.69 THz under the TE polarization, which slightly deviates from the expected resonance at 0.65 THz. The simulated results illustrate that the resonance of the proposed silicon grating blue-shifts with a decreasing periodicity and an increasing grating height (Fig. 8), which may contribute to the resonance shifts. Changing the incident angles in the measurement splits the resonance at 0.69 THz owing to the broken symmetry of the phase matching condition (Fig. 9), which is consistent with the simulation and proves the GMR attribute of the 0.69 THz resonance.Conclusions In this study, we propose an automated design method for devising terahertz GMR filters. The parameters of a silicon grating working at 0.65 THz and a more complicated metasurface grating working at 0.6 THz are obtained by invoking CST under the PSO framework. The simulated electric field distributions verify the GMR feature of the resonances realized in the gratings. More importantly, compared with the traditional method using the RCWA, our method can achieve high quality factor resonance and handle complex structures. The fabricated silicon grating is experimentally measured to prove our simulation results with 5 GHz spectral resolution. The grating sample shows an obvious resonance at 0.69 THz with 28 GHz linewidth under the normal incident wave. The GMR attribute of this resonance is well proven by the transmittances at the incident angles of 0°, 4°, and 8° and the simulation results show a splitting behavior caused by the angle dependence of the GMR. This automated design method may promote the research on terahertz narrowband filters.
Sep. 26, 2021Vol. 48 Issue 20 2014001 (2021)
Zongdan Jiang, Peili Li, and Guangyue Xu
Objective With the rapid development of communication and computer technology, people's requirements for information transmission and processing are also increasing. The rapid development of wireless communication leads to the lack of spectrum resources and the development of new frequency bands has become a consensus to solve the lack of spectrum resources. Several frequency bands of the terahertz (THz) band which have not been developed and used have attracted people's attention recently. High-performance equipment and easily integrated products are required in THz wave communication systems. Due to the unique properties of photonic crystals, such as photonic bandgap and photonic localization, they are often used to design and manufacture THz wave devices. Currently, most research on the 4-2 encoder based on the photonic crystal focuses on the optical band, while the research on the 4-2 encoder in the THz band is less. Therefore, it is crucial to study the THz 4-2 encoder with high contrast and fast response to meet the increasing demands in information transmission and processing using the THz wave communication system. The development of THz 4-2 encoders has correspondingly promoted the improvement and progress of THz communication systems, which is also an indispensable and crucial part of the THz communication system.Methods Based on the bandgap and local properties of photonic crystals, a novel THz 4-2 encoder is proposed using the photonic crystal. This proposed scheme introduces the line defect waveguide into a complete two-dimensional square lattice silicon photonic crystal. The line defects consisting of four input ports (I0, I1, I2, and I3) and three output ports (V, O1, and O0) are used to achieve the logic function of the THz wave 4-2 encoder. When THz wave is input from input port I0, all THz waves are output from output port V, and the logic state of O1 and O0 is “00”; when THz wave is input from input port I1, most THz waves are output from output port O0 because of the bending waveguide, the logic state of O1 and O0 is “01”; when THz wave is input from input port I2, most THz waves are received at the output port O1, and the logic state of O1 and O0 is “10”. When the THz wave is input from the input port I3, the output ports O0 and O1 are equivalent to an equal ratio beam splitter, and the logic state of O1 and O0 is “11”.The performance of THz wave 4-2 encoder based on the photonic crystal is studied using the plane wave method (PWM) and finite-difference time-domain (FDTD).Results and Discussions The proposed THz 4-2 encoder based on photonic crystal has high contrast ratio and short response time. When THz wave is transmitted from input port I0, the transmittance of output port O1 is 0, and that of output port O0 is 0; when THz wave is transmitted from input port I1, the transmittance of output port O1 is 1.17%, and that of output port O0 is 83.51%; when THz wave is input from input port I2, the transmittance of output port O1 is 83.55%, and that of output port O0 is 1.16%; When THz wave is input from input port I3, the transmittance of output port O1 and output port O0 are both 47.06%. By calculating the contrast ratio, it can achieve 16.04 dB (Table 2). In addition, the response time is not less than 167 ps. The THz wave 4-2 encoder is also not the same under different working wavelengths. According to the research, the THz wave 4-2 encoder has high contrast ratio between 251 and 252 μm (Fig. 8). The length L of short cavity waveguide W7 and W8 will affect the energy of THz wave coupling from input port I3 to output ports O1 and O0. The contrast of the 4-2 encoder can be improved to a certain extent by choosing the appropriate short cavity waveguide length L=5a (Fig. 9). The existence of dielectric pillars A and B also improves the performance of THz wave 4-2 encoder to a certain degree (Fig. 10).Conclusions A novel THz wave 4-2 encoder using a silicon photonic crystal is proposed. In this proposed scheme, the property of coupling with line defects waveguide made of four input ports and three output ports are utilized. The performance of the proposed THz wave 4-2 encoder is studied using the PWM and FDTD. The results show that the encoder can achieve THz binary logic coding in a wide wavelength range of 251--252 μm. The lowest and highest contrasts are 13.27 dB and 18.02 dB, respectively. Meanwhile, the response time reaches the order of ps. THz wave 4-2 encoder has the advantages of small volume, simple structure, high contrast, fast response, low loss, and easy integration. It will be widely used in THz communication in the future.
Sep. 16, 2021Vol. 48 Issue 20 2014002 (2021)
jiaoyan Guo, Wenyu Li, Ran Sun, and Guozhong Zhao
Objective An electromagnetic wave with a spiral wavefront is a vortex beam with an orbital angular momentum(OAM). The OAM vortex beam has a phase factor exp(ilφ), φ is the azimuth angle, and l is the topological charge (integer or non-integer). The vortex beam’s wavefront propagates in a spiral forward, and the intensity of the beam center is close to zero. This unique electromagnetic characteristic has potential applications in optics, atomic physics, and communications. In recent years, the massive capability potential has benefited humans, and the broadband characteristics are the key to effectively improving the channel capacity. Most of the current vortex beam generating devices have shortcomings such as narrow bandwidth and low working efficiency. Methods like spiral phase plates and spatial light modulators are employed in previous studies to generate vortex beams. These methods produce optical devices with issues such as large size and high price. Because metasurfaces can control the phase, amplitude, and polarization of electromagnetic wavefronts, using metasurfaces to generate vortex beams has become a novel method. This method is simple in structure and low in loss, making it ideal for integration development.Methods This paper proposes a terahertz broadband vortex beam generator based on the metasurface of a single-layer double-arrow unit structure. The device is composed of a three-layer metasurface-dielectric-metal structure. The top layer is a metasurface consisting of double-arrow metal structural units, the middle layer is a polyimide, and the bottom metal layer is gold. CST MICROWAVE STUDIO is employed to simulate the reflection performance of the unit structure. Better performance is obtained after optimizing the structural parameters, and a set of optimized structural parameters is determined(Fig. 2). The reflection characteristics of the top single-layer double-arrow unit with its center as the origin and the z-axis as the rotation axis are analyzed when the incident light is set as a circularly polarized wave. Reflective broadband metasurfaces with various topological charges are designed using the unit structure’s ordered arrangement to generate the corresponding vortex beams based on the Pancharatnam-Berry (P-B) phase principle. Metasurfaces with topological charges of 1 and 2 are designed in this study. CST MICROWAVE STUDIO software simulates the reflection amplitudes and phases of the circularly polarized terahertz beams perpendicular to the metasurface and verifies the designed reflective metasurface’s broadband and propagation characteristics.Results and Discussions When the incident wave is circularly polarized, the center of the metal structure of the top double-arrow unit is setted as the origin, and the z-axis is the rotation axis. The reflection amplitude change is relatively stable in the broadband range of 0.9--1.8 THz under different rotation angles, and the phase change with angle is approximately equal to twice the rotation angle(Fig. 4). The broadband and propagation characteristics of the designed reflective metasurface are verified to observe the generation of vortex beams in the entire operating frequency band. The operating frequency of a circularly polarized wave incident perpendicular to a metasurface with a topological charge of 1 is f=0.9, 1.3, 1.8 THz, and the vortex beam’s reflection phases and amplitudes at a distance of 500 μm from the metasurface is given(Fig. 6). It reveals that the reflection phases at the three frequencies are continuously distributed at 0--2π, with a spiral distribution and rotating in a counterclockwise direction. The central dark ring pattern of the near field can be seen in Fig. 6, confirming the existence of the origin vortex and the wave’s singularity in the whole beam. When the working frequency of the metasurface with a topological charge of 2 is f=0.9 THz, the vortex beam’s reflection phases and amplitudes at the propagation distance of 50, 250, 500, and 1000 μm are given(Fig. 7), and the phase diagrams gradually spiral, while the amplitude distribution diagrams gradually tend to a ring, indicating that the vortex beam has better propagation characteristics in the operating frequency range.Conclusions The simulation results show that the designed unit structure can achieve reflection amplitudes with over 90% efficiency through various rotation angles. The metasurface is designed in the frequency range of 0.90--1.80 THz, which can effectively convert circular polarized terahertz beams into vortex beams with OAM with different topological charges. It has the advantages of high efficiency, broadband, and simple structure and has a particular reference value for using metasurfaces to generate terahertz vortex beams.
Oct. 11, 2021Vol. 48 Issue 20 2014003 (2021)
Keyang Cheng, and Qi Li
Objective In terahertz digital holographic imaging, factors such as the transmittance and noise of shelters will affect the imaging effect, and when combined with practical applications of terahertz imaging technology such as security detection and medical imaging, shelters have become an important issue that needs to be studied. Double-exposure digital holography can achieve better imaging quality than single-exposure for relatively stationary targets. According to our investigation, there are no reports on the influence of shelters in terahertz double-exposure digital holography. Paper is a common material that does not transmit visible light but has high terahertz wave transmittance, and it is easy to change the noise and transmittance conditions in the experiment by changing the material; thus, studying the influence of paper shelters in the terahertz imaging process has a good reference value for the use of other materials.Methods In this study, the imaging results and objective evaluation indexes of material targets with lateral resolutions of 0.2 mm and 0.3 mm under different shelters are obtained through simulation and experiments by the D-APRA (double-exposure amplitude constrained phase retrieval algorithm) using a terahertz double-exposure digital holographic imaging system with a wavelength of 118.83 μm, a detector pixel size of 0.1 mm, and a pixel number of 124×124. Through comparative analysis, we study the effect of B5 paper and thermal paper on the reconstruction of amplitude images.Results and Discussions First, the transmittance and noise distribution of a single sheet of B5 paper and thermal paper are measured to determine the shelter’s simulation parameters (Fig.4). The transmittances are 0.4 and 0.7, respectively, with 0.002 and 0.006 Gaussian noise variances. Second, the detector’s noise parameters are deduced from the experimental data. The mean value of the detector’s Gaussian noise is about 0.15, and the variance is about 0.0009 (Fig. 5). The imaging results of two targets with resolutions of 0.2 mm and 0.3 mm under different conditions of shelters are obtained through simulations (Fig. 6 and Fig. 7), and the objective evaluation indicators of different conditions are compared and analyzed (Table 1). Finally, the imaging results of different situations are obtained through experiments (Fig. 8 and Fig. 9), and some objective evaluation indicators (Table 2) obtained by calculation are close to the simulation results. The overall change trend of the experimental results is similar to the simulation results.Conclusions This research investigates the effect of B5 paper and thermal paper shelters on the amplitude image reconstruction of 2.52 THz double-exposure digital holography using experiments and simulation for the two targets with lateral resolutions of 0.2 mm and 0.3 mm. First, preliminary experiments are used to evaluate the transmittance and noise distribution of a single sheet of B5 paper and thermal paper; the transmittance is about 0.4 and 0.7, and the Gaussian noise variance is about 0.002 and 0.006, respectively. Second, the result shows that the mean value of the detector’s Gaussian noise is about 0.15, and the variance is about 0.0009. The simulation imaging results of two targets with different shelters are compared and analyzed. The reconstructed amplitude image of a target with 0.2 mm lateral resolution sheltered by thermal paper and the images of a target with 0.3 mm lateral resolution sheltered by B5 paper and thermal paper are obtained through experiments. The overall trend of experimental results is similar to the results of the simulation. The contrast ratio of the 0.3 mm lateral resolution target with the B5 paper shelter is lower than the result of simulation by more than 0.2, mainly caused by the low transmittance of B5 paper. With a lateral resolution of 0.3 mm, the contrast ratio of the peripheral area sheltered by the thermal paper target is 0.46, which is similar to the simulation result and only 0.07 lower. Experiments yield a reconstruction image of an unsheltered 0.2 mm lateral resolution target, with a contrast ratio of 0.59 in the central area, which is only 0.02 higher than the simulation result. Finally, the mean square error of the simulation and experimental results in various scenarios are determined, which is more accurate in determining the deviation degree of the reconstructed images from the original images. It works in concert with the contrast ratio result.Low and unstable laser energy, low detector sensitivity, and environmental noise are the main reasons for the discrepancy between experimental and simulation results. It is necessary to further study the conditions and specific values that need to be added in the simulation and improve the simulation model to reduce the difference between the simulation and experimental results. Darkrooms and shields can also be used in the imaging system to reduce the impact of detector noise, and the reconstruction algorithm can be improved in digital image processing to solve problems such as laser fluctuations and detector noise.
Sep. 07, 2021Vol. 48 Issue 20 2014004 (2021)
© Copyright 2018-2021 | Chinese Laser Press.
All Rights Reserved 沪ICP备15018463号-20