


Please enter the answer below before you can view the full text.

Ping We, Xinyang Li, Xi Luo, and Jianfeng Li
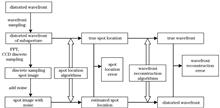
Objective Shack-Hartmann wavefront sensors (SHWFSs) are widely used in the wavefront measurement of adaptive optics systems. Their detection accuracy directly affects the correction performance of the entire system. The optical path of light waves propagating in the atmosphere changes owing to atmospheric turbulence, resulting in wavefront aberrations. The influence of atmospheric turbulence distorts the laser wavefront, leading to the flicker and drift of the optical signal at the receiving end, which severely interferes with target detection. Atmospheric turbulence shows strong randomness and poor reproducibility. Therefore, it is necessary to conduct a numerical simulation of atmospheric turbulence distortion wavefront to study laser atmospheric transmission and the correction of adaptive optics systems. Second, to study and analyze the design, performance estimation, algorithm optimization, and other aspects of SHWFS, it is necessary to simulate various parts of SHWFS, including the entire process from the useful signal input to output. Our goal is to establish a digital simulation platform for SHWFS that is flexible, easy to adjust, easy for statistical analysis, and convenient to provide data for the optical system. Additionally, the simulation platform can analyze spot positioning and wavefront reconstruction errors under different distorted wavefronts and noises. Furthermore, it can examine and optimize optical system parameters and improve the detection accuracy and performance of the entire system.Methods Because numerical simulation technology has the advantages of low cost, easy implementation, and repeated experiments, the simulation platform for SHWFS is established using this technology. The simulation platform for SHWFS involves three modules: wavefront generation, SHWFS detection, and wavefront reconstruction. Using the theoretical analysis of each module, the corresponding mathematical model is established to realize the simulation of each module. The Zernike polynomial method is used to generate a distorted wavefront conforming to the Kolmogorov turbulence statistical characteristics. Additionally, the random dynamic, static, and function-modulated wavefronts are generated using the Zernike polynomial method. Different spot location algorithms are used to achieve the position of the spot quickly and accurately under different signal-to-noise ratio conditions. Based on the requirements of the optical system, different wavefront reconstruction algorithms are selected to realize fast and accurate wavefront reconstruction. Finally, the correctness of the simulation platform is verified by comparing the simulation results with the theoretical results.Results and Discussions The structure of the simulation platform for SHWFS includes the generation of the spot array image, spot positioning, and wavefront reconstruction. The generation of the spot array image includes wavefront generation, noise addition, sensor structure parameters, and light emphasis (Fig. 3). The control interface of the simulation platform for SHWFS is divided into three interfaces: control interface for wavefront simulations, control interface for spot positioning, and control interface for wavefront reconstruction (Fig. 4). Parameters can be set on the control interface as required. The added noise includes Gaussian, Poisson, salt and pepper, and special background noise. A single type of noise can be added or several types of noise can be superimposed based on actual requirements (Fig. 6). Figure 8 shows the verification of the statistical characteristics of the Kolmogorov turbulence. This figure shows that the simulated variance of the turbulent wavefront is consistent with the theoretical variance, which conforms to the statistical law of the Kolmogorov turbulence. The results of the spot positioning and wavefront reconstruction errors obtained using the thresholding center of gravity (T-COG) algorithm for spot positioning and the modal algorithm for wavefront reconstruction confirm the correctness of spot positioning and wavefront reconstruction (Figs. 9 and 10).Conclusions The proposed simulation platform has the advantage of flexibility and changeability. It can also set and optimize the parameters of each part involved in the SHWFS detection process based on the requirements. The simulation platform contains five parts. The first part involves four types of distortion wavefront simulations. The second part involves the arbitrary selection of the superposition of multiple noises, mainly involving four types of noise: Gaussian, Poisson, salt and pepper, and special background noise. The third part consists of various subaperture structure simulations, which can automatically divide the detection area. The fourth part involves seven types of spot location algorithms commonly used in engineering, i.e., T-COG, thresholding weighted center of gravity, thresholding intensity-weighted centroiding, windowed thresholding center of gravity, windowed thresholding intensity-weighted centroiding, windowed thresholding weighted center of gravity, and cross-correlation. The final part involves the two types of wavefront reconstruction algorithms. When a special situation causes partial subaperture lack of light, the subaperture slope zero reconstruction and subaperture removal reconstruction methods can be adopted to handle this situation. The control interface of the SHWFS simulation platform is mainly divided into three interfaces: wavefront generation, spot positioning, and wavefront reconstruction. The control interface is simple and easy to operate. In this study, the SHWFS digital simulation platform is tested and test results show that the simulation platform can well characterize the statistical characteristics of the turbulent phase. Additionally, it can optimize the spot positioning algorithms and parameters based on the working environment of the adaptive optical system. It can also ensure the correctness of the wavefront reconstruction (the accuracy of the wavefront restoration error is 10 -2) and handle special cases of subaperture lack of light.
Sep. 01, 2021Vol. 48 Issue 17 1710001 (2021)
Ge Tan, Xianghong Hua, Wuyong Tao, Bufan Zhao, and Cheng Li
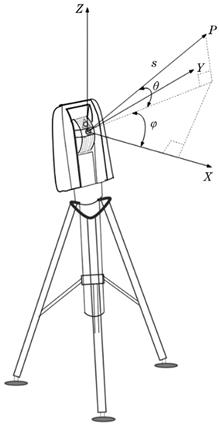
Objective The terrestrial laser scanner can flexibly and accurately obtain three-dimensional (3D) point cloud data of ground objects. Thus, it is widely used in heritage protection and restoration, building 3D model reconstruction, and deformation monitoring. In practical applications, owing to its limited field of view, the scanner should conduct multistation and multiview scanning to obtain complete substation cloud information of the object to be measured. Therefore, the registration of a multisite cloud is necessary to obtain the complete point cloud information of the object to be measured, which is also the premise of scene reconstruction, segmentation, and classification. The traditional point cloud registration methods, such as the registration method using target or landmark points, rotating platform method, automatic registration method based on point cloud features, and auxiliary registration method using indoor Global Positiaoning System (iGPS) world coordinate system, usually face problems of weak robustness and low efficiency. In this study, a registration method of the terrestrial laser scanning point cloud based on a laser tracker is proposed to overcome the above defects.Methods In the proposed method, the position sensor of the terrestrial laser scanner is turned off, so that the scanning coordinate becomes an independent coordinate system relative to the scanner body. Four spherical prism bases of the tracker are fixed on the body of the 3D laser scanner. The coordinates of the four base points in the scanning coordinate system are calculated using a “calibration” process. Because the scanning coordinate is an independent coordinate system that remains unchanged relative to the scanner body, the base point coordinates remain unchanged in any scanner station coordinate system. After the scanner moves, the laser tracker is used to measure the coordinates of the four base points in the tracker coordinates. Combined with the “calibration” results, the relative rotation and translation matrix of the scanning coordinate system of any station can be solved. Additionally, a mathematical model of the transformation relationship between the scanning coordinate system before or after the moving station can be established to achieve accurate registration of the multiview point cloud.Results and Discussions In the indoor environment, a small industrial device and a gypsum statue are scanned from four stations. The proposed registration method is used for coarse point cloud registration. The coarse registration results (Figs. 7 and 9) showed that the proposed coarse registration method can accurately register two adjacent point clouds. After iteration closest point (ICP) fine registration of small industrial devices, the coarse registration effect on the upper edge of the device (yellow box in Fig. 6) is better than that of the coarse registration, which can be seen by naked eyes; however, it is not noticable. No significant difference between the coarse and fine registration results of gypsum statues is observed. Thus, the coarse registration effect of the proposed method worked perfectly, which can provide a sufficient initial pose for fine registration. Tables 1 and 2 show that the maximum coarse registration error of statue is 0.71 mm, with an average of 0.59 mm; the maximum coarse registration error of the small industrial devices is 0.68 mm, with an average of 0.64 mm, and the coarse registration result with high accuracy is obtained. Thus, the ICP algorithm only needs a few iterations to obtain accurate registration results. After ICP fine registration, the error is less than 0.2 mm.Conclusions Aiming at the registration problem of multistation terrestrial laser scanning point cloud, a method that uses a laser tracker to assist the registration is proposed. By placing a spherical prism base on the scanner body, the position transformation matrix of the scanner before and after moving the station is calculated. A mathematical model of the transformation relationship between the scanning coordinate system before and after the station moving is established. Using this model, the data of multistation ground laser scanning point clouds are unified to the same coordinate system, and the coarse registration of multistation scanning point clouds is completed, providing a good (coarse registration error is not greater than 0.71 mm) and robust initial value for ICP algorithm. The proposed method is easy to operate and has high accuracy. Without opening the scanner position sensor, only one “calibration” is needed in the entire measurement process.
Sep. 03, 2021Vol. 48 Issue 17 1710002 (2021)
Shouzheng Zhu, Lingbing Bu, Jiqiao Liu, Qin Wang, Juxin Yang, Yang Zhang, Xiaopeng Zhu, and Weibiao Chen
Objective Aerosol plays an important role in assessing radiation, climate, cloud formation, and environmental pollution. In addition, the optical and physical properties of aerosols impact the formation and transmission of air pollutants. Therefore, the temporal and spatial distribution characteristics of tropospheric aerosols are important for studying the uncertainty of the aerosol environment and climate change. It is important to study the optical properties and vertical distribution changes of aerosols through effective observation methods. As a widely used active detection instrument of aerosols, lidar plays an irreplaceable role in the detection of vertical distribution of aerosol and changes in pollutant transmission. Related scholars have researched the distribution characteristics of aerosol extinction coefficient (AEC) and aerosol backscatter coefficient (ABC) profiles, as well as the regional pollution and climate impact by different types of aerosol distribution characteristics, which promotes the development of research methods and lidar detection. High spectral resolution lidar (HSRL) can detect aerosol optical parameters, such as AEC and ABC, enhancing the inversion accuracy of aerosol optical parameters. It provides an efficient method for accurate analysis of climate effects and long-term evolution characteristics of aerosols, as well as the evolution of regional and long-term pollution research.Methods In this study, the HSRL system based on an iodine molecular filter is used to conduct an aerosol observation experiment in Qinhuangdao in March, 2019. Firstly, the correlation and absolute deviation between the aerosol optical depth (AOD) results retrieved by HSRL system and the data detected by the sunphotometer on the ground site and satellite remote sensor are discussed and analyzed. Combined with the AOD results of HSRL sysytem and ground meteorological data, the optical characteristics and pollution changes of aerosols during the pollution process in the Qinhuangdao area are studied. The distribution of aerosols on a polluted day and the characteristics of stable aerosol layers in cities and ocean areas are studied, and the vertical distribution and particle characteristics of aerosols corresponding to different underlying surfaces are analyzed. ABC, AEC, depolarization ratio (DR), lidar ratio (LR), and color ratio (CR) data are used to analyze the aerosol-concentration distribution and types of aerosol particles at different heights during the pollution process. The study analyzes the changes in aerosol optical parameters and pollutant characteristics during the pollution process.Results and Discussions According to the comparison results of AOD value, the correlation between the HSRL system and ground-based sunphotometer as well as that between the HSRL system and the satellite remote sensor are more than 0.99 (Fig. 3 and Fig. 4). We use airborne HSRL system to observe the aerosol distribution in Qinhuangdao, and analyze the distribution characteristics of high AOD areas and the changes in AOD at different dates. Combined with the meteorological data and airborne aerosol data, the pollution process in the Qinhuangdao area is analyzed. The pollution process is affected by the southwest wind (Table 3). The airborne observation data are used to analyze the vertical distributions and changes of aerosol parameters corresponding to different underlying surfaces at polluted days. AEC and ABC values on March 4, March 18, and March 19, 2019 are relatively large. The surface layer of the urban area of Qinhuangdao is dominated by industrial pollutants and fine particles produced during biomass combustion. The ABC and AEC values of the low layer decrease with the increase of height. The DR value is below 0.1, the LR value is between 35 sr and 45 sr, and the CR value is between 2.1 and 2.5 (Fig. 7 and Fig. 8); the interaction between aerosol particles in the ocean area leads to the existence of a mixed aerosol layer, including polluted marine aerosols; aerosols in mountain areas are coarse sand and dust. Polluted dust aerosols dominate in some areas, with DR value between 0.1 and 0.18 (Fig. 9).Conclusions Based on the aerosol data from the HSRL observation experiment, the study analyzes the vertical distribution and pollution characteristics of atmospheric aerosols in Qinhuangdao. We detect the AOD distributions in the east and west regions of Qinhuangdao at different dates, and the AOD observation results are correlated with ground-based and satellite observation data. In addition, we use meteorological data and airborne observation-aerosol data to analyze the boundary-layer changes and vertical distribution of aerosol optical parameters at different dates, and surface types. We observe that the aerosols in the low atmospheric layers of urban areas are mixed aerosols, whereas marine areas are dominated by polluted marine aerosols. The pollutant is a combination of various mixed aerosols. In addition, the types and changes of aerosols under different surface types are different. The pollution is caused by mixed aerosol produced by low-level industries and biomass combustion. The vertical distribution characteristics of three parameters (DR, LR, and CR) that characterized the types of aerosol particles at different dates and altitudes are given. The analysis results of this study reflect the advantages of HSRL system in detecting the vertical distribution of aerosols and regional pollution. Morever, this study provides reference value for the development and application of HSRL system, and supplies a favorable tool for the future development of regional aerosol pollution research.
Sep. 01, 2021Vol. 48 Issue 17 1710003 (2021)
Liang Zhao, Jie Hu, Han Liu, Yongpeng An, Zongquan Xiong, and Yu Wang
Objective The low detection accuracy of the perception system in autonomous vehicles will seriously affect the reliability of autonomous vehicle and the safety of passengers. The traditional LiDAR-based three-dimensional (3D) object detection algorithms, such as the rule-based clustering method highly relies on hand-designed features probably be sub-optimal. Following the great advantages in deep learning for image field, a large body of literature to explore the application of this technology for 3D LiDAR point clouds. Among them, point-based methods directly use raw point clouds as the input of the detection model, and the further point sampling(FPS) algorithm is applied to sample a set of keypoints from raw point clouds, keypoints groups neighbor raw points to extract the feature for object detection. However, the proportion of foreground points (points in 3D bounding box) in keypoints collected through FPS algorithm are relatively low, especially for the remote object, foreground points almost totally lost in FPS (Fig. 1). Foreground points contain the important 3D space location information of objects, a low proportion of foreground points in keypoints will hurt the detection accuracy. To this end, we propose a semantic segmentation based two-stage 3D object detection algorithm named Seg-RCNN (segmentation based region-convolution neural networks), in which we propose a novel further point sampling strategy (segFPS) for sampling keypoints, and a segmentation network (SegNet) for semantic segmentation of foreground points and background points (Fig. 4).Methods Seg-RCNN is a two-stage 3D object detector (Fig. 2), in the first stage, the raw points are first voxelized as voxel-wise features, then the sparse 3D CNN is adopted to extract voxel features, the output of sparse 3D CNN squeeze into 2D CNN for further feature propagation, and then box proposals are generated in 2D bird’s eye view feature map through anchor-based strategy. The SegNet output the foreground and background points segmentation results of point clouds. In the second stage, the SegFPS is adopted to sample the keypoints according to the segmentation results obtained from SegNet. SegFPS, distinguished with previous FPS, uses both segmentation classes (foreground points and background points) and Euclidean distance as sampling criteria, which can improve the proportion of foreground points in keypoints (Fig. 1), and then can improve the detection accuracy by 2.90 percentage points in the KITTI dataset. Using keypoints to represent the whole point clouds not only reduces the complexity in time and space but also retains a certain proportion of foreground points and background points. Multi-scales 3D voxel features of different layers are aggregated into a set of keypoints through PointNet backbone to obtain the features aggregated by the keypoints (named key-features), so that achieve feature compression (grouping, as shown in Fig. 3, calculates the relative distance between the keypoints and neighbor raw points). Then, 2D CNN is adopted to further propagate the key-features. Project the box proposals onto the key-features map to extract the region of interests, finally the detection heads output the final perception results.Results and Discussions Extensive experiments on KITTI dataset are conducted to demonstrate the higher performance of our framework as compared with previous mainstream methods, and the detection accuracy of the car class in moderate and easy level are 79.73%,89.16%, respectively(Table 2). The mean average precision (mAP) of Seg-RCNN, on car objects easy, moderate and hard levels, increased by at least 3.22, 3.97 and 3.29 percentage points, respectively. There are two output strategies in SegNet, experiment results suggest that SegNet 1 is better than SegNet 2 (Table 4). Adopting SegFPS to sample the keypoints indeed can improve the detection accuracy by 2.90 percentage points as compared with FPS (Table 5). The accuracy of annotation in dataset affect the detection performance of algorithm (Fig. 6), since the correct detection box will be judged as false positive due to the missing of data annotation. The similarity of the shape between different objects, such as the shape of tree pole and telephone pole are very similar to the pedestrian in point clouds, would decrease the classification accuracy, and then decrease the detection accuracy(Fig. 7). Runtime of the proposed method is 80 ms (Table 8). To further facilities the application of engineering, we achieve online real-time detection through robot operating system, which has great values for engineering projects.Conclusions In this paper, we consider the problem of low proportion of foreground points in keypoints after FPS sampling, and introduce Seg-RCNN, a novel 3D object detection algorithm that has potential values of application for autonomous vehicle projects. Extensive experiments on KITTI dataset are conducted, the experiment results suggest that our algorithm has higher detection accuracy as compared with previous mainstream methods, specifically, the mAP of car class on easy, moderate and hard levels increase to at least 3.22, 3.97 and 3.29 percentage points, respectively. The runtime of our algorithm is only 80 ms. Our results suggest that Seg-RCNN is an effective architecture for 3D object detection on point clouds.
Sep. 03, 2021Vol. 48 Issue 17 1710004 (2021)
Xiaobin Wang, Chunbo Liu, Ruyuan Liu, Lin Zhang, Yang Cao, and Xiang'e Han
Objective Fast and accurate beam scanning is the key technology in free space laser application. An optical phased array (OPA) based on electro-optics or thermo-optics overcomes the limitation of mechanical steering and can achieve noninertial beam steering with flexible beam pointing. It has demonstrated applications in free-space laser, such as light detection and ranging (LIDAR), free-space optical (FSO) communication, and optical imaging. The spatial light modulator (SLM) and microelectromechanical mirror array (MEMS) have realized tens of kHz and 1-MHz beam steering, respectively. Chip-scale OPA can achieve ultrawide beam steering and it has been demonstrated at kHz to GHz. However, chip-scale OPA suffers serious loss and cannot be used in remote detection. The optical fiber phased array (OFPA) based on a lithium niobate (LiNbO3) phase modulator can achieve beam directional and fast steering at GHz while realizing high power laser synthesis output, but the phase noises make each beam phase fluctuate strongly, which seriously affects the output beam quality and cannot guarantee its steering angle accuracy. Compared with the coherent combination of high power fiber lasers, the fast beam steering of OFPA not only involves phase control compensation but also ensures the accuracy of beam steering angle and higher steering speed, which improves the difficulty of phase control.Methods Based on LiNbO3 phase modulators and the stochastic parallel gradient descent (SPGD) algorithm, the phase noises of 1×16 channel OFPAs are compensated, and the multibeam fast steering is achieved by the “steering after correction” method. First, a narrow-linewidth (Results and Discussions The phase control system developed in this study effectively achieves phase noise compensation, the performance metric (on-axis intensity) increases from 0.43 to 0.94, the quality of coherent combined beams is improved (Fig. 6), and the convergence time of the SPGD algorithm is 1.2 ms [Fig. 7(a)]. Using peak-to-side lobe ratio (PSLR) as the quality evaluation index of beam optimization, the PSLR is 24.7 dB after phase noise compensation, which is close to the theoretical limit of 26.4 dB (Fig. 8). In this paper, the beam steering angle is set to be -0.30°, -0.20°, -0.10°, 0.10°, 0.20°, and 0.30°. The quality of the coherent combined beam after steering maintains a good intensity distribution state (Fig. 9). The results show that the actual steering angles are -0.31°, -0.20°, -0.11°, 0.12°, 0.22°, and 0.29°. Three factors lead to errors: 1) the half-wave voltage of each LiNbO3 is different from the theoretical value; 2) the actual output voltage of the phase control system has errors compared with the theory values; 3) owing to the processing error, the spacing parameters of adjacent bare fibers in the fiber array are inaccurate. The pixel size of the short-wave infrared camera (SWIC) is 15 μm×15 μm, and its FOV is 0.008°; the maximum error of the experimental results is 0.02°, which shows that the systematic error caused by the resolution of the SWIC cannot be ignored. The beam steering speed of the system (defined by the switching speed of the beam between any two angles) measured by a single point detector is 500 kHz.Conclusions An experimental system containing an OFPA of 1×16 channels is built, and the experiments for coherent beam combining and multibeam steering are conducted. Experimental results show that the algorithm is of high efficiency, taking only 10 μs in a single iteration. Besides, the PSLR reaches 24.7 dB, with the theoretical limit being 26.4 dB. The steering range is in good consistency with the theoretical prediction range. The OFPA developed in this study permits high-quality coherent beam combining and allows high-speed (500 kHz) beam steering, and the scan angle range is -0.70°--0.70°. Finally, the feasibility of fast multibeam steering of 1×16 channel OFPA is verified. In the future, the bandwidth of the phase control circuit system will be further improved, and higher precision beam steering will be achieved, which will lay a foundation for the applications of laser detection and imaging.
Sep. 01, 2021Vol. 48 Issue 17 1705001 (2021)
Hongwei Yang, Yimian Du, Lidong Lü, Wei Tao, Junguo Lu, and Hui Zhao
Objective As a displacement measurement tool, laser triangulation displacement sensors (LTDS) are widely used in industrial detection because of their noncontact nature and high accuracy. The optical path of LTDS is illustrated as follows: a collimated laser beam is projected onto the detected object and the diffuse reflected light is focused by a receiver lens onto a charge-coupled device (CCD) detector. When the detected object is moved along the direction perpendicular to the optical axis of the source laser beam, the reflected light beam spot (image spot) focused on the CCD will move correspondingly. Thus, the displacement over which the detected object moves can be calculated using a geometric optical model that is related to the image spot displacement. Laser-beam dithering is considered one of the major error sources in laser applications. To solve this problem, many averaging methods have been proposed. However, methods that can image two image spots on one CCD with a single image system are ineffective at improving the error factor of the laser beam directional instability. In other methods, structures comprising prisms or reflectors for producing two differential optical paths have been proposed. With those methods, the positional average of two image spots remains constant irrespective of the angle by which the source laser beam dithers. However, an installation error might be introduced, for which calibration is not possible because it is related to the laser dithering angle.Methods In this paper, a laser beam pointing control-based dual-view for laser triangulation displacement sensors (DVLTDS) is proposed. The structure comprises a collimated laser, two receiver lenses, and two CCDs, where the two receiver lenses and two CCDs are symmetrically arranged around to the optical axis of the source laser beam. DVLTDS generates two beam intensity distributions (BIDS) on two CCDs simultaneously. It converts the centroid movement of each BID into the detected object displacements through averaging. Hence, if the relationship among the optical parameters such as object distance, image distance, view angle, image angle, working distance, and the dithering angle satisfies certain constraint conditions (Eq. 6), then at the angle at which the source laser beam dithers, the average positions of the two laser spots imaged on the two detectors are equal within the permissible error range.Results and Discussions For validating DVLTDS, an experimental setup was built and various tests, including calibration, repeatability, and nonlinearity, were conducted. To satisfy the constraint condition, the optical parameters, including the focus of the receiver lens, working distance, object distance, image distance, view angle, and image angle, were designed in Zemax software in the nonsequential mode (Fig. 2). The experimental platform of DVLTDS was built according to the design data (Table 1, Fig. 3).DVLTDS was calibrated with a dual-frequency laser interferometer (RENISHAW XL-80)with a linear resolution of 1 nm. The relative positions of DVLTDS were calibrated. The target object (a ceramic block) was driven point-by-point along the optical axis of the source laser beam using a stepper motor with an increment of 0.1 mm within 10 mm. At each point, the collimated red laser was rotated with an increment of 0.1° within ±0.4°. Results show that the calibration curve of DVLTDS was coincident with that of the laser interferometer. Moreover, the standard deviation (STD) was found to be 0.2532 μm with DVLTDS [Fig. 5(a)]. In comparison, the STD was found to be 28.53 μm with LTDS [Fig. 5(b)].In repeatability tests, the ceramic block was fixed at a closer point, zero point, and a farther point. The collimated red laser was rotated within ±0.4° with an increment of 0.1°. Using DVLTDS, the repeatability accuracy was within ±5 μm and the STD was within 0.0035 mm. In comparison, with LTDS, the repeatability accuracy was ±1.4 mm and the STD was more than 0.5 mm (Table 3).The nonlinearity is expressed as the ratio of lr to (xt-xr), where xt is the tested value of DVLTDS, xr is the tested value of the XL-80 interferometer, and lr is the tested range. In this experiment, measurements were performed by moving objects from a closer point to a farther point with an increment of 0.1 mm for three runs. The results reveal that the nonlinearity of DVLTDS is within ±0.04% full scale (F.S.) [Fig. 7(a)]. In comparison, the nonlinearity without differential dual view is within ±0.8% F.S. [Fig. 7(b)].Conclusions In conclusion, experimental results indicate that with DVLTDS, the estimated STD of the fitting error decreases from 28.53 to 0.2532 μm, the repeatability accuracy can be reduced from ±1.4 to ±5 μm, and the nonlinear error can be reduced from ±0.8% F.S. to ±0.04% F.S. These results verify that laser beam pointing control-based dual-view for laser displacement sensors can suppress the effects of laser beam dithering.
Sep. 07, 2021Vol. 48 Issue 17 1705002 (2021)
Siyuan He, Xingchen Pan, Cheng Liu, and Jianqiang Zhu
Objective In laser applications, the propagation characteristics of the beam directly affect its application quality. Accordingly, various standards for measuring the laser beam quality have been proposed to better evaluate the laser beam quality. The laser beam quality factor M2 is the product of the beam waist diameter and the far-field divergence angle, which does not change with the optical system. Therefore, using M2 for the beam quality measurement is stricter and more comprehensive. The representative measurement methods of the M2 factor are knife-edge and array detection, among others. However, the measurement process of these methods is slow and requires multiple captures, exhibiting high requirements on the beam stability. A pulsed beam (e.g., laser output from a high-power driver) shows a certain degree of instability; hence, a simple pulsed beam quality measurement method is required. Methods The algorithm of coherent modulation imaging based on amplitude coding(CAMI), which uses a binary random amplitude plate to modulate the incident beam. A single-shot method based on coherent modulation imaging is presented for the measuring of the beam quality. The laser beam to be measured first illuminates a highly random phase plate with a known structure and subsequently the intensity of the resulting diffraction pattern is recorded by a charge-coupled device positioned behind the phase plate. Intensity distribution of the laser beam is accurately reconstructed with the coherent modulation imaging method, then the scalar diffraction theory is used to perform numerical inversion, the beam intensity distribution of any plane can be obtained by calculation. According to the standard beam quality analysis algorithm, the quality of the laser beam is calculated. In addition, since the CAMI method adopts an amplitude modulation structure and does not require calibration, in theory, this method is applicable to any wavelength. Therefore, compared with the existing method, the structure is simpler, suitable for single exposure measurement, and theoretically can be used as a brand-new beam quality analysis technology.Results and Discussions First, the feasibility of using CAMI algorithm to realize beam quality parameters was simulated and verified. It is assumed that the incident beam is an ideal Gaussian beam with a wavelength of 351nm. Considering the diffraction pattern saturation error, uniform random background noise (0~1) and quantization noise, the reconstruction results are shown in Fig.3. The incident beam at the amplitude plate recovered by CAMI is transmitted through the angular spectrum, and the beam parameters are calculated using the calculation method described in section 2.2. The maximum error is 2.12%, and all errors are within acceptable limits. For further verification, the CAMI optical path diagram shown in Fig.1 and the Ophir-Spiricon beam quality analyzer (model: BSQ-SP920) were used to measure the beam. Ophir-Spiricon beam quality analyzer measured the He-Ne laser beam quality factor Mx2=1.044,My2=1.042, CAMI method calculated Mx2=1.090,My2=1.044, the relative error along x direction and y direction was 4% and 0.2%. Finally, using the CAMI 351nm pulsed beam algorithm actual measurement, the beam path diagram is shown in Fig.6(a). After 300 iterations, the saturated area of the diffraction spot is restored, and the reconstruction results are shown in Fig.6(b)--(e). Through wavefront inversion, the beam intensity distribution of other vertical sections along the optical axis can be calculated. The beam width expands outward along the transmission direction in accordance with the hyperbolic law, and the coefficients of the hyperbola are fitted by multiple sets of beam intensity data, thereby calculating the beam quality factor Mx2=1.4746,My2=1.2101.Conclusions Compared with the far-field divergence angle and focal spot size, the laser beam quality factor M2 is a technical evaluation that can strictly characterize the laser beam quality. A real-time complex amplitude reconstruction method based on the coherent amplitude modulation imaging algorithm is proposed to determine the laser beam quality factor M2. CCD is used as an image sensor to directly detect the laser beam distribution, and the wavefront distributions at different positions are obtained by numerical calculation. Laser beam quality measurement is based on the theory of second-order moments, and the M2 is measured by the method of propagation trajectory curve fitting. Compared with the traditional mobile CCD method to obtain the wavefront distribution at different positions, the automatic measurement is more convenient and faster, and the wavefront distribution information of laser beam can be accurately obtained, which is suitable for measuring the quality of pulsed laser beam. Simulations and experiments have proved the effectiveness of proposed method.
Sep. 01, 2021Vol. 48 Issue 17 1705003 (2021)
Wenqian Zhang, Jinchao Feng, Zhe Li, Zhonghua Sun, and Kebin Jia
Objective As a new molecular imaging modality, Cherenkov-excited luminescence scanned imaging (CELSI) has demonstrated a great potential, especially in radiation therapy diagnostics. However, it can not provide in-depth information about molecular probes. Therefore, it is necessary to develop tomographic algorithms for CELSI. However, reconstructing spatial distributions of luminescent sources from boundary measurements is a typical ill-posed problem. Our previous work has demonstrated the feasibility and effectiveness of using Tikhonov and sparse regularizations for CELSI reconstruction. However, the quality of reconstructed images will degrade when the luminescent source is located at deep positions. The objective of this study is to develop a reconstruction algorithm for CELSI to improve the quality of reconstructed images.Methods A two-stage reconstruction algorithm is developed in this study. First, low-quality images were reconstructed on the basis of Tikhonov regularization at the first iteration. Then, the resultant images were input into a revised Unet network, which had an encoder-decoder architecture. The encoder comprised four convolution blocks and four downsampling layers. Every convolution block comprised two convolution layers, and each convolution had a kernel size of 3×3 with a stride of 1. The downsampling layer had a convolution of size 3×3 with a stride of 2. In upsampling networks, the transposed convolution with a kernel of 3×3 and stride of 2 was used to replace direct interpolation used in the standard Unet. Here, we used leaky rectified linear units as the activation function to intensify the network in each convolutional layer. The batch normalization technique was used to accelerate learning. In addition, skip connection was applied to connect the first and last layers. The feasibility of the algorithm was evaluated through numerical simulations. Training and test datasets were generated using an open-source software, NIRFAST. For comparison, our algorithm was compared with Tikhonov regularization, approximate message passing (AMP), and graph-total variation (Graph-TV).Results and Discussions First, a single circular target with 8 mm diameter was placed within the phantom with varying depths ranging from 10 mm to 50 mm. Although the four algorithms could reconstruct the distribution of targets, severe artifacts were found in images reconstructed by Tikhonov regularization, and the shapes of reconstructed targets were changed for AMP and Graph-TV (Fig.5). Additionally, the quality of reconstructed images by Tikhonov regularization, AMP, and Graph-TV degraded as the depth increased. By contrast, our results reveal that the quantitative accuracy of recovered distributions of luminescence sources could be significantly improved by the proposed algorithm, which achieved the best image quality with a high peak signal-to-noise ratio (>28 dB) and structural similarity (>0.92). Furthermore, experiments with two luminescent sources were conducted to evaluate the algorithm’s performance. When the edge-to-edge distance of two luminescent sources was 3 mm (Fig.13). The computational efficiency for the four algorithms is also demonstrated. The three traditional reconstruction algorithms require >45 s, whereas our algorithm requires ~11 s (Table 1).Conclusions A tomographic reconstruction algorithm for CELSI is proposed to reconstruct distributions of luminescence sources based on a trained Unet neural network. Numerical simulations are used to evaluate the performance of our proposed algorithm. Our results reveal that both the image quality and quantitative accuracy of reconstructed fluorescence yield can be improved using the proposed algorithm compared with the conventional Tikhonov, sparse, and total variation regularizations. The proposed algorithm can reconstruct the distributions of luminescent sources when the depth is
Sep. 01, 2021Vol. 48 Issue 17 1707001 (2021)
Chen Wang, Lixia Xi, Yang’an Zhang, Xueguang Yuan, Xiaoguang Zhang, Linan Shan, Zhenyu Xiao, and Xuan Li
Objective Brillouin optical time-domain reflectometer (BOTDR) is employed in numerous fields with practical applications owing to its various advantages such as measuring multiple physical parameters, long sensing distance, and single-end measurement. However, Brillouin backscattered signals become weak along the fibers. Moreover, noises can be introduced by optical or electrical components in the BOTDR system, resulting in poor signal-to-noise ratio (SNR) as well as difficulty in accurately measuring the Brillouin frequency shift for long fiber, which limits the transmission distance. Reducing noise to enhance SNR is an essential for solving the problem. Traditional denoising methods include cumulative average denoising, traditional wavelet threshold denoising, and lifting wavelet threshold denoising. The cumulative average denoising method has limitations such as the time of accumulation and the storage capacity of the hardware. Meanwhile, whether traditional wavelet threshold denoising or lifting wavelet threshold denoising, they depend heavily on the characteristics of the signal and choice of parameters, such as the wavelet basis, wavelet decomposition layer, threshold rule, and threshold function. Therefore, for low SNR signals, these two methods are combined with other methods to achieve the expected denoising results. Considering the good denoising performance of the cumulative average method and the short denoising time of lifting wavelet transform, a novel denoising scheme combining both lifting wavelet threshold and the cumulative average is proposed to improve the measurement distance.Methods A denoising method for the BOTDR system that combines the lifting wavelet threshold with cumulative average is presented. The characteristics of spontaneous Brillouin scattering signals are analyzed. Then, we introduce the principle of lifting wavelet transform and discuss its denoising flowchart (Fig. 2). Furthermore, the parameters of the wavelet threshold denoising suitable for the BOTDR signal are analyzed and optimized through simulations. This paper compares the effectiveness of five denoising schemes (Fig. 5), which are cumulative average denoising, traditional wavelet threshold denoising, lifting wavelet threshold denoising, combined scheme of both traditional wavelet threshold and cumulative average denoising, and a combined scheme of both lifting wavelet threshold and cumulative average denoising. Finally, an experimental platform is built (Fig. 6) and the effectiveness of the proposed method is verified. In addition, the measurement results for the proposed method are compared with other denoising methods.Results and Discussions The combination of lifting wavelet threshold and cumulative average denoising exerts higher SNR, shorter running time, and longer sensing distance than other denoising methods. Simulations and experiments are performed on two methods to verify the effectiveness of the proposed scheme. Brillouin signal power and SNR are replaced with transmission distance and are obtained from simulations (Fig. 1). The wavelet threshold denoising parameters are explored and discussed for different SNR scenarios (Fig. 3 & Fig. 4 & Table 1), which show the universality of the selected parameters. The optimal parameters for wavelet threshold denoising are obtained, including wavelet threshold denoising of db4, decomposition levels of 7, the threshold rule of Sqtwolog, and soft threshold function. The effectiveness of the five denoising schemes is compared, as shown in Table 2. The schemes combining two denoising algorithms show a better noise reduction effect than the others with one algorithm. Also, the SNR was improved greatly while the processing time reduced. Moreover, denoising using the lifting wavelet is better than that using the traditional wavelet. After combining the method of cumulative average noise reduction, the denoising and processing speed of the lifting wavelet remain better. The experimental platform is built to verify the reliability of the proposed scheme (Fig. 6). The results show that, compared with the simple cumulative average method, the proposed method improves the sensing distance from 16.22 km to 39.45 km, while processing time only increases 2.22 s. Also, when compared with the method of combining wavelet threshold with cumulative average denoising, the proposed method has a 0.63 km improvement in sensing distance and 0.69 s better in processing time reduction (Fig.7).Conclusions A novel denoising scheme that combines lifting wavelet threshold with cumulative average is proposed to further improve the measurement distance. Combining lifting wavelet threshold with cumulative average denoising exerts higher SNR, shorter run time than the other four schemes of cumulative average denoising, traditional wavelet threshold denoising, lifting wavelet threshold denoising, combination of traditional wavelet threshold and cumulative average denoising. The reliability of the proposed scheme is verified by the experimental platform. Therefore, this study serves as an important reference for exploring noise reduction of Brillouin scattering signal.
Sep. 01, 2021Vol. 48 Issue 17 1706001 (2021)
Yunkun Li, Tao Pu, Jilin Zheng, Yeteng Tan, and Yukai Chen
Objective To address the limitation imposed by a high-speed, high-resolution digital-to-analog converter (DAC) on the quantum noise randomized cypher (QNRC) research, a novel scheme using the structure of paralleled intensity modulators is proposed, increasing the number of ciphertext states considerably.Methods A detailed explanation of the intensity shift keying (ISK)-QNRC encryption principle demonstrates that an ISK-QNRC with paralleled modulators is feasible. In this study, we established a system which employs optical domain decryption and direct detection. On the receiver’s side, a running key is modulated on a local oscillator as the decryption signal. After matching the power of the decryption signal and ciphertext signal, which is from the sender’s side, these two signal can be converted into a binary electrical signal via a balanced photonics detector. The plaintext is obtained after XOR for the binary electrical signal with the least significant bit of the running key.Results and Discussions We establish an optical communication system (Fig.5) and configure it properly (Table.1) using professional simulation software VPItransmission Maker Optical System 9.1. Simulation results (Fig.6) show that the ISK-QNRC system with the mesoscopic power of -20 dBm, a transmission distance of 500 km, the bit rate of 10 Gbit/s, and the number of ciphertext states of 2 10-1 can be realized, while a plaintext cannot be obtained using the wire-tapper without the running key. We discuss the effect of the received power, mesoscopic power, and transmission length on the error performance. As is shown in Fig.7, the bit error rate (BER) decreases as the received power increases at a specific transmission length (B2B, 500 km, 1000 km) and a specific mesoscopic power (-20 dBm). In addition, when the BER is 10 -10, the power penalty for 500 km is approximately 1 dBm compared with B2B and that for 1000 km is approximately 1.35 dBm compared with 500 km. Fig.8 describes the relationship between the BER and the mesoscopic power at a specific transmission length (B2B, 500 km) and a specific received power (-10 dBm, -15 dBm). When the transmission length is 500 km, the error performance improves with increasing received power, and when the received power is -15 dBm, the error performance improves with decreasing transmission length. Although the transmission length is longer when the mesoscopic power is greater than -18 dBm, the received power of the -10-dBm signal has a lower BER than that of B2B signal. Here, the received power plays a dominant role in improving the error performance. By contrast, when the mesoscopic power is less than -18 dBm, the transmission length plays a dominant role in improving the error performance. Fig.9 describes the relationship between the transmission length and BER at specific mesoscopic power (-15 dBm, -20 dBm) and specific received power (-10 dBm, -15 dBm). It is well known that the BER always increases as the transmission length increases because a longer distance means more amplified spontaneous emission noise caused by erbium-doped fiber amplifier. By setting different variable optical attenuator parameters at the receiver’s side, we find that the BER is sensitive to the power difference between ciphertext and decryption signals. Conclusions This study aims to overcome the limitation of high-speed and high-resolution DACs. Therefore, we propose the parallel intensity modulation, optical domain decryption, and direct detection methods to realize the parallel ISK-QNRC scheme. The effect of changes in three important physical parameters (received power, mesoscopic power, and transmission length) on error performance is discussed and analyzed, and the results of three performance indicators of effectiveness, reliability, and security are obtained (mesoscopic power of -20 dBm; transmission length of 500 km; bit rate of 10 Gbit/s; number of ciphertext states of 2 10-1, BER of 10 -10). In addition, we observe that the error performance of this scheme is sensitive to the power difference between the ciphertext and decryption signals. In an actual operation, this may affect the error performance of the entire system, but this effect can be eliminated by precisely matching the power of the two signals.
Sep. 01, 2021Vol. 48 Issue 17 1706002 (2021)
Qiong Wu, Haiying Li, Wei Ding, Lu Bai, and Zhensen Wu
Objective Vortex beams carrying orbital angular momentum (OAM) mode have important application prospects in improving communication capacity, multiple-channel information modulation with the same frequency and time. As the vortex beam propagates through complex medium environments, the beam field amplitude and phase may be disturbed, causing channel crosstalk and high bit error rate. Several studies proved that the OAM spectrum disturbance caused by a complex medium environment is one of the key problems that need to be solved in the OAM multiplexing technology. The distribution of the vortex beam’s OAM spectrum can easily be obtained through the numerical method. However, the accurate inversion of the OAM spectrum distribution according to the measured field in the actual measurement system is still worth investigating and discussing. Existing methods for classifying OAM mode mainly focus on the main mode. This study proposes a method for identifying the OAM spectrum distribution of the measured image of the disturbed field using the ResNeXt network. Converting the problem of OAM spectrum distribution to the probability problem discriminates test samples belonging to training samples of each type in convolutional neural network(CNN), and the percentage of the main module and side lobes of the OAM modal can be obtained.Methods By optimizing the ResNeXt network, the fitting function of the OAM spectrum distribution of the vortex beam’s transmission field calculated from the spectrum analysis theory of vortex beams is set as the self-defined loss function of the network. The total loss function of the network Ltotal consists of three parts. L1 is the cross-entropy function, which calculates the main model classification loss of the test sample. L2+L3 are the loss functions for predicting the OAM spectrum distribution, and the custom loss function is included in L2. L3 is the cross-entropy function, the same as L1.The training samples are the light intensity pattern of a Bessel vortex beam with l=4--12,which does not propagate through the glass medium without aberration. The test samples are the light density diagrams of a Bessel vortex beam with l=4, propagating through an isotropic glass plate with a thickness of 4 mm under different incident angles. The optimized ResNeXt network must first test the category of test samples, called the main mode discrimination. Then, it sets the network study according to the preset fitting function of the OAM spectrum distribution (the self-defined loss function) and obtains the probability that test samples belong to training samples in each category, achieving the purpose of reconstructing the OAM spectrum distribution of the beam’s transmission field.Results and Discussions The discriminating results of the OAM spectrum of the Bessel vortex beam’s transmission field are compared with the numerical results based on the ResNeXt network by using a fixed recognition process (Table 1), and light density diagrams of the eighth-order Bessel vortex beam propagate through a glass medium under different incident angles as test samples (Fig.3). Additionally, the relative errors are calculated (Fig.4). Since the diffusion of the OAM spectrum distribution increases with an increase in the incident angle, the main mode loses its dominance when the incident angle increases to a certain degree. The proportion of side lobes exceeds the main mode, and the spectrum distribution’s regularity is weakened. The ResNeXt network’s discriminating error also has an increasing tendency with an increase in the incident angle. However, the maximum relative error does not exceed 22.86% compared with numerical results, and the absolute error of side lobes does not exceed 22.23% (Table 4). There are three main reasons. First, since the Bessel beam has the characteristics of multi-topological charges, its OAM spectrum distribution extends infinitely to both sides with the position of the main mode in the center. However, the training set types are limited and can only be discussed in the main modes. Second, since the regularity of the OAM spectrum distribution of the Bessel vortex beam’s transmission field decreases with an increase in the incident angle, the dispersion becomes more obvious, decreasing the recognition accuracy. Finally, since the OAM spectrum recognition problem is different from the conventional classification problem, the CNN feature of test samples is relatively related to the main mode and weakly related to the side lobes. Although the custom loss function contributes to reducing the error, it cannot determine the recognition result of the network. Thus, the side lobe recognition error is greater than the main mode.Conclusions Based on the ResNeXt network and by introducing self-defined loss function, this study discriminates the OAM spectrum distribution of the Bessel vortex beam’s transmission field, which propagates through the glass medium with an incident angle ranging from 0°~45°, the comparison is made, and the error of the numerical result is analyzed. The results show that the relative error of the main mode increases along with the increase in the wave beam incident angle. However, it does not exceed 22.86%, and the discriminating error of side lobes is bigger than that of the main mode. The proposed method is not limited to the category discrimination of the main mode, but discriminates the percentage of the main mode in the OAM spectrum distribution in detail. This study provides a new idea for the OAM mode discrimination; however, how to improve the discriminating accuracy of side lobes will be the next challenge.
Sep. 01, 2021Vol. 48 Issue 17 1706003 (2021)
Yong Chen, Jiali Li, Huanlin Liu, Zhimiao Ren, and Zhaozhong Han
Objective As a new type of optical wireless communication technology, visible light communication is becoming a popular communication technology due to its lighting characteristics, communication characteristics, and broad spectra. In intelligent transportation, visible light communication can use car lights as signal transmitters for information transmission. Therefore, the application of visible light communication to the internet of vehicles has broad development prospects. Visible light communication has a limited communication range because its communication carrier is visible light. The communication performance is reduced due to the problem of external visible light interference. When using visible light for vehicle communication, it is necessary to supplement it with other networks. In the communication process, it is necessary to switch between networks to ensure high-speed and continuous communication. When performing vehicle optical communication in an outdoor environment, it is easy to cause a ping-pong effect due to frequent network switching, which will cause unnecessary switching delays, as well as wrong switching judgments and network stability. Therefore, to achieve high-speed and stable visible light communication on the internet of vehicles, it is necessary to analyze the communication and network-switching characteristics of the network and design a reasonable switching algorithm.Methods This study investigates the problem that the evaluation gap between networks is too small when the vehicle is switched between networks in the visible light communication system of the outdoor car network. It can easily cause a ping-pong effect. It is proposed based on the analysis of the network-switching characteristics. An improved multiattribute handover decision algorithm is proposed. First, we classify and process the main attributes that affect communication performance in different networks, input the processed attributes, and forward the attribute indicators. Then, we use the improved objective weight solving algorithm to correct the attributes after normalization. The indicators are processed to obtain completely independent and objective network selection weights in the outdoor internet of vehicle environment to reduce the influence of the dependence among different attributes on the network selection. Finally, the subjective weights of the network selection are obtained by combining them with objective weights. Based on the consistency of subjective value, objective value, and optimality of the evaluation results, an improved subjective and objective weight distribution model is proposed. The final weights of each attribute are obtained according to the distribution model, and the weights are used. After calculating the network evaluation value of each network, we sort and select the network with the largest evaluation value as the target network to obtain the correct handover decision.Results and Discussions As a comparison, we take the number of vehicles and speed as the influencing factors, and compare it with the traditional analytic hierarchy process (AHP), the switching algorithm based on the decision tree (DT), and the switching algorithm based on principal component analysis (PCA). Using the handover failure rate, average bit error rate, and network throughput as indicators, the proposed algorithm is validated and compared in the simulation environment (Table 1). The simulation results show that under different conditions, the handover failure rate [Fig. 3(a)] and average bit error rate [Fig. 3(b) and Fig. 4(a)] are reduced and the network throughput [Fig. 4(b)] is increased when the number and speed of vehicles increase. Therefore, the proposed algorithm can effectively determine the best target network in a more complex environment, such as more communication users, higher frequency handover requests, and faster vehicle speeds, and enables the system to have higher communication performance.Conclusions In this study, the algorithm design and simulation demonstration of the above processes are conducted. The simulation results show that the proposed algorithm can determine the best target network. Compared with the three algorithms of AHP, DT, and PCA, the proposed algorithm reduces the failure rate of handover between networks and effectively avoids the ping-pong effect. Therefore, the proposed algorithm can effectively implement and improve system performance when external parameters that affect communication performance change. The multiattribute switching decision-making scheme of the visible light communication heterogeneous network based on the internet of vehicles in the outdoor environment provides an effective reference method.
Aug. 23, 2021Vol. 48 Issue 17 1706004 (2021)
Xingyu Cui, Fengyuan Lin, Zhihong Zhang, Jilong Tang, Xuan Fang, Dan Fang, Dengkui Wang, Kexue Li, and Zhipeng Wei
Objective At present, the main research is focused on lower-noise and higher-gain-bandwidth product of an APD in order to adapt to the evolving optical fiber communication systems. Usually, lower noise is related to higher speed, because a high gain tail can result in higher noise and longer transmission time in the gain distribution. Therefore, a major issue is how to effectively reduce noises in the APD research. An effective way to reduce noises is using beneficial heterojunction structures to impact ionization engineering (I 2E) design. A heterojunction structure is used in this method to provide spaces with different ionization threshold energies. This structure is more localized than the impact ionization that can be achieved in a spatially uniform structure. Through impacting ionization engineering, it has been achieved in the GaAs/AlGaAs material system with ultra-low noise of k=0.1. Now we have known that the heterojunction structure can reduce the multiplication noise of an APD by controlling the spatial separation of electrons and holes. There is a specific design which is to place a thin narrow band gap layer with a lower threshold energy adjacent to a wider band gap layer with a higher threshold energy, so that more ionization events occur in the thin narrow band gap layer with a lower threshold energy. At present, the first choice is the use of InGaAs/InP APD detectors for optical fiber communication. Because InP material has the advantages of large electron-hole ionization ratio k and low excess noise. In addition, the lattice constants of InP and In0.53Ga0.47As are very small. High quality extension can be realized by molecular beam epitaxy (MBE) and metal organic chemical vapor deposition (MOCVD). Here, we design InP/InGaAsP SACM APD through impact ionization engineering. An InGaAsP multiplication layer is inserted into the multiplication layer of a traditional InP-based APD, and there are two regions with different ionization threshold energies in the multiplication layer to make ionization events occur more intensively. In addition, the ionization of electrons and holes is regulated spatially in order to reduce the noise. Methods A kind of separation of absorption region-charge region-multiplication region (SACM) InGaAs/InP avalanche photodiodes is designed. Through the impact ionization engineering, an InP APD with double charge layers and double multiplication layers is designed. In order to control the location of impact ionization and to reduce the noise, a classification of ionization threshold energy is set in the multiplication region of this structure. The device simulator Silvaco is used to model this device. The energy band structure, electric field distribution, dark current, 1.55 μm pulse light response current, gain, etc. are simulated and calculated. At a 30 V voltage, a lower k value of 0.15 can be obtained for the new structure. And compared with the conventional SACM InP APD, the results show that the APD devices with new structures can obtain better noise characteristics.Results and Discussions The device simulator Silvaco is used to calculate and simulate the light and dark currents and gain of the device. The photocurrent of the device is obtained under the condition of the incident wavelength of 1310 nm, the dark current of the APD detector is less than 10 nA under the punch-through voltage, the punch-through voltage of the device is about 20 V, and the breakdown voltage is about 30 V. The device gain is set as 1.0 at the punch-through point. When the bias voltage rises by 30 V, the gain of the device increases from 1.0 to 8.0 (Fig. 2). The ionization coefficients α and β of holes and electrons are simulated and calculated in the device simulator Silvaco. We extract the hole and electron ionization coefficient values of 20 points, integrate them to calculate the k value (α/β) of each point and take the average value to obtain the noise coefficient k=0.15. The excess noise and gain simulation diagram are obtained, and we can see that I 2E APD has a low excess noise (Figs. 3 and 4). The same treatment is also performed on the conventional InP APD. The ionization coefficient values of holes and electrons at 20 points are selected and integrated to obtain the excess noise coefficient k=0.35. The design of impact ionization engineering is to insert a thin layer with a relatively low threshold energy in the area with a higher ionization threshold energy, so that the most ionization events occur in the trap layer with a low threshold energy, which leads to more certainty in the location of impact ionization, and thus the noise is reduced. From the partial energy band structures of the two devices in the equilibrium state, we can see that the well layer structure is designed in the I 2E APD energy band (Fig. 5). Conclusions The charge layer and multiplication layer of the conventional InP/InGaAs SACM APD are improved through impact ionization engineering, and an APD with double multiplication layers and double charge layers is designed. Two InGaAsP layers with lower ionization threshold energy are inserted between the InP multiplier layer and the InP charge layer, so that the most ionization events occur in the InGaAsP well layer. Through the structure designed by impact ionization engineering combined with the step distribution electric field in the multiplication region, the spatial modulation of the impact ionization events of electrons and holes leads to a lower excess noise with k=0.15, which has a lower excess noise compared with the conventional InP APD with the single multiplication layer. The design of this structure takes into account the positive influence of the dead zone on the excess noise and also takes into account the positive effects of energy band design and ionization threshold energy on the position of carrier multiplication. This will have a great guiding effect on device preparation in future.
Sep. 01, 2021Vol. 48 Issue 17 1701001 (2021)
Qingkun Song, Haibing Li, Yongjun Dong, Dongbing He, Shunguang Li, Suya Feng, Xucheng Wang, Zhengwei Kong, Liang Chen, and Qiubai Yang
Objective Since Er 3+,Yb 3+∶glass is used in laser diodes (LD) pumped lasers, several studies on thermal properties of Er 3+,Yb 3+∶glass have been reported. However, there are still few related reports on the effect of pumping repetition frequency and the material thermo-optic coefficient on output energy. The pumping repetition frequency of LD and thermo-optic coefficient of Er 3+,Yb 3+∶glass affect the thermal focal length and ultimately change the output energy of the Er 3+,Yb 3+∶glass laser. Thus, in this study, we analyze the effect of pumping repetition frequency and the thermo-optic coefficient on output energy to guide material selection and output energy analysis for the end-pumped high output energy Er 3+,Yb 3+∶glass laser. Methods In this paper, we design a passively Q-switched laser with LD end-pumped to measure output energy using a plano-concave cavity structure and Co 2+∶MgAl2O4 as the Q-switching crystal (Fig. 1). The measuring thermal focal length experiment is based on the critical cavity method and uses a flat-flat cavity to measure the thermal focal length. In the measurement of slope efficiency, the variation of the output energy with pumping power is measured without Co 2+∶MgAl2O4 in Fig. 1 under the same pumping conditions. Additionally, the thermal focal length formula, the matrix calculation method of the stable cavity, and the rate equation are used to analyze the phenomena in the above experiments. Results and Discussions In a passively Q-switched LD end-pumped laser, we obtained that the output pulse energy of EY1, EY2, and EY3 decreases from 417, 401, and 378 μJ to 356, 337, and 329 μJ as the pumping repetition frequency increases from 10 Hz to 28 Hz (Fig. 2). First, we verified the phenomenon that the thermal focal length decreases with increasing pumping repetition frequency theoretically and experimentally to analyze the above phenomenon. Second, by numerical simulation of the resonator, it is found that in the plane-concave cavity, the beam radius of the front surface of the resonator decreases with increasing thermal focal length when the thermal focal length is greater than fTm(the thermal focal length corresponding to the minimum beam radius of the front surface of the resonator) (Fig. 5). Finally, the rate equation is solved using the Runge-Kutta algorithm to obtain the trend of the output pulse energy gradually decreasing with increasing pumping repetition frequency (Fig. 6). This is because the output pulse energy is positively correlated with the beam radius of the front surface of the resonator. After performing the free-running operation, the slope efficiencies of the three Er 3+,Yb 3+∶glass samples, EY1, EY2, and EY3 were 22.16%, 22.82%, and 23.14%, respectively (Fig. 7). Their thermo-optic coefficients are 34×10 -7, 29×10 -7, and 24×10 -7 K -1, respectively. The Q-switched output pulse energy after adding Co 2+∶MgAl2O4 to the above non-saturable cavity are 323, 363, and 391 μJ (Table 3). When the thermal focal length increases with a decrease in the thermo-optic coefficient (Fig. 3), the cross-sectional area of the laser beam in Er 3+,Yb 3+∶glass increases accordingly. The inversion population participating in stimulated radiation in Er 3+,Yb 3+∶glass also increases, which increases the slope efficiency. Moreover, since the Q-switched output energy is positively correlated with the beam radius of the front surface of the resonator, the Q-switched output energy also shows an increasing trend. Conclusions In this study, we reveal the relationship among thermo-optic coefficient, pumping repetition frequency, slope efficiency, and Q-switched output pulse energy of an eye-safe solid-state laser with Er 3+,Yb 3+∶glass as the gain medium experimentally and theoretically, when the thermal focal length is greater than the value at the minimum point. The thermal focal length in Er 3+,Yb 3+∶glass decreases with an increase in the pumping repetition frequency, which decreases the cross-sectional area in the gain medium, and finally reduces the Q-switched output pulse energy. Thus, the Q-switched output pulse energy is negatively related to the LD pumping repetition frequency. Since the same pumping conditions, Er 3+,Yb 3+∶glass with lower thermo-optic coefficient has a larger thermal focal length, larger cross-sectional area of the stimulated radiation beam in Er 3+,Yb 3+∶glass, higher slope efficiency in a non-saturable cavity, and higher Q-switched output pulse energy. Thus, the Q-switched output pulse energy is negatively correlated with thermo-optic coefficient and pumping repetition frequency. Therefore, we can reduce the thermal lens effect by reducing the LD pumping repetition frequency and selecting low thermo-optical coefficient Er 3+,Yb 3+∶glass to achieve high output pulse energy, which will help human eye-safe solid-state lasers use this material further to develop the ranging, lidar, and medical fields.
Sep. 01, 2021Vol. 48 Issue 17 1701002 (2021)
Jiachao Xu, Zhixin Xia, Peng Chen, Shihong Shi, Shuhai Huang, and Liang Wang
Objective Control of microstructure and residual stress, and optimization of process parameters based on the temperature field are important methods to improve mechanical properties of the cladding parts. A relatively accurate laser heat source model should be provided to reconstruct the temperature field during the formation of the cladding layer. First, an accurate mathematical model of hollow ring laser heat source, which should be verified by numerical simulation and the experiment results, needs to be constructed to obtain the fundamentals for a practical temperature field, microstructure distribution, residual stress control, and process parameters optimization. The temperature distribution inside the molten pool could be reflected precisely by an appropriate heat source model to simplify the numerical calculation and deeply explore the influence of temperature gradient and cooling rate on residual stress and actual solidification microstructure during the solidification and cooling process. Since Goldak proposed the classical double ellipsoid heat source in 1984, a wide variety of heat source equations have been generated based on the mathematical modeling evolution of solid heat sources. However, the mathematical model of the hollow ring heat source based on the inside-laser coaxial powder-feeding system was rarely studied. A simple and practical heat source equation should be established to verify the reliability of the model through the combination of experiment and theory analysis.Methods Based on the finite element software called ABAQUS and the hollow ring laser system, the energy distribution discipline of the hollow ring laser was verified by the probe beam quality analyzer, and a formal hollow ring laser heat source equation was proposed. The energy density determined by numerical analysis was used to establish the final mathematical equation. Response surface method (RSM) was adopted after the hollow ring laser heat source equation was established. The fitting equation of molten pool size under mutative process parameters was conducted, and the three-dimensional size of the heat source model was parameterized through experiments.Also, a laser-melting deposition model with certain thermal-physical properties was established, and a mobile heat source subroutine was written in Fortran language. The subroutine was called in the ABAQUS software, and the heat source was loaded by the life-and-death element method to simulate the temperature field and thermal history of a single wall under mutative cladding process parameters. To verify the reliability of the heat source model, the actual temperature of the melting pool during the experiment was measured by K-type thermocouple, paperless data recorder (HIOKI LR8501), and infrared camera monitoring equipment (InfraTec, VarioCam® hr head).Results and Discussions The energy distribution of the hollow ring laser indicated a Gaussian distribution in the annular region, and the energy in the middle was higher than that on both sides of the annular region, as shown in Fig. 2(a). As a result, a “Gaussian-like” heat source distribution equation was proposed. The hollow ring laser morphology equation was obtained [Eq. (1)] after a Gaussian curve with a certain displacement was biased and rotated around the central axis [Fig. 2(b)]. In Eqs. (2)--(6), the peak power density of the hollow ring laser was calculated step by step through theoretical analysis, and the final mathematical analysis expression was further obtained [Eq. (7)]. In Eq. (7), parameters of multiple molten pools were used. Through response surface method (RSM) and laser cladding experiment, polynomial equations of molten pool width and depth on laser power, scanning speed, and defocus were fitted [Eqs. (9)--(10)]. The processing interval of the response surface method (RSM) is shown in Table 2. The physical model of laser cladding was established by the ABAQUS software, and the heat source equation subroutine was recorded to simulate the temperature field and thermal history in the process of laser cladding. The simulation results are verified in Fig. 7 and Fig. 10. Thermocouple (Fig. 9) and infrared camera were applied for verification, good fitting results were indicated, and the hollow ring laser heat source equation possessed certain accuracy and applicability.Conclusions The mathematical modeling of the three-dimensional hollow ring laser heat source was constructed to obtain an analytical formula using the idea of the normal distribution of revolution. The morphological parameters of the hollow ring laser heat source were determined by the shape of the molten pool and the value of the energy peak of the laser spot under mutative process parameters. The simulation results of the energy distribution of the heat source model indicated that the peak energy intensity was located at the edge instead of the center, and the vertical cross-section presented a “saddle”-shaped distribution. The measured results agreed well with the theory simulation, which confirmed the validity of the mathematical model.The finite element simulation of the temperature field of the hollow ring heat source indicated that temperature peak distribution was close to the edge, which correspond to the mathematical model results. Due to the high energy at the edge, it could compensate the weak part of the central heat input to promote the uniform temperature distribution, which was consistent with the theoretical analysis of the energy intensity of the ring light source. The temperature peak continuously reduced, and the temperature trough was increasingly influenced by heat accumulation and conduction. The thermal history was simulated by the ABAQUS software, and its simulation curve was also consistent with the measured value, which confirmed that the hollow ring heat source model possessed good accuracy and applicability.
Sep. 01, 2021Vol. 48 Issue 17 1701003 (2021)
Xueyan Dong, Pingxue Li, Shun Li, Tingting Wang, and Min Yang
Objective Laser is used as light energy and light tool in the manufacturing industry. Its characteristics such as including laser power, beam quality, and control of light, are not only the standards to measure performance of laser manufacturing system, but also the bases for selecting laser manufacturing system. Therefore, both laser power and beam quality must be considered seriously. Laser power is used as an index the processing capacity of the laser manufacturing system. Beam quality limits processing method, transmission distance, focal spot size, and processing quality. Under the condition of high average power pumping, thermal lens effect is generated, as the pump light is tightly concentrated at the laser gain medium. In the meantime, the spherical aberration of the thermal lens strongly affects the beam quality. Thus, how to improve beam quality, enhance the conversion efficiency, and shorten pulse duration are very important. In order to reduce the influence of thermal lens effect on beam quality of the solid-state laser, an Innoslab amplifier of spherical-aberration self-compensation based on ZEMAX physical optical simulation is proposed. In present study, we demonstrate a fiber-solid hybrid system based on an Innoslab amplifier with an all fiber laser and a double-passing amplifier as the seed source. This system combines the advantages of fiber laser, such as high beam quality, high electro-optical efficiency, and easy to obtain mode-locked narrow pulse, and those of solid laser, such as able to reduce the nonlinear effect and sustain high peak power.Methods In this paper, we proposed a fiber-solid hybrid Innoslab picosecond amplifier with high beam quality and high repetition rate. The seed consisted of an all fiber laser and a double-passing end-pumped amplifier. During the experiment, an eight-passing Innoslab amplifier based on the spherical-aberration self-compensation theory was designed by using the sequence mode of ZEMAX software. The seed light realized eight-passing amplification in the slab crystal. Higher extraction efficiency was obtained by increasing the overlap area of seed light and pump light in the gain medium. In order to reduce thermal lens effect in the slab crystal thickness direction and its influence, two measures were taken. The first one was to connect the crystal with the heat sink by double-sides welding method, so that air holes in the welding layer were avoided, the flatness of the indium layer was improved, and the crystal surface was uniformly dissipated. The second one was to suppress the thermal distortion in the slab crystal thickness direction with spherical-aberration self-compensation, so that the beam quality degradation caused by the thermal lens effect was overcame.Results and Discussions In order to better understand the phase variation of the light beams with positive spherical aberration, we used ZEMAX software to simulate the process according to the principles of geometrical optics (Fig. 7). If the two identical thermal lenses were symmetrically placed about the focus of the laser beam, the degradation of the beam quality caused by the first thermal lens can be compensated by the second thermal lens. Fig. 8 shows the Innoslab amplifier based on spherical aberration compensation theory. To reduce thermal lens effect in the slab crystal thickness direction and its influence, the method was to connect the crystal with the heat sink by double-sides welding method, so that air holes in the welding layer were avoided, the flatness of the indium layer was improved and the crystal surface was uniformly dissipated (Fig. 11). The output power from the all fiber laser was 2 W. The laser received further amplification in the double-passing end-pumped amplifier and the gain was dramatically enhanced by the Innoslab amplifier. Maximum output power of 28.4 W was achieved at a solid-state pump power of 117 W (Fig. 14). Meanwhile, the beam quality was well preserved with M2 factor of 1.3 by the Innoslab amplification structure which was favorable to the spherical-aberration compensation (Fig. 17). Figure 16 shows the spectral width of the Innoslab amplifier was narrowed to 0.21 nm, indicating remarkable gain narrowing effect. It can be seen that the gain narrowing effect broadened the pulse width of the double-passing amplifier to 10.6 ps (Fig. 10). Conclusions In present study, we designed a picosecond fiber-solid hybrid Innoslab amplifier which was seeded by an all fiber laser and a double-passing end-pumped amplifier. The number of amplifiers and the gain were numerically simulated, and the Innoslab cavity was designed based on thermal lens effect compensation. The seed light realized eight-passing amplification in the slab crystal. The seed light injected into the Innoslab amplifier with average output power of 4.5 W and the repetition rate of 18 MHz. As a result, a laser pulse with average power of 28.4 W and pulse width of 10.6 ps was achieved under the pump power of 117 W, corresponding to an optical-to-optical efficiency of 20.4%. The beam quality factors M2 were 1.33 in the horizontal direction and 1.24 in the vertical direction. This system, which combined the advantages of the all fiber amplifier and the solid-state laser amplifier, enabled high repetition rate, and good beam quality with high gain picosecond pulses. It made significant contributions to many applications such as material micro-processing, laser ranging, and laser detection.
Sep. 03, 2021Vol. 48 Issue 17 1701004 (2021)
Yuxuan Man, Li Zhong, Xiaoyu Ma, Suping Liu, and Yuxi Ni
Objective High-brightness semiconductor lasers are preferable light sources for various applications, such as high-efficiency pumping sources, material processing, medicine and biology, and laser display. The critical design objective for high brightness semiconductor lasers is to maximize the output power while maintaining good beam quality. Conventional broad-area high-power laser diodes suffer from poor beam quality due to the excitation of the higher modes and beam filamentation. The tapered structure is introduced to enhance the output power while maintaining the high beam quality. However, the tapered lasers with common contact usually suffer from spatial hole burning and self-focusing at high continuous-wave (CW) output power. The use of separated electrode contacts for the tapered lasers can effectively suppress detrimental effects in the beam quality and increase the possibility for the improvement of the brightness. In present study, we fabricate a high brightness tapered lasers with separated contacts and analysis experimental data suitable for a better understanding of the impact of the current injected into ridge waveguide (RW) section and tapered amplifier section on output power and beam quality.Methods The tapered laser with separated contacts is fabricated in present work. The epitaxial layer structure grown by metal organic chemical vapor deposition based on a GaAs substrate. After material growth, the ridge waveguide section, the tapered section, and the grooves are defined by standard i-line lithography and formed by inductively coupled plasma dry etching. The etched grooves are down through the active region, designed to restrict the unwanted mode travelling to the ridge waveguide section. The ohmic contact layer in taper section is etched to reduce the lateral current spreading. Then, a silica layer is deposited on the wafer by plasma enhanced chemical vapor deposition serve as electrical insulation, and insulation layer is removed from current injection windows. Next, metal p-electrode is deposited on the whole wafer by electron-beam evaporation, and then metal layer in the electrode separation area is removed using lift-off process. A metal n-electrode is formed by evaporation and metallization after substrate thinning. The wafer is cleaved and the front/rear facet is antireflection/high-reflection films coated, respectively (Rf≈0.1%, Rr≈96%). Finally, single emitters are mounted p-side down on AlN sub-mounts with AuSn solder. Golden wire bonding is used to contact the n-side with the sub-mounts for the measurements.In this paper, we investigate tapered lasers with a ridge waveguide width of 5 μm, the RW length of 1500 μm, the taper section length 4000 μm, and taper angle of 5°. The output power, the beam propagation ratio, the intensity profile in the beam waist, and the lateral near-field profile are measured in dependence on the currents through ridge waveguide section and taper section. Device testing is performed under CW conditions.Results and Discussions The CW output power of 7 W is achieved with the current through the ridge section IRW>300 mA. With the increase of Iridge, the threshold current of taper section decreases first, and then stays nearly constant (Fig. 3). At IRW=0 mA, no gain is provided to the optical mode in the RW section. The required threshold gain has to be provided by the taper section, resulting in a large threshold current due to large active volume of taper section. As the IRW increases, the gain in the RW also increases. The required threshold gain is provided by both the RW section and the taper section, so that the threshold current of taper section decreases gradually. With the increase of IRW, the beam propagation factor decreases first down to a minimum value and then increases at the current through taper section Itaper=7 A (Fig.4). As the gain in the RW increases, the power inside the RW will increase until gain saturation, the pumping outside the ridge waveguide decreases, and the intensity of the side lobes in the RW section is reduced correspondingly, thus the beam quailty is improved with the IRW increase from 0 mA to 300 mA. When the IRW increases to 500 mA, there will be obvious side lobes appear in the lateral near-field, which may be due to the unwanted higher-order modes are excited in the RW section (Fig. 6). Finally, the brightness of the tapered laser with separated contacts is 369 MW·cm-2·sr-1 at 6.4 W of the output power.Conclusions In present study, the impact of driving current on the characteristics of tapered lasers with electrically separated contacts has been investigated. Tapered lasers emitting at 975 nm providing 7 W of output power in CW operation is fabricated. The increasing of IRW induces the increase of optical gain and the reduction of the threshold current of taper section. In a certain IRW range, the improvement of beam quality on account of the decrease of pumping outside the ridge waveguide and reduction of the side lobes intensity in the RW section. At high current IRW, the unwanted higher-order modes are excited in the RW section and are amplified in the taper section, resulting in the deterioration of beam quality. At 6.4 W of the output power, the beam propagation ratio of M2=1.66 (1/e2) is obtained. The brightness of the tapered laser with separated contacts is 369 MW·cm-2·sr-1.
Sep. 01, 2021Vol. 48 Issue 17 1701005 (2021)
Yunfeng Liu, and Wei Liang
Objective Lasers with narrow linewidth and low size-weight-and-power (SWAP) are the key elements for space coherent communication, long range sensing, and quantum technology, etc. Compared with a single frequency fiber laser, a solid state laser and an external cavity diode laser (ECDL) using on-chip optical cavities and hollow Fabry-Perot (FP) cavities possess much lower thermal effects, nonlinear effects, and frequency drifts. In the past, a high performance narrow linewidth laser(NLL) realized by injection locking to a large FP cavity has been demonstrated in the laboratory, however it has never matured into a viable product due to the large FP cavity and optic bench used in the experiment. To take this technology out of laboratory and commercialize it, here we packaged and characterized a compact 1550 nm ECDL employing a miniaturized FP cavity with a high quality factor (Q).Methods We developed a miniaturized FP cavity with flat and concave mirrors with nominal reflectivity of ~99.98%. The cavity length is 7 mm and we measured its quality factor utilizing the ring-down technique and obtained Q of ~10 8(Fig. 1). We packaged an ECDL with its diagram shown in Fig.2. The light from a DFB chip was firstly collimated and sent to a circulator. The light was reflected, routed toward and coupled to the FP cavity. The transmitted light went through the circulator and was fed back to the DFB chip to form the injection locking. The DFB chip was resided on a small thermo electric cooler and the whole optical system was resided on a large thermo electric cooler. The size of the prototype was 3.8 cm×2.4 cm×2 cm. We used a home-made low noise current source to drive the DFB chip and the precise temperature controllers are used to stabilize the temperature of the DFB chip and the whole optic bench. By tuning the current, the DFB laser was injected into the selected fundamental mode of the FP cavity. Results and Discussions We characterized the performance of the ECDL using two widely adopted methods, i.e., the self-delayed heterodyne method and the frequency discriminator method. With the first method, we used a fiber delay length of 100 km, an AOM with a frequency shift of 80 MHz and obtained the line shape shown in Fig. 3(a). The 3 dB linewidth was estimated to be ~200 Hz and the fundamental Lorentz linewidth was approximately 20 Hz based on the fitting of the baseline. With the second method, we used a commercial product and measured the frequency noise (FN), and the data was plotted in Fig. 3(b) and compared with that of a commercial fiber laser (CoSF-D). Meanwhile, the FN of the NKT E15 fiber laser was also plotted for the purpose of comparison. As was seen, the FN of our ECDL at offset frequency lower than 10 kHz was slightly lower than that of NKT E15. The noise hump at offset frequency between 10 Hz and 100 Hz was from the measurement system as it also appeared in the line of a commercial fiber laser (CosF-D). Finally, we measured the temperature-frequency tuning sensitivity of our ECDL to be around 200 MHz/K, which was much lower than those of materials used in a fiber laser, a solid state laser and an on-chip ECDL.Conclusions We have shown an ECDL based on injection locking of DFB chip to a compact high Q FP cavity, and it is a viable way to obtain a high performance NLL with low SWAP and low cost. This first prototype we have packaged has shown frequency noise comparable to that of the well-known NKT E15 fiber laser at offset frequency of Q of the FP cavity and implementing an advanced packaging technique, we believe its performance can surpass that of the NKT X15 fiber laser.
Sep. 01, 2021Vol. 48 Issue 17 1715001 (2021)
Siyu Zhu, Baoxi Yang, Xiaozhe Ma, Fang Zhang, Weilin Cheng, Zhiyuan Niu, and Huijie Huang
Objective Photolithography is a crucial technology in integrated circuit manufacturing. With the critical dimension of photolithography becoming smaller, integrated circuits are becoming more and more compact. For this reason, a variety of resolution enhancement techniques, such as off-axis illumination, have been proposed. The influence of pupil performance on the quality of exposure pattern and overlay accuracy is prominent with the application of this technology. Off-axis illumination modes are generated by the illumination system of the photolithography machine. The generally used illumination modes include conventional, annular, 0° quadrupole (Q0), 45° quadrupole (Q45), dipole in X direction (DX), and dipole in Y direction (DY). In the working process of the photolithography machine, the lenses are exposed to deep ultraviolet light. Thus, the transmittance of their optical materials and coating films gradually deteriorate, which may affect the pupil performance. It is necessary to adopt the pupil correction technology for illumination system to improve the pupil performance.Recently, various pupil correction methods or devices have been proposed. However, these methods have not produced a specific correction process. Energy loss during pupil correction affects production rate of photolithography machine. To solve these problems, a high energy efficiency pupil correction method is proposed in this paper. This method can improve the performance of a corrected pupil while energy efficiency is increased maximally. As a result, production rate of photolithography machine is improved while ensuring quality of exposure pattern.Methods The main goal of the pupil correction method is to correct an unqualified pupil to a full-field pupil correction target. In traditional correction method, the theoretical limit (zero) is set as the target. However, the reference energy value for the correction method proposed in this paper is changed. The reference energy value is selected by considering the process and assembly errors of the pupil corrector. The deviations of pupil correction results at different fields of view are also considered. In this way, the performance of the corrected pupil can meet the requirements while the energy loss during the correction is minimized. Furthermore, considering the correction requirements of different illumination modes, a pupil correction plate suitable for many illumination modes is designed by the multi-ring partition method.To verify the feasibility of this method, a pupil correction analysis is conducted. The pupils, including three annular illumination modes and three different quadrupole illumination modes, are measured in the illumination system of a KrF step-and-scan photolithography machine with NA=0.82. These annular (quadrupole) illumination modes are corrected by a correction plate, for which the transmittances are calculated by the multi-ring partition pupil correction method. The pupils of these annular (quadrupole) illumination modes are divided into three rings ([0, 0.5), [0.5, 0.75), and [0.75, 1]) along the radial direction. According to the manufacturing and assembling errors of the pupil corrector, Δ1 is set to 0.3%. Δ2 is set to 0.2% for the difference of pupil correction results at different fields of view.Results and Discussions For a comparison study, the traditional correction method and the method proposed in this paper (Fig. 6) are used to correct the measured three annular (quadrupole) illumination modes. The correction results of the two correction methods can meet the full-field pupil correction target (Fig. 9 and Fig. 10). The transmittance of the correction plate designed by the multi-ring partition pupil correction method is significantly improved (Table 2 and Table 4), and is applicable to the three annular (quadrupole) illumination modes. Compared with the traditional correction method, the multi-ring partition pupil correction method can reduce the maximum energy loss after correction from 4.54%, 5.54%, and 5.52% to 1.98%, 2.06%, and 2.21% for the three annular illumination modes (Table 3), and the maximum energy loss after correction from 3.06% to 0.93% for the quadrupole illumination mode Q3 (Table 5).Conclusions In this paper, the high-energy efficiency pupil correction method based on multi-ring partition is proposed. The multi-ring partition method is adopted, and the selection method of the reference energy value is changed. In this way, one pupil correction plate is suitable for several illumination modes. The energy loss caused by pupil correction can be reduced, and the performance of the corrected pupil meets the requirements. The results of pupil correction indicate that the maximum energy loss of annular and quadrupole corrected pupils can be reduced from 5.54% and 3.06% to 2.06% and 0.93% respectively, in comparison with the traditional pupil correction method. This method is of great significance to improve the production rate of the photolithography machine.
Sep. 01, 2021Vol. 48 Issue 17 1704001 (2021)
Qiuhui Chu, Chao Guo, Qiang Shu, Donglin Yan, Wenjie Wu, Fengyun Li, Haoyu Zhang, Honghuan Lin, Jianjun Wang, and Feng Jing
Sep. 01, 2021Vol. 48 Issue 17 1716001 (2021)
Chenchen Fan, Tianfu Yao, Hu Xiao, Liangjin Huang, Jiangming Xu, Jinyong Leng, and Pu Zhou
Sep. 01, 2021Vol. 48 Issue 17 1716002 (2021)
Heting Li, Zhigang He, Fangfang Wu, Leilei Tang, Zhouyu Zhao, Tong Zhang, Tianlong He, Ke Xuan, Haiyan Zhang, Wei Wei, Ping Lu, Zeran Zhou, Lei Shang, Gongfa Liu, Hongliang Xu, Xiaoye He, Shiping Jiang, Xiangtao Pei, Chen Gao, Qika Jia, Jun Bao, Shancai Zhang, and Lin Wang
Objective Under the financial support of Natural Science Foundation of China, a new infrared free-electron laser (FEL) facility, named FELiChEM, is being developed at University of Science and Technology of China in Hefei. It will be a user facility dedicated for energy chemistry research, and will deliver the infrared laser in the spectral range of 2.5--200 μm to five research stations. National Synchrotron Radiation Laboratory is responsible for the development of the FEL light source and optical beam line.Methods FELiChEM consists of mid-infrared (MIR) and far-infrared (FIR) free-electron laser oscillators driven by one 60 MeV linac. The linac mainly contains: a 100 kV electron gun, a 476 MHz subharmonic standing wave pre-buncher, a 2856 MHz fundamental frequency traveling-wave buncher and two 2856 MHz fundamental frequency traveling-wave accelerating tubes separated by a magnetic compressor (chicane). Now we have achieved the electron beam with the maximum electron energy of 65 MeV, root mean square value of energy spread of less than 240 keV, normalized transverse emittance of 20--50 mm·mrad and bunch charge of 1.0--1.5 nC. The time structure of the electron beam can be easily tuned with the macrobunch width of less than 10 μs, macrobunch repetition rate of 1--10 Hz and optional microbunch repetition rate within 238,119,59.5,29.75 MHz. The two oscillators cover the wavelength ranges of 2.5--50 μm and 40--200 μm, respectively. In each oscillator, two spherical mirrors with copper base and gold coatings are used to form a symmetrical optical cavity. Two planar permanent-magnet undulators are placed in the center of the two optical cavities. The cavity length for both two oscillators is 5.04 m. The infrared radiation is outcoupled from the downstream cavity, which contains multiple mirrors with different outcoupling hole sizes and mechanical conditioners for switching mirrors. Laser beam generated from the two oscillators transports through the same beam line in low vacuum environment (~10 -2Pa) to the experimental hall. The total length of the beam line is about 34 m. In the experimental hall, five research stations in one line are: photon dissociation endstation, photon excitation endstation, and photon detection endstation (containing 3 sub-endstations: sum frequency generation spectroscopy, nanoscale infrared spectroscopy, and in-situ reflection-absorption infrared spectroscopy).The layout of FELiChEM is shown in Fig. 1. Results and Discussions The design of FELiChEM started from 2015. In July 2018, we began to commission the linac and made the high-quality electron beam travel through the mid-infrared oscillator in one month. Then, after finishing the installment of the optical beamline in May 2019, we successfully detected the spontaneous radiation at the research station in the morning of June 9, 2019 and we achieved the first FEL lasing at 15 μm with the electron beam energy of 35 MeV in the afternoon of the same day. After several months we shut down the machine to install the online laser alignment system and the FEL diagnostics station. We restarted the commissioning of the MIR oscillator from May 2020, and until November 2020, the MIR oscillator had achieved the task object. It generates the laser beam covering the spectral range of 2--50 mm with four electron beam energies of 60 MeV, 48 MeV, 30 MeV and 22 MeV, as shown in Fig. 4. The continuous wavelength tunability is about 300%. Based on the electron beam with the macro-pulse width of 10 μs and micro-pulse repetition rate of 119 MHz, the maximum macro-pulse energy reaches 182 mJ at the window exit of photon dissociation endstation, while the maximum micro-pulse energy is about 170 μJ. In the wavelength range of 6--10 μm, the macro-pulse energy exceeds 100 mJ. An obvious power gap appears around the wavelength of 20.5 μm and the corresponding wavelength of this power gap will be moved to above 50 μm by changing the size of the waveguide in the future. At the wavelengths longer than 40 μm, the laser intensity drops rapidly mainly because the transmittance of the cesium iodide (CsI) window decreases rapidly with the increase of laser wavelength. The spectra measured by the grating spectrometer demonstrated that the full width at half maximum of FEL bandwidth was about 1% (Fig. 5). Currently, each research station is commissioning their instruments online with the mid-infrared FEL, and we will start the commissioning of the far-infrared oscillator soon in 2021.Conclusions The mid-infrared oscillator of FELiChEM has achieved its task object and can provide 2--50 μm laser for research stations. The commissioning of the far-infrared oscillator will start soon. We expect to finish the commissioning of the FEL source in 2021, and then the facility will be fully open to the users, and at the meantime we will make continuous efforts to improve the stability and reliability of this FEL machine.
Sep. 01, 2021Vol. 48 Issue 17 1700001 (2021)
Zhaohui Yang, Mingzhu Jiang, Yongchen Liu, Longhui Zhang, Weilin Xu, Yue'e Wang, and Fangrong Hu
Objective Polarization is an important characteristic of terahertz (THz) waves and is widely applied in THz communications, imaging, sensing, detection, and other fields. Traditional THz polarization converters have large volumes, narrow bandwidths, and poor integration capabilities because they are based on the birefringence of materials. Metasurface polarization converters provide a potentially useful alternative. A metasurface is an ultrathin material comprising a planar array of subwavelength unit cells that can control THz waves with high performance. However, conventional metasurface polarization converters have a single function and a fixed bandwidth; thus, they cannot provide dynamic modulation. In this paper, we propose a THz-bandwidth, tunable polarization converter based on a vanadium dioxide (VO2) hybrid metasurface. VO2 is a typical phase-transition material that can change from an insulating state to a metallic state under an external optical, electrical, or thermal stimulus when its temperature exceeds 68 ℃. During the phase transition, its electrical conductivity increases by about four orders of magnitude. Our proposed device can modulate the polarization of a THz wave by dynamically controlling the phase transition of VO2.Methods The proposed polarization converter comprises three layers: a metal substrate, an intermediate polyimide (PI) dielectric layer, and a VO2 composite metasurface. The resonant structure of the converter comprises a metal ring, with two metal rods crossing a diameter, and a piece of VO2 embedded in the middle of the two metal rods. We used the full-wave electromagnetic simulation software CST Microwave Studio 2019 to simulate the performance of this converter. In the simulation, we used periodic boundary conditions in the x- and y-directions, and open boundary in the z-direction. The THz wave is incident normal to the surface from the -z-direction, and the polarization angle is set at a counterclockwise deflection of θ=45° relative to the +x-axis. We obtained reflection amplitude spectra for co-polarization and cross-polarization from the simulation both before and after the VO2 phase transition and calculated the polarization conversion ratio (PCR) and the relative bandwidth of the device using the simulation results. We simulated the current distributions in both the resonant structure and the metal substrate to clarify the physical mechanism responsible for THz-wave polarization conversion and the effect of the VO2 phase transition on the polarization conversion bandwidth. We also analyzed the effects of the thickness of the PI layer and the polarization angle of the incident THz wave on the polarization conversion.Results and Discussions When VO2 is in the insulating state, the reflection of the cross-polarization component exceeds 80% over the frequency range of 1.58--2.08 THz and PCR exceeds 95%. However, when the VO2 becomes metallic state under electrical triggering, the frequency band with a cross-polarization conversion rate above 80% is reduced to 2.04--2.08 THz, although the PCR in this frequency band remains above 95% (Fig. 2). The relative bandwidth with such a large PCR is thus reduced from 27% to 1.9%. We analyzed the current distribution at the three resonant frequency points f1=1.61, f2=1.88, and f3=2.07 THz. When VO2 is in the insulating state, resonant frequencies occur at 1.61 and 1.88 THz because of polarization conversion caused by magnetic resonance of the incident wave, while a third resonant frequency at 2.07 THz is due to polarization conversion caused by electric dipole resonance of the incident wave. The superposition of these three resonant frequencies forms a broad band. When VO2 is in the metallic state, however, the magnetic resonances at 1.61 and 1.88 THz are eliminated, but the electric dipole resonance at 2.07 THz is not affected. Consequently, the band becomes a narrow-band resonance at this single frequency. We also analyzed the effects of the thickness of the PI dielectric layer and the incident polarization angle on PCR. When the polarization angle of the incident THz wave ranged from 40° to 55°, PCR was >80% (Fig. 5).Conclusions We have designed a bandwidth-tunable THz polarization converter based on the phase-transition material VO2. When VO2 is triggered to undergo phase transition, the device transforms from a multifrequency, resonance-superposition, broadband device to one with a single resonant frequency. Consequently, the bandwidth for which the cross-polarization reflectivity exceeds 0.8 changes from 1.58--2.08 THz to 2.04--2.08 THz; the relative bandwidth for which PCR is >95% thus decreases from 27% to 1.9%. By analyzing the resonant modes and the accompanying surface-current distributions, we can explain both the mechanisms responsible for the resonances in the device and the reason for the bandwidth change caused by the phase transition. We also analyzed the effects of the thickness of the dielectric medium and the polarization angle of the incident THz wave on the PCR before and after the phase transition of VO2. The proposed method has potential and important applications in THz communication, sensing, detection, and imaging systems.
Sep. 03, 2021Vol. 48 Issue 17 1714001 (2021)
© Copyright 2018-2021 | Chinese Laser Press.
All Rights Reserved 沪ICP备15018463号-20