


Please enter the answer below before you can view the full text.

Jiao Li, Shichao Miao, Shaoze Song, Tong Lu, Tingting Chen, and Feng Gao
Objective In photoacoustic tomography, considering the size of ultrasonic transducers, especially for ones with large active surfaces, the traditional model-based (MB) method sums up the forward model matrix of each discrete point from the active surface to build this matrix. Although this traditional method has greater accuracy than the delay-and-sum method and back-projection method, with an increase in the number of discrete points from the active surface of transducer, the computing time and memory consumption will be more. Here, we present a new MB photoacoustic reconstruction algorithm based on the concept of virtual parallel projection. This model is suitable for photoacoustic tomography systems employing flat or cylindrical focused transducers with large active surfaces. This reconstruction algorithm directly establishes a virtual parallel-projection model matrix to replace the sum of the model matrices of the discrete points of the surface. The proposed method has an image performance similar to that of the traditional MB reconstruction method with discretized surface elements but considerably lower time consumption and storage requirements in the reconstruction process. We hope that this high-efficiency, high-accuracy method can provide a valuable reference and guidance for the research on MB photoacoustic reconstruction algorithms for use in real-time photoacoustic tomography.Methods A photoacoustic reconstruction algorithm based on a virtual parallel-projection model is introduced to solve the problem caused by transducers with large active surfaces. When the distance between the image center and transducer satisfies the virtual parallel-projection condition (Eq. 6), the back-projection profile of each discrete point on the active surface in the reconstruction area can be approximated as a straight line parallel to the transducer (Fig.3). Then, a virtual parallel-projection model matrix can be directly built to replace the sum of the model matrices based on all discrete points on the surface. This step helps avoid the repeated matrix calculations of each discrete point and can reduce the time and memory requirements. The image performance of the proposed method was first demonstrated by numerical simulation using microspheres with a radius of 200 μm. We compared the photoacoustic images reconstructed by three methods, namely, the traditional model-based (MB) method, MB method with discrete surface elements (MB-SE), and proposed method based on virtual parallel-projection (MB-VP). The computing time and memory consumption of MB-SE and MB-VP methods were quantitatively calculated to show the high efficiency of the proposed method. Then, the phantom experiment was implemented using a self-built photoacoustic imaging system to verify the reconstructed accuracy of the MB-VP method (Fig.1). This agar phantom consisted of some polyethylene microspheres of diameter 200 μm. These microspheres were approximately embedded on the same plane in the phantom. Finally, to assess the feasibility of the MB-VP method for in vivo imaging, animal experiments were performed on the thoracic cavity region of a four-week-old KM mouse (~18.4 g).Results and Discussions The reconstruction results of the proposed MB-VP method show high image quality and high reconstruction accuracy, comparable to those of the MB-SE method (Fig.4). However, the MB-SE method obtains desirable reconstruction results at the expense of computing time and memory consumption by increasing the number of discrete points on the active surface of the transducer (Table 2). When the active surface of the transducer is discretized into 15 points for the MB-SE method, the calculation time exceeds 10 min, which is approximately 20 times that of the proposed MB-VP method. In contrast, the MB-VP method provides higher quality and better spatial resolution in the reconstructed image with significantly lower reconstruction time and memory consumption (Fig.6). The phantom experiment results, which are consistent with the numerical simulation results, demonstrate that both MB-VP and MB-SE methods can effectively suppress image artifacts and obtain high-fidelity reconstructed images (Fig.7 and Table 3). The animal experiment results show that the result of the MB method suffers from artifacts and distortions, especially in the imaging of blood vessels at the position of the mouse epidermis far away from the image center; in contrast, the shapes of these blood vessels are accurately recovered by the MB-SE and MB-VP methods (Fig.8).Conclusions In this work, a novel MB reconstruction algorithm based on the concept of virtual parallel-projection is developed to achieve high-efficiency MB reconstructions for photoacoustic tomography employing flat or cylindrical focused transducers with large active surfaces. By quickly and accurately building the forward model matrix based on the virtual parallel-projection condition, the proposed method can break the trade-off between reconstructed accuracy and computing consumption, which limits the applications of the traditional MB reconstruction methods. The results of numerical simulations, phantom experiments, and in vivo experiments demonstrate that the execution time and memory space required to reconstruct the initial pressure image are considerably reduced by the proposed method without sacrificing the quality of the reconstructed images. In other words, the MB-VP and MB-SE methods can obtain similar reconstructed images with higher quality and higher fidelity than the MB method, while the computational cost of the MB-VP method similar to that of the MB method, that is, it is much lower than that of the MB-SE method. The computational efficiency of the proposed method can be further improved through the parallel computation approach based on graphics processing unit acceleration to meet the requirements of real-time photoacoustic tomography.
Jul. 30, 2021Vol. 48 Issue 16 1607001 (2021)
Zhimin Zhang, Yuran Huang, Shaocong Liu, Cuifang Kuang, Liangcai Cao, Yong Liu, Yubing Han, Xiang Hao, and Xu Liu
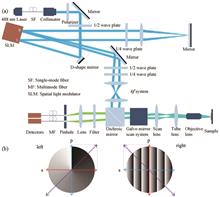
Objective Fluorescence emission difference (FED) microscopy is a versatile super-resolution microscopy flexible for all types of fluorescent dyes. However, the limited imaging speed is the main drawback that hinders the application of FED, owing to the double imaging process of positive confocal image using a solid spot scan and negative confocal image using a negative spot scan. Parallel fluorescence microscopy can overcome this limitation owing to its ability to simultaneously capture positive and negative confocal images. However, the complexity of this method’s system will increase instability and difficulties in daily maintenance, which also considerably restricts the popularization of the method. In this study, a new imaging method using a spatial light modulator (SLM) named common-path parallel FED (cpFED) microscopy was proposed. Compared with the traditional parallel FED microscopy, the proposed method that uses SLM and common path modulation maintains the advantage of doubling the imaging speed while overcoming the impact of instabilities introduced by different devices in noncommon-path parallel systems and simplifies the light path.Methods A property of SLM is that only linear polarized light can be modulated in a fixed direction, which is the major property of common-path parallel FED microscopy. Using the polarization rotation realized by passing forth and back through a quarter-wave plate, SLM can modulate the s and p polarization components of the emitted light (Fig. 1). Using two-phase grayscale patterns, vortex and tilt-grating modulation patterns, to simultaneously modulate the horizontal and vertical polarization components of the incident laser beam on a single SLM, a staggering Gaussian solid spot and a hollow spot are generated to form the final convergent light field at the focus plane. The solid and hollow spots scan the sample simultaneously, and the fluorescence signal excited by the two spots is measured using two detectors, which will introduce a fixed transverse displacement between two images. Translating the positive confocal image to align with the negative confocal image and combining with the FED algorithm, the fast super-resolution imaging of the sample is realized. Experimental results show that the proposed method exhibits good ultradiffraction-limit imaging capabilities and high imaging speed and the resolution can be increased by approximately two times compared with traditional confocal imaging.Results and Discussions To test the performance of cpFED, the experimental results of 200 nm and 100 nm fluorescent beads were presented herein. The 200 nm fluorescent beads were used to adjust the system and demonstrate the translation effect between the positive and negative confocal images because of its’ high fluorescent quantum efficiency (Fig. 2). The 100 nm fluorescent beads were used to measure and determine the optimum resolution performance of cpFED (Fig. 3). The full width at half maximum of a single bead plotted in Fig. 3(c) reveals that the resolution of cpFED in our system can reach up to 133 nm, indicating that the resolution of cpFED can be increased by approximately two times compared with traditional confocal imaging. Furthermore, a vimentin sample was used to verify the biological application of cpFED. The insects depicted in Fig. 4(a1), (b1), (a2), and (b2) show that the resolution and contrast in cpFED can be significantly promoted, while the noise in cpFED is considerably lower than that in traditional confocal imaging.Conclusions Using SLM, cpFED can realize a small translation between solid and donut spots in a common path and simultaneously capture positive and negative confocal images, thus overcoming the imaging speed limit and promoting the biological application of FED. Compared with pFED, the proposed cpFED simplifies the system structure, reduces the adjustment complexity, and improves the robustness of the system because of the SLM flexibility. Experimental results demonstrate that cpFED achieves a resolution improvement of two times that of traditional confocal imaging while achieving double the imaging speed.
Jul. 30, 2021Vol. 48 Issue 16 1607002 (2021)
Hong Liang, Kang Ying, Di Wang, Jinjin Wei, Xuan Li, Haoyang Pi, Fang Wei, and Haiwen Cai
Objective Ultranarrow bandpass optical filters are key components for signal processing in the fields of microwave photonics, dense wavelength-division multiplexing, coherent communication, and optical fiber sensing. The ideal ultranarrow bandpass optical filter has a rectangular frequency response composed of an ultraflat passband and a very steep edge. The flat passband has high signal fidelity and can prevent the signal from being distorted, whereas the steep edge can suppress the crosstalk between the adjacent bands. Fiber Bragg gratings (FBG) that achieve various frequency responses are commonly used in bandpass optical filters towing to their small size, anti-electromagnetic interference, low insertion loss, and compatibility with other optical fiber devices and systems. However, the ordinary uniform FBG bandwidth is relatively large, in a dozen GHz or hundred GHz. Although the phase-shifted fiber Bragg grating can achieve a bandwidth below 100 MHz, its Lorentz or quasi-Lorentz line frequency response limits its application in high-resolution signal processing. Recently, the multiphase-shifted FBG (MPSFBG) containing multiple phase shifts have been used to design the ultranarrow bandpass optical filters. The MPSFBG can obtain the narrow band flat-top filter response with small insertion loss and good rectangularity by optimizing the position of each π phase shift. In actual preparation, there are errors in the control of the phase-shift amount and phase-shift position, which result in the difference between the actual optical spectra and theoretically calculated optical spectra under ideal conditions. Therefore, the introduction of a high-precision phase shift is the key to the fabrication of the MPSFBG.Methods This study presents a method for fabricating the MPSFBG by introducing a high-precision phase shift into the FBG using local temperature control. First, the influence of the phase-shift amount and position errors on the insertion loss, bandwidth, and shape factor of the MPSFBG filter is analyzed in the theoretical part of this study, and the phase-shift amount and position precision required by the MPSFBG to obtain the narrow band flat-top filter response with small insertion loss and good rectangularity are obtained. In the experimental part, the principle of introducing a phase shift into the FBG using the local temperature control scheme is analyzed, and the structure for local temperature control is designed. The phase-shift amount and position precision achieved using the designed local temperature control structure in uniform FBG are experimentally measured. Finally, a dual-phase-shifted FBG is fabricated using this method. In addition, its frequency response is measured.Results and Discussions The method proposed in this study uses local temperature control to introduce high-precision phase shifts into the FBG to assist the MPSFBG in achieving a phase-shift amount and position precision of 0.0007π and 30 μm, respectively (Fig. 9 and Fig. 10). This precision meets the phase-shift precision required by the MPSFBG in the theoretical analysis to obtain the narrow band flat-top filter response with small insertion loss and good rectangularity. In addition, this phase-shift erasing is possible because the phase shifts introduced by it do not permanently change the structure of the FBG, providing an efficient and economical method for fabricating the MPSFBG. The frequency response of the dual-phase-shifted FBG filter fabricated using this method is consistent with the theoretical fitting result under ideal conditions, and the insertion loss of about 0.5 dB, 3 dB bandwidth of about 366 MHz, 20 dB bandwidth of about 972 MHz, and shape factor of about 0.38 are realized (Fig. 11).Conclusions In this study, a method for fabricating an MPSFBG filter using high-precision phase-shift control technology based on local temperature control is presented. First, in the theoretical part of this study, the effect of the amount and position errors of the phase shifts on the insertion loss, bandwidth, and shape factor of the MPSFBG filter is analyzed. The amount precision (0.0029π) and position precision (368 μm) requirements of the phase shifts are obtained for the MPSFBG achieving the narrow band flat-top filter response with low insertion loss and good rectangularity. The experimental part confirmed the feasibility of using local temperature control to introduce the high-precision phase shifts (phase-shift amount precision is 0.0007π, phase-shift position precision is 30 μm). Finally, the MPSFBG is fabricated using this method, and its optical spectrum is tested and theoretically simulated. The results show that the frequency response of the MPSFBG filter fabricated using this method is close to the ideal filter characteristics from the theoretical simulation, and insertion loss of about 0.5 dB, 3 dB bandwidth of about 366 MHz, 20 dB bandwidth of about 972 MHz, and the shape factor of about 0.38 are realized. The method proposed in this study for fabricating the MPSFBG is accurate, simple, and economical. Moreover, the phase shifts generated using this method do not result in permanent changes to the structure of the FBG; thus, it is erasable, which can be used to fabricate the new tunable fiber filters.
Jul. 30, 2021Vol. 48 Issue 16 1606001 (2021)
Zhonghui Yao, Hongmei Chen, Tuo Wang, Cheng Jiang, and Ziyang Zhang
Objective 1.3-μm GaAs-based Ⅲ--Ⅴ quantum dot (QD) lasers have several advantages over commercial lasers of InP-based Ⅲ--Ⅴ quantum well lasers, such as low threshold current density, high quantum efficiency, high-temperature insensitivity, high optical feedback tolerance, and larger modulation bandwidth owing to the three-dimensional quantum confinement effect of carriers. This has made the 1.3-μm GaAs-based QD laser a very promising candidate as a light source for next-generation low-power-consumption, low-cost, small-footprint, and high-speed fiber-optical communication systems. However, the closely spaced energy levels of the confined holes and In-Ga interdiffusion during epitaxial growth for practical QD laser structures make the performance of current devices still far short of expectations. In addition, for high-speed lasers, a short cavity length is crucial because of the significantly reduced photon lifetime, but there is always a trade-off between cavity length and the saturation modal gain. In recent years, introducing p-doping in the active region to optimize the properties of QD materials has attracted extensive interest. p-Doping in Ⅲ--Ⅴ QD structures to compensate the thermal escape of carriers leads to better thermal stability. Modulation p-doping can significantly inhibit Ga vacancy propagation, leading to smaller interdiffusion and a reduced intermixing effect. In 2010, the ground state 25 Gbit/s operation of a 1.3 μm p-doped QD laser was first reported by Tanaka et al. Recently, a 15 Gbit/s high-speed 1.3 μm modulation p-doped QD laser has been demonstrated in a 500 μm long QD laser by Arsenijevic' et al. In this work, we further optimize the performance of QD lasers using subtle epitaxial growth and careful structure design.Methods The InAs/GaAs multiple QD layer structures were grown using molecular beam epitaxy (MBE) on Si-doped GaAs(100) substrates. The QD active region consists of eight stacks of QD layers separated by 33 nm GaAs spacers (Fig. 1). Each QD layer comprises 2.7 monolayer InAs covered with a 6 nm InGaAs strain-reducing layer, and the active layers were sandwiched between the ≈2800 nm n-type Al0.3Ga0.7As lower-cladding layer and ≈1800 nm p-type Al0.3Ga0.7As upper-cladding layer. The p-doped QD sample was grown sequentially with identical structures, and the modulation p-doping was performed with Be in a 6 nm layer located in the GaAs spacer layer 10 nm beneath each InAs/InGaAs QD layer to obtain a concentration of 3×10 17 cm -3. For the effective light excitation and photoluminescence (PL) signal collection, the upper p-side AlGaAs cladding layers were etched away using wet etching above the QD active regions. Ridge waveguide (3.5 μm ridge wide) lasers were fabricated using photolithography and dry-wet etching techniques. To prevent lasing from the first excited state of the QD, careful design and a facet-coating process were fully investigated. Finally, 1.3-μm ground state lasing has been found in p-doped InAs/GaAs QD lasers with a 300 μm ultrashort cavity length, which shows great potential in high-speed optical communication systems. Results and Discussions The PL peak wavelength of the p-doped sample is longer than that of the undoped sample (Fig. 4). The difference in the emission wavelengths between undoped and p-doped samples is caused by the higher temperature needed for the growth of the AlGaAs cladding layer, which is equivalent to a rapid thermal annealing (RTA) process. The QD samples underwent an annealing effect at the higher growth temperature, in which a strong interdiffusion between QDs and surrounding barrier layers occurred with intermixing for undoped sample, resulting in a remarkable blue-shift of the peak position. Introducing the modulation p-doping can significantly inhibit the Ga vacancy propagation, which leads to smaller interdiffusion and a reduced intermixing effect. To be more specific, we employ the scheme depicted to illustrate the role of p-doping in a microscopic view (Fig. 5). As the result of intermixing, the potential profile of the undoped sample is severely altered, while that of the doped sample almost maintains its original profile due to the intermixing inhibition by p-doping. The excess of holes around the QDs leads to two results: more holes residing in the QDs and enhanced capture of holes in the carrier dynamics. Based on the outstanding performance of p-doped QD samples, continuous-wave (CW) ground state lasing has been realized in a 300 μm ultrashort cavity length laser with facet-coating design (Fig. 7). A shorter cavity length can reduce the photon lifetime, which is of great importance to improve the modulation bandwidth of high-speed lasers.Conclusions In this work, undoped and p-type modulation doping eight-layer QD laser structures with 33 nm GaAs barriers were successfully fabricated using subtle epitaxial growth and careful structure design. By analyzing the PL spectrum, introducing p-doping can inhibit holes’ thermal broadening in their closely spaced energy levels and significantly suppress In/Ga interdiffusion between QDs and their surrounding matrix. Because of the superior features of the modulation p-doped QD materials, CW ground state lasing has been realized in p-doped QD lasers with a short cavity length (400 μm) without facet coatings. To prevent lasing from the first excited state of the QD, careful design and a facet-coating process were fully investigated. Finally, 1.3-μm GS lasing has been found in p-doped InAs/GaAs QD lasers with 300 μm ultrashort cavity length, which shows great potential in high-speed optical communication systems.
Aug. 06, 2021Vol. 48 Issue 16 1601001 (2021)
Bo Qu, Qi Liu, Sibo Wang, and Qiang Li
Objective Planar waveguide amplifiers have the advantages of slab and fiber ones and become an essential branch of the high average power solid-state lasers. Yd∶YAG planar waveguide amplifiers have the potential for higher output than Nd∶YAG due to the less generated heat and higher extraction efficiency under the same absorption pump power. The absorption cross-section of Yd∶YAG is smaller than Nd∶YAG; a higher doping concentration of the core and end-pumping must fully absorb the pump power. To maximize extraction efficiency, the doping concentration is significantly reduced due to self-absorption. To ensure that the pump power can be fully absorbed, extending the length of the core is necessary. However, the size of the core is limited by the process conditions. If the doping concentration is sufficiently small, the end-pumping cannot meet the absorption of pump power requirements. In this study, we design a multipass pumped planar waveguide with the low-doped Yd∶YAG core to prolong the pump absorption length. The amplifier using a multipass pumped planar waveguide shows higher pump absorption, better absorption uniformity, and higher optical-optical efficiency than the double-clad planar waveguide amplifier. We hope that the new structure can provide methods and ideas for designing and optimizing planar waveguide lasers.Methods Based on the theory of single-mode transmission and laser mode competition in the planar waveguide, the core and inner cladding of the planar waveguide are Yb∶YAG with a thickness of 0.2 mm and a doping concentration of 1% and Er∶YAG with a thickness of 0.5 mm and a doping concentration of 0.5%, respectively. The core and inner-claddings form the core area, which is 80.0 mm×16.0 mm×1.6 mm. YAG is bonded around the core area with a thickness of 1.2 mm. The outer-claddings of 1 mm cover the core and expansion areas, forming a double-cladding waveguide with the core area and a single-cladding waveguide with the expansion area. A multipass pumping ray path in the waveguide is formed through internal reflections on the waveguide surfaces. Symmetrical double-end pumped and single-pass power extraction configurations are adopted for laser amplification. Based on the Yb 3+ laser kinetics model, we develop a three-dimensional (3D) laser amplification model using ray tracing and finite element methods. We use the model to simulate double-clad planar waveguide and multipass pumped planar waveguide amplifiers. Besides, we compare their pump absorption and amplification extraction characteristics under 10 kW pump power and 200 W-injected seed power. The temperature distribution is simulated based on the results from the laser magnification model. Results and Discussions Compared with a double-clad planar waveguide amplifier, a multipass pumped planar waveguide amplifier exhibits higher output power and optical-optical efficiency (Fig.9). The simulation results using the laser amplification model show that the planar waveguide core absorption coefficient is 0.24 cm -1, which is 77.3% lower than the passive absorption coefficient, strongly affected by nonlinear absorption (Fig.11). The pump absorption decreases with a decrease in the absorption coefficient. The multipass pump absorption efficiency is still above 90% due to an increase in the absorption length (Table 2). The absorption power density distribution of the core simulated by the laser amplification model is different from that of the passive absorption coefficient model, which is caused by considering the effects of the laser and pump intensities on pump absorption (Fig.12). Because of better pump absorption uniformity, although the absorbed power increases, the maximum temperature does not increase significantly. However, the temperature distribution in the width direction is asymmetric, which may cause low actual beam quality (Fig.13). The maximum thermal stress of core is only 18.5% of the safety limit, which is lower than that in the double-clad planar waveguide amplifier (Table.3). The extraction efficiency of the multi-channel pump is higher (Fig.16) since the high pump intensity is preferred to extract the absorbed power (Fig.15). Conclusions A noble planar waveguide is designed for a high-power planar waveguide laser amplifier with the low-doped Yd∶YAG core. multipass pumping of the core is achieved through bonding YAG around the core area and high reflection coating on reflective surfaces. The geometric of the waveguide is reshaped and optimized to improve pump absorption and uniformity. The double-clad planar waveguide amplifier and multipass pumped planar waveguide amplifier are simulated using a 3D laser amplification simulation model combining the ray tracing and finite element methods. When the pump power is 10 kW, the optical-optical efficiency of the multipass pumped planar waveguide and double-clad planar waveguide amplifier becomes saturated with 200 W of injected seed. When the injected seed is 200 W, the multipass pumped planar waveguide threshold pump power becomes 500 W, which is almost the same as the double-clad planar waveguide amplifier. However, the slope and optical-optical efficiencies are higher than those of the double-clad planar waveguide amplifier. When the injected seed is 200 W, and the pump power is 10 kW, the absorption power density distribution simulated using the laser amplification model significantly differs from that of the passive absorption coefficient model. The simulation results using the laser amplification model showed that in the multipass pumped planar waveguide amplifier, the pump absorption efficiency is 93.3%, the output power is 7311 W, and the optical-optical efficiency is 71.1%. It is significantly higher than that of the double-clad planar waveguide amplifier. The multipass pumped planar waveguide amplifier shows better pump absorption uniformity and a smaller risk of thermal damage.
Aug. 06, 2021Vol. 48 Issue 16 1601002 (2021)
Da Wei, Ting Feng, Fengping Yan, Zeyuan Ma, and Xiaotian Yao
Objective Fourier-domain mode locking (FDML) is a new type of optical spectrum modulation technique that outputs a narrow linewidth continuous frequency-swept (or wavelength-swept) laser, which differs from the traditional intensity modulation mode-locking technique. By appropriately controlling the relationship between the scanning speed of the tunable optical filter and the length of the laser cavity, an FDML frequency-swept laser can achieve stable simultaneous oscillation of all longitudinal modes inside the cavity within the filter scanning range, consequently achieving an ultrahigh-speed frequency sweep. Most reported FDML frequency-swept fiber lasers (FSFLs) are fabricated using semiconductor optical amplifiers, which can provide a broad wavelength-swept range but exhibit a relatively wide instantaneous linewidth. The long energy-level lifetime and homogeneous broadening gain effect of rare-earth ions doped silica glass achieve strong wavelength-dependent characteristic, which are expected to realize the narrow instantaneous linewidth of an FDML FSFL. However, FDML FSFLs based on the rare-earth-doped fibers have rarely been reported. Additionally, although many reports can be found in the literatures, no study comprehensively evaluates the theory and mechanism analysis, design, construction, and performance characterization of FDML FSFLs. Therefore, proposing a set of comprehensive study methods on FDML FSFLs is crucial. Considering FDML FSFLs based on erbium-doped fibers (EDF) as an example, we systematically demonstrated the theoretical and experimental research processes on FDML FSFLs and achieved a high-quality frequency-swept laser output using the EDF laser (EDFL). To the best of our knowledge, this is the first such study to date.Methods The basic theoretical operating principle of the FDML technique and the influence of laser cavity length matching and dispersion management on the performance of FDML FSFLs were analyzed. The operating characteristics of several common optical filters were introduced, and the high-frequency operating capability of the fiber Fabry-Pérot tunable filter (FFP-TF) was studied (Fig. 2). Moreover, the advantages of EDFs as the gain medium of FDML FSFLs are examined. An FDML frequency-swept EDFL based on a ring cavity configuration was designed and fabricated (Fig. 3) with an FFP-TF as the FDML scanning optical filter, and the electro-optic modulator-based time-gating technique was used to characterize the frequency-swept laser output.Results and Discussions The characteristics of the proposed FDML FSFL were experimentally studied in detail, including the mode-locking wavelength range, single-direction frequency sweeping, dispersion, filter driving frequency deviation, and laser instantaneous linewidth. We found that the gain level of EDF directly affects the wavelength sweeping range (Fig. 4).Further, the overall spectral power distributions for forward and backward frequency sweeps differ owing to the nonlinearity of the delay fiber (Fig. 5). A greater pure dispersion in the laser cavity induces a higher sensitivity of the output power to the FFP-TF’s driving frequency deviation (Fig. 6). Moreover, a larger FFP-TF’s driving frequency deviation induces a higher broadening effect of the swept laser’s instantaneous linewidth (Fig. 8). Therefore, to obtain the best operating condition of the proposed FDML FSFL, an EDF with high luminous efficiency should be selected as the gain medium, either a delay fiber with low nonlinearity and zero dispersion should be selected or a laser cavity with zero dispersion should be designed, and the driving frequency of the FFP-TF should be fixed exactly at the base oscillating frequency of the fiber laser.Conclusions Considering the EDFL as an example, the theoretical and experimental research on FDML FSFLs is systematically demonstrated for the first time. On the one hand, the theory, principle, and method for matching the length of the laser cavity and the scanning rate of the tunable filter, intracavity dispersion management, performance characterization of tunable filter, analysis of laser gain medium, and system design of the FDML FSFL are studied in detail. On the other hand, the maximum wavelength sweeping range of the FDML mechanism using EDF as the gain, the performance of single-direction frequency sweeping, the influence of different delay fibers and FFP-TF’s driving frequency deviation on the laser output power, and the effect of the driving frequency deviation on the laser’s instantaneous linewidth for different sweeping directions of the FDML swept laser are experimentally studied and discussed. Consequently, for the first time, an FDML frequency-swept EDFL is realized with the scanning range, optical signal-to-noise ratio, scanning rate, and instantaneous linewidth of 3.072 nm, 57.31 dB, 62.918 kHz, and 4.28 GHz, respectively. In the future, we will focus on the development of large-mode-area high-gain fibers and ultranarrow-band high-speed scanning filters, as well as on the study of more efficient scanning mechanisms. Our work emphasizes the research method and combines the theoretical and experimental findings. This work is expected to provide guidance, particularly to researchers initially studying FDML frequency/wavelength-swept lasers.
Jul. 30, 2021Vol. 48 Issue 16 1601003 (2021)
Dongsheng Liu, Jinchuan Wang, Liu Xu, Jialin Du, Ping He, Liang Tan, Yanan Wang, Dan Wang, Juntao Wang, Tangjian Zhou, Jianli Shang, and Qingsong Gao
Objective Diode-pumped solid-state laser(DPSSL)has a large energy compact structure, high efficiency, and good stability, which possesses outstanding application value and prospects in scientific research, military, industrial processing, and other fields. DPSSL has achieved rapid development in the past 10 years. The efficiency of high average-power solid-state laser has been the development direction of solid-state lasers. The planar waveguide gain medium can satisfy the high injected laser and high pump laser intensities. Thus, the planar waveguide laser is one of the potential laser technologies for obtaining high optical-optical efficiency and high average-power output. In this study, a quasi-continuous long pulse width Yb∶YAG planar waveguide laser amplifier at room temperature with a wavelength of 1030 nm was constructed and the factors affecting the optical-optical conversion efficiency were analyzed. We hope that this study will help improve the optical-optical conversion efficiency of high-power solid-state lasers.Methods The experiment is based on a planar waveguide gain medium. First, the theoretical model of laser dynamics based on Yb∶YAG was developed. The effects of the injected laser intensity, pump laser intensity, and pump pulse width on the optical-optical conversion efficiency were analyzed through computer simulation. Then, a quasi-continuous long pulse width Yb∶YAG planar waveguide laser amplifier at room temperature with a wavelength of 1030 nm was constructed. Next, the output energy of the amplifier was tested to verify the correctness of the theoretical model. The laser amplifier was operated at different pulse repetition frequencies. In addition, the beam quality of the output laser was measured using a beam quality analyzer, and spectra of the output laser were analyzed using a spectrograph.Results and Discussions The simulation results show that the higher the seed laser power, the earlier it enters the steady-state extraction. The higher the injected laser intensity, the higher the optical efficiency of the steady-state and optical-optical efficiency of the pulse. However, the increase in steady-state optical-optical efficiency decreases gradually (Table 1). With an increase in pump power, the steady-state optical-optical efficiency increases and remains stable. Due to the shortening of power rise time, the optical-optical efficiency of the single pulse increases (Table 2). The output power of the pulse width of 500 μs and output power pulse width of 1 ms are identical in the first 500 μs, indicating that the pump pulse width does not affect the time to reach a steady-state (Fig. 6). The time to reach a steady-state is decided by the pump and injection intensities. The pump pulse width is longer, proportion of the time to reach a steady-state in the entire pulse width is smaller, and pulse optical-optical efficiency approaches the steady-state optical-optical efficiency. The theoretical calculation results show that the output energy is 4.96 J and optical efficiency of monopulse is 46.8%, when pulse width is 500 μs. The experimental result shows that the output energy is 4.67 J and optical-optical efficiency is 44.0% (Fig. 7), which is consistent with the theoretical calculation result. The single pulse energy of the laser is not affected by pulse repetition frequency. Thus, the average output power can be linearly increased by increasing the repetition frequency. With the average output power increasing, the beam quality of the output laser gets worse in the Y direction (Figs. 8--10). The amplified output laser has the same central wavelength as the seed laser, but the linewidth is slightly compressed (Fig. 11).Conclusions In this study, a quasi-continuous long pulse width Yb∶YAG planar waveguide laser amplifier at room temperature with a wavelength of 1030 nm is constructed. The effects of injected laser intensity, pump laser intensity, and pump pulse width on the optical-optical conversion efficiency are analyzed. The master oscillator power amplifier is adopted, and the seeder is maintained at a polarization of 1030 nm fiber laser. The gain medium of the amplifier is a Yb∶YAG planar waveguide, and the pump sources are two quasi-continuous 940 nm laser diode arrays. After shaping, the pump light is coupled into the planar waveguide from the two end facets. With dual end pumping, we obtain the laser amplification output with a maximum energy of 4.65 J when the pump repetition frequency is 400 Hz, and the maximum peak pump power is 20.4 kW. The polarization degree is 97%, and the optical-optical conversion efficiency is 44.0%, which is consistent with the theoretical calculation.
Jul. 30, 2021Vol. 48 Issue 16 1601004 (2021)
Zhenguang Li, Yinping Dou, Zhuo Xie, Haijian Wang, Xiaowei Song, and Jingquan Lin
Objective Extreme ultraviolet (EUV) radiation plays significant roles in various field applications, such as microscopy imaging, material analysis, and EUV lithography. In particular, EUV lithography is an important technology for manufacturing integrated circuits with a feature size less than 7 nm. Compared with the fuel materials of Li and Xe for EUV radiation, the tin (Sn) plasma EUV radiation has purity, broadband spectra, and high conversion efficiency at 13.5 nm. In addition, the EUV radiation with 2% bandwidth centered at 13.5 nm wavelength can be reflected by Mo and Si multilayer optical devices. The above features make the 13.5 nm EUV radiation of Sn become the source of the EUV lithography system. In practical EUV lithography applications, the Sn droplet target is selected as the source for lithography. However, the difficulties in experiment and complexity are expected when Sn droplet EUV radiation is generated. For simply studying the conversion efficiency of Sn droplet EUV radiation, we can use the metal target to replace the droplet target. In this study, we report the 13.5 nm EUV radiation from laser-produced plasma on the structured target can optimize the conversion efficiency. To the best of our knowledge, no studies have been reported on the effect of spatial constraints on EUV radiation in Sn droplet targets. This work may be helpful for further research on optimizing droplet targets to obtain higher EUV conversion efficiency.Methods The EUV spectra from plasma are created by an 800 mJ, 10 ns full width at half maximum, and 1064 nm Nd∶YAG laser pulse. The groove structured Sn target is fabricated by laser ablation. The width and depth of various grooves are obtained by adjusting the ablation area and times, respectively. The target is controlled by a translating stage to ensure that each laser pulse can radiate in a fresh position. The laser is focused onto the structured target by a plano-concave lens with a focal length of 400 mm. The laser focal spot diameter is changed by moving the distance between the lens and the target surface. The EUV spectra are measured by a flat-field spectrometer with a charge-coupled device (CCD) camera, which is placed at 45° with respect to the direction of the incident laser beam. Two digital delay generators are employed to control the delay time between the laser pulse and the CCD camera.Results and Discussions The EUV in-band radiation (2% bandwidth centered at 13.5 nm) from the structured targets is found to be stronger than that from the planar targets. Results show that the enhanced EUV radiation can be obtained due to the plasma expansion restricted by the grooved wall. First, when fixing the groove width, the intensity of in-band radiation at 13.5 nm (2% bandwidth) increases and then drops with increasing groove depth from 50 μm to 200 μm. The optimal groove depth for EUV emission around 13.5 nm is 100 μm. However, when the depth of the groove is larger than 100 μm, part of the EUV radiation is blocked by the wall of the groove. However, when the groove depth is less than 100 μm, the confinement effect of the grooved wall is relatively small (Fig. 2). In addition, the laser energy that corresponds to the highest EUV in-band radiation enhancement is found to be 500 mJ for different groove depths when fixing the groove width at 300 μm. It means that the optimal laser energy may be influenced by the groove width, rather than the groove depth (Fig. 3). Moreover, when fixing the groove depth of 100 μm and the laser energy of 500 mJ, the highest EUV in-band radiation intensity is obtained with the optimal groove width of 300 μm for different groove widths. This attributes that the groove width is larger than 300 μm, and that the confinement effect from the grooved wall is reduced. When the groove width is less than 300 μm, the part of the laser energy cannot be coupled into the groove and interact with the target (Fig. 4). When the groove depth is fixed at 100 μm, the laser energies that correspond to the highest enhancement of the EUV in-band radiation are varied with different groove widths. Meanwhile, the optimal laser energy increases as the groove width increases. It means that the groove width is related to the laser energy (Fig. 5). However, when the focal spot diameter is close to the optimal groove width of 300 μm, the highest in-band radiation enhancement is obtained.Conclusions In this study, EUV radiation emitted by laser-produced plasma from a structured target is conducted. The results show that the laser energy that corresponds to the optimal in-band intensity of 13.5 nm (2% bandwidth) is 500 mJ, regardless of the groove depth when the groove width is fixed at 300 μm. In addition, the in-band EUV radiation with the groove depth of 100 μm is stronger than that in the other cases. Further, when the groove depth is fixed at 100 μm, for different groove widths, the highest EUV in-band radiation intensity depends on the laser energy. Meanwhile, the optimal laser energy increases as groove width increases. This phenomenon illustrates that the groove wall can effectively restrict plasma expansion. This confinement effect can enhance the EUV radiation. However, the highest in-band EUV radiation is obtained when the focal spot diameter is close to the groove width of 300 μm. In summary, a 1.57-fold enhancement of the in-band EUV emission is obtained using the structured Sn target with 100 μm depth and 300 μm width when the laser energy is 500 mJ. This study is of great significance to improve the EUV radiation intensity and conversion efficiency.
Jul. 30, 2021Vol. 48 Issue 16 1601005 (2021)
Shuzhen Cui, Xin Zeng, Xin Cheng, Xuezong Yang, and Yan Feng
Objective Compact, high-power, low-cost yellow lasers at ~589 nm have potential in dermatological applications. There is no solid-state gain medium that can directly lase at 589 nm, so nonlinear frequency conversion of near-infrared laser is an indispensable technology. The yellow solid laser is usually generated by sum mixing from two Nd∶YAG lasers at 1064 nm and 1319 nm, which the multiple-cavity systems are too complex to use. Yb-doped silica fiber has gain at 1178 nm, but lasing at this wavelength is difficult. So, the Raman fiber laser and amplifier are known for their unique advantage of flexibility in wavelength. The common frequency doubling method employs an external enhancement cavity to achieve high-efficiency and high-power frequency doubling. Nevertheless, it adds complexity to the laser system. In this article, we report a compact, low-cost, high-power, narrow-linewidth yellow laser by single-pass frequency doubling of a cascaded Raman fiber laser in a periodically poled MgO-doped near-stoichiometric LiTaO3 crystal (PPSLT). Up to 10.19-W 589-nm laser is obtained with a conversion efficiency of 18.12%, which is limited by the fundamental laser linewidth. To the best of our knowledge, this laser system has the simplest structure, is the easiest to operate, and is the most suitable for commercial use.Methods The experimental configuration of the yellow fiber-based laser is shown in Fig. 1, including three functionally different parts—a 1070 nm fiber laser used as a Raman pump source, a cascaded Raman fiber laser, and a single-pass frequency doubling device. The 1070-nm source is a conventional fiber Bragg grating (FBG)-based fiber oscillator. The gain fiber is 10/125-μm polarization-maintaining (PM) Yb-doped fiber (YDF). Using one 1070/1120-nm wavelength division multiplexing (WDM), the generated 1070 nm laser is coupled into the cascaded Raman oscillator, which comprised PM980 gain fiber and two pairs of FBGs with wavelengths of 1120 nm and 1178 nm, respectively. The 1120 nm FBG had a high reflection, which could improve the conversion efficiency from 1120 to 1178 nm. This structure reduced the length of the gain fiber and improved the conversion efficiency. The collimated 1178 nm fiber laser output is optically isolated and focused to incident on a periodically poled MgO-doped near-stoichiometric LiTaO3 crystal (PPSLT). The diameter of the 1178 nm output laser is ~1.3 mm. The length of PPSLT is 20 mm, and the end faces are coated to low reflectivity (RT>95%) and highly reflective at 1178 nm (R>99.5%).Results and Discussions The CW 1070 nm output power and conversion efficiency are considered as functions of diode pump power. When the diode pump power reaches 209 W, the 1070 nm output power is scaled to 122 W, corresponding to ~58% optical-optical conversion efficiency [Fig. 2 (a)]. The 1070 nm fiber laser is injected into cascaded Raman oscillation cavities. The maximum output power of 1178 nm laser is scaled to 56.23 W [Fig. 2 (b)]. The central wavelength of the 1178 nm laser is almost the same at different output powers. The 3 dB linewidth of the 1178 nm laser increases with power from 0.04 to 0.38 nm [Fig. 3 (b)], which means the proportion of fundamental light that can be effectively converted is decreasing. The second-harmonic power and second-harmonic generation (SHG) efficiency are considered as functions of the fundamental power at the optimum phase-matching temperature (Fig. 4). When the fundamental power reaches 56.23 W, the maximum SHG output power is 10.19 W, corresponding to a conversion efficiency of 18.12%. The stability of 589 nm laser power measured during 1 h is shown in Fig. 5. Since the fundamental laser is generated with a single-mode fiber and the frequency doubling is achieved with a PPSLT crystal, near-diffraction-limited beam quality is expected (Fig. 6).Conclusions A 589 nm yellow laser is developed by single-pass frequency doubling of a linearly-polarized narrow-linewidth 1178 nm cascaded Raman fiber laser in a PPSLT. A high-power cladding-pumped Yb-doped 1070 nm fiber laser is built as a Raman pump source. The cascaded Raman process is implemented by 1120- and 1178-nm Raman oscillators. WDM is used in the setup to couple the input pump light and filter the reflected Raman light. Up to 10.19 W continuous-wave 589-nm laser is obtained with a conversion efficiency of 18.12%. The wavelength flexible cascaded Raman fiber laser combined with the single-pass frequency doubling device has advantages of small volume, low cost, good robust performance, and easy operation, which are suitable for use in the medical field.
Aug. 02, 2021Vol. 48 Issue 16 1601006 (2021)
Mengbing Xu, Youmei Han, Liuzhao Wang, Panke Zhang, Dongming Liu, and Jinghua Yang
Objective The safety of pavement manhole covers is crucial in urban development. The timely and accurate detection of manhole cover disease can save maintenance costs, reduce road hazards, and ensure driving safety. Traditional methods for surveying and mapping manhole covers mainly use manual measurements, which usually require considerable human and material resources. Moreover, such measurements have a low operating efficiency and poor safety, which is not conducive for the rapid update of data. Therefore, new, efficient, and automated methods and techniques are urgently required for the manhole cover measurement and disease detection. Currently, methods for manhole cover extraction and disease detection mainly include the differential polar method, ellipse feature-based fitting algorithm, and image feature detection method. These methods exhibit low robustness. Moreover, the direct image detection methods are affected by the image quality and illumination. It is difficult to obtain information about manhole cover diseases using such methods. This study develops a technical process involving the original point cloud and the manhole cover extraction and disease detection using vehicle-borne laser point cloud data. Based on the intensity image combined with the improved Hough algorithm for achieving the accurate road manhole cover position and disease information, the experimental results show a good robustness and stability of the proposed method. We hope that the proposed technical solution can help the city management department in inspecting and maintaining manhole covers to effectively improve the extraction efficiency and operation safety of manhole covers.Methods First, based on the high-precision vehicle-borne laser point cloud data, accurate ground point cloud data were obtained using a combined filtering algorithm of the point cloud gradient and cloth simulation. They eliminate the influence of invalid features on the manhole cover extraction. Second, the intensity orthographic method was used to generate high-resolution intensity images of the ground points. Moreover, the manhole cover was binarized using the adaptive threshold method to increase the edge display effect of the road manhole cover. Then, according to the shape and position characteristics of the manhole cover circle, the edge was detected based on the image binarization segmentation result. Further, the location of the manhole cover circle was divided into potential manhole cover object detection and a real manhole cover using the Hough circle detection algorithm, which strictly limits the curvature and edge accumulation threshold. Finally, using the two processes of object detection, the precise extraction of the manhole cover position was achieved. Next, the disease information of the manhole cover was obtained by calculating the elevation value of the adjacent point cloud within a certain distance between the manhole cover position and the surrounding area. Finally, a high-precision GPS-RTK and DS3 level comparison experiment was performed to evaluate the stability and reliability of the proposed algorithm.Results and Discussions Regarding the road surface properties of the manhole cover position, this study first proposes the combined filtering method of the point cloud gradient and cloth simulation. The latter performs secondary filtering to retain and optimize the ground point results of gradient filtering for invalid floating data elimination. Several data tests were used to obtain the accurate ground point cloud results (Fig.12). Because the intensity image contains considerable noise and requires a large number of Hough calculations, the accurate position of the manhole cover circle is obtained by detecting the edge contour (Fig.13) and setting the appropriate curvature and edge accumulation threshold in the improved Hough circle detection algorithm. Combined with the actual vehicle-borne laser point cloud experimental study, the accuracy and precision of manhole cover extraction reach 84% and 98%, respectively. Additionally, the manhole cover extraction efficiency is significantly improved and the vectorization result of the manhole cover extraction can be displayed in the real point cloud coordinates (Fig.14). Furthermore, the accuracy experimental results show the robustness and reliability of the manhole cover extraction plane position (Table 2) and settlement disease detection results (Table 3).Conclusions In this study, in view of the difficulty and low efficiency of traditional road manhole cover measurements, the vehicle-borne laser point cloud data are directly used to achieve the precise manhole cover position and disease detection. First, a combined filtering algorithm of the point cloud gradient and cloth simulation is proposed to obtain the high-precision ground point data and generate intensity images. Then, this technique was combined with the adaptive threshold binarization method to obtain the high-discrimination manhole cover edge contour using the improved Hough circle detection algorithm. The manhole cover is approximately positioned within the circle curvature limit, and the accurate position is achieved using the edge accumulation threshold based on the previous step. Finally, the position parameters and disease information of the manhole cover are obtained. Combined with field experiment data verification, the accuracy and precision rate of manhole cover extraction of the proposed method reach 84% and 98%, respectively, greatly improving the manhole cover disease detection efficiency and operation safety compared with traditional methods. Combined with the precision analysis of the same name detection points, the manhole cover extraction results of the proposed scheme show high accuracy and the data results can meet the requirements of related projects. The technical scheme and experimental results of this research show the effectiveness and reliability of the vehicle-borne laser point cloud used in manhole cover extraction and disease detection and provide new ideas for urban intelligent management.
Aug. 02, 2021Vol. 48 Issue 16 1604001 (2021)
Qiqi Li, Xianghong Hua, Bufan Zhao, Wuyong Tao, and Cheng Li
Objective With the rapid development of virtual reality technology, indoor navigation technology, and indoor positioning technology, the extraction and modeling of indoor 3D point cloud objects have become a research hotspot. Under normal circumstances, an indoor scene is quite complex, and the point cloud data obtained by scanning is usually cluttered. There are many objects and occlusions, and automatic modeling cannot be carried out. It is necessary to segment a complex indoor point cloud into simple geometric primitives to perform modeling. Because there are several plane structures in indoor scenes, such as walls and ground, plane segmentation for indoor scene point cloud is a crucial part of segmentation for indoor scene point clouds. Owing to the complexity and bulkiness of indoor scene point clouds, traditional random sample consensus (RANSAC) and 3D Hough transform methods are complex and inefficient in the process of plane segmentation for indoor scene point clouds. In this article, we propose a new method for plane segmentation of indoor scene point clouds. Compared with existing methods, this method has a great improvement in time efficiency and is more suitable for plane segmentation for indoor scene point clouds.Methods In this article, a new plane segmentation method based on projection length point cloud layering and mean shift (MS) normal vector constraint is proposed. First, the method estimates the normal vector of the point cloud by the principal component analysis method, combines the coordinates of the point cloud to obtain the projection length, and then layers the point cloud according to the projection length by a certain step. Afterward, it takes the current maximum stratified point cloud for normal vector constraint based on the MS method to get the point cloud with the most concentrated normal vector. Next, it uses the remaining points to perform RANSAC and least squares plane fitting to obtain the plane parameters and then removes the point cloud contained in the current plane model by a certain thickness threshold. The above steps are repeated to obtain the parameters of all planes until the number of plane points extracted is less than a certain value. Finally, the model point clouds are extracted from the original point cloud based on the obtained plane parameters, and after the model optimization that includes planes merging, error point reclassification, and irrelevant point elimination, the final plane segmentation result is obtained.Results and Discussions In this article, a new concept of projection length of point cloud is proposed that is used to segment the plane of point cloud in an indoor scene (Fig. 2). The indoor point cloud is layered on the basis of the projection length, and the resultant point cloud number histogram can initially reflect the number of planes and distance distribution in the scene (Fig. 4). The projection lengths of the planes calculated from the resulting plane parameter fall in the peak or adjacent interval in the resultant point cloud number histogram (Table 2). After the point cloud layering based on the projection length, most points in the maximum layer come from the same target plane, and there are only a small number of irrelevant points. After MS clustering, the remaining points are all from the target plane, which is convenient for plane fitting (Fig. 5). The proposed method can completely segment the plane structure of indoor scenes, including walls, ceiling, floor, and desktop. Meanwhile, other irrelevant structures, such as potted plants, chairs, and door frames, are removed in the segmentation process (Figs. 7 and 8). The distances between the obtained plane models are very close to the actual measured distances; the difference is in the millimeter level (Table 3). The deflection angles between the planes obtained in this study, and the planes obtained by single-point measurement are all within 0.2° (Table 4). Compared with the maximum likelihood sample consensus method and improved 3D Hough transform method, the proposed method is obviously better in terms of total time consumption (Table 5).Conclusions In this article, we propose a new method of plane segmentation for indoor scene point cloud. Through the point cloud layering based on projection length and normal vector constraint based on MS, the proposed method can quickly obtain points from a single plane, thereby achieving plane fitting and segmentation rapidly and then gets the final result after model optimization. Experiments show that the proposed method can effectively segment the plane structure in the indoor scene point cloud, and the model optimization can avoid over-segmentation and remove irrelevant points. Simultaneously, the experiment proves that the segmentation result of the proposed method has higher accuracy and meets the requirements of later modeling. In addition, compared with two improved classical methods for point cloud segmentation, the proposed method is time efficient and is suitable for segmentation for a large number of point clouds.
Aug. 06, 2021Vol. 48 Issue 16 1604002 (2021)
Yan Liang, Youjian Yi, Ping Zhu, Dongjun Zhang, Zhan Li, Xinglong Xie, Jun Kang, Qingwei Yang, Meizhi Sun, Xiao Liang, Haidong Zhu, Ailin Guo, Qi Gao, Xiaoping Ouyang, Donghui Zhang, Linjun Li, and Jianqiang Zhu
Objective In the past 20 years, ultra-short ultra-intense laser technology has experienced rapid development. However, the maximum output power of these lasers is limited by nonlinear effects, large diameter compression grating technology, gain bandwidth limitations, and other factors. One of the most promising technologies to further enhance output ability is coherent beam combining. Effective coherent beam combining requires strict inter-beam synchronization. In recent years, many attempts have been made to improve synchronous measurement and control. The research progress of most implementations has been solely based on photoelectric detection, optical balanced cross-correlation, and temporal and spatial interferences. Nevertheless, these methods need to maintain the time interval of the two beams in coherent time, limiting the femtosecond pulse synchronous measurement range within 1 ps. The ability of an electronic oscilloscope to achieve a time resolution less than 10 ps is difficult; therefore, it is more difficult to accurately measure the pulse delay within 1--10 ps. In addition, for online synchronous measurement of a multichannel ultra-short pulse coherent beam combining system, the abovementioned methods are more complicated to implement and cannot achieve a single-shot measurement. In this paper, a single-shot measurement method for a multichannel ultra-short pulse with large dynamic range time synchronization based on all-fiber spectral interference is proposed. This method has a wider measurement range to measure synchronization than the nonlinear correlation method and a larger measurement accuracy than an oscilloscope. Our method improves efficiency in multichannel laser synchronous measurements for engineering applications and has important application potential for multichannel ultra-short pulse laser coherent beam combining systems.Methods First, theoretical and simulation analyses based on multichannel optical fiber array spectral interferometry were carried out. Predictions of τmin and τmax for the designated measurement range were made according to Equation (6). Considering the purpose of synchronous measurements, this study created the concept of fixed time offset. The beneficial effect of this concept is that through the comparison of measured values and fixed offset time, we can determine the absolute time difference between the referenced light and the light to be measured. Moreover, with a fixed offset time, when the measured values were equal to the fixed offset times introduced by optical delay lines on the referenced light fiber paths, the two pulses reached a zero-synchronization state. In our experiment, the feasibility of the single-shot multichannel synchronous measurement method was verified. The experimental optical path was built using the path of a four-channel pulse synchronous measurement as an example (Fig.3). The three formed interference signals and one beam of reference light were input to the imaging spectrometer using a multipath fiber buncher.Results and Discussions The spectrogram in the experiments is recorded by an imaging spectrometer, which indicates that the spectrometer has the ability to record 20 signals (Fig.4). The delay, τ, between the reference and measured beams is obtained through the data processing method described in Section 2.1. This method illustrates that τmax is equal to 14.751 ps and τmin is equal to 1.055 ps, which determine the measurable range (Fig. 5). From experimental results, the range that can be measured is slightly less than the theoretical interval, mainly due to airflow disturbances, mechanical vibration, and dark current noise from the spectrometer. For measurement precision of different offset points, the deviation of the statistical mean value of multiple measurement results is obtained from the present value. In Figure 6, it is shown that with the increase of temporal spacing (TS) between the two pulses, the β value decreases. When TS reaches 6.139 ps, the β value is at its minimum. When TS is greater than 6.139 ps, the β value increases continuously. The measured jitter, γ, is shown on the right vertical coordinate of Figure 6 and it shows the same trend as the β value (Fig.6). Measurement error is because of uncertainty of the wavelength or frequency spacing of the interference fringe in the spectrogram caused by noise. However, the degree of response of different fixed offset times to noise is different. Therefore, the measurement accuracy is varied at different fixed offset times.Conclusions This paper demonstrates that the single-shot synchronous measurement technique for a multichannel ultra-short pulse laser based on all-fiber spectral interference is feasible through simulation and experiment. The measuring range is determined by the spectral interference fringe spacing, and the theoretical simulation results show that a fixed time offset is beneficial for the realization of a zero-synchronization state measurement. The optimal solution of the offset time is obtained using experimental statistical results. Experimental data prove that setting the fixed time offset in the center of the measurable range area can improve measurement accuracy. The minimum time synchronization accuracy is 5.3 fs and the measurement range is 1.055--14.751 ps, which are in good agreement with results of the theoretical analysis. The all-fiber spectral interference synchronization measurement method combines the characteristics of spectral interference and optical fiber array in design. The advantages of the method are easy integration of an optical fiber path, fast processing speed of spectral interference data, and low-energy demand of signals. Our method can satisfy the ultra-short ultra-intense laser facility real-time and multichannel measurement diagnosis requirements. The method also makes up for a small measurement range and poor temporal resolution when measuring the synchronization state using the nonlinear correlation method and an oscilloscope, respectively. The complexity of the configuration and difficulty of a single-shot measurement in multichannel synchronous measurements are solved. Therefore, our method has important application prospects in multichannel ultra-short pulse laser coherent beam combining systems.
Aug. 02, 2021Vol. 48 Issue 16 1604003 (2021)
Le Wang, Yue Fang, Shengchun Wang, Hao Wang, Guoqing Li, Shengwei Ren, Peng Dai, and Qiaofeng Tan
Objective Line structured light profile measurement is an important technique for rail profile detection. Currently, simulation analysis is instrumental in the research of rail grinding mechanism and track structure dynamics. Optical simulation design software has also been subjected to considerable research in optical system design, simulation modeling, and error analysis. However, few reports have focused on the simulation modeling of the line laser rail profile measurement system. In view of this situation, a simulation model of the rail profile measurement system based on Zemax software is proposed. The proposed simulation model is of guiding significance for designing optical systems, selecting optical elements, and improving measurement accuracy. It can provide theoretical support for the accuracy improvement and reliability evaluation of the rail profile measurement system.Methods The rail profile measurement system is divided into image acquisition, system calibration, and profile measurement modules. The image acquisition module obtains the rail laser cross section image and mainly includes the line laser, lens, and camera. The system calibration module obtains the calibration parameters, i.e., the transformation relationship between the image plane in the pixel coordinate system and the measurement plane in the world coordinate system. The profile measurement module extracts the center pixel coordinates of the light stripe from the rail laser cross section image obtained using the image acquisition module. Then, it transforms the central pixel coordinates of the light stripe into the world coordinate system using the calibration data to determine the real rail profile. Based on the division of the system function modules, the system modeling process is divided into three steps (Fig. 3). In the first step, the image acquisition module is modeled (Fig. 8). First, the optical model of the main components is established in the Zemax non-sequential mode. Then, the system simulation model is established by combining the optical model of the components and optical structure parameters to ensure that the system simulation model has the image acquisition function. In the second step, the system calibration module is modeled based on the plane target calibration method (Fig. 10). The image acquisition module collects the calibration board images under different poses, and the system calibration parameters are calculated. In the third step, the profile measurement module simulates the rail profile measurement process (Fig. 12). The image acquisition module scans the rail at a certain sampling interval along the rail direction (extension direction) and obtains the rail laser cross-section image at equal intervals. The real rail profile is calculated using the rail laser cross section image; hence, the system simulation model has the profile measurement function (Fig. 9).Results and Discussions To comprehensively evaluate the measurement accuracy of the system simulation model, component accuracy verification, rail simulation measurement, and actual rail measurement experiments are performed (Figs. 15--17). Experimental results show that the root mean square error (0.049 mm) obtained using the system simulation model is close to the root mean square error (0.066 mm) obtained using the actual measurement device based on the 20 repeated measurement data of rail vertical wear (Table 5). The system simulation model achieves high accuracy, and the simulation measurement results are consistent with the actual situation, thus demonstrating that the simulation model can better simulate the rail profile measurement system.Conclusions A simulation model of the rail profile measurement system based on Zemax is proposed. The simulation model has image acquisition, system calibration, and profile measurement functions. The results show that the simulation model is consistent with the measurement results of the actual measurement system, and the simulation model can be used to simulate the rail profile measurement process using line structured light. The differences between the simulation model and the actual system are highlighted from different aspects, thus providing a reference for further improving the simulation model. The system simulation model can be used for analyzing related problems in the field of rail profile measurement, e.g., evaluating the impact of lasers on both sides of the rail that are not coplanar and generating rail surface defect samples using the system simulation model to solve the problem of a lack of negative samples in deep learning. Moreover, the system simulation model can be used for experimental verification and laboratory or field experiments can be performed simultaneously with system simulation experiments. The simulation data can not only verify the experimental results but also provide guidance for the experimental design. Finally, the system simulation model can be used to predict the results. Some tests unsuitable for field tests or parameters and cannot be well controlled can be performed using the simulation model, such as the vehicle body pose compensation test. The simulation model provides a new analysis method for studying rail profile measurements using line structured light and offers guiding significance for optical system design, optical element selection, and measurement accuracy improvement.
Jul. 22, 2021Vol. 48 Issue 16 1604004 (2021)
Shudan Yang, Peili Li, and Ruoyu Zhang
Objective Optical Tamm state (OTS) is a new type of surface-localized state, which can be excited at the interfaces between metal and distributed Bragg reflection (M-DBR) or between two photonic crystals. The electric fields of OTSs are localized at the interfaces and intensity of the electric fields decays because it is away from the interfaces. Compared with the traditional surface states, OTS has a high-intensity local mode and perfect absorption of incident electromagnetic wave and has a narrower linewidth, which can be excited by transverse electric (TE) and transverse magnetic (TM) polarized waves at a wide-angle range incidence. Researchers have conducted several studies on OTS, but the structural parameters are fixed. Besides, they do not have the tunability and cannot expand the application field. Thus, the emergence of tunable structures is an inevitable tendency. Graphene is a new type of two-dimensional (2D) carbon atom material with special optical and electrical properties, which can interact with incident electromagnetic waves. By changing the chemical potential (ν), the conductivity can be adjusted to achieve tunable absorption.In this study, we propose a metal-DBR-metal (M-DBR-M) structure with graphene based on the local characteristics of OTS and the electronic control characteristics of graphene.Tuning intrinsic wavelength by adjusting the driving voltage. The proposed structure can provide references for the research and design of photonic devices, such as sensors, absorbers, narrow-band selective filters, and optical detectors based on OTS.Methods In this paper, the dielectric constant of the metal layer is modeled using the Drude-Lorentz dispersion model. The influence of the graphene layer on dielectric interface continuity is considered. Thus, the modified transfer matrix method is used instead of the traditional transfer matrix method. The proposed structure is simulated using the COMSOL multiphysics software. The influence of material dispersion is neglected. We assume that the structure is in the air, and light incident into the structure from one side of the metal layer. The changes in the structure absorption spectra and intrinsic wavelength of OTS are compared and analyzed. The influence of the periodicity of DBR, the thickness of the metal layer, and driving voltage on the intrinsic wavelength, tunable range, and absorptivity of the structure are investigated.Results and Discussions There are two absorption peaks in the absorption spectrum of the M-DBR-M structure (Fig. 2). The electric field is localized at the interface between the two M-DBR. The electric field intensity decreases with distance away from the interface (Fig. 4). OTS 1 and OTS 2 correspond to absorption peaks 1 and 2, respectively. With the increase in driving voltage, the intrinsic wavelengths of the two OTSs in the M-DBR-M with graphene structure blue-shift until the driving voltage is greater than the abrupt change voltage of graphene, the intrinsic wavelength blue-shift tends to be stable (Fig. 5). The maximum-tuning range is determined by the intrinsic wavelength shift corresponding to the abrupt voltage. Thus, the intrinsic wavelength of OTS can be dynamically adjusted in a certain range by electronically controlled graphene. With the increase in DBR periodicity, the intrinsic wavelength of OTS 1 is red-shift with the maximum amplitude of 102 nm, and OTS 2 is blue-shift with the maximum amplitude of 100 nm. After applying the abrupt voltage, the tunable range of OTS 1 and OTS 2 hardly changes with the DBR periodicity. The absorptivity of the structure changes little without voltage or the abrupt voltage is applied; thus, it is robust to the fluctuation of the DBR periodicity (Fig. 7). With the increase in the thickness of M 1 and M 2, the intrinsic wavelengths of OTS 1 and OTS 2 are blue-shifted without voltage and with abrupt voltage. However, the tunable range almost do not change with the thickness of the metal layer. The absorptivity curve increases first and then decreases with the increase in M 1 thickness and increases with the increase in M 2 thickness (Figs. 8 and 9). The metal layer M 1 thickness in the range of 25--30 nm, the absorptivity has the optimal value. However, the absorptivity has a maximum value when the thickness of M 2 is 70 nm.Conclusions Based on the local characteristics of OTS and the electrical control characteristics of graphene, a metal-DBR-metal structure with graphene is proposed and the theoretical model is improved. The proposed structure is simulated using COMSOL software. The results show that the intrinsic wavelength of OTS has a red-shift compared with the M-DBR-M structure. The driving voltage regulates the intrinsic wavelength continuously and dynamically within a certain range. The maximum-tunning range is determined by the abrupt voltage. With the increase in the DBR periodicity, the structure tunable range is 9--10 nm, and hardly alters with the DBR periodicity. As the thickness of the metal layers M 1 and M 2 increases, the tunable range hardly alters with the thickness variation of the metal layer. When the thickness of the M 1 is in the range of 25--30 nm, the absorptivity has an optimal value. The absorptivity curve increases with the thickness of M 2. The metal layer M 2 shall be thicker to improve the absorptivity of the structure. Our research shows that by introducing a graphene layer and rationally designing structural parameters, a tunable structure with high absorptivity and absorption peak position can be obtained.
Aug. 06, 2021Vol. 48 Issue 16 1613001 (2021)
Xiaoqi Zhang, Fengping Yan, Xuemei Du, Wei Wang, and Min Zhang
Objective Metamaterial electromagnetic absorbers play an important role in many aspects, such as electromagnetic compatibility, radar stealth, and sensing. Owing to the limited applications of narrow-band absorbers, researchers combine resonant unit cells with different sizes in a plane or stack them layer by layer to obtain a wide bandwidth absorption. Most of these structures are designed with metal as the main material; this not only increases the complexity of design and production, but also loses the absorption of the metal, and these defects greatly limit the development of electromagnetic absorbers. Recently, all-dielectric metamaterial absorbers have become a new research focus because of their potential in improving wide-band impedance matching, and water has gradually been applied to the all-dielectric design of electric broadband absorbers. Simultaneously, water has large permittivity and excellent dispersion characteristics in the microwave band and its fluidity and transparency can satisfy the bending and transparency characteristics of materials. Therefore, the design of broadband absorbers based on water materials provides an excellent possibility for the design of ultrabroadband electromagnetic absorbers.Methods A water-based metamaterial absorbing structural unit was first designed based on the basic principle of the metamaterial absorbers. The structure mainly includes three parts: a metal bottom plate, a resin shell, and a circular water column. Moreover, the overall structure comprises a unit cell that periodically expands in the x and y directions. Furthermore, we used computer simulation technology software to simulate the scattering parameters of the absorbing structure and calculated the absorptivity by the related formula in origin. To further analyze the formation of the wide absorption band, electric and magnetic fields and power loss density at the resonance points were analyzed. Based on the above, the structure was analyzed by changing the incident and polarization angles to explore its absorption performance. Finally, according to the Debye formula, the dielectric constant of water at different temperatures was calculated, and the absorption rate of the wave-absorbing structure was simulated to analyze the performance of the designed absorber when the temperature changed.Results and Discussions A water-based metamaterial absorber is designed based on the principle of equivalent medium and impedance matching (Fig. 1). The results show that the frequency range where the absorber's absorptivity of the designed water-based absorber exceeds 90% is 8.2--78.32 GHz (Fig. 3), whereas the absorption rate is relatively low at low frequencies (Fig. 4). The equivalent complex impedance of the absorbing structure is simulated, and the result shows that its real and imaginary parts are always kept at about 1 and 0, respectively (Fig. 5). To analyze the formation mechanism of the absorption peaks, the electric field, magnetic field, and power loss density at five resonance frequencies were simulated. Different local resonance effects occured at these frequencies in the absorber, and most of the power losses occured in the water layer (Fig. 6). The absorption rates of the metamaterial absorber at different incident angles were analyzed in transverse-electric (TE) and transverse-magnetic (TM) polarizations, respectively. The results show that the proposed metamaterial absorber can maintain an excellent absorption characteristic when the incident angle changes (Fig. 7). Then, the absorptivity of the structure was simulated at different polarization angles. The results show that the structure has excellent polarization-independent characteristics for electromagnetic waves (Fig. 8). Finally, the absorption performances of the water-based metamaterial absorber at different temperatures were analyzed. The results prove that except in the frequency band near 12 and 22.8 GHz, the absorption rate of the absorber is almost insensitive to temperature changes, and remains above 90% throughout the designed waveband (Fig. 9).Conclusions In this paper, a water-based ultrabroadband metamaterial absorbing structure is proposed. According to the electromagnetic characteristics of water in the microwave band, the structure realizes an excellent absorption performance of over 90% for incident electromagnetic waves in the 8.2--78.32 GHz frequency band. When the incident angle of electromagnetic waves changes in the TE and TM modes, respectively, the structure has good absorption characteristics. When the polarization angle of the electromagnetic wave is changed, the results show that the structure has excellent polarization-independent characteristics. The absorptivity of the absorber is also analyzed when the temperature changes and the results show that as the temperature increases, absorption effect decreases slightly around 12 and 22.8 GHz, and absorption rates of other frequency bands stay above 90%. The water-based metamaterial absorber has not only the wide absorption-frequency band and high absorptivity but also the characteristics of insensitivity to the incident angle, polarization-independence, and thermal stability. Simultaneously, the structure has low complexity, good transparency, and excellent bending characteristics, which is essential to the application and development of new dielectric wave absorbers.
Jul. 30, 2021Vol. 48 Issue 16 1613002 (2021)
Yuanhu Wang, Liucheng Li, Shukai Tang, Guofu Li, Haijun Yu, Jing Cao, Jian Wang, Zengqiang Wang, Dongjian Zhou, Liping Duo, Ying Huai, Gang Li, Yuqi Jin, Donghui Zhang, and Xueming Yang
Aug. 06, 2021Vol. 48 Issue 16 1616001 (2021)
Xiangda Lei, Hongtao Wang, and Zongze Zhao
Significance The ability of airborne light detection and ranging (LiDAR) to obtain high-precision and high-density three-dimensional (3D) point cloud for a large area has been widely used in many fields such as surveying and mapping, forestry, and the electric power industry. In these applications, detecting specific targets such as buildings, trees, and power lines from the LiDAR point cloud is essential, which is usually considered a classification procedure. However, accurately identifying various typical surface objects from discretely and irregularly distributed LiDAR point clouds is challenging.Recently, many deep learning-based methods have achieved good performance in airborne LiDAR point cloud classification. Some scholars have employed convolutional neural networks for point cloud classification by transforming the unevenly distributed point cloud into regular images or voxels. In addition, researchers have applied some deep learning-based methods such as PointNet and PointCNN to the original 3D point cloud. In these methods, a large number of training samples are often required; moreover, they are manually labeled, which is time-consuming and laborious, thus inhibiting their wide use in complex scenarios under different conditions. To solve this problem, a small-sample airborne LiDAR point cloud classification method based on integrating transfer learning (TL) and a fully convolutional network (FCN) is proposed in this study.Progress The proposed classification method is summarized in Fig. 1. First, a colorful airborne LiDAR point cloud is derived using multispectral images; then, the normalized elevation, intensity values, and normalized difference vegetation index of each 3D point cloud are extracted to derive a three-channel point cloud feature map (Fig. 2). Next, multiscale and multiprojection feature maps are constructed by setting different grid sizes(0.1, 0.3, and 0.5 m)(Fig. 3) and projection directions(X, Y, and Z directions)(Fig. 4), which are fed into a pretrained DenseNet201 model to extract deep features of LiDAR point clouds (Fig. 5). Finally, the global features are extracted by applying a max-pooling operation to the extracted deep features for extending the feature description; the max-pooled features are used as the input for an FCN to achieve an initial classification result (Fig. 6), and then the classification result is improved using a graph-cut optimization algorithm.Results and Discussions Benchmark datasets provided by the International Society of Photogrammetry and Remote Sensing (ISPRS) are used to verify the proposed method. 1) We used four combinations of features to analyze the effects of multiscale and multiprojection features on classification accuracy: a single feature (S1/P1), multiscale features (MS), multiprojection features (MP), and multiscale and multiprojection features (MSMP) (Fig. 8). Experiment results show that the MSMP features had higher per-class F1 scores and overall accuracy than other feature combinations, which could be explained as the MSMP features being able to provide a more effective expression of airborne LiDAR point clouds. 2) To select more suitable pretrained models for classification, we experimentally validated pretrained VGG16, VGG19, ResNet50, and DenesNet201 models (Fig. 9). The contrast result show that the pretrained DenseNet201 model performed better than other pretrained models owing to its ability to extract deep features with better generalization. 3) To validate the effectiveness of graph-cut optimization, we performed graph-cut optimization by setting different numbers of adjacent points K and then chose the best optimization result with the number of adjacent points K=4 for a comparison with the result without graph-cut optimization (Fig. 11). The contrast result show that the graph-cut optimization algorithm could effectively correct misclassification points and improve classification accuracy. 4) The proposed method is compared with methods reported on the ISPRS website and TL-based methods, showing better results in overall accuracy and per-class F1 scores, except for powerline and impervious surfaces, than the methods reported on the ISPRS website. It also achieved better overall accuracy, average F1 score, and per-class F1 scores, except for low vegetation and tree, than the TL-based methods.In general, the aforementioned experiment results show that the overall accuracy of the proposed method is 89.9% when only per-class 2000 points are used as the training sample (approximately 1.4% of the dataset), which demonstrates that the proposed method can acquire high-precision point cloud classification with fewer training samples and in less time.Conclusions and Prospect In this study, an airborne LiDAR point cloud classification method based on integrating TL and FCN with small samples is proposed. In the proposed method, multiscale and multiprojection feature maps are first introduced to represent the spatial characteristics of 3D points accurately; then, TL is used to extract deep features from feature maps; finally, the deep features are fed into an FCN for the initial classification of LiDAR point clouds, followed by postprocessing with graph-cut optimization to achieve more accurate classification results. Because many steps are involved in the entire classification process-such as processes of saving and loading data-which prolong the classification time, the entire process will be integrated to accelerate training speed and improve data processing efficiency in the future.
Jul. 30, 2021Vol. 48 Issue 16 1610001 (2021)
Junhao Li, Kaiyuan Zheng, Zhenhai Xi, Zidi Liu, Chuantao Zheng, and Yiding Wang
Objective Methane (CH4) is the main component of natural gas; it is a kind of colorless, odorless, flammable, and explosive gas. It has major safety hazards in natural gas transportation and coal mining. The demand for natural gas has gradually increased recently. Generally, natural gas is transported to various areas through pipelines, and the aging of pipelines may cause leakages, which will cause long-term CH4 emissions, resulting in severe environmental problems and huge energy waste. In a closed environment, CH4 leakage is difficult to detect, which leads to potential hazards, such as suffocation and explosion. For example, in factories, coal mines, and other places, when the CH4 concentration in the environment reaches a certain limit (5%--17%), an explosion will occur, leading to severe safety accidents. Therefore, real-time and accurate CH4 concentration detection in the production environment is paramount to ensure life safety and reduce economic losses. In this study, a near-infrared sensor system based on the open-path off-axis integrated cavity output spectroscopy (OA-ICOS) technique was proposed for fast and real-time atmospheric CH4 concentration detection. Further, simulated CH4 leakage detection and the performance of the sensor system were verified through gas sensing experiments.Methods CH4 detection methods include catalyst combustion, electrochemistry, and infrared laser absorption spectroscopy. Infrared laser absorption spectroscopy is widely used because of its in situ quantification. OA-ICOS is a type of laser absorption spectroscopy and has received enormous attention recently due to its long optical path (OP), high robustness, and other advantages. In this experiment, the OA-ICOS technique was used to detect CH4 in real time based on an open OP design. A tunable semiconductor laser with a center wavelength of 1653 nm was used as the light source, and a highly stable optical cavity with a cage structure was fabricated with two high reflectance mirrors of 99.92% apart 35 cm. The optimal position of the off-axis integrated cavity output signal was obtained by adjusting the incident OP. Exploiting the open OP, a CH4 leakage simulation experiment was conducted, which proved that the system had the ability for fast detection of CH4and natural gas leakage. Through the online real-time Kalman filtering algorithm (KFA), the collected data were dynamically denoised. These experiments laid the basis for further development of the rapid response and on-site use of the CH4 leak detector.Results and Discussions Compared with the effective integral area of atmospheric CH4 in the reference gas cell, the effective mirror reflectivity of the cavity was determined to be 99.93%, which agreed with the reflectivity given by the manufacturer, leading to a 516-m effective OP. The highest signal-to-noise ratio (SNR) of the system, 28, was obtained after Voigt fitting, which indicated that the minimum detection limit of the system was ~64×10 -9 (Fig. 3). To measure the stability and minimum detection limit of the off-axis integrated cavity sensor system, atmospheric CH4 was measured continuously for ~90 min, and related data were analyzed by the Allan variance. When the average time was 4 s, a minimum detection limit of 8×10 -9 was achieved (Fig. 4). Using the KFA, the stability of the system was increased 4.3 times compared with the original data (Table 1). Through Allan’s analysis, the detection limit of the system was increased 20.5 times (Fig. 5). Further, a CH4 cylinder with a concentration of 100×10 -6 was employed to simulate natural gas leakage (Fig. 6), which verified that the sensor had the ability of short response time and high detection sensitivity for natural gas leakage detection. Conclusions Based on the high-stability cage-based integrated cavity, an off-axis cavity-enhanced CH4 detection system with an open OP was established. With reference to an absorption cell with a known OP, the OP of the cavity was measured to be 516 m. At a concentration of 1.8×10 -6, the SNR of the direct absorption signal was 28. Allan variance showed that under 4-s averaging time, the minimum detection limit of the system was 8×10 -9. The KFA was used to further depress the absorption signal noise, and concentration fluctuation range was reduced 4.3 times. Through the actual measurement of atmospheric CH4and simulated CH4 leakage experiment, it was proven that the system had advantages of high sensitivity, high stability, and fast response, which laid the basis for further integration of high-sensitivity sensors used in special fields.
Aug. 02, 2021Vol. 48 Issue 16 1610002 (2021)
Jinxiang Liu, Wei Ban, Yu Chen, Yaqin Sun, Huifu Zhuang, Erjiang Fu, and Kefei Zhang
Objective Now hyperspectral images have high spatial and spectral resolution, and play an important role in the fields of land monitoring, environmental protection, earthquake prevention, and disaster reduction. However, the high dimensionality and large data volume of hyperspectral data bring many problems (e.g., strong correlation among bands, mixed redundant pixels, and data information redundancy) to hyperspectral classification. With the continuous development of deep learning technology, the convolutional neural network (CNN), as one of its representative algorithms, provides a new solution for hyperspectral image classification. There are three common hyperspectral classification methods based on the CNN network. Among them, 1D CNN extracts spectral information, and 2D CNN extracts spatial information. In contrast, 3D CNN is usually composed of three-dimensional convolution kernels, which can extract two-dimensional spatial features and one-dimensional spectral features at the same time. Although 3D CNN has a better effect in spatial-spectral information fusion, this model is more complex, which increases the cost of network calculation and the number of parameters. With the rapid expansion of data volume, the classification accuracy and speed of a complex model are not satisfactory. Here we propose a lightweight fusion CNN algorithm, 3D-2D-1D CNN, for hyperspectral image classification. This algorithm organically integrates CNNs of different dimensions, reduces the calculation amount of 3D CNN operations, and makes full use of the hyperspectral spatial-spectral joint information. We hope that our basic strategy and findings can be helpful to improve the applicability and computational efficiency of the model.Methods A hybrid algorithm 3D-2D-1D CNN model (Fig. 1) is described as follows. Firstly, the hyperspectral data is processed by 3D CNN. In the hyperspectral cube, a three-dimensional convolution kernel is used for convolution calculation. Each feature map of the convolutional layer is connected to multiple spectrograms, so the information of the fused spatial and spectral features can be extracted at the same time. After that, 2D CNN is used to extract spatial information, and subsequently the output information is subjected to 1D CNN operations to further extract high-dimensional spectral information. Different feature information is extracted by performing two-dimensional and one-dimensional convolution operations, respectively. Finally, classification is performed according to the extracted feature maps. The algorithm proposed here retains the spatial-spectral joint information extraction of 3D CNN, and replaces part of the subsequent three-dimensional convolution layer process with a 2D convolution process and a 1D convolution process with less calculation. According to the rules of convolution operation, the proposed algorithm improves operation efficiency (Fig. 2).Results and Discussions The 3D-2D-1D CNN proposed here has the best accuracy among all three algorithms for comparison (Table 3). The classification accuracy of machine learning algorithms is higher than that of general classification algorithms (such as SVM). The classification accuracy of the intermediate output value of the proposed 3D-2D CNN model (new) remains stable, indicating that the fusion algorithm can achieve the complementarity of multi-dimensional convolution features. The 3D-2D-1D CNN model has high classification accuracy on data with large differences in spectral characteristics (Fig. 4), which proves that the model can extract more abstract spectral information. The model has fast convergence, reaching convergence in 20 iterations (Fig. 6). Deep learning algorithms consume more computing resources than the general classification algorithm SVM. Compared with 2D CNN, 3D CNN has a more complex model, so the training time is greatly increased (Table 5). Compared with the existing basic 3D CNN model and the existing improved algorithm 3D-2D CNN, the 3D-2D-1D CNN model has the highest classification accuracy and the fastest calculation speed. As the amount of data in the dataset increases, the speed of the proposed model increases fast, indicating that the model can be applied in large-scale data analysis with a great potential. In general, the model proposed here is the optimal in terms of classification accuracy and speed.Conclusions In view of the high computational cost of 3D CNN, a 3D-2D-1D CNN fusion model is established. The model can effectively reduce the network parameters and calculation cost, and has a high classification accuracy. Firstly, the network structure of 3D-2D-1D CNN can not only reach or exceed the classification accuracy of 3D CNN under the same parameter settings, but also it can greatly reduce the time cost and calculation cost, which is a more efficient network structure. Moreover, the model has a great data advantage in big data calculation. Second, compared with SVM, 2D CNN and other methods, the fusion model proposed here uses the complementary information of spatial-spectral combination at the same time, so it is the most excellent in overall classification accuracy, average classification accuracy, and Kappa coefficient. Finally, because the proposed model uses 3D CNN hierarchically, the fusion model can extract spatial-spectral features, spatial features, and spectral features in stages. The model improves the ability of 3D CNN to extract the features of hyperspectral data, and at the same time effectively utilizes the speed advantages of 2D CNN and 1D CNN, so it can effectively reduce the calculation cost and maintain a high classification accuracy.
Jul. 30, 2021Vol. 48 Issue 16 1610003 (2021)
Yijia Li, Zhengfang Wang, Jing Wang, and Qingmei Sui
Objective The potential damages of an I-beam structure may lead to safety accidents and adversely affect the safe operation of large-scale infrastructures such as buildings and bridges. The structural state monitoring and damage identification of an I-beam are critical to ensure its safe operation. Compared with traditional electronic-based vibration monitoring techniques, the fiber Bragg grating (FBG) sensor is small, high in sensitivity, anti-electromagnetic interference, and easy multiplexing. It is thus preferred to be employed for collecting the vibration signal of the I-beam structure of the infrastructure. However, the existing FBG vibration sensors are difficult to meet the requirements of wide frequency response and high sensitivity measurement of I-beam. Therefore, the first issue to be solved is the accurate sensing techniques of vibration signals. Apart from vibration sensing, another issue to be tackled lies in the damage identification of I-beam structure. The neural network and its transformer-based identification methods that have been developed recently depend on a large amount of training data and are slow in training, which limit its generalization in practical applications. To solve the aforementioned two issues, a novel FBG vibration sensor with two ends fixed beam was designed for vibration sensing. Moreover, the extreme learning machine (ELM) algorithm was employed to identify the damage state of the I-beam. We hope the results can be helpful to promote the safety monitoring and damage evaluation techniques of I-beam structures.Methods In this paper, a novel FBG vibration sensor with a double-ended fixed beam structure was designed, and the ELM-based automatic damage identification method of the I-beam was studied. First, a novel I-shape beam structure was designed as vibration-sensitive components of the FBG sensor. Then, we performed finite element simulations as well as testing experiments on the sensor to test its performance. After that, the energy ratio variation deviation (ERVD) of the wavelet packet was extracted as the damage feature to characterize the damage state of the I-beam. In addition, then the ELM algorithm was followed for the damage evaluation of the I-beam, The back propagation (BP) based damage identification method was used as a baseline model for comparison.Results and Discussions In this paper, a novel FBG sensor with a beam structure fixed at both ends was developed, and the ELM classification method was used to realize the damage identification of the beam structure. The results of the simulation and experiments show that the novel FBG vibration sensor has good acceleration response and time-frequency response characteristics within the acceleration range of 0.2g--3.0g and the operating frequency range of 10--350 Hz. The natural frequency of the sensor, when the acceleration was 2.0g was about 543.9 Hz (Fig. 7), agreed well with the simulation result of 568.6 Hz. The sensitivity of the sensor was approximately 6.7 pm/g, and the repeatability error of the sensor was about 1.7% (Fig. 9). The lateral sensitivity was 4.2% of the longitudinal sensitivity (Fig. 10). In addition, the structural damage index, ERVD, was about 3.2 for Case 1), and it significantly increased to about 15.7 for Case 2). For Case 3), the ERVD increased to about 23.0, which indicated that it was capable of reflecting the damage state of the beam structure (Fig. 15). After being tested on 90 groups of test samples under three working conditions, the accuracy rates of damage identification of the ELM and BP-based damage evaluation models were 96.7% and 93.3%, respectively (Table 2 and Fig. 16).Conclusions Focusing on the requirements of reliable condition monitoring and effective damage identification of I-beam, this paper developed a novel FBG vibration sensor with a fixed beam structure at both ends and then proposed the ELM classification method to realize the damage identification of the beam structure. The results of the simulation and performance test of the sensor show that the sensor has good acceleration response characteristics in the range of acceleration 0.2g--3.0g and operating frequency 10--350 Hz and has a good repeatability and a lateral anti-interference ability. It was applied to the beam structural damage identification process for inspection, using the ERVD as the damage feature, and the ELM was used to identify the beam structure damage. The preliminary test shows that its learning speed is fast, the generalization ability is good, and the damage degree identification accuracy reaches 96.7%, which is 3.4 percent higher than BP damage identification method.
Jul. 30, 2021Vol. 48 Issue 16 1610004 (2021)
Zhu Wang, Zhi Wang, Xu Zhang, Can Cui, and Jian Wang
Objective With the continuous advancement of science and technology, research into driverless smart cars has increased significantly. To realize environmental perception, driverless smart cars rely on sensors installed in the platform to collect and process surrounding environmental information. Sensors that perceive the external environment primarily include light detection and ranging (lidar), millimeter-wave radar, ultrasound, and cameras. Lidar is widely used in smart car obstacle detection and mapping navigation systems due to its high accuracy, large detection range, anti-interference properties, and the degree of depth information. Currently, two-dimensional lidar is widely used for obstacle detection. Obstacle clustering segmentation is a key technology in environment perception. Due to the complex environment characteristics and uneven distribution of data density, traditional clustering algorithms cannot achieve good clustering of different types of obstacles at different distances simultaneously, and obstacles can be missed and misdetected. Therefore, considering indoor obstacle detection requirements, the characteristics of lidar data and the geometric characteristics of indoor environments are analyzed and an improved adaptive threshold algorithm based on distance and obstacle characteristics is proposed. With the proposed algorithm, the threshold value is adjusted to change with the target distance and intra-class density. This method can effectively improve the correct detection rate of obstacles, and the segmentation accuracy reaches 92.23%.Methods The proposed algorithm introduces the cluster density concept of the DBSCAN algorithm and an improved linear threshold algorithm. First, after receiving lidar data, the upper computer preprocesses the data, eliminates unstable points outside the effective range, and converts the remaining points to a rectangular coordinate system. Then, distance and density thresholds are set. The distance threshold changes adaptively with the distance of the received lidar data. The density threshold is the density average of the current class plus a multiple of its density standard deviation, which can vary as the obstacle class inner density changes adaptively. Then, the starting point is classified as category 1. From the second point to the last point, it is determined whether the distance between the current point and the previous point is greater than the current distance threshold. If the distance is less than the threshold, it is classified into the current category. Otherwise, a new class is created, and it is classified into the new class. It is also determined whether the last point and the starting point are less than the threshold. If less, the last category will be classified into the first category, otherwise it will not be included.Results and Discussions The indoor test results are shown in Fig. 6. As shown in Fig. 6(b), it is difficult for the linear threshold algorithm to consider the sparse scanning points of distant obstacles and obstacles closely distributed at a short distance. It can be seen from Fig. 6(c) that the improved DBSCAN algorithm will group different obstacles that are close together into one category. In Fig. 6(d), in the vicinity of the same coordinates, the proposed adaptive threshold algorithm based on distance and obstacle characteristics can distinguish smaller object distances at the same distance and can successfully segment objects with different distance data densities. The outdoor test results are shown in Fig. 8. Under complex outdoor conditions, the proposed, DBSCAN, and linear threshold algorithms successfully segmented and detected various obstacles at close distances. However, the linear threshold method incorrectly classified walls as noise, and the improved DBSCAN algorithm mistakenly detected walls as two separate classes. For metal aluminum plates, the linear threshold algorithm and the improved DBSCAN algorithm mistakenly detected several types of obstacles. The proposed adaptive threshold algorithm successfully segmented and detected all types of obstacles that are close to each other and did not cause over-segmentation of walls and aluminum plates at a distance. In addition, the positive detection rate is significantly improved.Conclusions The experimental results showed that the improved clustering segmentation algorithm had the following advantages. First, it improved the positive detection rate of obstacle clustering and segmentation. Compared with the linear threshold algorithm, it had stronger environmental adaptability and could adapt to longer environmental distances and smaller object intervals. Second, compared with the global search of the DBSCAN algorithm, run time is reduced and the efficiency of obstacle detection and segmentation is improved.
Jul. 30, 2021Vol. 48 Issue 16 1610005 (2021)
Wenhao Lai, Mengran Zhou, Jinguo Wang, Tianyu Hu, Xixi Kong, Feng Hu, Kai Bian, and Ziwei Zhu
Objective As one of the most important primary energy resources, coal needs to be mined in large quantities every year. In this process, the mass proportion of biological coal gangue in raw coal is more than 10%. It needs to be separated from raw coal, which is called coal washing. As an important traditional energy field in China, the intelligent construction of coal industry is directly related to the process of the economic and social intelligence. Therefore, it is of great significance for the intelligent construction of coal mines to develop modern coal gangue separation technologies. Coal gangue is identified by machine learning algorithm, and then manipulators or pneumatic devices are used for the separation of coal gangue from coal, which is called intelligent separation of coal gangue. At present, coal gangue recognition based on an imaging technology has attracted more and more attention, but the recognition can only realize whether there is coal gangue, but cannot locate the coal gangue. In addition, the locating speed of coal gangue is directly related to the production efficiency of coal mines. This paper designs a coal gangue detection model based on the framework of YOLO v4, which aims to realize the faster identification and location of coal gangue, and provides the position information of coal gangue more quickly for the intelligent sorting system. In order to reduce the interference of environmental visible light, coal gangue is identified and located based on the multispectral imaging technology. In order to reduce redundant information and further improve detection speed, three pseudo RGB images are selected from 25 bands of multispectral images by using the optimal index factor theory.Methods Firstly, the collected multispectral data of coal and gangue in the laboratory and the selected three bands from 25 bands of multispectral images were used to form the pseudo RGB images by using the best index factor theory. The training data, validation data, and test data were 460, 65, and 115 spectral images, respectively. Second, a lightweight coal gangue detection model was designed based on multispectral imaging, which is named YOLO mg. The maximum depth of its backbone network is 23 convolution layers. In order to achieve stable and fast training of YOLO mg without using the pre-training weights, three learning rates, which are 0.00025, 0.0005 and 0.0001, are used, respectively. Finally, the model YOLO mg was applied to the study of coal gangue detection based on the pseudo RGB images, and the redundant bounding box was filtered by the non-maximum suppression combined with confidence threshold.Results and Discussions The rapid identification and location of coal gangue based on multispectral imaging are studied. The maximum depth of the backbone network of YOLO mg is 23 layers (Fig. 4). OIF is used for multispectral band selection, the maximum value is 11.138, and the corresponding combination band selection is [7, 12, 23] (Table 2). The combination band is used for the designed YOLO mg training. Three learning rates are set and trained for 100 epochs. The convergence speed of the designed model is fast, and the verification set loss decreases from the initial 1500.60 to the minimum of 6.81. In addition, compared with training loss and verification loss, YOLO mg is not over learning (Fig. 5 and Table 3).The redundant prediction boundary box is filtered by the non-maximum suppression combined with confidence threshold. Under the input resolution of 204 pixel × 204 pixel, the average accuracy of coal gangue detection is 91.91%, and there are only four false positive (FP), which effectively reduces the wrong positioning of coal gangue in the prediction results (Table 4 and Fig. 7). Compared with the advanced YOLO v4, M2Det, and YOLO v3, the YOLO mg designed here maintains an excellent detection accuracy, and the positioning speed of coal gangue is the fastest. The 115 combined band spectral images only take 1.255 s (Table 5).Conclusions The intelligent coal washing technology is an important part of the realization of coal mine modernization construction. The multispectral imaging technology is applied to the study of intelligent separation of coal gangue. The optimal combination band is selected by OIF, and a detection model is designed to realize the location of coal gangue. Firstly, the multispectral imaging technology is used to identify and locate coal gangue. Three optimal combination bands are selected from 25 bands for coal gangue detection research by the OIF theory, which can effectively reduce the redundant multispectral information. Second, a fast detection model is designed. Without using the pre-training weights, the model can be trained quickly and stably by setting three learning rates. Finally, the detection time of 115 spectral images by YOLO mg designed in this paper is only 1.255 s, which is the least time-consuming in the comparison models, so that the rapid detection of coal gangue is realized and the design purpose is achieved. The lightweight detection model of YOLO mg designed here aims at the specific scientific problems of coal gangue localization based on multispectral imaging and provides a guidance for the lightweight model design of positioning problems in other fields.
Aug. 06, 2021Vol. 48 Issue 16 1611001 (2021)
Suling Qiu, An Li, Xianshuang Wang, Denan Kong, Xiao Ma, Yage He, Yunsong Yin, Yufei Liu, Lijie Shi, and Ruibin Liu
Objective In the mineral industry, the quality of ore depends on the content of ore components (mass fraction); the accurate analysis of the types and contents of elements in the ore lays the foundation for mining and beneficiation. Traditional detection methods rely on chemical methods with high accuracies, such as potassium dichromate volumetric method and flame atomic absorption spectrometry (AAS). However, it cannot simultaneously determine multiple elements, which is time-consuming and laborious and difficult to analyze a large number of samples in a short time. The emission of analytical reagents can easily cause environmental pollution. AAS is widely used for detecting ores in the laboratory. It has high accuracy and low limit of detection (LOD) in the detection of trace elements. However, self-absorption effect of high content elements leads to the failure of Lambert-Beer law, which is not suitable for detecting samples with high content elements. The above methods need to dissolve minerals in a strong acid or alkali, which are destructive to the samples and cannot be used in the industrial field. Laser-induced breakdown spectroscopy (LIBS) has been widely used in the field of multi-element analysis due to its advantages of without complex sample pretreatment, fast, and real-time detection of all elements. LIBS is a good choice for in situ and online quantitative analyses of ore elements.Methods The quantitative analysis of Fe in iron, manganese, and chromium ores is conducted using LIBS. Due to the complexity of mineral composition, a specific algorithm is used to preprocess the spectrum to reduce the spectrum fluctuation caused by laser energy fluctuation and unstable ablation of the sample also to improve the signal-to-noise of the spectrum signal. Classification and quantitative analysis methods are combined to improve the quantification accuracy. The spectrum is preclassified by a support vector machine. Then, the linear relationship between spectral data and typical element content is established using the principal component analysis combined with multiple partial least squares regression. In this process, the numbers of input variables and principal components are optimized by the selection criteria of correlation variables and the number of principal components.Results and Discussions The abnormal spectra are eliminated using the Pauta-Criterion. The relative standard deviation of most spectral lines decreased after removing the abnormal spectrum [Fig. 3(a)]. The principal component analysis combined with a support vector machine is used to classify the three kinds of ores [Fig. 4(a)]. The sum of the contributions of the top ten principal components of ores reaches 92.42%, indicating that these can cover most of the ore spectrum information. The score chart of the first three principal components shows that characteristic points of the same type of ore appear as obvious aggregation, and the three types of ores are very easy to distinguish [Fig. 4(b)]. The classification accuracy of the three types of ores is 100%. By full spectrum partial least squares regression analysis of unclassified ores, root mean square error of prediction (RMSEP) and average relative error (ARE) are 3.227% and 31.75%, respectively. The RMSEP of iron, manganese, and chromium ores decrease to 0.975%, 0.418%, and 0.123%, respectively, and ARE decreases to 1.46%, 6.72%, and 1.09%, respectively, after classification combined with regression-partial least squares (R-PLS), indicating that the method significantly improves the accuracy of quantitative analysis (Table 3).Conclusions In this study, an innovative spectral pretreatment and quantitative analysis method based on LIBS analysis of ore composition is proposed. The semiquantitative classifications and quantitative regression algorithms are combined, and the selection range of regression variables is determined accurately using the category judgment, improving the prediction accuracy of the regression model. The effective spectrum is selected using the Pauta-Criterion to reduce the spectral line fluctuation caused by the experimental process. To improve the spectral signal stability, the spectral background integral intensity is used to normalize the spectral; the peak shift is corrected and the missing peak is completed. It is obtained that ores are first preclassified using the LIBS spectral analysis method. Then, the partial least square method based on the correlation variable selection mechanism is used to quantitatively analyze the content of each element in the ore, significantly improving the accuracy and robustness of the quantitative analysis. The classification accuracy for 35 kinds of ore reaches 100%, and RMSEP of prediction for Fe content in the ore is reduced to less than 1%. This study provides a theoretical and experimental basis for online rapid detection of ore.
Aug. 06, 2021Vol. 48 Issue 16 1611002 (2021)
Zhonggang Xiong, Liping Shang, Hu Deng, Linyu Chen, Jieping Yang, Jin Guo, and Guilin Li
Objective With the rapid development of terahertz (THz) technology, requirements for THz radiation sources and detectors have increased. Currently, the high refractive index of photoconductive materials decreases the photoelectric conversion efficiency and the shielding effect of the field leads to the saturation of the radiated power, thereby limiting further improvement of the radiated power of THz sources. Therefore, the study on high-power broadband THz radiation sources is an active field in THz-related technology. Many researchers have conducted several studies on the photoconductive antenna (PCA) optimization design because PCA is one of the most widely used THz radiation sources. The THz radiation performance of PCA can be effectively adjusted by improving the antenna structure, which can further promote the wide application of THz devices.Methods Herein, the performance of a THz-microstructured PCA based on the dipole PCA with embedded square split-ring resonators is analyzed and investigated. Based on the model of dipole PCA, the dynamic process of the amplitude of the designed microstructure resonance mode under the interaction of incident light and structure is described using the coupling wave theory. The local coupling characteristics between the THz wave and structures are simulated and analyzed by adjusting the structural parameters. Furthermore, the relationships of the time domain pulse waveform and frequency spectrum characteristics of THz radiation between the parameters of the dipole and microstructured PCAs are simulated and compared. Finally, the simulation results of the radiation direction of the dipole and microstructured PCAs are compared.Results and Discussions In this design, the square split-ring resonator (Fig. 1 (b)) is embedded in the dipole PCA electrode (Fig. 1 (a)) to investigate the interaction between the microstructured PCA and pumped laser, which is incident vertically on the surface gap of the structure. In the simulation, three resonance frequency curves under different effects of local electromagnetic modes can be obtained by adjusting the structural parameters (Fig. 2). To further explain the influence of the resonance frequency values of different electromagnetic localized effects on radiation frequency values and the loss performance of the intrinsic structure, we use three resonance frequency values, namely, ω1=0.8 THz (solid blue line), 1.0 THz (dotted black line), and 1.2 THz (dotted red line). The results show that the local electromagnetic resonance patterns significantly enhance the electromagnetic energy at the resonant frequencies (Fig. 3). Then, the influence of the curves of the three resonance frequencies and the corresponding coupling coefficients on the radiation waveforms is investigated (Fig. 4). We further evaluate the influence of the microstructure parameters on the position of the resonance peak frequency and the signal intensity of the THz PCA. Results show that the maximum radiation intensity is increased by 340% by adjusting the length, width, and gap between the electrodes. The frequency shift of the resonance peak occurs gradually, and the frequency shift range is 0.2--0.8 THz (Figs. 5, 6, and 7). Finally, the far-field THz radiation modes of the dipole and microstructured PCAs are simulated. The main beam of the microstructured PCAs shows better energy concentration and directivity, providing a reference for fabricating directional THz antennas (Figs. 8 and 9).Conclusions We design microstructured PCA, which exhibits a higher signal intensity and frequency adjustable degree than the dipole PCA. When the coupling coefficient and strength are increased by optimizing and adjusting the structural parameters, the electromagnetic radiation energy is considerably enhanced at the resonance frequencies. The intensity of the THz wave is increased by 340% with a change in the microstructural parameters. Moreover, the resonance peak gradually shifts in the range of 0.2--0.8 THz and the frequency adjustability is approximately 61%. The far-field THz radiation mode of the microstructured PCA can achieve the strongest THz wave radiation direction, which is crucial for designing directional THz antennas. Finally, the relationship between the geometrical structure parameters of the PCA and the resonance peak frequency and intensity of the THz signal is defined, which provides an important basis for the subsequent optimization design of the THz antenna with a high Q value.
Aug. 23, 2021Vol. 48 Issue 16 1614001 (2021)
© Copyright 2018-2021 | Chinese Laser Press.
All Rights Reserved 沪ICP备15018463号-20