


Please enter the answer below before you can view the full text.

Xiaoling Jin, Youwei Wang, Bing Sun, Zuxing Zhang, and Mingyang Chen
Objective Orbital angular momentum (OAM) beams have recently spurred great interest because they are widely applicable to optical manipulation, quantum information, imaging, and communications. The four states of the OAMl,mmode family have been already demonstrated in multiple-input multiple-output (MIMO)-free transmission. When using the four states of a LPl,m mode (l ≥1) in an optical fiber with circular symmetry, 4×4 MIMO processing is necessary. As N×N MIMO complexity scales with N2, OAM modes are preferred in communication systems for mobile device management. However, the effective refractive index difference Δneff between the HE(l+1)m and EH(l-1)m modes should be below 10 -4 to minimize coupling between the OAM modes. Ring-core geometry, usually with a high-index contrast, is well adaptable to the guidance of OAM modes because it can eliminate the undesirable modes (m=2) and reaches a sufficiently large intra-mode-group OAM Δneff value. Moreover, avoiding the higher-order OAM modes (m≥2) simplifies the multiplexing-demultiplexing of the modes because all OAM modes present an annular-shaped intensity. Methods Photonic crystal fibers (PCFs) can be flexibly designed to provide unique fiber properties such as endlessly single mode, controllable nonlinearity and confinement loss, and tailorable chromatic dispersion. The PCF structure that realizes OAM-mode transmission is potentially applicable to fiber communications. Although air-silica PCFs achieving high index contrast, OAM-dedicated PCFs are not yet realized, and an OAM with l=1 guidance in a PCF has been reported only in twisted PCFs. This study evaluates the potential of a new ring-core PCF designed for guiding OAM modes with low mode coupling. Such a geometry appears to be easily manufactured by the stack-and-draw method.Results and Discussions In the proposed structure [Fig. 1(a)], the solid ring core is installed in a central hole surrounded by a circular ring of air holes in the cladding structure. This structure is prolongated by several rings of air holes with hexagonal symmetry. The intensity profiles of the first 10 vector modes in the PCF structure are theoretically studied using the finite element method, and are displayed in Fig. 1(b). The minimum effective refractive index (ERI) difference between the HE and EH modes corresponding to the same order OAM mode exceeds 3.04 × 10 -3 within the wavelength range 1.3--2.0 μm. Here, the diameter of the hollow core is 5.6 μm, the diameters of the first-ring, second-ring, and third-ring air holes in the cladding region are 2.67, 2.87, and 2.87 μm, respectively, and the pitch of the air holes in the two outermost rings is set to 3.09 μm (Figs. 3 and 4). The maximum ERI difference between the HE and EH modes reaches 1.55×10 -2(Fig. 5). Such a large ERI difference has not been previously achieved in a 10-mode OAM guiding fiber. Bending is known to induce modal birefringence (Fig. 7). When the bending radius is only 18 mm, the birefringence is less than 5×10 -5 RIU, implying that the odd and even modes are not easily combined into an OAM. Conclusions We have designed an annular, hollow-core photonic crystal fiber for vortex light transmission that exploits the flexible characteristics of PCF. The structural parameters were simulated in a finite element analysis, method and the transmission characteristics of the orbital angular momentum modes in the PCF structure were analyzed. In this new design, the degeneracy lifting between the even and odd modes was limited to less than 3.5×10 -7 by the size of the air holes. The neff values of the HE and EH modes are well separated by 1.55 μm. In a theoretical analysis of the transmission characteristics of the first 10 vector modes, the number of allowable high-order vector modes was increased by adjusting the structural parameter (air-hole period) of the fiber. This strategy typified the early design of PCFs. More significantly, the proposed structure presented excellent bending-loss resistance. The simulations demonstrated that hollow-core PCFs ensure the stable and efficient transmission of multiple OAM modes when the bending radius is low (18 mm or less). The proposed PCF structure can potentially enhance the capacity of future optical communication systems.
May. 20, 2021Vol. 48 Issue 11 1105001 (2021)
Yang Liu, Dongyuan Liu, Yao Zhang, Lu Bai, and Feng Gao
Objective Functional near-infrared spectroscopy (fNIRS) is an effective neuroimaging tool used to directly determine changes in oxygenated hemoglobin (HbO) and deoxygenated hemoglobin (HbR). This technique offers portable and radiation-free alternatives to conventional neuroimaging modalities, such as functional magnetic resonance imaging, positron emission tomography, and electroencephalograph. However, current portable fNIRS systems have limited detection sensitivity due to the employment of photodiodes working in analog mode. To cope with the adversities, we propose a portable two-wavelength continuous-wave fNIRS-topography system based on lock-in photon-counting technology to be applied in cognitive neuroscience and brain-computer interface (BCI) studies in a daily environment. The proposed system has a good prospect of application in faint activation detection by integrating the parallel measurement capability derived from lock-in technology and the high sensitivity derived from photon-counting technology. Thus, the proposed system should provide a noninvasive route, reasonable temporal resolution, and high-sensitive information for studying fNIRS-BCI.Methods In this study, the proposed portable fNIRS system possesses four pairs of source- and detection-optodes, which are matched with the configurations of a nonoverlapping source-detector array to conduct experiments. Source-optode bundles two single-mode fibers with a core diameter of 9 μm connected to two laser diodes (LDs) at 785 and 830 nm wavelengths. Besides, a modulator with eight square wave signals of different frequencies is designed based on a field-programmable gate array (FPGA) kit. The modulated light reaches the cerebral cortex and is subject to refraction, scattering, and absorption by HbO and HbR. A part of the light is redirected to the scalp, where HbO and HbR concentration changes are detected by the detection module in turn, which adopts a photomultiplier tube with a linear range of 5.0×10 6 s -1 and a dark count of 600 s -1 as the core device. A lock-in photon-counting demodulator is designed based on FPGA to achieve parallel signal demodulation and detection in all sampling channels. Besides, the intensity of each LD can be automatically adjusted using a digital potentiometer (AD5259) for adaption to different subjects. Wireless communication and rechargeable batteries are used to ensure portability. All the mentioned components and printed circuit boards are fixed in a portable case with a volume of 23.6 cm×11.0 cm×20.5 cm, which is lightweight and miniaturized. Results and Discussions A series of phantom and in-vivo experiments have been implemented to examine the effectiveness of the proposed portable fNIRS-topography system. The phantom experiments showed that the proposed system has excellent stability (Fig.3), linearity (Fig.4), and anticrosstalk ability (Fig.5). For the in-vivo experiments (Fig.6), we adopt two stimulation paradigms: breath-holding (BH) and mental arithmetic (MA) to evaluate the system. The complete dataset is synchronously acquired at a sampling frequency of 4 Hz. Then, changes in the perturbed HbO and HbR concentrations are calculated according to the modified-Beer-Lambert-law. The frequency spectrum of the measurements is analyzed using the Fourier transform, which provides a theoretical basis for the bandpass filtering (0.018--0.3 Hz), and the spectrum peak (0.02333 Hz) is close to the stimulation frequency (Fig.7). By further analyses of these spectra [Fig.8(a) and Fig. 9(a)], we strengthen the actual activation frequency induced by the stimulation. The results show that the proposed system can accurately trace the time-course of the global activation perturbation by BH stimulation [Fig. 8(b)] and the partial activation perturbation by MA stimulation [Fig.9(b)]. Besides, the optical topography (OT) image of the measurements from the MA paradigm showed that the activation region is roughly located at the center of the left half of the prefrontal lobe [Fig.9(c) and Fig. 9(d)].Conclusions In this study, we developed a portable fNIRS-topography system for the applications of BCI based on lock-in photon-counting technology, which has the advantages of high sensitivity and moderate time resolution. A two-layered brain phantom is employed to evaluate the system. The results showed that the proposed system has excellent stability, linearity, and anticrosstalk ability. Besides, the proposed system is used to measure the perturbed hemoglobin concentration in the prefrontal lobe during BH and MA stimulation paradigms. The results showed that the proposed system can track changes in hemoglobin concentration. The frequency spectrum of the measurements is analyzed, and the spectrum peak (0.02333 Hz) is close but not equal to the stimulation frequency (0.025 Hz). The probable cause of this situation is the hemodynamic response delay (about 2--3 s) in the brain. The image reconstructed by OT during the MA stimulation paradigm showed that the activation region is roughly located in the center of the left half of the prefrontal lobe. We analyzed the entire experimental process and confirmed that simple training before experiments enhances the system performance. In future studies, we will design more stimulation paradigms, e.g., sports and idea recognition, to further explore the potential of fNIRS-BCI in clinical application.
Jun. 04, 2021Vol. 48 Issue 11 1107001 (2021)
Tong Xiang, Heming Chen, and Yuchen Hu
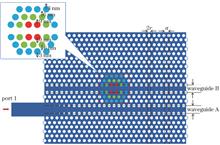
Objective As the package size of high-speed optical communication devices becomes smaller, and the performance requirements get higher, it is not easy for traditional electro-optic modules with separated components to meet the demands of modern communication. Currently, electro-optic devices are developing toward highly integrated miniaturization. There have been many studies on photonic-crystal-based electro-optic modulators and silicon-based mode division multiplexers. However, there are few studies on the integration of the two devices. During the evolution of optical communications in the future, the demands for small size, large-capacity, and high integration have become increasingly prominent. Thus, we propose a silicon-based integrated device for electro-optic modulation assembly with mode division multiplexing, which has low insertion loss, low channel crosstalk, high extinction ratio, and large modulation depth. The integrated device has a compact structure and excellent performance. It has broad application prospects in the field of high-speed and large-capacity optical communication and optoelectronic integration.Methods The proposed integrated device consists of electro-optic modulation and mode division multiplexing modules. The electro-optic modulation module consists of silicon-based photonic crystal waveguides and a width-modulated (WM) resonant cavity. The mode division multiplexing module consists of silicon-based asymmetric parallel nanowire waveguides. A tapered structure is used at the junction of photonic crystal and nanowire waveguides to reduce the cascade loss between the two waveguides. We used the finite-different time-domain(FDTD) and device methods in the commercial optical simulation software Lumerical for simulation analysis. According to the time-domain coupled-mode theory and plasma dispersion effect, WM-type resonant cavity and PN doping structure are used to achieve the on-off modulation of TE0 mode. According to the transverse coupled-mode theory, asymmetric parallel nanowire waveguides are used to achieve the conversion from TE0 to TE1 modes. The integrated device can achieve a narrow-band on-off modulation and mode multiplexing function of TE0 and TE1 modes with a center wavelength of 1553.91 nm.Results and Discussions The integrated device has excellent performance. To achieve low insertion loss, a tapered structure with c=9 is selected using simulation analysis to cascade photonic crystal slab and nanowire waveguides. The proposed structure can achieve narrow-band on-off modulation and mode division multiplexing for TE0 and TE1 modes with a center wavelength of 1553.91 nm. When the modulation voltage is 1.24 V, the variation of electron concentration ΔNe reaches 4.55×10 18 cm -3, and the variation of hole concentration ΔNh reaches 5×10 18 cm -3 (Fig.12). The transmittance of the integrated device under “off” and “on” states are T=0.010255% and T=96.34%, respectively (Fig.13), and the Q value reaches 1.5×10 4. The extinction ratio of the integrated device is 19.73 dB, and the modulation depth is 0.9894. Through detection on ports A, B, 3, and 4, the performance parameters of each mode at output ports are measured. The calculation results showed that the minimum and maximum insertion losses of the integrated device are 0.05 dB and 0.46 dB, respectively. The minimum and maximum channel crosstalk are -34.33 dB and -14.66 dB, respectively. Besides, after comparing the performance of the photonic crystal electro-optic modulators and two-mode silicon-based mode division multiplexers proposed in the existing references (Table 1), the proposed device can integrate the electro-optic modulation and mode division multiplexing modules. Besides, the proposed device has excellent performance. Conclusions This study proposed a silicon-based integrated device for electro-optic modulation assembly with mode division multiplexing. WM-type photonic crystal resonator and silicon-based asymmetric parallel nanowire waveguides can be used to achieve on-off modulation and mode division multiplexing. The tapered structure can reduce the cascading loss between photonic crystal and nanowire waveguides. The proposed integrated device can achieve a narrow-band on-off modulation and multiplexing function of TE0 and TE1 modes with a center wavelength of 1553.91 nm. When the modulation voltage is 1.24 V, it can achieve low insertion loss, low channel crosstalk, high extinction ratio, large modulation depth, and high Q value. The extinction ratio of the integrated device is 19.73 dB, and the modulation depth is 0.9894. The minimum and maximum insertion losses of the integrated device are 0.05 dB and 0.46 dB, respectively. The minimum and maximum channel crosstalk are -34.33 dB and -14.66 dB, respectively. It has a compact size of ~54 μm×22 μm. It can be applied to high-speed and large-capacity optical communication systems and has significant value for improving system integration.
Jun. 04, 2021Vol. 48 Issue 11 1106001 (2021)
Tingting Wei, Jiazhi Yang, Guoqing Zhou, Xiang Zhou, and Xueqin Nong
Objective It is difficult to reap the target distance and features from the shallow-water LIDAR echo signals with a low SNR, hence noise reduction is imperative. The noises in full-waveform echo signals caused by the LiDAR system in our laboratory can be divided into background noise, detector noise and preamplifier noise. Background noises stem from artificial light sources and the scattering of air, target, water surface, glass pentrough and mirrors, which are usually filtered by optical filters. Detector noises, such as shot noise, thermal noise, flicker noise and composite noise, are generated by the photons of the light source and current carriers or thermions of the device during the conversion of the optical signals received by the detector into electrical signals. In the trans-impedance amplifier, not only these noises in the weak signals will be amplified, but also its circuit devices will produce new noise. While the echo signal obtained by our experimental system also contains a natural frequency (eigen-frequency) component, which is represented as a signal that changes over time according to the law of sine or cosine. Except flicker noise, all other noises can be regarded as additive noises and conform to a Gaussian distribution. The eigen-frequency is much higher than that of a full-waveform echo signal, and the decomposition and reconstruction method can be consequently utilized to filter out most noises at high frequencies.Methods The processing process of shallow-water LiDAR echo signals comprises echo signal noise reduction and full-waveform signal decomposition. The extractions of amplitude, position and full width at half maximum are associated with the distance and characteristics of the target, accordingly the procedure needs to further fit and optimize. And noise reduction of the model signal and the measured signal can be considered to verify the usability of the EWT. First, the improved boundary detect method of EWT based on the frequency characteristics of shallow-water LiDAR echo signals and established Gaussian LiDAR echo signals was used with MATLAB. Then, different algorithms were used to address same signal with a certain signal-to-noise ratio and ensure whether the improved algorithm is suitable for our echo signals with different noise reduction performance parameters. In addition, in order to further test the feasibility of the improved denoising algorithm, a self-made LiDAR was adopted to indoor bathymetric experiments. After decomposing the measured signals by EWT, the high SNR echo in the first boundary can be used to decompose full waveform signals, the system noises in the second and fourth boundaries can be used to estimate the noise levels, and the natural frequency components in the third boundary can be used to troubleshoot the fault of the LiDAR system. Finally, the peak and the full width at half maximum of the full-waveform decomposition signal (clean echoes from the water surface and bottom) were calculated using the frequently-used LM algorithm. The time interval among the peaks contributes to measure the shallow-water depth, therefore a comparison of depth measurement errors can be acquired.Results and Discussions Common noise reduction algorithms were employed in the processing of the signals established by MATLAB (Fig. 2). Compared with other algorithms (Table 1), the improved empirical wavelet transform is advanced in the performances of computation time, cross correlation, MSE, MAE, SNR and PSNR. Adopting different algorithms to address the measured echo signals from the shallow water (from 0.5 m to 3 m) (Figs. 6 and 7), the echo signal was decomposed into the clean signal, noise and natural frequency components because the improved EWT was used to decompose the actual measurement signals in different frequency bands (Fig. 8). By comparison, the bathymetric measurement errors of the LiDAR system are less than 0.1 m using different denoising methods (Table 2 and Fig. 9).Conclusions In present study, the improved EWT detected the boundary according to the frequency characteristics of echo signals. The functionality of the proposed method was examined by processing the model signal established in MATLAB and the measured signal from the shallow water LiDAR system in our laboratory. High performances of noise reduction and accuracy decomposition were actualized by the method, and the measured echo signal was decomposed into different components (the useful echo signal, system noise and eigenfrequency component) with dissimilar effects. After filtering the noise through the improved EWT, the data processing time could be shortened and the measurement error of shallow water depth could be cut down. This paper mainly shows the applicability of boundary detect method based on EWT algorithm in noise reduction of LiDAR echo signal. However,the setting of WT in EWT algorithm will influence the performance of noise reduction and a further research is needed.
May. 20, 2021Vol. 48 Issue 11 1109001 (2021)
Yufei Duan, Feng Li, Zhi Yang, Qianglong Li, Yang Yang, Tianhao Wu, Yishan Wang, and Xiaojun Yang
Objective Compared with traditional solid-state lasers, such as slats and wafers, femtosecond fiber lasers have many advantages, including compact structures, good beam quality, stable systems, and good heat dissipation. They are widely used in various application fields, particularly in the field of fine material processing. The current femtosecond fiber laser is mainly used to reduce the problems of nonlinearity and device damage in the amplification process using the chirped pulse amplification technology to obtain a femtosecond laser with its peak power and narrow pulse width meeting processing requirements. Owing to the increase in the energy demand of an industrial fiber laser, the amplification classes also gradually increase, rendering the narrowing effect due to an uneven gain medium increasingly severe and influencing the final spectral width. Thus, its occurrence increases the compressed pulse width limit, reduces the pulse peak power, and severely impacts the thermal diffusion in processing. Currently, the gain narrowing problem of a femtosecond fiber laser can be solved using self-phase modulation, a new amplifying stage system, or dielectric layer filters. However, these approaches can only form fixed spectral modulation, which cannot solve the gain narrowing problem in different amplification or laser systems with different power requirements of the same amplification system. Therefore, programmable devices are proposed to achieve the controllability of spectral modulation. Among them, the liquid crystal spatial light modulator, a common element for beam shaping and pulse shaping, exhibits higher regulating precision than the general acousto-optic filter. For a fiber laser seed source, its spectral width is only a few nanometers or tens of nanometers; the liquid crystal spatial light modulator is more suitable for fiber laser spectral modulation. This study focuses on the characteristics of the spatial light modulator and the requirement of a chirp pulse amplification system for spectral modulation. The solutions of a spectral shaping system are proposed based on the two-dimensional (2D) intensity-type liquid crystal spatial light modulator for spectral modulation. The chirped pulse amplification system eliminates the gain narrowing problem and achieves a narrower output pulse duration.Methods Herein, the 2D intensity-type liquid crystal spatial light modulator was used for spectral modulation. First, the seed source is amplified using the single-mode amplification system and enters the spectral shaping system, which comprises the polarization-splitting prism, grating, and the intensity of reflection-type liquid crystal spatial light modulator to perform various spectral modulation shapes and verify the programmability and high precision of the spectral shaping system. Then, the subsequent multi-mode amplification and main amplification systems with an optical fiber aperture of 25 μm were established. The shape required for spectral shaping, which can be compared with the initial spectrum function to achieve a 2D grayscale map, was obtained using the step-by-step Fourier transform method combined with reverse operation. Next, the grayscale image was loaded into the spatial light modulator, and the spectral widths before and after the addition of the grayscale image were compared to investigate the influence of the shaping system on the spectra and the reasons for the spectral shape formation. Finally, the near-limited output pulse duration of the femtosecond laser was obtained by compressing an appropriate distance by the 1450 line/mm grating, and the pulse duration was measured using an autocorrelation instrument to determine the optimization results of pulse duration.Results and Discussions The spectrum can be reshaped into flat-top, central-depression, triangle, continuous- depression, and other shapes using the spectral shaping system (Fig.4). Generally, as the spectral shaping becomes more complex and its shaping effect becomes worse, the modulation of the liquid crystal void generated using the liquid crystal spatial light modulator becomes increasingly obvious. After adding the main amplification system, the spectral width before entering the amplification system is reduced by approximately 1.5 nm (Fig.5) and the gain narrowing effect is evident. The grayscale map obtained using reverse operation was loaded on the 2D liquid crystal spatial light modulator to obtain the super-Gaussian spectral shape (Fig.6) after spectral shaping and amplification. The full width at half maximum of this spectrum is approximately 9.5 nm. The spectral width is approximately 2.5 nm, and the corresponding limited pulse duration is reduced from 222 fs to approximately 164 fs. Finally, the pulse duration of 170 fs, close to the limit, can be obtained after the laser with spectral shaping is compressed through the grating. Compared with that of direct compression, the pulse duration is decreased by 86 fs. Moreover, the pulse shape has a side lobe owing to the liquid crystal spacing problem of the liquid crystal spatial light modulator (Fig.7).Conclusions Results show that the spectral shaping system can realize the arbitrary spectral modulation using the liquid crystal spatial light modulator. It can also set the spectral bandpass characteristics by regulating the function of different spectral component gains and realize dynamic matching using the subsequent amplification spectrum. Thus, this system is suitable for different conditions of gain spectrum modulation demand and can achieve a pulse duration close to the limit to meet the narrow output pulse duration and peak power of a femtosecond laser. Moreover, it achieves the purpose of efficient material cold working and satisfies the high requirements of the thermal effect for femtosecond laser applications. However, the improved results can be obtained using a modulator with a higher filling rate and smaller clearance for spectral shaping.
May. 20, 2021Vol. 48 Issue 11 1101001 (2021)
Zengchao Wang, Kuo Meng, Kai Chen, Lianqing Zhu, and Fei Luo
Objective Fiber lasers have been widely used in scientific research, industrial processing, biomedical, and other fields because they offer unique characteristics such as good heat dissipation, high light-light conversion efficiency, and excellent beam quality. As a classic fiber laser, the erbium-doped fiber laser with a wavelength of 1.5 μm has been widely used in optical fiber communication, environmental monitoring, medical facility, precision spectroscopy, and other fields. Cascade amplification is a typical technique for achieving high-power pulsed lasers, but group velocity dispersion and the damage threshold of fiber materials attributed to nonlinear effects such as four-wave mixing and self-phase modulation, restrict the high-power ultrashort pulse output. To overcome this limitation, chirped pulse amplification has been proposed. The laser pulse is first stretched temporally, amplified, and compressed again. This method can effectively suppress phenomena such as self-focusing and pulse splitting caused by nonlinear effects and improve the peak power of laser pulse. In this study, a femtosecond laser amplification system based on all-polarization-maintaining erbium-doped fibers using broadband chirped fiber gratings was reported. Using chirped pulse amplification and group velocity dispersion optimization that combines dispersion compensation fibers with the chirped fiber grating pair with different dispersions, a femtosecond laser pulse with pulse width, peak power, and repetition rate of 63 fs, 35.2 kW, and 59.5 MHz, respectively, was experimentally obtained.Methods The amplification system (Fig.1) proposed herein was divided into two parts, namely, the seed laser and two-stage cascade amplifier. First, an erbium-doped ring fiber laser mode-locked using a graphene saturable absorber was established. Then, the two-stage amplifier was connected to the back of the seed laser and a polarization-maintaining isolator was inserted between the two amplifiers. After preamplification using the first-stage amplifier with a forward pump, the preamplified pulse was stretched using the broadband chirped fiber Bragg grating (CFBG). Next, the group velocity dispersion was compensated for by using the polarization-maintaining dispersion compensation fiber. Subsequently, it was amplified using the main amplifier with a bidirectional pump. The amplified laser pulse was further compressed using another broadband CFBG. Subsequently, we qualitatively analyzed the main influence of the group velocity dispersion difference of the two CFBGs on realizing the high-power ultrashort pulse output.Results and Discussions For seed laser, the laser was pumped with a 976 nm laser with 140 mW average power. The measured pulse width, spectral bandwidth, and average power of the seed laser output were 480 fs, 6.5 nm, and 4.8 mW, respectively. The time-bandwidth product was calculated to be 0.388, which is close to the Fourier transform limit. Moreover, the fundamental repetition rate with respect to the signal-to-noise ratio of 65 dB was measured to be 59.5 MHz (Fig. 4). For preamplified laser, the pulse width was 500 fs (Fig. 5). In the main amplifier stage, CFBG was used to expand the preamplified output laser pulse and the group velocity dispersion in the system was optimized using the dispersion compensation fiber. Finally, the amplified laser pulse was compressed by splicing the opposite port of another CFBG. The study found that the laser pulse was broadened by splicing Port 1 of CFBG 1, amplified using 2.2 m gain fiber with a total pump power of 900 mW, and compressed by splicing Port 2 of CFBG 2, a laser output with an average power, peak power, and pulse width of 110 mW, 1.6 kW, and 1.107 ps, respectively, were obtained (Fig. 6). Then, using the method in which the amplified lase pulse was broadened using CFBG 1 Port 2, amplified using the gain fiber with the same pump power, and compressed using CFBG 2 Port 1, ultrashort laser pulses with an average power, peak power, and pulse width of 132 mW, 35.2 kW, and 63 fs, respectively, were obtained (Fig. 6). Using analysis, the results of the above two laser pulse outputs were attributed to the difference in the group velocity dispersion parameter between CFBGs 1 and 2.Conclusions Herein, a stable femtosecond laser amplification system based on all-polarization-maintaining erbium-doped fibers was established. The system comprised a mode-locked fiber laser source and two-stage amplifier. Two CFBGs with different dispersion parameters were used as a pulse stretcher and compressor for chirped pulse amplification. Finally, an ultrashort pulse laser output with an average power, peak power, and pulse width of 132 mW, 35.2 kW, and 63 fs, was realized. The key role of the group velocity dispersion difference between the two CFBGs in the chirped pulse amplification of the ultrashort pulse output was qualitatively analyzed. As a highly stable ultrafast pulse source, the femtosecond fiber laser system with linear polarization characteristics shows potential applications in scientific research, communication engineering, etc.
May. 20, 2021Vol. 48 Issue 11 1101002 (2021)
Quanwei Jiang, Lanping Zhang, Linhui Guo, Hao Tan, Hualing Wu, Bo Fu, Nisha Zhang, Fengqun Zhang, Weichuan Du, Deyong Wu, and Songxin Gao
Objective The laser diode(LD) coupled with the fiber is an effective and high-quality pump source of fiber and solid lasers. Although this technology is relatively mature, its efficiency, structure, and optical design need to be optimized. The optical alignment and adjustment directly influence the efficiency of the LD module, which has become a restriction in the development of high-efficiency and high-brightness LDs. To improve the efficiency of the LD module, without improving the LD chip itself and electric to optical (e-o) efficiency, reducing the optical loss by the maximum possible extent is a research key. In the optical assembly and adjustment engineering practice, beam collimation has an important impact on LD modules to achieve high brightness, high power, and pigtail output. Furthermore, to ensure smaller divergence, the directivity of the optical axis should also be improved, so as to realize precise beam coupling. In direct LD applications, controlling the direction of the laser beam based only on mechanical alignment is limited by high volume, high cost, and poor stability. Thus, the optical axis should be optically controlled.Methods The pointing error of the fast axis is mainly influenced by the ultraviolet glum solidification technology; however, in practice, we cannot ensure the pointing error accuracy because there exists inherent shrinkage stress when the UV (ultraviolet) glue solidifies. Through an optical method based on the principle of laser refraction propagation in a medium, calibration of fast-axis directivity via a bizarre slow-axis collimation mirror was studied. When light is normally incident upon a medium, the directions of the transmitted light and source light are the same, but at oblique incidence, the directions of the two light beams differ. We employed this basic principle to design a slow-axis collimation mirror with a certain inclination angle according to the relationship, based on Eqs. (1)--(3), between the inclination angle and pointing error of the fast axis to correct the pointing error.Results and Discussions We designed four kinds of slow-axis collimation mirrors with a tilt angle of 0.23°, a lens height of approximately 2 mm, and an edge-thickness difference of approximately 0.009 mm (Table 2). We also measured the central offset along the fast axis with and without the bizarre slow-axis collimation mirror (Fig. 8). The central point coordinate decreased from 1.07 mm to 0.15 mm when the focal length of the Fourier transformation lens was 510 mm. After measurement, the original average deviation of fast-axis directivity was approximately 2.1 mrad; after calibration by our designed slow axis collimation mirror matched with the pointing error of the fast axis, the directivity of the fast axis was maintained at 290 μrad. In this way, the power entering the fiber was maximized, and the efficiency of the coupled fiber was increased. We found that the average pointing error was reduced by an order of magnitude based on the seven-step LD module with pigtail output (Fig. 9). The laser spot was not completely filled with the coupled fiber when the pointing error was high,and some of the laser spot overflowed to the fiber outside (Fig. 10). The fiber would be filled with the laser spot only when the pointing error was lower. Thus, the efficiency of the 60-W fiber-output LD module increased from about 53% to 55%. The power and e-o efficiency of the LD module after calibration were measured (Fig. 11).Conclusions In this research, we proposed a novel method to correct the pointing error of the fast axis by employing a bizarre slow-axis collimation mirror (SAC). This method has applications in high-brightness and high-efficiency LDs with pigtail outputs, and its advantages include not requiring extra devices to compensate for the pointing error of fast axis in existing conditions, so precise compensation can be achieved. The material and machining costs of the SAC are reduced because complex processing is not needed. Globally, domestic advantageous units have reported e-o efficiencies of approximately 51%--53%, whereas the efficiency is approximately 51% overseas. Our technical specifications contribute to the domestic leading efficiency. Our research provides a novel method for high-efficiency LDs with fiber output. In terms of the LD’s direct application, this study has numerous potential applications in laser fuse, radar, ranging, and illumination. We have achieved the goal of applying tens of thousands produced LD modules to a pump source.
Jun. 04, 2021Vol. 48 Issue 11 1101003 (2021)
Luo Wang, Chuanfei Yao, Pingxue Li, Xi Zhang, Yongjing Wu, Xuan Wang, and Linjing Yang
Objective Mid-infrared fiber laser between 2 and 5 μm has many crucial applications, such as military confrontation, medicine, remote sensing, and spectroscopy, making them a research hotspot in the field of laser technology. Recently, researchers used fluoride glass fibers doped with various rare-earth ions as gain medium, and achieved 2.8, 3.2, 3.5, and 3.9 μm mid-infrared signal output. Among them, owing to the advantages, such as great transparency and unique emission spectrum at mid-infrared region, Er 3+-based ZBLAN (Er∶ZBLAN) glass fibers are the most widely used rare-earth doped active gain fiber. The transitions between the energy levels 4I11/2 to 4I13/2 and 4F9/2 to 4I9/2 can emission the signal photon covering 2.7 to 2.9 (2.8 μm) and 3.3 to 3.8 μm (3.5 μm), respectively. The experimental study of 3.5-μm-Er∶ZBLAN has been conducted since the 1990, from the early 655 nm red visible light pumping scheme to 976 and 1976 nm dual-wavelength pumping (DWP) scheme. The output performance has been significantly improved. Continuous wave (CW) laser with maximum output power of 5.6 W, Q-switch, and mode-locked pulse output has been reported. Compared with the experimental study, 3.5-μm-DWP-Er∶ZBLAN is also valuable for advanced research on the theoretical dynamics mechanism because of its complex energy level structure. For example, by exploring suitable fiber parameters and DWP scheme theoretically, the 3.5 μm signal output performance is optimized or the power ratio of dual wavelength signal is controlled. However, such advanced research not only requires repeated running of simulation programs and processes a large amount of simulation data, but always lacks the experimental results as a reference, which puts forward high requirements for convergence speed, convergence accuracy, and guessed value stability of boundary value problem (Bvp) algorithm. The existing theoretical research of 3.5-μm-DWP-Er∶ZBLAN is based on the exploration of the dynamics mechanism, and there is still no report of numerical algorithm. In this paper, we present a novel Bvp algorithm combined with two standard algorithms used in the fiber laser simulation: Relaxation method (RM) and shooting method (SM). We called the new algorithm relaxation-shooting method (RSM). The advantages of RSM are that it avoids the problem of RM's low convergence speed with an inaccurate guessed value, and the problem of diverging easily of SM, which make RSM possesses high convergence speed, convergence accuracy, and stability to guessed value. We believe that the research results of RSM will contribute to the development of the theory of mid-infrared fiber lasers, and guide the subsequent experiments of 2.8-μm-Er∶ZBLAN and 3.5-μm-DWP-Er∶ZBLAN. Methods In this paper, first, we present a numerical model based on 3.5-μm-DWP-Er∶ZBLAN for steady-state analysis of the dynamic mechanism. Then, we investigate two standard Bvp analysis methods used in the field of fiber laser. Besides, we discuss their programs and mechanism of convergence judgment. We analyze the potential advantages of RSM and compile the program of RSM based on the characteristics and limitations of the two standard algorithms. Then, the simulated and experimental results in the classical literature are restored using RSM algorithm, which verifies the accuracy of the numerical model and Bvp algorithm. Finally, we discuss the convergence speed, computation time, and stability to guessed value of RSM. The results were compared with RM at the same pump scheme.Results and Discussions Fig. 7 shows the stability comparison between RM and RSM for 3.44 μm signal guessed value at three DWP schemes. It is worth noting that the actual values of Ps2+(0) at three various pumping schemes can be obtained at around 0.7320, 1.2125, and 1.6336 W, and there is a minimum number of cycles of RM near the actual value. However, as the guessed value of Ps2+(0) drifts to the left or right, the number of cycles of RM increases rapidly, and it will increase to several times at the deviation of ±0.3 W. The total number of cycles of RSM is always lower than RM, and there is no obvious increase in number of cycles. Besides, the higher the deviation, the more obvious the advantage of RSM. There is no solution divergence in the whole computation process, indicating the stability of RSM to guessed value. Fig. 8 shows the comparison of convergence speed and accuracy between RM and RSM at three DWP schemes. The guessed value deviation was set at -0.3 W. We obtain that the RSM can converge at about ten cycles; absolute error of the last iteration is several orders of magnitude lower than the allowable error. The RM method requires 60 to 120 iterations to meet the given accuracy requirements. The result showed that RSM possesses higher convergence speed and convergence accuracy than the standard RM algorithm. Fig. 10 shows the test of total computational time when the initial guessed value was set at~0.3 W. We obtain that the total computational time of RSM is always lower than RM at the accuracy requirement range from 10 -4 to 10 -10, at three DWP schemes. When the maximum allowable error is set at 10 -10, the computational time is lower than 1/10 of using the RM method, which intuitively illustrates the RSM's actual calculation effect. Conclusions In this paper, we present a novel Bvp algorithm called RSM, combined with two standard algorithms used in the field of steady-state analysis of fiber lasers, and based on the numerical model of 3.5-μm-DWP-Er∶ZBLAN. The results show that RSM has more obvious advantages in convergence speed, convergence accuracy, and stability to guessed value compared with RM. Besides, the RSM algorithm has the advantages of SM at high accuracy requirement, which can greatly reduce the number of cycles required for refining initial guessed value. The problem of diverging easily of SM when the solution of initial value problem (Ivp) is unstable, but it is can be solved by introducing a part of pre-convergence of RM. In addition, the stability of RSM to guessed value is much higher than RM; thus, it is no necessary to input a greatly accurate initial guessed value before simulation. However, the less accurate the guessed value, the more obvious the advantage of computation efficiency. In this study, the convergence speed of RSM can reach more than ten times of RM, making it suitable for the field of 3.5-μm-DWP-Er∶ZBLAN where reports of experimental and theoretical research are relatively rare. We believe that our research of RSM will contribute to the development of theoretical research of mid-infrared fiber lasers, and guide the subsequent experiments of 2.8-μm-Er∶ZBLAN and 3.5-μm-DWP-Er∶ZBLAN.
May. 20, 2021Vol. 48 Issue 11 1101004 (2021)
Hehe Dong, Shikai Wang, Zhongyue Wang, Chunlei Yu, Chongyun Shao, Wei Wei, and Lili Hu
Objective Compared with the traditional pump light source of 915 nm or 975 nm diode lasers, the 1018 nm Yb 3+-doped fiber laser (YDFL) with a tandem-pumping structure is a high-efficiency pump light source for high-power lasers and offers the advantages of excellent beam quality, high brightness, and low quantum loss. However, the output power of the 1018 nm YDFL is severely limited by the competition between the 1018 nm signal and the amplified spontaneous emission (ASE) mode. Consequently, the efficiency of the 1018 nm fiber laser is significantly lower than the theoretical efficiency of the system, which is mainly attributed to the selection of the gain fiber. The absorption and fluorescence intensity of the traditional Yb 3+-doped silica fiber at 1018 nm are weak, which reduces the overall conversion efficiency of the laser system and limits the further development of 1018 nm tandem-pumping technology. To improve the overall conversion efficiency of the laser system, two key materials—Yb 3+-doped silica fiber generating 1018 nm laser light using 976 nm laser diode (LD) pumping and another Yb 3+-doped silica fiber for absorbing the 1018 nm pump light—must be optimized urgently. For the former, the fluorescence at 1018 nm must be increased, whereas for the latter, the absorption at 1018 nm must be increased. Therefore, improving the absorption and fluorescence of Yb 3+ ions at 1018 nm by introducing codopants into the Yb 3+-doped silica glass to change the coordination environment of Yb 3+ ions is the key to improving the overall conversion efficiency of tandem-pumped silica-based YDFL systems. Methods Herein, Yb-Al (YA) double-doped, Yb-Al-P (YAP) triple-doped, and Yb-P (YP) double-doped silica glasses were prepared using the sol-gel method combined with nanopowder sintering technology. The influence of Al and P codoping on the spectral characteristics of 1018 nm silica glass was systematically studied. By analyzing the difference in the Stark energy level splitting of Yb 3+ ions for different doping systems of silica glass, the influence of different codoping on the 1018 nm spectral performance was explained. Moreover, Raman spectroscopy and ultralow temperature (4 K) electron paramagnetic resonance (EPR) spectroscopy were combined to explore the influencing mechanism from the perspectives of glass structures and rare earth ion coordination environments. Results and Discussions Currently, the spectral properties of the Yb 3+-doped multicomponent glass have been extensively studied; however, the spectral properties of the Yb 3+-doped silica glass at 1018 nm have rarely been reported. Here, the change rule of the spectral characteristics of silica glass at 1018 nm in three codoped systems of YA, YAP, and YP (Fig. 2, Fig. 3, and Fig. 4, respectively) were systematically studied. Furthermore, the reasons for the influence of different codoping on the 1018 nm fluorescence were explained based on the difference in the Stark energy level splitting of Yb 3+ ions (Table 2). Additionally, by comparing the normalized spectral properties of the best samples in different doping systems, the absorption and fluorescence intensities of the YP series at 1018 nm were found to be better than those of the YA and YAP series (Fig. 6). Moreover, Raman spectroscopy and ultralow temperature electron paramagnetic resonance spectroscopy were combined to prove the influence of Yb 3+ microenvironments on the spectral performance (Fig. 7 and Fig. 8). Conclusions In the Yb 3+-doped silica glass system, increasing the doping content of Al 3+ induced the red shift of the absorption subpeak near 915 nm and enhanced the absorption at 1018 nm. Increasing the doping concentration of P 5+/Al 3+decreased the overall optical performance, which was significantly reduced when the molar ratio of P 5+ to Al 3+>1. Increasing the P 5+-ion doping content induced the blue shift of the fluorescence subpeak near 1030 nm. When the P 5+-ion doping concentration (molar fraction) was 8%, the fluorescence subpeak blue shifted to 1018 nm. Moreover, the absorption and fluorescence intensities of Yb 3+ ions at 1018 nm decreased as the P 5+-ion doping content further increased. By comparing the normalized spectra of the best samples from different series, the normalized fluorescence intensity of YP series at 1018 nm was significantly better than those of the other two series. In the YA series, rare earth ions were in an “Al-rich” environment and Yb—O—Si connections were gradually replaced by Yb—O—Al connections. In the YAP series, most Yb—O—Si connections were replaced by Yb—O—Al and Yb—O—P connections when the molar ratio of P 5+ to Al 3+5+ to Al 3+≥1. This indicates that the encapsulation of P 5+ by rare earth ions was better than that of Al 3+, i.e., the solubility of P 5+ in rare earth ions was greater than that of Al 3+. In the YP series, rare earth ions were in a “P-rich” environment and most Yb—O—Si connections were replaced by Yb—O—P connections. This is because the coordination environment of Yb 3+ ions in the codoping silica glass systems of YA, YAP, and YP was completely different, resulting in different spectral characteristics of Yb 3+ in these three systems at 1018 nm.
Jun. 04, 2021Vol. 48 Issue 11 1103001 (2021)
Qunli Zhang, Jian Lin, Zhijun Chen, Zehao Tang, Hua Huang, Yuan’an Gao, and Jianhua Yao
Objective Heavy load bearing is an essential part of heavy load mechanical equipment, which plays the role of supporting a rotating body. Wind power bearing in wind power generation equipment is a typical heavy load bearing. To obtain wind power bearing with excellent comprehensive performance and high service life as well as maintain the stability of wind turbine, higher requirements are put forward for the depth and uniformity of hardened layer of main shaft bearing raceway. In this study, the depth and uniformity of the hardened layer of a workpiece after laser quenching are improved by adding electromagnetic induction auxiliary heating, and the heating and cooling rates are adjusted to transfer more heat to the depth of the material, so as to achieve deeper hardened layer. In the quenching process, the dual heat sources interact. Therefore, it is necessary to investigate the phase transformation process of electromagnetic induction-assisted laser quenching. This research will provide a reference for high-quality deep strengthening of high-end equipment parts under heavy load conditions.Methods The MSC. Marc software is employed to establish the physical models of hybrid quenching and laser quenching processes, and the meshes in different areas of the models are densified in different degrees. Because the temperature of the workpiece changes markedly during quenching, the thermophysical parameters of the material at different temperatures are considered in the models. In addition, the initial and boundary conditions of the models are set according to the working conditions. The accuracy of the model is verified by the temperature curve of the characteristic points and morphology of the hardened layer. In the verified model, the evolution of the temperature field, phase transformation process, and uniformity of the hardened layer in the dual heat source hybrid quenching process are studied.Results and Discussions The average relative error between the measured and simulated temperature curves is less than 15% (Fig. 8). Under the forced cooling of the coolant, the cooling rates of the hybrid quenching and laser quenching attain high levels in the whole cooling stage (Fig. 13), which meets the martensitic transformation conditions. The range of austenitizing and martensitic transformation on the surface of the workpiece can be enlarged by the secondary heat source heating. After the hybrid quenching, the depth of the hardened layer is small at the head and tail, and is large in the middle. The martensite formed in the stable stage is very flat (Fig. 14). From the cross-section of the hybrid quenching hardened layer, the width and depth is 34.7 mm and 5.9 mm, respectively; the area ratio of the hardened layer to the rectangle is 83.4%. The side angle between the boundary of the hardened layer and the vertical direction is 29.4°. After the laser quenching, the depth and width of the hardened layer are 3.5 and 29.6 mm (Fig. 16), the area ratio of the hardened layer to the rectangle is 70.3%, and the side angle is 46.8°.Conclusions The phase transformation process of hybrid quenching is investigated, and an electromagnetic induction and laser coupling quenching model is established. The simulated temperature history of characteristic points and the profile of the hardened layer agree well with the experiment results, which verify the reliability of the established model. Compared with single laser quenching, the hybrid quenching can increase the austenitizing area on the surface of the workpiece, expand the range of martensitic transformation, and improve the depth and width of the hardened layer. After the hybrid quenching, the hardness fluctuation of the hardened layer in the horizontal direction decreases, the proportion of the hardened layer area increases, the crescent side angle decreases, and the uniformity of the hardened layer is improved. The electromagnetic induction-assisted laser quenching can break through the limit depth of single laser quenching and obtain a well-balanced hardened layer, which can provide guidance for deep quenching of high-end equipment parts under heavy load conditions.
Jun. 04, 2021Vol. 48 Issue 11 1103002 (2021)
Zhenkun Liang, Xiao Li, Zhibin Wang, Kewu Li, and Xiaoyang Zang
Objective With the advantages of high modulation precision, high efficiency, and wide spectral range, photo-elastic modulation technology has attracted considerable attention in many fields, such as optical communication, polarization analysis, and spectral analysis. A series of devices with a photo-elastic modulator as the core are widely used in material detection, scientific research, aerospace, and national defense construction. The basic principle of the photo-elastic modulator is to use the anisotropic crystal of a piezoelectric crystal to provide the external mechanical force, so as to make the photo-elastic crystal produce birefringence. It is a thermal-mechanical-electrical coupling resonant device consisting of photo-elastic and electro-optic crystals. In the working process, the driving circuit provides a high-voltage sine wave signal for the piezoelectric crystal in the vertical direction, making the piezoelectric crystal vibrate horizontally and causing the elastic crystal to deform accordingly, therefore producing periodic birefringence to achieve phase modulation of incident light. The phase modulation amplitude is positively correlated with the voltage amplitude output by the drive circuit. The driving voltage amplitude is positively correlated. When the amplitudes of the driving voltage and phase modulation increase, the piezoelectric quartz and photo-elastic crystal consisting of the photo-elastic modulator will produce thermal loss during mechanical vibration. This will result in the shift of the resonance frequency, making it become a challenge to keep the optical path difference consistent for a long time, which reduces the photo-elastic modulator's stability and modulation efficiency. Besides, the change in the external environment will reduce the modulator's stability. Thus, the stability technology of the photo-elastic modulator plays a significant role.Methods In this study, starting from the structure of the photo-elastic modulator, according to the vibration model of the photo-elastic modulator, the influencing factors of the temperature drift of the photo-elastic modulator are analyzed. The conventional optical system with a photo-elastic modulator as the core is developed. According to the Stokes parameter, Muller matrix, and digital phase-locking technology, the relationship between the driving signal and the phase modulation amplitude is finally obtained, and the correlation function diagram is drawn. Thus, a drive voltage adaptive adjustment method based on a field-programmable gate array (FPGA) is proposed. Direct digital synthesis (DDS) technology is used to control the square wave signal of a photo-elastic modulator. After being amplified by the LC resonant circuit, a high-voltage sine wave is generated to drive the photo-elastic modulator. The incident light is modulated by the photo-elastic modulator and received by the detector. The optical signal is converted into an electrical signal, which is transmitted to FPGA through an analog-to-digital sampling module. By using digital phase-locked technology, we multiply and accumulate the acquisition signal with the quadruple frequency reference signal in the memory to obtain the quadruple frequency correlation component in the acquisition signal, and similarly multiply and accumulate the acquisition signal and the double frequency reference signal to obtain the double frequency correlation component. The relationship between the ratio of the quadruple frequency component to the double frequency component and the phase modulation amplitude is analyzed. The duty cycle is adjusted in real-time according to the ratio of the quadruple and second harmonic frequencies in each cycle. If the ratio obtained in the next cycle is smaller than that in the previous cycle, the duty cycle will increase; otherwise, it will decrease. Finally, the phase modulation amplitude will be stabilized at a fixed range. In the system, two key points need to be determined in advance. One is the resonant frequency of the photo-elastic modulator, and the other is the unit adjustment of the driving square wave duty cycle. Since the external temperature and thermal effect of the photo-elastic modulator affect the change of its resonant frequency, it is essential to determine the resonant frequency of the photo-elastic modulator in the test environment first. The key to the single adjustment of the duty cycle in the feedback control is that, to prevent excessive feedback regulation, and it is essential to ensure that the duty cycle adjustment amplitude is less than the setting value of the phase modulation amplitude. However, the duty cycle adjustment amplitude should be larger than the fluctuation of the phase amplitude after temperature drift, therefore preventing the lack of control due to the lack of amplitude modulation. At room temperature of 25 ℃, the photo-elastic modulator was powered for 15 min. According to the sweep frequency test, the resonant frequency under current temperature is determined. The two tests are conducted to determine the conversion relationship among the duty cycle, driving voltage, and phase modulation amplitude, so as to determine the regulation value of the duty cycle unit.Results and Discussions The stability of the system is tested by experiments. Compared with the previous studies (Table 1), the accuracy has been significantly improved. When the incident light wavelength is 632.8 nm, the phase modulation amplitude accuracy is 0.82% at the half-wave state and 0.44% at the quarter-wave state [Fig. 11 (a) and Fig. 12]. The constant temperature control method is more stringent for the device and environment. The frequency control method is not conducive for data processing after application. The voltage regulation has none of the above shortcomings, and the accuracy is higher than that of the above two methods.Conclusions Based on the temperature drift model and digital phase-locked technology, the phase modulation amplitude stability control of the photo-elastic modulator is realized. The experimental results show that the voltage self-regulation method has higher accuracy, a wide application range, and more convenient for subsequent data processing than the existing temperature control and frequency regulation methods. It has important theoretical significance for improving the accuracy and reliability evaluation of phase modulation amplitude control system.
May. 21, 2021Vol. 48 Issue 11 1104001 (2021)
Weiming Li, Feng Mei, Zeng Hu, Xingyu Gao, and Haoyong Yu
Objective Line-structured light three-dimensional (3D) measurement system is widely used in object measurement, target detection, and other fields. The laser stripe center extraction algorithm is the key technology in the system. The center of robust and uniform laser stripe is easily extracted. However, in many industrial environments, there are some uncertain poor reflection factors, such as dirt and rust on the surface of the measured object and the bad laser emitting quality, leading to the existence of low and uneven brightness areas in the laser stripe images. Compared with the robust region, the pixel value of the robust region is close to 255 and differs greatly from the background pixel value. However, the pixel value of these low and uneven brightness areas is random and uncertain. Thus, it is not easy to select the appropriate pixel threshold accurately using the fixed threshold method. If the threshold is not selected properly, it can easily lead to a bad extraction result. Many existing algorithms cannot easily determine the appropriate pixel threshold in these areas. They tend to cause a larger calculation error and disconnection of the laser stripe centers in these areas. Thus, it is essential to improve the self-adaptability of the center extraction algorithm to solve this problem and improve robustness. At the same time, the complexity of many existing algorithms is high, and redundant scanning for the image region without laser stripe decreases the speed of the algorithms. The laser stripe center calculation is only related to the laser stripe itself and its surrounding pixels.Methods This study proposes an internal propulsion algorithm for laser stripe center extraction. First, according to the distribution characteristics of the laser stripe in the image, the algorithm uses an internal propulsion strategy to plan the search path. The search path moves forward or backward along the center of the stripe to reduce processing image regions without laser stripes; thereby, improving the computational speed of the laser stripe center. Besides, the 8-connectivity search is used to eliminate noise points when searching the starting point of internal propulsion. Second, the proposed internal propulsion algorithm is inspired by the mean shift algorithm, which is an unsupervised iterative clustering algorithm in the field of machine learning. This algorithm draws lessons from the idea of moving, updating, and ending of the mean shift algorithm. The internal propulsion algorithm also belongs to a clustering algorithm. The core process is as follows: calculate the initial center first, move forward or backward a pixel as prediction center, calculate the new threshold using the proposed adaptive threshold method, calculate the new center point, update the center point, and repeat until the end. Among them, the calculation of the center uses the geometric center method. The geometric center method extracts the laser stripe center using the geometric centroid of the upper and lower boundaries of the laser stripe cross-section. The stripe boundary is determined by the pixel threshold. The proposed algorithm uses the improved Otsu adaptive threshold method to update the threshold during internal propulsion continuously. The traditional Otsu method is a global threshold method. However, the global threshold method is not easy to consider the detailed segmentation, and it requires high calculation. In this study, the traditional Otsu method is improved to extract the laser stripe center. Let the global threshold become multi-threshold, and the maximum between-class variance is computed for each column pixel of the laser stripe within a limited length to determine the threshold so that each column of the laser stripe has an optimal center calculation threshold.Results and Discussions The proposed algorithm uses an internal propulsion strategy to plan the search path and reduce processing image regions without laser stripes. Thus, it improves the computational speed of the laser stripe center (Table 3). The improved Otsu adaptive threshold method overcomes the inappropriateness of the global threshold to detailed segmentation and reduces computational effort. Besides, it makes the laser stripe center extraction more robust. Using the improved Otsu adaptive threshold method, the proposed algorithm significantly improves the robustness and accuracy of center extraction. It solves the problem of disconnection in the low and uneven brightness stripe areas (Fig.13). It also reduces center extraction error, especially in low and uneven brightness areas (Tables 1 and 2). Finally, the proposed algorithm has good anti-noise properties when adding noise to the experiment images (Table 4).Conclusions This study proposes an internal propulsion algorithm for laser stripe center extraction. The experimental results show that the proposed algorithm has low complexity, fast running speed, good robustness, and high accuracy. The proposed algorithm achieves excellent anti-noise effect after adding noise points. In particular, the internal propulsion algorithm can reduce processing image regions without laser stripes and has a good extraction effect on the non-robust laser stripe with low and uneven brightness areas. Owing to these advantages, the proposed algorithm will be of great significance in many industrial applications, such as online product inspection and welding seam tracing, especially when fast speed and good robustness are required in real working conditions where the reflectivity of the object surface is complicated and bad.
Jun. 08, 2021Vol. 48 Issue 11 1104002 (2021)
Zhuyue Li, Maosheng Hou, Zhichao Liu, and Lijuan Li
Objective Large-size measurements are usually accomplished through multistation measurements. The accuracy of the instrument, environmental vibration, temperature change, and other factors severely affect the accuracy of the transfer station. To improve the accuracy of large-size measurements, many scholars have conducted extensive research on large-size measurement errors and proposed numerous compensation methods to achieve the accuracy of large-size measurements. However, most compensation methods compensate for the measurement errors by reducing the measurement errors. Moreover, research on the effect of temperature on the measurement results is relatively rare. In fact, the error caused by changes in temperature has severe impacts on the measurement accuracy. Additionally, the experimental steps of most temperature compensation methods are complicated, the model is difficult to solve, and the research object is a regular rectangular or wedge-shaped tooling structure; these disadvantages limit the application of such methods. No study has discussed the characteristics of the variable curvature workpiece, owing to which these compensations exhibit strong limitations in improving the accuracy of large-size transfer stations. To ensure the manufacturing and assembly accuracy of large-size variable curvature components on the actual site and decrease the large-scale measurement cycle, a new method for compensating thermal deformation errors of large-scale transfer stations is proposed and numerous related experiments are designed. Experimental results show that the proposed method can effectively improve the transfer accuracy of large-scale measurements.Methods The new method for compensating thermal deformation errors of large-size transfer stations is a universal method. First, several temperature values and reference point coordinates are obtained using the fiber Bragg grating temperature sensor and laser tracker. Then, all the measured coordinates are converted into the global coordinate system using the station alignment method and the changes in temperature at different stations are calculated. Next, the linear regression analysis method is used to establish a mathematical model between the thermal deformation of the reference point and the change in temperature using these recorded experimental data. The linear regression analysis method is also used to calculate the thermal deformation coefficient matrix in the global coordinate system. Then, ANSYS is used to simulate the thermal deformation. The comparison and analysis of the simulated thermal deformation offset data of the reference point with the offset obtained using the measurement confirm the consistency of the two trends. Finally, the coordinates of the reference point in the subsequent measurements are obtained using the mathematical model of thermal deformation offset established using the following compensation method: the compensated theoretical coordinates are aligned with the actual measured values for the transfer station and the transfer station error caused by thermal deformation is compensated during the measurement of the large-size variable curvature transfer station.Results and Discussions To verify that the proposed method for compensating thermal deformation errors of the large-size transfer station can improve the accuracy of the transfer station, multiple sets of uniform temperature field transfer station experiments are designed. According to the transfer results (Table 2), after the simulation thermal compensation, the maximum point error of the four transfers is reduced by 50%--65% compared with the uncompensated one. Moreover, the overall transfer accuracy is improved by 63%--76%. After the thermal deformation coefficient compensation, the maximum point error of the four transfers is reduced by more than 70% compared with the uncompensated one. Additionally, the overall transfer accuracy is increased by more than 80%. Subsequently, a nonuniform temperature field experiment is designed. According to the error table of the nonuniform temperature field transfer station (Table 4), the transfer station error formed when directly transferred to the station is extremely large, with a total error of 1409 μm. After the compensation, the transfer station error is reduced by 68.87%. After the thermal deformation coefficient compensation, the transfer station error is reduced by 76.26%. These results can be observed more intuitively using the error map of the nonuniform temperature field transfer station (Fig. 9). After the compensation, the transfer error of each point is considerably reduced. The above experimental results show that after the thermal deformation coefficient compensation, the accuracy of the transfer station is considerably improved and the efficiency is significantly higher than that of the simulation compensation method.Conclusions This work proposes a new method for compensating thermal deformation errors of large-size transfer stations. Based on the experimentally measured temperature and reference point coordinates, the mathematical relationship between changes in temperature and reference point offsets is established; then, ANSYS is applied to component physics. The model is simulated, and a mathematical model for thermal deformation error compensation is established. By comparing the experimental measurement data with the finite element simulation data, the consistency between the deformation of the simulation and experimental reference points is confirmed. Finally, according to the thermal compensation mathematical model, the reference point offset when the temperature changes is reversed and the difference between the reference point coordinates under the influence of temperature is compensated. Furthermore, the actual transfer station experiment is designed and the proposed method is used to compensate the offset of the reference point coordinates measured in the uniform temperature field, improving the accuracy of the transfer station by 81.28%. This proves that the proposed method affects the temperature. The effectiveness and superiority of compensation are verified. Finally, the temperature of the experimental site is changed, large-size space assembly site is simulated, nonuniform temperature field measurement experiment is conducted, and thermal deformation offset of the the reference point coordinates is compensated at different temperatures using the proposed method. The accuracy of the transfer station is improved by 76.26%, which is considerably higher than that of the simulation compensation. These findings confirm that the proposed method is beneficial for improving the accuracy of the transfer station and has important engineering practical significance for transfer station measurements of large-size variable curvature components.
May. 21, 2021Vol. 48 Issue 11 1104003 (2021)
Xin Zhang, Ke Yin, Jianghua Zhang, Qinghui Deng, Xin Zheng, Xiangai Cheng, and Tian Jiang
May. 20, 2021Vol. 48 Issue 11 1116002 (2021)
Xiang Jin, Xiaoquan Song, Jiaxin Liu, Long Yun, and Shiyong Shao
Objective In the atmospheric boundary layer, studying the formation and development of turbulence is of significant interest to numerical weather prediction, atmospheric dynamics, mechanical structure safety of wind power equipment, and aviation safety. The refractive index structure constant Cn2 and turbulent energy dissipation rate ε are commonly used parameters for studying the intensity of atmospheric turbulence. Traditional observation methods rely on meteorological elements, such as temperature, pressure, humidity, and wind field obtained from radiosondes. Micro-temperature sensors, ultrasonic anemometers, and wind profile radars, combine with corresponding methods to obtain atmospheric turbulence parameters. A new observation method based on lidar observation of atmospheric turbulence parameters has been widely studied. Compared with traditional observation methods, lidar can detect vertical profiles round the clock and high temporal-spatial resolution. In this study, we present the estimation of Cn2 and ε based on the coherent Doppler wind lidar observation data with second-level time resolution, combined with the temperature and pressure diurnal variation model. Besides, the vertical change profile of Cn2 round the clock is presented and compared with the vertical velocity variance σa2. We believe that the proposed methods and estimation results can be useful for studying the characteristics of turbulence parameters in the boundary layer, the energy exchange of the land-atmosphere system, and transportation and diffusion of pollutants in coastal urban areas.Methods First, the wind speed data observed by lidar with a signal-to-noise ratio of less than 8 dB and observation height below 60 m are eliminated. The meridional wind υ and zonal wind ν are calculated using the wind speed data after quality control. Then, the US standard atmosphere model is used to simulate changes in temperature and pressure at different altitudes. The GOT01_0 temperature diurnal change model is used to simulate the diurnal temperature change. The potential temperature is calculated based on the empirical relationship between temperature, pressure, and potential temperature. Finally, the refractive index structure constant Cn2 is estimated using the method proposed by Tatarski. By estimating the velocity structure function, the turbulent energy dissipation rate is estimated using the outer scale L0 and the vertical velocity standard deviation σa. The turbulent energy dissipation rate ε and the vertical velocity variance σa2 representing the vertical component of the turbulent kinetic energy were compared with Cn2 to characterize that it is feasible to estimate Cn2 based on the temperature and pressure model. Besides, the influence of each variable required to calculate Cn2 on the calculation result is investigated based on the theory of error analysis to guide for further in-depth research.Results and Discussions The magnitude of Cn2 is between 10 -16 and 10 -13m -2/3. It is mainly concentrated on 10 -16m -2/3, and the refractive index structure in a dry and clean atmosphere in the order of 10 -18 to 10 -13m -2/3 is consistent. As the height increases, Cn2 gradually decreases, indicating that the turbulence intensity decreases as the height increases. The strong turbulence is mainly concentrated below 1 km, and the turbulence intensity is weaker at 1 to 1.5 km, but this trend is not absolute; however, the strong turbulence can reach 1.5 to 2 km (Fig.3). Except for October 18, the other observation days showed a sudden increase in Cn2 between October 17 and 21, and the height rose from 500 to 900 m. It may be due to strong turbulent uplift caused by changes in ground thermal radiation after temperature attenuation and may also be related to the conversion of sea and land wind. The daily variation of Cn2 near the ground presents an obvious “Mexican hat” shape, i.e., during the day, Cn2 is higher than that at night, which is also reflected in 360 m. As the height increases, the hat-shaped diurnal variation gradually disappears, and the diurnal variation of Cn2 at 720 m presents random fluctuations (Fig.5). σa2 and Cn2 have a strong correlation, and the correlation coefficient is above 0.7, indicating the consistency of turbulence in the vertical and horizontal directions. Besides, the correlation decreases when the surface temperature at night decreases. There is a certain correlation between ε and Cn2, when the turbulence is fully mixed and developed during the day; the correlation coefficient is above 0.5. The dynamic range of Cn2 estimated by simulated temperature and pressure is smaller than that estimated by GMAO meteorological data of CALIPSO data (Fig.8), which is mainly caused by the fact that the standard atmospheric profile cannot reflect the randomness of instantaneous temperature change. Conclusions In this study, the wind profile observation data of the coherent Doppler wind lidar in the Yangmeikeng area of Shenzhen are used, combined with the standard atmosphere model, the diurnal temperature model, and the data from the ground weather station. The atmospheric refractive index structure constant Cn2 and turbulent energy dissipation rate ε in the atmospheric boundary layer under clear weather are estimated. The characteristics of temporal and spatial changes are analyzed according to its time-height vertical profile. Besides, we investigated the specific effects of changes in various parameters on Cn2. The high correlation between Cn2 and σa2 estimated based on the horizontal wind showed that the turbulent motion is isotropic. The estimation based on temperature and pressure models is feasible in the absence of measured temperature and pressure profiles. Compared with the calculation results of GMAO standard meteorological data, the estimated Cn2 has a smaller dynamic range, which is due to the absence of instantaneous changes in the simulated temperature profile. To further accurately investigate the changes in turbulence parameters in the Shenzhen area, long-term joint observations with various equipment must guide the study of atmospheric pollutant transport and diffusion and weather changes in the Shenzhen area.
Jun. 02, 2021Vol. 48 Issue 11 1110001 (2021)
Yifan Wang, Qingwen Liu, He Li, Dian Chen, and Zuyuan He
Objective The distributed fiber-optic strain sensor based on the spectra of Rayleigh backscattering can detect static and dynamic signals. In addition, it is immune to interference fading. The Rayleigh scattering spectra of the optical fiber can be obtained using single-shot detection with frequency chirped pulses and matched filters; this solves the contradiction between spatial resolution and sensing distance. The frequency shift detection of Rayleigh scattering is the key in strain sensing. In this study, a Rayleigh frequency shift detection algorithm based on the frequency axis is proposed and verified in a configuration with chirped pulses and matched filters. Compared with the Rayleigh frequency shift detection algorithm on the distance axis, the signal-to-noise ratio is improved by more than 6 dB in dynamic strain measurement.Methods The proposed system is based on a time-gated digital optical frequency domain reflectometer (TGD-OFDR) configuration (Fig. 1). Light wave from a narrow line-width fiber laser is split into local light and probe light. A filter is used to select the required sideband and suppress high-order harmonics. An erbium-doped fiber amplifier is used to boost the power of the probe pulse. The beat frequency between the Rayleigh backscattering and local oscillator from the balanced photo-detectors is sampled using an oscilloscope. Then, 91 matched filters with a frequency range and interval of 100 MHz and 5 MHz, respectively, are used to filter the beat signals, by which the Rayleigh scattering curves of different frequencies are obtained. At the position where the strain occurs, the spectral shift of Rayleigh backscattering on the frequency axis can be demodulated using a cross-correlation algorithm. The corresponding strain changes can be calculated using this frequency shift. Further, the strain waveform is obtained.Results and Discussions The proposed distributed dynamic strain intensity-demodulation system successfully detects the strain on the optical fiber. By calculating the spectra of different pulses at the same position, the strain changes between pulses can be obtained (Fig. 2). To reduce the frequency interval, cubic spline interpolation is used before the cross-correlation algorithm for better strain resolution (Fig. 3). In the demonstrational experiment, 200 chirped pulses were launched into the fiber in sequence. The frequency-sweeping range of the probe pulse is from 200 MHz to 750 MHz. The width of each pulse is 4 μs, and the measurement period is 100 μs. The sinusoidal vibration with an amplitude of 100 nε applied to the far end of the 10 km fiber was successfully retrieved. The system’s spatial resolution is evaluated by the distribution of the standard deviation of the frequency shift. The distance between 10% and 90% of the rising edge of the vibration area is approximately 1 m, which is the system’s spatial resolution (Fig. 4). Compared with the intensity-demodulation method based on the distance axis, in this system, signal-to-noise ratio is improved from 25.7 dB to 32.5 dB and the frequency resolution is improved from 237 pε/Hz to 157 pε/Hz. The main reason for performance improvement is the usage of more Rayleigh feature information. Moreover, data processing time is reduced from 4.5 s to 0.8 s (Table 1).Conclusions In this study, a distributed strain-sensing technique based on frequency shift of Rayleigh spectrum is proposed. The use of chirped pulses and matched filters eliminates the contradiction between spatial resolution and dynamic range, where the system’s spatial resolution is obtained using the frequency range instead of the pulse width. Compared with the spectral demodulation on the distance axis, the proposed data processing algorithm can reduce the amount of calculation and make full use of Rayleigh graphic information to improve the signal-to-noise ratio of the system. Combined with the advantages of high spatial resolution, high response bandwidth, high signal-to-noise ratio, and large strain range, the scheme has great potential in dynamic strain-sensing applications.
Jun. 08, 2021Vol. 48 Issue 11 1110002 (2021)
Aili Wang, Yuxiao Zhang, Haibin Wu, Kaiyuan Jiang, and Yuji Iwahori
Objective LiDAR, as an essential technical means of obtaining physical attributes of ground objects, is widely used in remote sensing image classification research. Recently, deep learning algorithms that use multilayer nonlinear transformation methods to automatically extract features have become mainstream in the field of image processing. Traditional convolutional neural networks (CNNs) use neurons as the unit for processing data. Each neuron can only recognize one pattern and is not sensitive to the direction and position information of objects in the image. To overcome this shortcoming of CNN, CapsNet is used in the field of image classification. However, the capsule network is a lightweight neural network, and its network structure indicates that the feature capture ability is still lacking compared with the deep network. Aiming at the above two problems, this study proposes a LiDAR data classification algorithm that combines capsule network and dilated convolution. The features extracted by the residual network combined with the dilated convolution are used as the input of the capsule network to enhance the feature capture capability of the lightweight capsule network. Dilated convolution can expand the receptive field of the convolutional layer without increasing network parameters. The capsule network uses capsules as a data processing unit in its internal structure and adopts a dynamic routing algorithm for data transfer between capsule layers. It has better feature expression capabilities than CNN. Thus, the proposed method can improve the classification performance of LiDAR data.Methods The LiDAR data classification algorithm that combines the capsule network and dilated convolution is proposed. First, input the LiDAR data into the dilated convolution capsule network (DCCN) model, which uses the first three layers of the residual network to perform rough feature extraction on the LiDAR data, and the latter two layers use dilated convolution instead of traditional convolution to obtain detailed features of LiDAR images of different scales. Among them, the design of the dilation rate adopts the odd-even mixed method to avoid the gridding effect. Since the capsule network converts each neuron of the traditional neural network from a scalar to a vector, the modeling of the internal structure of the image presents a certain semantic relationship. At the same time, the excellent characteristics of the spatial information of the image are retained. The feature extracted from the residual network combined with dilated convolution is used as the input of the capsule network, the convolutional layer of the capsule network is used to capture data features, and batch normalization is used in the convolutional layer to solve the problem of poor initialization and ensure gradient propagates to each layer. Then, output the feature map and reform it into several main capsules. The coupling coefficient is obtained through dynamic routing, and the conversion from the primary capsule layer to the digital capsule layer is completed. Finally, the classification results of various features are obtained according to the length of each vector in the digital capsule layer.Results and Discussions The datasets used in this article are the Bayview Park and Recology public datasets of the 2012 IEEE International Remote Sensing Image Fusion Competition, both of which were collected in San Francisco, USA. The evaluation index of the classification result of the experiment adopts the overall classification accuracy (OA), average classification accuracy (AA), and Kappa coefficient commonly used in remote sensing image classification. To verify the advantages of the capsule network in time, the training and testing time of the model are used as essential evaluation indicators of the model. First, the proposed DCCN model is compared with the other seven classification algorithms when the training samples are 400, 500, 600, and 700. The results showed that the evaluation indicators of the proposed algorithm are higher than that of the other classification algorithms (Table 2, Table 3). When the number of training samples is 700, the classification accuracy of each category of the two datasets is compared. By comparing the classification results of each category of Dilated-ResNet and DCCN, the classification accuracy of the ground object category with a lower height is significantly improved, which fully proves the sensitivity of the capsule network to spatial feature information (Table 4, Table 5). When the capsule network is used to classify LiDAR data alone, although the overall classification accuracy is low, the training time for the two datasets is only 99.58 and 94.27 s, which saves computational cost. The proposed model uses the residual network extracted features combined with dilated convolution as the input of the capsule network. Although the training time is increased, the slight disadvantage of time is acceptable because it can significantly improve the classification accuracy (Table 6). Finally, the results of all classification algorithms are shown in pseudo-color maps. It can be seen that the DCCN classification boundary is smoother, the marked and background pixels are less misclassified, and they are closer to the real surface object distribution (Fig.10, Fig.11).Conclusions This study proposes the DCCN model used for the ground object classification of LiDAR data, which introduces dilated convolution into ResNet. The dilation rate distribution of dilated convolution is designed using the odd-even mixed method to suppress the gridding effect. The capsule network is used to extract more detailed spatial feature information. This study conducts experiments on two representative LiDAR datasets and compares them with seven typical classification algorithms. The results showed that the designed network classification accuracy performs better. When the number of training samples is 700, the OA on the Bayview Park and Recology datasets reach 97.07% and 96.98%, respectively.
Jun. 04, 2021Vol. 48 Issue 11 1110003 (2021)
Dong He, Shalei Song, Binhui Wang, Xiong Cao, Zhongzheng Liu, and Jinye Zhang
Objective With the development of light detection and ranging (LiDAR) imaging technology, LiDAR imaging from monochromatic detection to multihyperspectral detection has developed into a new trend. Monochrome laser radar point clouds, different from traditional camera or multispectral image data fusion for visual color point cloud, the continuous spectrum of a laser as the light source of multispectral laser radar system can be synchronous detection more spectral channels of the echo signal, which can be directly obtained, have spatial and spectral information integration of point cloud data. This new type of point cloud data, which contains space spectrum information, lays a foundation for realizing three-dimensional point cloud color visualization imaging. Besides, it suggests higher requirements for quality control of the point cloud. This study uses intensity correction, color reconstruction, and color optimization methods to process the point cloud data of the multispectral LiDAR to obtain high-quality visual color point clouds. We believe that our method and research results can be useful for studying the direct acquisition of visual color point clouds by LiDAR.Methods In this study, the point cloud data of our self-developed multispectral LiDAR is considered the research objective. First, an intensity correction model based on the LiDAR equation is proposed. By setting model parameters suitable for multispectral LiDAR, the influence of the angle and distance effect on point cloud intensity is corrected to lay a foundation for visual color point cloud reconstruction. Then, according to the theory of color reconstruction and considering the characteristics of the laser light source spectral power, detection wavelength, and the photoelectric response of the multispectral LiDAR system, a method of using the corrected intensity to reconstruct the color of the point cloud is proposed to realize the color reconstruction of the multispectral LiDAR point cloud. The color of the reconstructed point cloud is optimized using the polynomial regression algorithm to achieve the acquisition of a high-quality visual color point cloud. The color difference analysis of the point cloud before and after optimization is conducted to verify the proposed algorithm feasibility.Results and Discussions The intensity correction model of the multispectral LiDAR is established to effectively correct the distance and angle effects on the intensity. The regression accuracy of each channel correction model is above 0.98 (Fig.2). After the original point cloud correction of the target in the scene, the point cloud strength is significantly enhanced, and the details are highlighted overall (Fig.3). Through the color reconstruction method, the point cloud intensity information of the corrected target is used to obtain the color point cloud that approximated the real scene (Figs.4 (a)). The polynomial regression algorithm is used to obtain the optimal mapping matrix from a series of training colors using parameterized functions. Besides, the matrix is used to optimize the color information of the point cloud, further improving the quality of the color point cloud (Figs.4 (b)). The color difference analysis shows that the color difference between the optimized point cloud color and the real scene reduces to the error range acceptable to the human eye (the color difference is less than 10) (Fig.5).Conclusions Compared with the fusion of single wavelength LiDAR and passive image data to obtain visual color point clouds, multispectral LiDAR has a new approach for obtaining color point clouds. The multispectral LiDAR with multiwavelength and multichannel detection can directly obtain the point cloud data with integrated space-spectral information of the target. Aiming at the point cloud data of the multispectral LiDAR, this study first proposes the intensity correction model of the point cloud data of the multispectral LiDAR, and the feasibility of the model is verified by the measured point cloud data. which lay a foundation for color point cloud reconstruction. Besides, a color reconstruction and optimization method for a point cloud is proposed. The experimental results show that the color point cloud with a certain visual effect is obtained using the color reconstruction and optimization method for the point cloud. The optimization algorithm can significantly improve the visual effect of the multispectral laser point cloud. In the future study, the accuracy of color reconstruction of high point clouds will be further improved, making the reconstruction method more applicable to the reconstruction of complex scenes.
Jun. 08, 2021Vol. 48 Issue 11 1110004 (2021)
Fahua Shen, Peng Zhuang, Bangxin Wang, Chenbo Xie, Chengqun Qiu, Dong Liu, and Yingjian Wang
Objective Wind is a critical variable for applications such as numerical weather prediction and climate study. The direct-detect Rayleigh-Mie Doppler lidar is currently one of the most effective tools for tropospheric to stratospheric wind field detection with high accuracy and spatiotemporal resolution. However, owing to the strong aerosol backscattering and Brillouin backscattering signals in the lower atmosphere, the traditional wind retrieval method for Rayleigh-Mie Doppler lidar yields large retrieval errors of low-altitude atmospheric wind speeds. In this study, we quantitatively analyze the wind speed retrieval error of the traditional wind retrieval method in the low-altitude wind field inversion. Further, we propose a new retrieval algorithm and present its specific steps for Rayleigh-Mie Doppler lidar. The proposed new retrieval method can accurately and simultaneously retrieve wind speeds and aerosol backscattering ratios. We expect that the proposed method can effectively expand the capabilities of the Rayleigh-Mie Doppler lidar for detecting low-altitude wind field and aerosol backscattering ratios.Methods First, factors causing the large retrieval errors in the low-altitude wind field inversion using the traditional retrieval method are analyzed, starting from the principle of wind field detection. Second, considering the influence of Brillouin scattering and Mie scattering, the S6-model-based Rayleigh-Brillouin scattering spectrum model, which is closer to the reality, is used instead of the Gaussian approximate spectrum model. Furthermore, a nonlinear iterative algorithm is used to separate the Rayleigh-Brillouin backscattering signal from the Mie backscattering signal using the signals of energy channel and two edge channels. After combining the above two points, a new retrieval algorithm based on the S6 model and nonlinear iterative method is established, which can simultaneously retrieve the low-altitude wind field and aerosol backscattering ratio. Third, the effectiveness of the proposed retrieval method is verified using the inversion simulation test of the wind field and aerosol backscattering ratio. Finally, based on the measured data of the Rayleigh-Mie Doppler lidar verification system of Anhui institute of optics and fine mechanics (AIOFM) in a comparison experiment with a sounding balloon, the traditional and proposed methods are used to retrieve the horizontal wind speed. By comparing the retrieval results of the horizontal wind speed obtained by employing the two methods using the measured data of the sounding balloon, the advantages of the proposed method in the actual low-altitude wind field inversion are further analyzed and confirmed.Results and Discussions Based on the U.S. standard atmosphere model and design parameters of the Rayleigh-Mie Doppler lidar of AIOFM, the wind speed retrieval error below the 3-km altitude will reach 4--5 m/s and the relative error will exceed 10% within a wind speed range of ±50 m/s using the traditional wind field retrieval method, confirming the necessity of the study on low-altitude wind field retrieval method for Rayleigh-Mie Doppler lidar (Fig. 7). The parameter inversion simulation tests show that the retrieval value of the radial wind speed using the proposed method is obviously closer to the true value than that using the traditional method; additionally, the lower the altitude, the more obvious the advantages of the proposed method (Fig. 9). Moreover, the proposed method can simultaneously retrieve the aerosol backscattering ratio (Fig. 10). Using the measured raw data of the AIOFM Rayleigh-Mie Doppler lidar verification system in a comparison experiment with a sounding balloon, the horizontal wind speed profile retrieved using the proposed method is more consistent with that measured using the sounding balloon on the whole and this observation is particularly obvious below 6 km (Fig. 11). The statistical results of the difference in the horizontal wind speed data pairs measured using the two detection devices at the same altitude further verify that the proposed method has obvious advantages in retrieving the low-altitude wind field compared with the traditional method (Fig. 12).Conclusions To address the problem of large retrieval errors yielded by the traditional wind field retrieval method of Rayleigh-Mie Doppler lidar in the low-altitude wind field inversion, a new retrieval algorithm based on the S6 model of Rayleigh-Brillouin scattering spectrum and nonlinear iterative method is proposed and the specific inversion steps are presents. The results of parameter inversion simulation tests show that the proposed method can simultaneously retrieve the wind speed and aerosol backscattering ratio with high accuracy. The inversion results of actual wind fields using the measured data of the AIOFM Rayleigh-Mie Doppler lidar verification system also show that the horizontal wind speed retrieved using the proposed method is obviously more consistent with the measurement results of the sounding balloon in the comparison experiment in the lower altitude. These findings fully verify that the proposed method can more accurately retrieve the low-altitude wind speed than the traditional method. The proposed low-altitude wind retrieval method can effectively expand the detection capability of Rayleigh-Mie Doppler lidar and has a high practical application value.
May. 20, 2021Vol. 48 Issue 11 1110005 (2021)
Jiang Wang, and Linbao Luo
Significance The sunlight with a wavelength shorter than 280 nm cannot penetrate the atmosphere and reach the surface of the earth, for which the 200--280 nm waveband is typically referred to as solar-blind region. In recent years, solar-blind ultraviolet photodetectors are widely used in military and civil fields such as missile guidance, space secure communications, ozone hole detection, and flame monitoring due to the advantages of low background noise and high sensitivity.In recent years, the studies of solar-blind ultraviolet photodetectors have mainly focused on wide-bandgap semiconductor materials such as AlxGa1-xN, MgxZn1-xO, and Ga2O3. The bandgap of AlxGa1-xN and MgxZn1-xO is located in the solar-blind region mainly by adjusting the relative composition of Al and Mg. Owning to the relatively high adhesion coefficient and low surface mobility of Al atoms, AlxGa1-xN with high Al content will lead to a larger dislocation density of the epitaxial layer, while phase segregation phenomena are often present for MgxZn1-xO with high Mg contents. These factors will lead to poor device performance. Ga2O3 is a representative ultra-wide bandgap semiconductor material, with a typical band ranging from 4.2 to 5.3 eV that almost occupies the entire solar-blind region of the solar spectrum. The relatively large bandgap renders it as an ideal candidate for solar-blind ultraviolet detection application. Thanks to the rapid advances in materials synthesis technique, we has witnessed a significant progress in solar-blind ultraviolet photodetectors based on Ga2O3 in the past decade. By this token, it is necessary to summarize the recent advances, which may be beneficial for bringing out new high-performance devices with new geometries.Progress In the past few years, various fabrication technologies have been widely adopted to synthesize Ga2O3 materials with different crystal structures. For example, in 2004, the β-Ga2O3 single crystals of 1 inch (1 inch=2.54 cm) in diameter have been successfully grown by floating zone for the first time in Japan. Meanwhile, the domestic research on the growth of β-Ga2O3 single crystals has achieved remarkable results. In 2006, Shanghai Institute of Optics and Fine Mechanics employed the same floating zone to grow the β-Ga2O3 single crystal. Meanwhile, Tianjin Institute of Electronic Materials has achieved the growth of 2-inch β-Ga2O3 single crystals by using a new edge-defined film-fed growth method in 2018.What is more, various solar-blind ultraviolet photodetectors composed of different forms of Ga2O3 with a variety of device geometries have been investigated. Some effective device optimization approaches such as controlled doping and light manipulation have been introduced to boost the photoresponse of the Ga2O3 based devices. For instance, Sooyeoun et al. from Korea University fabricated the photodetector based on the back-gated field-effect transistor structure using exfoliated β-Ga2O3 flakes, whose maximum responsivity of the device exceeds 104 A/W (Fig. 4). Tao's research group from Shandong University has fabricated the Ga2O3 field-effect-transistor-based solar-blind photodetector, its responsivity is up to 105 A/W, and the external quantum efficiency exceeds 106%. Besides, our group has reported a catalyst-free vapor-solid growth technique for synthesizing β-Ga2O3 nanowires with single-crystalline quality. The photodetector based on β-Ga2O3 nanowires can operate properly at a large applied bias of 200 V with the responsivity being enhanced to as high as 103 A/W, and the external quantum efficiency can reach 105%. Fang's research group from Fudan University has fabricated a high-performance solar-blind avalanche photodetector based on highly crystallized ZnO-Ga2O3 core-shell heterojunction. The responsivity can reach up to 103 A/W under -10 V bias, and the corresponding external quantum efficiency is as high as 106% [Figs.13(b)--(d)]. Moreover, the solar-blind photodetectors based on Ga2O3 heterojunction, p-n junction, and Schottky junction with typical self-powered behavior can work normally without external power supply, which might find potential application in special environments.Conclusions and Prospects In summary, we has witnessed extensive progress in Ga2O3 materials and solar-blind ultraviolet photodetectors in the past decade. In respect of material synthesis, the Ga2O3 single crystals can be grown at present, and the process route for depositing high-quality and large-area Ga2O3 thin films by MOCVD, MBE, magnetron sputtering, and other technologies is mature. Solar-blind photodetectors based on different forms of Ga2O3 have shown superior device performance including high responsivity and external quantum efficiency. What is more, the dark current of the device is as low as 1 pA, and the response speed is in the order of μs. It is believed that the study of Ga2O3 device will mainly focus on the following aspects. First, We need accurately control the size and morphology of Ga2O3 nanomaterials and develop new approach such as doping to reduce the surface state and control internal defects, which is essential for the development of high-performance devices. Second, the effect of defects on crystal quality in single crystals growth, which is an important factor to grow high quality Ga2O3 single crystal, should be extensively studied. Third, the p-type conductivity of Ga2O3 material remains an unsolved problem, which severely limits its application in optoelectronics and power devices. Finally, relevant integration technologies should be developed to solve the problems of device arrangement and assembly. Large area array detectors are to be developed such as focal plane solar-blind imaging systems with the advantages of low power consumption, small size, good compatibility with CMOS readout circuits, and high integration. Additionally, the development of integrated circuit technology that is suitable for Ga2O3 related focal plane array is also very important. It is believed that through the continuous efforts in this field, the Ga2O3 based solar-blind ultraviolet photodetectors will be able to be applied to national defense military and civilian fields as soon as possible.
Apr. 28, 2021Vol. 48 Issue 11 1100001 (2021)
Mingxing Li, Zhenyu Xu, Ruifeng Kan, Yabai He, Lu Yao, Bing Chen, Jun Ruan, Bangyi Tao, and Hao Liu
Objective As a method for directly observing turbulent motions without parametric assumptions, the eddy correlation method is undoubtedly the most advanced and preferred flux observation method at present. This method is widely used in ecological flux observations. The basic equipment of the eddy-related measurement system mainly includes a three-dimensional ultrasonic anemometer and a gas analyzer, which calculates the flux value using the covariance of the vertical wind speed and concentration fluctuation. To capture tiny concentration variables, the concentration measurement method is crucial. Moreover, the accuracy and sampling frequency of the instrument have high requirements. The commercial gas analyzers use nondispersive infrared technology, which can only achieve a time resolution of 20 Hz, resulting in a loss of high-frequency data. Based on this research background, a new type of gas analyzer for eddy-related systems must be designed, which can achieve high-frequency flux measurements.Methods A laser gas analyzer is developed using laser absorption spectroscopy technology. First, the absorption lines of H2O and CO2 molecules near 7181 and 4990 cm -1, respectively, are simulated based on the HITRAN2012 database. Second, open-path structures are designed based on the absorption intensity of two gas molecules. Third, a miniaturized electronic measurement system is designed, which facilitates laser drive, signal acquisition and processing, and data storage. Thereafter, concentration results are calculated using derivative absorption spectroscopy. To analyze the correlation between a known concentration and the peak value of derivative spectrum signal, the integrated instrument is tested and analyzed in the laboratory using CO2 standard gas with different concentrations. Finally, the integrated gas analyzer is installed on the Yantai National Satellite Ocean Calibration platform for one week to detect real sea-air flux and compared with the LICOR7500-H2O/CO2 analyzer. Results and Discussions We conduct performance tests on the developed prototype. First, the direct absorption and second derivative spectrum signals of the instrument are obtained using different concentrations of CO2 standard gas at normal temperature and pressure in the laboratory [Fig.4 (a) and Fig.4 (b)].The linear correlation between different concentrations and peak values is 0.998 (Fig.5). The result shows that the derivative spectrum technique is suitable for concentration inversion. A 4 h data comparison on the Yantai National Satellite Ocean Calibration platform between the TDLAS-H2O/CO2 and LICOR7500-H2O/CO2 analyzers shows good consistency. Moreover, a 1 s data comparison shows that the former exhibits a higher sampling frequency (100 Hz) and can capture more fluctuations in the concentration than the latter [Fig.7 (a) and Fig.7 (b)]. To analyze the detection limit of the TDLAS-H2O/CO2 analyzer, 20 min stable data are selected for Allan variance analysis. The result shows that the detection limits of the H2O and CO2 analyzers are 8.17×10 -6 and 0.40×10 -6, respectively, when the time resolution is 100 Hz (Fig.8). Overall, the main performances of the TDLAS-H2O/CO2 and LICOR7500-H2O/CO2 analyzers is compared (Table 1). Additionally, for a continuous week, the data results show that the CO2concentration exhibits obvious changes, while the daily change in the H2O concentration is not obviously affected by seawater and rain (Fig.9). Conclusions In this study, the miniaturized laser gas analyzer for the eddy correlation method is integrated using laser absorption spectroscopy technology and derivative absorption spectroscopy. Based on the HITRAN2012 database, the absorption lines of H2O and CO2 molecules near 7181 and near 4990 cm -1 are simulated. Moreover, open-path structures and miniaturized electronic measurement system are designed. The main performances of the integrated analyzer are listed as follows: the detection limits of the H2O and CO2 analyzers are 8.17×10 -6 and 0.40×10 -6, respectively, and the time resolution is 100 Hz. The integrated gas analyzer is installed on the Yantai National Satellite Ocean Calibration platform for one week to detect real sea-air flux and compared with the LICOR7500-H2O/CO2 analyzer. The result shows that the laser gas analyzer is stable and reliable and can be widely used in ecological flux detection applications. Future studies will involve combining the wind speed data of the ultrasonic anemometer to analyze the flux results at the time resolution of 100 Hz and comparing these data with the data at the time resolution of 20 Hz to analyze the contribution value of flux observation.
Jun. 04, 2021Vol. 48 Issue 11 1111001 (2021)
Sen Guo, Xin Zhao, Zhaogang Nie, Lin Ma, Fangteng Zhang, Weiren Zhao, Xinzhong Li, Jiahua Zhang, and Wenchun Zhang
Objective Two-dimensional (2D) transition metal dichalcogenides (TMDs) have attracted significant attention due to their uniquely controllable properties. Their strong excitonic effects dominate the optical and electronic responses in 2D-TMDs. Coulomb interactions among carriers in the exciton formation process give rise to many interesting many-body effects, which affect the exciton resonance energy and subsequent exciton decay. Despite extensive efforts, a detailed discussion of many-body effects during the exciton formation process is still absent. Typically, narrow-band laser excitation was used in previous studies to inject free electron-hole pairs with energy greater than the lowest exciton resonance energy. In contrast, broadband excitation is helpful to exploit the strong exciton absorption and improve the time-resolution in transient experiments. How do multibody effects induced by broadband excitation influence the exciton resonance and exciton formation when high-density carriers are injected? The answer is essential for the understanding of the exciton properties and is helpful to design and control the photoelectric response of 2D-TMDs. Here we report the use of transient absorption spectroscopy with 10 fs time-resolution to address the ultrafast spectral response of many-body effects in the formation of the lowest exciton at the K valley in five-layer MoS2.Methods Multilayer MoS2 samples were prepared by chemical vapor deposition. In the transient absorption spectrum intensity (ΔA) measurements, an 800-nm pulse (1 kHz, 35 fs) output from an amplified Ti: sapphire laser system was first spectrally broadened using self-phase modulation via a hollow core fiber filled with noble gas, and the pulse duration was compressed with a set of chirped mirrors. Then, the 800 nm pulse was used to construct the degenerate pump-probe system [Fig. 1(a)]. The pulse energies and their polarizations were adjusted by a combination of a half-wave plate and a polarizer. The ΔA signal was obtained by measuring the differential absorbance change ΔA = -lg(1+ΔT/T), where ΔT/T=(Ton -Toff)/Toff, Ton and Toff are the intensities of the transmitted probe light passing through the sample with and without pump excitation, respectively. The time resolution for this apparatus is ~10 fs, determined by an autocorrelation trace between the broadband pump and probe pulses [Fig. 1(b)]. During this experiment, pump light was polarized vertically compared with the probe light. The focal spot diameters of the pump and probe beams are ~400 and 200 μm, respectively. The Raman spectral measurement indicates that the sample has five layers [Fig. 2(b)]. Fluence dependence studies confirm that excitation in our experiments occurs in the linear regime.Results and Discussions The broadband laser excitation results in two ground state bleachings (GSB) due to transitions of excitons A and B [Fig. 2(a)] in ΔA spectra [Figs. 3(a) and 3(b)]. The time evolutions of both signals appear to be biphasic, and their global exponential fitting results indicate that the two processes are due to carrier thermalization and cooling, respectively, during the relaxation before the formation of the lowest exciton phase [Fig.3(c)]. With carrier relaxation, the intense many-body effects lead to an obvious temporal evolution of exciton resonance, which can be discerned from the first moment trace. The moment traces of two excitons exhibit a similar initial fast red-shift, followed by a slow blue-shift (Figs. 4 and 5). The initial red-shift takes place within 50 fs, and the blue-shift is almost finished before ~2 ps. Therefore, the exciton resonance positions at 50 fs and 2 ps were extracted as a function of pump power [Figs. 4(c) and 4(d)] and sample temperature [Figs. 5(c) and 5(d)]. The red-shift amplitude increases with increasing pump power and decreases with increasing temperature. For the blue-shift, it decreases with both pump power and sample temperature. The initial red-shift is likely due to the reduction of the repulsive Coulomb interaction between the charges of the same signs, which results in band gap renormalization (BGR). In the following slow process, incomplete compensation of BGR and band-filling effects produce the blue-shift of exciton resonance. The temporal evolution of exciton resonance is further fitted using a bi-exponential function [Figs. 4(e) , 4(f) , 5(e) and 5(f) ]. The results demonstrate that the duration of BGR effect is nearly constant with increasing pump power, whereas, that of the band-filling effect is appreciably prolonged with increasing laser power and sample temperature. This may be due to the hot-phonon effect during the band filling process.Conclusions Femtosecond transient absorption spectroscopy was used to study the optical response of the multibody effect among carriers during the lowest exciton formation process at the K-valley in multilayer MoS2. Many-body effects on exciton resonance occur along with carrier relaxation. The resonance positions of two excitons demonstrate an early instantaneous red-shift and a subsequent slow blue-shift. The red-shift amplitude increases with increasing pump power and decreases with increasing sample temperature. The amplitude of the red-shift reflects the modulation of BGR effect among early free carriers. The blue-shift amplitude after the lowest exciton formation is reduced with increasing laser power and sample temperature. The duration of the BGR effect is almost insensitive to laser power and sample temperature, whereas, that of the band-filling effect is prolonged. Beyond the fundamental interests in physics, the observation of temporal evolution of exciton resonance is helpful to develop effective methods to dynamically control the photoelectric responses of 2D-TMDs.
May. 20, 2021Vol. 48 Issue 11 1111002 (2021)
© Copyright 2018-2021 | Chinese Laser Press.
All Rights Reserved 沪ICP备15018463号-20