


Abstract
A photoelectron, emitted due to the absorption of light quanta as described by the photoelectric effect, is often characterized experimentally by a classical quantity, its momentum. However, since the photoelectron is a quantum object, its rigorous characterization requires the reconstruction of the complete quantum state, the photoelectron’s density matrix. Here we use quantum-state tomography to fully characterize photoelectrons emitted from helium and argon atoms upon absorption of ultrashort, extreme ultraviolet light pulses. While in helium we measure a pure photoelectronic state, in argon, spin–orbit interaction induces entanglement between the ion and the photoelectron, leading to a reduced purity of the photoelectron state. Our work shows how state tomography gives new insights into the fundamental quantum aspects of light-induced electronic processes in matter, bridging the fields of photoelectron spectroscopy and quantum information and offering new spectroscopic possibilities for quantum technology.
Main
The explanation of the photoelectric effect by Einstein in his annus mirabilis in 1905 (ref. 1) was an important catalyst for the development of quantum mechanics. The photoelectric effect occurs when atoms, molecules or solids absorb high-energy photons, resulting in the emission of electrons. Today, this fundamental quantum effect underpins various modern measurement techniques involving electrons, such as microscopy2,3, holography4, diffraction5 and spectroscopy6,7,8. These techniques rely on measuring the photoelectron’s kinetic energy or momentum to gain information about the structural and chemical properties of matter. The advent of attosecond science has led to a paradigm shift in experiments by giving access to both the modulus and the spectral phase variation of the photoelectron momentum distribution9,10. Spectral phase measurements reveal the existence of attosecond delays in photoionization11,12, and this sensitivity to small details of the ionic potential has been used to gain unprecedented insights into electron correlations13,14,15, electron–nuclear couplings in molecules16,17 and the influence of the molecular structure on the photoionization dynamics18, as well as the initial state localization and electron transport in solids19,20,21. Despite the undeniable success of existing attosecond photoelectron interferometry techniques, when the photoelectron spectra result from the incoherent addition of different transition probabilities, the phase extracted from the interferograms cannot be easily and unambiguously related to those of individual ionization channels13,22,23,24. In other words, these techniques work well only if the photoelectron is properly described by a pure state, while the characterization of mixed photoelectronic states remains a problem.
Mixed photoelectronic states are the general rule in photoionization experiments24,25,26,27,28,29. The degrees of freedom of the ion + photoelectron system are often entangled28,29. Consequently, if all involved degrees of freedom are not simultaneously measured (for example, the ion may not be addressable), the (reduced) photoelectron quantum state is a mixed state. Mixed photoelectron quantum states can also arise from uncontrolled experimental fluctuations during the measurements30. In both cases, quantum-state tomography (QST) is required to determine the density matrix characterizing the photoelectron quantum state. Although the terminology is similar, QST should not be confused with three-dimensional photoelectron momentum tomography31,32, which aims at tomographically reconstructing the photoelectron angular distribution. Two methods have been experimentally investigated for QST of electrons in the continuum: frequency-resolved optical gating for mixed states (mixed-FROG)33 and spectral quantum interference for the regularized reconstruction of free-electron states (SQUIRRELS)34. The latter method (SQUIRRELS) aims at characterizing attosecond electron pulse trains in electron transmission microscopy, neglecting the continuous nature of the electron kinetic energy. The former method (mixed-FROG) was used to characterize photoelectrons emitted from neon atoms by absorption of attosecond pulse trains30. In that work, a mixed photoelectron quantum state was measured due to experimental imperfections, referred to as experimental decoherence. The effect of electron–ion entanglement on the photoelectron quantum state could not be measured. This highlights that establishing photoelectron QST as a new tool for the investigation of entanglement and decoherence in atomic and molecular processes requires a very low degree of experimental decoherence.
In this Article, we tomographically reconstruct the quantum state of a photoelectron via the KRAKEN (the Swedish acronym standing for QST of attosecond electron wavepacket) method proposed in ref. 35. We photoionize helium and argon atoms using short extreme ultraviolet (XUV) pulses, populating a broad superposition of continuum states. We reconstruct the continuous variable density matrix of the photoelectron emitted after absorption of a single XUV photon using a delayed, spectrally tunable, bichromatic infrared (IR) pulse as a probe (Fig. 1). By varying the frequency separation of the two spectral components of the probe pulse, we address different off-diagonal elements, allowing us to reconstruct the full density matrix of the photoelectron. We benchmark our protocol in helium, where we measure an almost perfectly pure photoelectronic state, indicating a very low degree of experimentally induced decoherence. In argon, we measure a mixed state with a purity that is consistent with the reduction expected due to entanglement between the ion and the photoelectron, induced by the spin–orbit interaction.
Fig. 1: Principle of the KRAKEN technique.
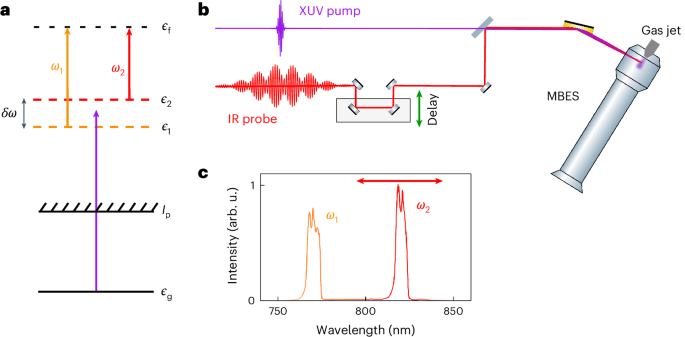
a, An energy diagram of the KRAKEN scheme. A short XUV pulse ionizes the target (purple arrow) and populates a broad superposition of continuum states. Additional absorption of a bichromatic IR photon with frequency components ω1 (orange arrow) and ω2 (red arrow) to a final continuum state with energy ?f induces interference between intermediate continuum states with energy ?1 and ?2. ?g and Ip indicate, respectively, the ground state and the ionization threshold. b, A schematic representation of the experimental setup. An ultrashort XUV pulse and a delayed bichromatic IR pulse are combined and focused in an atomic gas jet. The experiments rely on measuring the kinetic energy of the photoelectrons generated from the interaction with the XUV and IR pulses using a MBES, as a function of the delay between the XUV and the bichromatic probe. c, An example of a bichromatic IR pulse used in the experiment. The spectral intensity is shown in arbitrary units (arb. u.). The red arrow indicates that only the frequency ω2 is changed in the different measurements, while the frequency ω1 is fixed.
Principle of the experiment
Figure 1 schematically presents the principle of the experiment. A femtosecond XUV pulse with 30 eV photon energy, obtained via high-order harmonic generation in a gas cell, ionizes the target, populating a broad superposition of continuum states of energy ?. The total quantum system describing the combined system of photoelectron and ion has a large number of degrees of freedom, which, in most cases, cannot be accessed simultaneously. In our experiment, we address the photoelectron and determine its reduced quantum state by measuring its kinetic energy using a magnetic bottle electron spectrometer (MBES) (Fig. 1b). The population of the photoelectron quantum state, given by the diagonal elements of the density matrix, ρ(?, ?) = 〈?∣ρ∣?〉, can, in principle, be obtained by measuring the photoelectron spectrum, as traditionally done in photoelectron spectroscopy6. The off-diagonal elements of the density matrix, ρ(?1, ?2) = 〈?1∣ρ∣?2〉, referred to as coherences, can only be obtained by interferometry. Here, the coherences are measured using a bichromatic IR pulse with synchronized and phase-locked spectral components (angular frequencies ω1 and ω2)35, which couple, by absorption of an additional photon, the states |?1⟩ and |?2⟩ to the same final state |?f⟩ with energy
?f=?1+??1=?2+??2. (1)
When the delay τ between the pump (XUV) and probe (IR) pulses is varied, the photoelectron yield in the final state oscillates at a frequency δω = ω1 − ω2 (that is, a beating between the two spectral IR components). Extracting the amplitude Aδω(?f) and phase ?δω(?f) of these oscillations allows us to determine one off-diagonal element of the density matrix according to Aδω(?f) ∝ ∣ρ(?1, ?2)∣ and ???(?f)=arg?[?(?1,?2)]. By measuring these quantities as a function of the final photoelectron kinetic energy ?f, a subdiagonal of the density matrix, horizontally shifted from the main diagonal by ?δω, is obtained35. The density matrix is then determined by repeating these measurements for different values of the frequency separation between the two IR spectral components. Note that the proportionality relation between the measured oscillation amplitude and the density matrix amplitude is valid only if the dipole transition between the intermediate states |?1,2⟩ and the final state |?f⟩ varies weakly with kinetic energy and IR wavelength (Supplementary Discussion 1 and Supplementary Fig. 1). In our measurements, the frequency ω1 is fixed and only ω2 is varied (Fig. 1c and Extended Data Fig. 1).
QST of a pure photoelectronic state
Figure 2a shows the photoelectron spectra obtained by ionizing helium as a function of delay τ for seven values of δω. The measurement for δω = 0 gives access to the populations (the diagonal elements in the density matrix ρ). Figure 2b shows, for each δω, the oscillation amplitude Aδω(?f) as a function of the final kinetic energy. The amplitude of the oscillations shows a clearly decreasing trend with increasing δω. In our measurements, the phase of the oscillations only carries information about the properties of the classical ionizing XUV field.
Fig. 2: Experimental results obtained with the KRAKEN protocol in the case of photoionization of helium atoms.
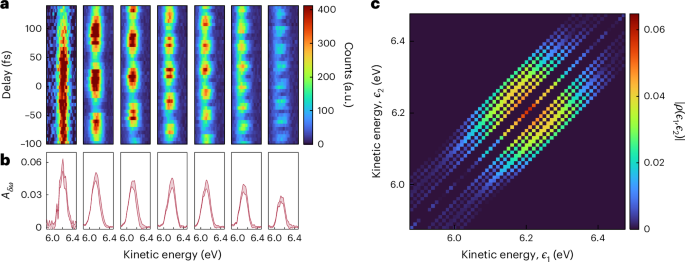
a, Photoelectron spectrograms are acquired for different values of δω (from left to right: ?δω = 0, 41, 61, 80, 98, 117, 134 meV). b, Energy-resolved oscillation amplitude Aδω for the different spectrograms. The shaded area indicates the uncertainty of the fit (1 s.d.; Supplementary Discussion 2). c, The density matrix obtained by inserting the oscillation amplitudes for each δω at the corresponding position in an initially empty density matrix. The dark blue areas correspond to regions of the density matrix that are not reconstructed.
The photoelectron density matrix can be reconstructed by inserting each measured amplitude Aδω at the corresponding subdiagonal of an initially empty density matrix. Figure 2c shows the density matrix after measuring a finite number of subdiagonals, scaled by a global factor to ensure a unit trace and mirrored with respect to the diagonal. The data analysis procedure is presented in detail in Supplementary Discussion 2. The amplitude of the density matrix describes an approximately circular pattern. The dark areas in the density matrix correspond to elements that are not covered by the finite number of measured subdiagonals.
Measuring the full quantum state of photoelectrons is a nontrivial problem due to the continuous nature of the photoelectron energy distribution. This problem is similar to that encountered in quantum-optics experiments aiming, for example, at measuring the density matrix of squeezed quantum states of light36. Different methods such as maximum-likelihood or maximum-entropy reconstructions have been developed to estimate the quantum state based on a finite number of measurements37, and machine-learning techniques have recently been applied to QST38. Here we employ Bayesian estimation using a Hamiltonian Monte Carlo method to extract the density matrix from our measurements as discussed in Supplementary Discussion 3. The results are shown in Fig. 3a. The retrieved density matrix is approximately circular. However, a slight elongation along the diagonal can be observed, with the coherence between continuum states with a large energy separation being reduced. This effect is due to the finite resolution of the electron spectrometer39, which leads to a decrease in the measured photoelectron purity. We compensate for this limitation by measuring the spectrometer response (Extended Data Fig. 2) and feeding the result to the Bayesian estimation algorithm. The new reconstructed quantum state is shown in Fig. 3b. The amplitude of the density matrix has now an almost perfectly circular shape, indicating that the photoelectron is described by an essentially pure coherent state.
Fig. 3: Estimated and calculated photoelectron quantum state in helium.
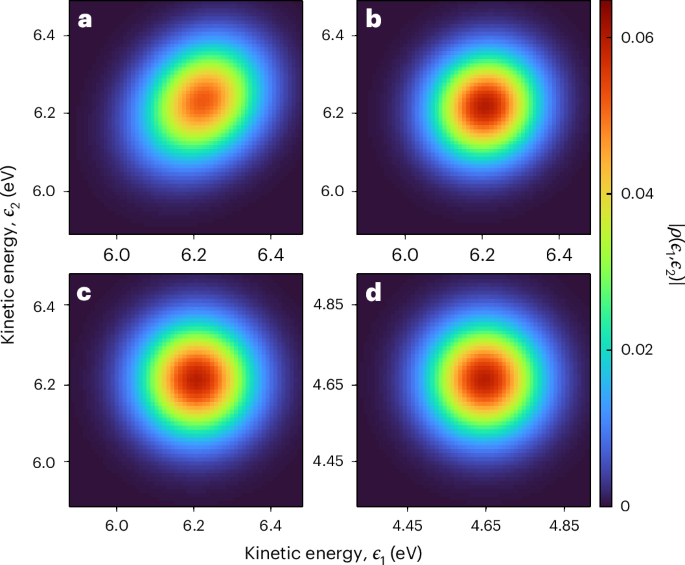
a, The density matrix reconstructed from the experimental data. b, The density matrix reconstructed from the experimental data, accounting for the spectrometer response function in the retrieval algorithm. c, The density matrix predicted by RRPAE using the KRAKEN technique. d, The density matrix predicted by RRPAE for one-photon ionization. For more details on c and d, see equations (3) and (4) in the. The colour bar scale is common to all the panels.
We compare our result with theoretical calculations based on the relativistic random phase approximation with exchange (RRPAE)40. Figure 3c shows the theoretical density matrix obtained from two-photon (XUV–IR) calculations, following a similar procedure as in the experiment, without Bayesian optimization. The experimental (Fig. 3b) and theoretical (Fig. 3c) results are in excellent agreement (Extended data Fig. 3). As a final step, Fig. 3d shows the result of a RRPAE calculation of the density matrix of a photoelectron emitted by absorption of the XUV radiation only (hence the kinetic energy scale, which differs by the energy of one IR photon, 1.55 eV). The photoelectron quantum state is almost identical to the density matrices obtained from the experimental and RRPAE KRAKEN reconstructions (a detailed comparison can be found in Supplementary Discussion 1). We quantify the agreement between the amplitudes of the experimental and the XUV-only RRPAE density matrices, ?exp and ρ1, by evaluating their mutual fidelity41, ?(?exp,?1)=tr[(?11/2?exp?11/2)1/2]=0.98, where r = ∣ρ∣. This result demonstrates that our protocol accurately measures the quantum state of the photoelectron emitted by the XUV pulse, in agreement with previous theoretical work35.
QST of a mixed photoelectronic state
We now present measurements of the quantum state of photoelectrons emitted from argon atoms excited at the same photon energy. Similar to our measurements in helium, a series of seven spectrograms, one for each value of δω, is acquired while keeping all other experimental parameters unchanged. Contrary to helium, in the case of argon, the spin–orbit interaction splits the ionic ground state, leading to two possible final states, 3p5 2P3/2 and 3p5 2P1/2. As a result, and as schematically shown in Fig. 4a, the photoelectron spectrum is composed of two photoelectron peaks shifted in energy. On the basis of our experimental results, we obtain a spin–orbit separation Δ?SO ≈ 173 ± 9 meV (Extended Data Fig. 4), in excellent agreement with spectroscopic data (Δ?SO ≈ 177 meV)42. Figure 4b shows the the amplitude of the photoelectron density matrix reconstructed from the experimental data (the density matrix obtained before the Bayesian estimation is shown in Supplementary Fig. 5 and discussed in Supplementary Discussion 4). Similarly to our helium measurements, the finite spectrometer resolution is accounted for in the reconstruction. Compared with the quantum state measured in helium, in the case of argon, the density matrix exhibits a strong elongation along the diagonal, in agreement with RRPAE KRAKEN simulations (Extended Data Fig. 5). This indicates a loss of coherence between continuum states with large energy separation as discussed in Supplementary Discussion 5 and shown in Supplementary Fig. 6. The phases of the density matrices in helium and argon are shown in Supplementary Fig. 7 and discussed in Supplementary Discussion 6.
Fig. 4: Effect of the spin–orbit interaction on the photoelectron quantum state in argon.
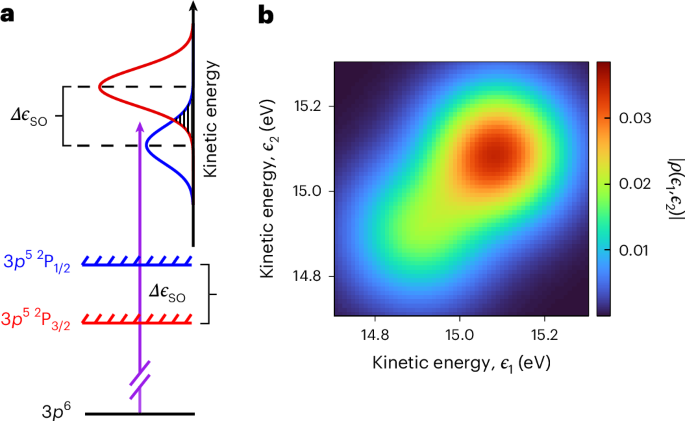
a, A schematic representation of the ionization process. Absorption of an XUV photon promotes an electron from the ground state of a neutral argon atom (3p6) to the continuum, ionizing the atom. The spin–orbit interaction splits the ionic ground state into two mutually orthogonal ionic states, 3p 52P3/2 (red) and 3p 52P1/2 (blue), separated in energy by Δ?so. Due to the conservation of energy, the resulting photoelectron spectrum is composed of two peaks, shown in red and blue, associated to the 2P3/2 and 2P1/2 states, respectively, and spaced in energy by Δ?so. The shaded area indicates the spectral region where the two peaks overlap. b, Experimentally reconstructed quantum state of a photoelectron emitted from an argon atom.
The degree of coherence of the photoelectron quantum state can be quantified by calculating its purity ?=tr(?2), with γ = 1 corresponding to a fully coherent state. Table 1 presents the purity of the reconstructed photoelectron density matrices in helium and argon, and compares it with the purity predicted by RRPAE calculations for single-photon ionization, γ1, and for the KRAKEN scheme, γ2. In helium, where the spin–orbit interaction is absent, the purity is close to unity, ?exp=0.94±0.06, demonstrating a nearly perfectly pure coherent state, as well as practically no experimental decoherence besides that induced by the spectrometer response function. The theoretical calculations show that the purity of the photoelectron created by absorption of an XUV photon and that reconstructed using the KRAKEN protocol are the same. In the case of argon, the purity of the experimentally reconstructed photoelectron quantum state is reduced, ?exp=0.65±0.04. RRPAE simulations predict a purity of γ1 = 0.61 in the case of single-photon ionization and γ2 = 0.66 for the density matrix obtained using the KRAKEN scheme, in remarkable agreement with the experiment. The small discrepancy between the purity in single-photon ionization and that obtained with KRAKEN is due to the fact that absorption of an IR photon between the intermediate and final continuum states is more likely for a photoelectron associated to the 3p5 2P3/2 ionic state, as discussed in Supplementary Discussion 1.1. The results in Table 1 show that the difference in purity between the photoelectron quantum states experimentally retrieved in helium and argon, is larger than four times its standard deviation, Δγ = γHe − γAr = 0.29 ± 0.07. Note that the purity obtained from the reconstructed photoelectronic quantum state slightly depends on the model of the Bayesian estimation; however, the values obtained from different models agree within their error bars (Supplementary Discussion 7 and Supplementary Figs. 8 and 9).
Table 1 Experimentally and theoretically extracted purity of the reduced photoelectron quantum state for helium and argon
It is interesting to compare our results with ref. 30, where the mixed-FROG technique was used to measure the quantum state of photoelectrons emitted from neon atoms following absorption of an XUV attosecond pulse train, with a total bandwidth much larger than in the present work. The purity of the photoelectron quantum state was measured to be γ = 0.11 due to experimental decoherence originating from the limited spectral resolution and temporal jitter. As a result, the effect of ion–photoelectron entanglement, which is also present in neon atoms, was not observed. In our study, the slow beating frequency of the interference signal combined with the high spectrometer resolution and the inclusion of the spectrometer response in the Bayesian estimation algorithm allowed us to mitigate experimental decoherence and to observe the effect of ion–photoelectron entanglement in argon by comparing with the measurements in helium. A detailed comparison between the two techniques, as well as the effect of other possible sources of experimental decoherence can be found in the Supplementary Discussions 8 and 9.
The bipartite ion + photoelectron system can be considered to be fully coherent because, owing to the nature of the generation process, the ionizing XUV field is coherent. Additionally, the timescale involved in the preparation and characterization of the photoelectron quantum state is in the 100 fs range, which is much shorter than the typical timescale for interactions with the environment. The state of the ion + photoelectron system in argon is therefore given by the equation35
|Ψ⟩=13|?1/2⟩⊗|?1/2⟩+23|?3/2⟩⊗|?3/2⟩, (2)
where the subscript j = {1/2, 3/2} refers to the ionic angular momentum, |??⟩ is the ionic wavefunction, with 〈?j∣?k〉 = δj,k, and |??⟩ is the photoelectronic wavefunction. The photoelectronic states, |?1/2⟩ and |?3/2⟩, corresponding to mutually orthogonal ionic states are distinct since they are centred at different energies (Fig. 4a). Accordingly, the ion and the photoelectron are, to some degree, entangled35. Consequently, by interrogating the photoelectron alone, the ion + photoelectron entanglement leads to mixedness of the reduced density matrix of the photoelectron, that is, a purity smaller than 1 (Supplementary Discussion 10). The exact value of the photoelectron purity depends on the spectral width, σXUV, of the ionizing radiation35. The lowest purity (γ ≈ 0.56) is reached when σXUV ? Δ?SO. By contrast, when σXUV ? Δ?SO, the photoelectron peaks associated to the different ionic states partially overlap (Fig. 4a, dashed region), leading to an increase of the photoelectron purity. As presented in Supplementary Discussion 10, the greater the overlap between the two photoelectron peaks, the larger the photoelectron purity. In the limit σXUV ? Δ?SO, the photoelectron quantum state is pure. In our measurements, σXUV ≈ 140 meV, which is comparable to the spin–orbit splitting (Δ?SO ≈ 177 meV). In principle, integration over all photoelectron emission angles can also affect the photoelectron purity. However, since we consider nonresonant photoionization over a relatively small energy range, the angular and radial (energy) degrees of freedom are not entangled and this operation does not affect the purity of the reduced quantum state24.
Pioneering experiments already identified fingerprints of entanglement in photoionization, whether it is between the photoelectron and the ion29 (also see discussion in ref. 43), the angular and radial degrees of freedom of the photoelectron24, two photoelectrons in single-photon double ionization44 or fragments in dissociative molecular photoionization45. A crucial advantage of our present method is that, by giving access to the photoelectron’s reduced density matrix ρ, we are able to quantify the degree of entanglement between the involved degrees of freedom, provided that the ion + photoelectron quantum system can be described as a pure bipartite state. Since the ionic core of argon lives in an effectively two-dimensional space, the joint state of the core and the photoelectron has maximally two nonvanishing Schmidt coefficients, and their entanglement can thus be measured by the concurrence ?=2[1−tr(?2)] (refs. 35,43). Note that C is a basis independent quantity, and ranges from C = 0, for a separable state of ion and photoelectron, to C = 1, for a maximally entangled state of both degrees of freedom. In argon, we obtain a concurrence of ?exp=0.83±0.02, slightly below the theoretical prediction for single-photon ionization (Ctheo = 0.88). The two nonvanishing Schmidt coefficients obtained from the experiment are {0.78, 0.22}, while one-photon RRPAE calculations yield {0.73, 0.27} and KRAKEN RRPAE calculations give {0.76, 0.24}.
In summary, we performed photoelectron QST in helium and argon atoms. Our results show that, while in helium the photoelectron’s state is well described by a pure state, in argon it is a statistical mixture of states associated to different ionic states. Assuming that the ion and photoelectron form a closed system, our method allowed us to quantify the influence of ion + electron entanglement in argon on the purity of the photoelectronic quantum state. The demonstrated method can be generalized to angle-resolved measurements as well as double ionization46, and it can be applied to more complex systems such as molecules, where the measurement of the photoelectron density matrix can provide information on the electronic and nuclear dynamics in the ion17,29,47,48, complementing existing photoelectron spectroscopy methods. Applied to the condensed phase, our technique could provide information on the decoherence mechanisms due to interactions with the environment49,50,51, possibly with spatial resolution using electron microscopy34. Finally, our QST protocol could provide a new way to investigate quantum optical effects in high-order harmonic generation (for example, squeezing), complementary to the approaches of refs. 52,53,54,55,56,57.
Methods
Experimental setup
The measurements were performed using a 3 kHz Ti:Sapphire laser system producing 25 fs (IR) pulses with an energy of 5 mJ and a central wavelength of 800 nm. The pulses were sent into an actively stabilized Mach–Zehnder interferometer, where they were split in two arms, with 40% of the incoming energy being reflected towards the pump arm and 60% being transmitted to the probe arm. The pulses in the pump arm were focused into a pulsed argon gas cell to generate high-order harmonics of the driving laser field. A combination of Ge and Al filters was used to block the XUV radiation above harmonic 19, which had a full width at half maximum of approximately 140 meV.
The probe arm of the interferometer was composed of a 4f shaper and a delay stage. Two slits were inserted in the Fourier plane of the 4f shaper, transmitting two spectral components, each with a spectral width of approximately 8 nm, and blocking all other wavelengths, thus producing a bichromatic probe field58. During the experiment, one of the slits was fixed, centred at 770 nm, while the second slit was placed on a translation stage allowing us to tune the wavelength of the second spectral component from 790 nm to 840 nm. The spectrogram with only one slit was acquired using only the slit at 770 nm and blocking the rest of the radiation. For each slit configuration, the corresponding IR spectrum was measured (Extended Data Fig. 1).
The XUV pump pulse and the spectrally shaped IR pulse were recombined using a hollow mirror and focused in an effusive atomic gas jet using a gold-coated toroidal mirror. The IR intensity at focus is estimated to be on the order of 1011 W cm−2. The emitted photoelectrons were measured using a 2-m-long MBES. A retardation voltage of 12.4 V for argon and 3.7 V for helium was applied at the entrance of the flight tube to slow down the photoelectrons, improving the spectral resolution of the spectrometer. The voltage was such that we only measured electrons corresponding to absorption of harmonic 19 and the two-photon electron signal corresponding to absorption of harmonic 19 and absorption of a bichromatic IR photon.
Measurement of the response function of the MBES
To characterize the spectral response of the MBES, we performed additional measurements in helium, where we tuned the central wavelength of harmonic 15 to excite the 1s3p resonance below threshold and we ionized the atom using a narrowband (10 nm at full width at half maximum) IR pulse. Due to the narrow spectral width of the 1s3p state and of the ionizing IR pulse, the spectral profile of the measured photoelectron peak was dominated by the spectral response of the MBES. A retardation voltage was applied at the entrance of the MBES flight tube to tune the effective kinetic energy of the photoelectron, allowing us to measure the response function for photoelectrons as a function of kinetic energy. Extended Data Fig. 2 shows the spectrum measured for photoelectrons with a kinetic energy of approximately 2 eV, which corresponds approximately to that of the photoelectron in the KRAKEN measurements.
Calculations based on the relativistic random phase approximation with exchange
The theoretical calculations were based on the RRPAE40. The reduced density matrix representing the quantum state of the photoelectron after absorption of the XUV pulse, ρ1, was calculated according to
?1(?1,?2)=∑?,?[?g→?1?,??XUV(?1−?g?)]∗?g→?2?,??XUV(?2,?g?), (3)
where EXUV(?) is the XUV spectral envelope, ?→??,? are the one-photon matrix elements from the ground state to a continuum state with energy ?, and * denotes the complex conjugate. The parent ion and the one-photon electron quantum numbers (spin and angular momentum) are denoted by the labels I and α, respectively, while ?g? is the ionization energy associated with the parent ion I. The sum over I and α results in an incoherent addition of transition amplitudes corresponding to different parent ions and ionization channels (due to angular and spin integration). The resulting density matrix is shown in Fig. 3d.
Analogously, the density matrices reconstructed with KRAKEN, ρ(?1, ?2), were calculated according to
?(?1,?2)∝∑?,?[∑??g→?1→?f?,?,??XUV(?1−?g?)]∗[∑?′?g→?2→?f?,?′,??XUV(?2−?g?)], (4)
where?g→?→?f are the two-photon matrix elements, ?f denotes the final energy after absorption of both XUV and IR photons, and β corresponds to the electron quantum numbers in the final state. The final energy ?f is such that ?f = ?1 + ?ω1 = ?2 + ?ω2. Here, two-photon transition amplitudes associated with the same parent ion I and final state β, but different intermediate states α, are summed coherently. By contrast, transition amplitudes to different final states and transition amplitudes associated with different parent ions are summed incoherently. The resulting density matrix is shown in Fig. 3c.
Data availability
The data supporting the findings are available at the Swedish National Data Service59. Source data are provided with this paper.